Dieser Inhalt ist in der von Ihnen ausgewählten Sprache nicht verfügbar.
Managing overcloud observability
Tracking physical and virtual resources, and collecting metrics
Abstract
Providing feedback on Red Hat documentation
We appreciate your input on our documentation. Tell us how we can make it better.
Providing documentation feedback in Jira
Use the Create Issue form to provide feedback on the documentation for Red Hat OpenStack Services on OpenShift (RHOSO) or earlier releases of {osp_long} ({osp_acro}). When you create an issue for RHOSO or {osp_acro} documents, the issue is recorded in the RHOSO Jira project, where you can track the progress of your feedback.
To complete the Create Issue form, ensure that you are logged in to Jira. If you do not have a Red Hat Jira account, you can create an account at https://issues.redhat.com.
- Click the following link to open a Create Issue page: Create Issue
- Complete the Summary and Description fields. In the Description field, include the documentation URL, chapter or section number, and a detailed description of the issue. Do not modify any other fields in the form.
- Click Create.
Chapter 1. Introduction to operational measurements
You can use observability components such as ceilometer, collectd, and the logging service to collect data from your Red Hat OpenStack Platform (RHOSP) environment. You can store the data that you collect in Gnocchi for the autoscaling use case or you can use metrics_qdr to forward the data to Service Telemetry Framework(STF).
For more information about autoscaling, see Auto Scaling for Instances
For more information about STF, see Service Telemetry Framework 1.5
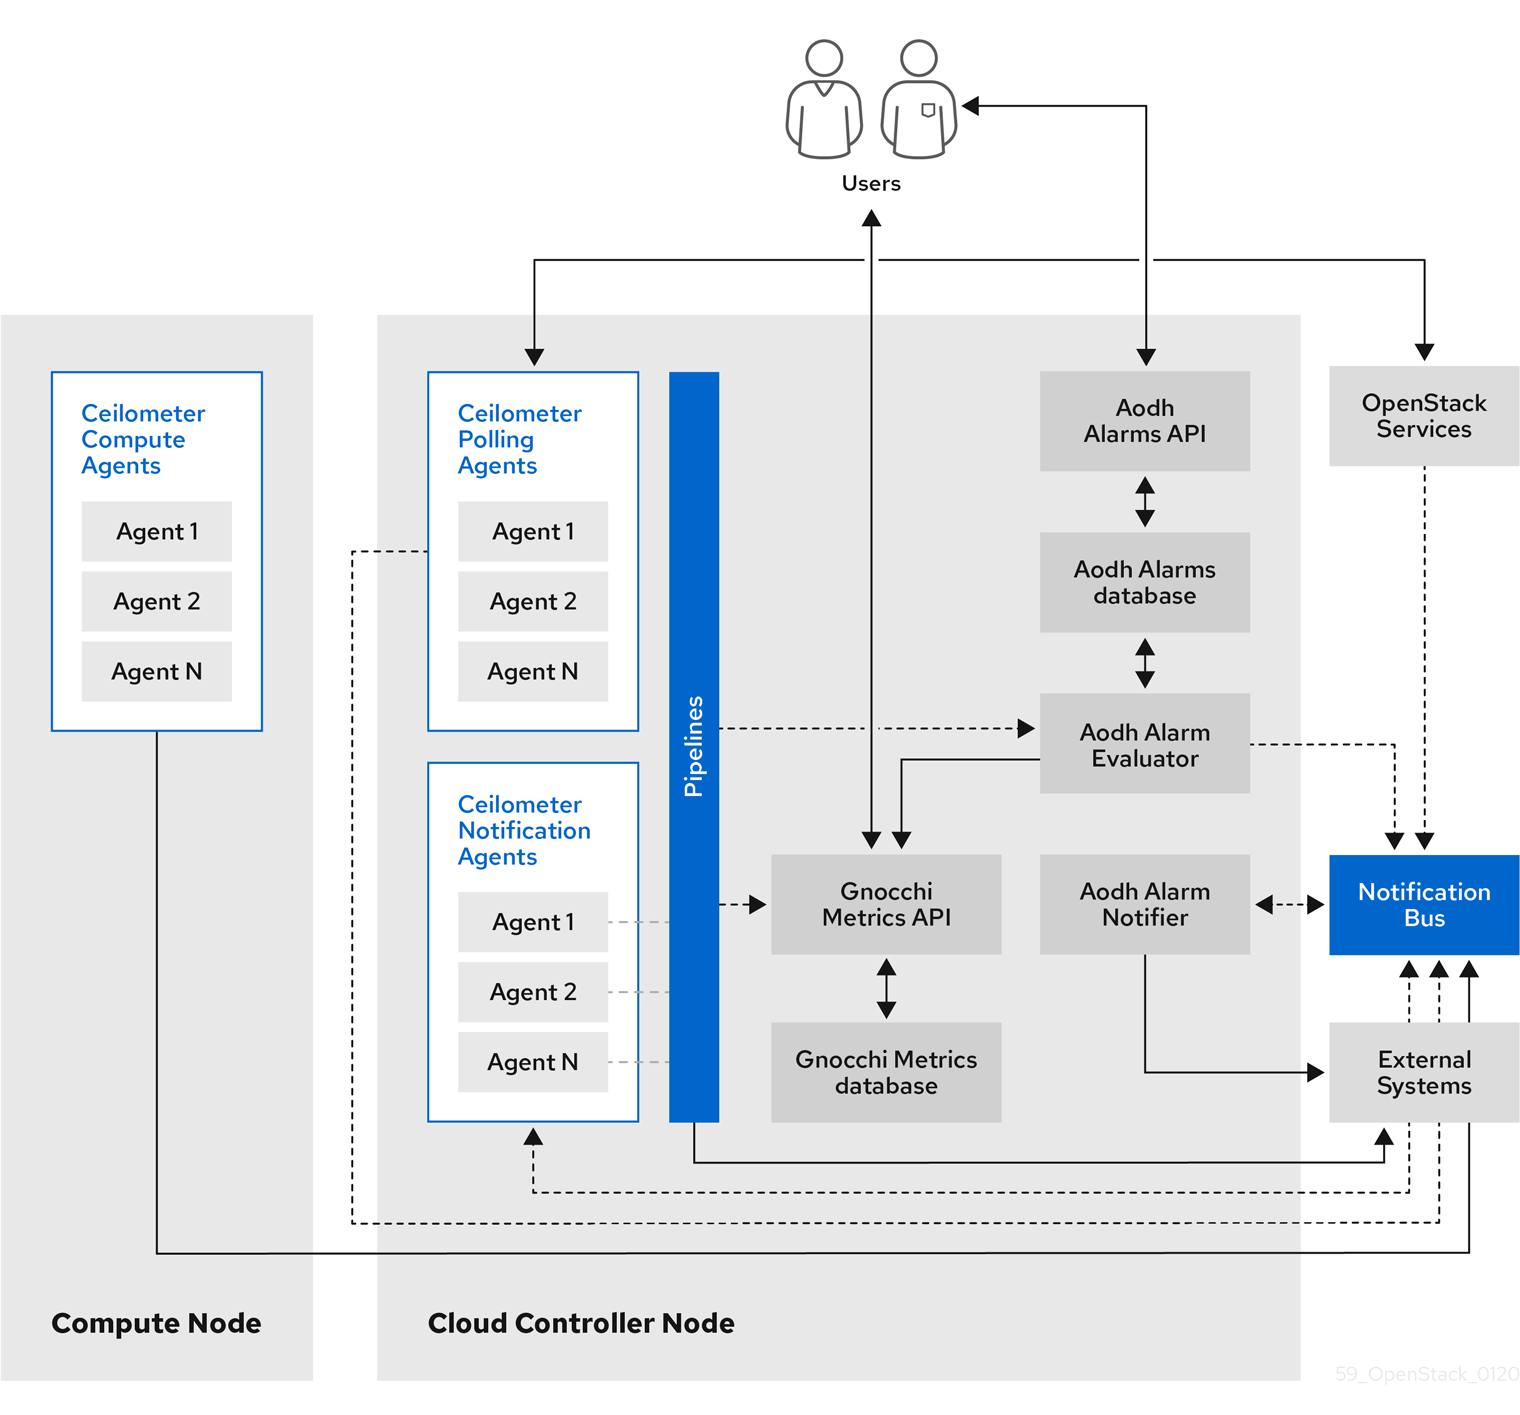
1.1. Observability architecture
Red Hat OpenStack Platform (RHOSP) Observability provides user-level usage data for OpenStack-based clouds. You can configure observability components to collect data from notifications sent by existing RHOSP components, such as Compute usage events, or by polling RHOSP infrastructure resources, such as libvirt. Ceilometer publishes collected data to various targets such as data stores and message queues, including Service Telemetry Framework(STF).
Observability consists of the following components:
- Data collection: Observability uses Ceilometer to gather metric and event data. For more information, see Section 1.2.1, “Ceilometer”.
- Storage: Observability stores metric data in Gnocchi. For more information, see Section 1.3, “Storage with Gnocchi”.
- Alarm service: Observability uses the Alarming service (Aodh) to trigger actions based on defined rules against metric or event data collected by Ceilometer.
After you collect the data, you can use a third-party tool to display and analyze metric data, and you can use the Alarming service to configure alarms for events.
Figure 1.1. Observability architecture
1.1.1. Support status of monitoring components
Use this table to view the support status of monitoring components in Red Hat OpenStack Platform (RHOSP).
| Component | Fully supported since | Deprecated in | Removed since | Note |
|---|---|---|---|---|
| Aodh | RHOSP 9 | RHOSP 15 | Supported for the autoscaling use case. | |
| Ceilometer | RHOSP 4 | Supported for collection of metrics and events for RHOSP in the autoscaling and Service Telemetry Framework (STF) use cases. | ||
| Collectd | RHOSP 11 | RHOSP 17.1 | Supported for collection of infrastructure metrics for STF. | |
| Gnocchi | RHOSP 9 | RHOSP 15 | Supported for storage of metrics for the autoscaling use case. | |
| Panko | RHOSP 11 | RHOSP 12, not installed by default since RHOSP 14 | RHOSP 17.0 | |
| QDR | RHOSP 13 | RHOSP 17.1 | Supported for transmission of metrics and events data from RHOSP to STF. |
1.2. Data collection in Red Hat OpenStack Platform
Red Hat OpenStack Platform (RHOSP) supports two types of data collection:
- Ceilometer for the RHOSP component-level monitoring. For more information, see Section 1.2.1, “Ceilometer”.
- collectd for infrastructure monitoring. For more information, see Section 1.2.2, “collectd”.
1.2.1. Ceilometer
Ceilometer is the default data collection component of Red Hat OpenStack Platform (RHOSP) that provides the ability to normalize and transform data across all of the current RHOSP core components. Ceilometer collects metering and event data relating to RHOSP services.
The Ceilometer service uses three agents to collect data from Red Hat OpenStack Platform (RHOSP) components:
-
A compute agent (ceilometer-agent-compute): Runs on each Compute node and polls for resource utilization statistics. This agent is the same as polling agent
ceilometer-pollingrunning with parameter--polling namespace-compute. -
A central agent (ceilometer-agent-central): Runs on a central management server to poll for resource utilization statistics for resources that are not tied to instances or Compute nodes. You can start multiple agents to scale services horizontally. This is the same as the polling agent
ceilometer-pollingthat operates with the parameter--polling namespace-central. - A notification agent (ceilometer-agent-notification): Runs on a central management server and consumes messages from the message queues to build event and metering data. Data publishes to defined targets. Gnocchi is the default target. These services use the RHOSP notification bus to communicate.
The Ceilometer agents use publishers to send data to the corresponding end points, for example Gnocchi or AMQP version 1 (QDR).
1.2.2. collectd
Collectd is another data collecting agent that you can use to provide infrastructure metrics. It repeatedly pulls data from configured sources. You can forward metrics to Service Telemetry Framework (STF) to store and visualize the data.
1.3. Storage with Gnocchi
Gnocchi is an open-source time-series database. You can use gnocchi to store and provide access to metrics and resources to operators and users. Gnocchi uses an archive policy to define which aggregations to compute and how many aggregates to retain; and an indexer driver to store the index of all resources, archive policies, and metrics.
The use of Gnocchi in Red Hat OpenStack Platform (RHOSP) is supported for the autoscaling use-case. For more information about autoscaling, see Auto Scaling for Instances
1.3.1. Archive policies: Storing both short and long-term data in a time-series database
An archive policy defines which aggregations to compute and how many aggregates to retain. Gnocchi supports different aggregation methods, such as minimum, maximum, average, Nth percentile, and standard deviation. These aggregations are computed over a period of time called granularity and retained for a specific timespan.
The archive policy defines how the metrics are aggregated and for how long they are stored. Each archive policy is defined as the number of points over a timespan.
For example, if your archive policy defines a policy of 10 points with a granularity of 1 second, the time-series archive keeps up to 10 seconds, each representing an aggregation over 1 second. This means that the time series, at a maximum, retains 10 seconds of data between the more recent point and the older point.
The archive policy also defines which aggregate methods are used. The default is set to the parameter default_aggregation_methods whose values by default are set to mean, min, max. sum, std, count. So, depending on the use case, the archive policy and the granularity vary.
Additional resources
- For more information about archive policies, see Section 2.3, “Planning and managing archive policies”.
1.3.2. Indexer driver
The indexer is responsible for storing the index of all resources, archive policies, and metrics along with their definitions, types, and properties. It is also responsible for linking resources with metrics. Red Hat OpenStack Platform director installs the indexer driver by default. You need a database to index all the resources and metrics that Gnocchi handles. The supported driver is MySQL.
1.3.3. Gnocchi terminology
This table contains definitions of the commonly used terms for Gnocchi features.
| Term | Definition |
|---|---|
| Aggregation method | A function used to aggregate multiple measures into an aggregate. For example, the min aggregation method aggregates the values of different measures to the minimum value of all the measures in the time range. |
| Aggregate | A data point tuple generated from several measures according to the archive policy. An aggregate is composed of a timestamp and a value. |
| Archive policy | An aggregate storage policy attached to a metric. An archive policy determines how long aggregates are kept in a metric and how aggregates are aggregated (the aggregation method). |
| Granularity | The time between two aggregates in an aggregated time series of a metric. |
| Measure | An incoming data point tuple sent to the Time series database by the API. A measure is composed of a timestamp and a value. |
| Metric | An entity storing aggregates identified by an UUID. A metric can be attached to a resource using a name. How a metric stores its aggregates is defined by the archive policy to which the metric is associated. |
| Resource | An entity representing anything in your infrastructure that you associate a metric with. A resource is identified by a unique ID and can contain attributes. |
| Time series | A list of aggregates ordered by time. |
| Timespan | The time period for which a metric keeps its aggregates. It is used in the context of archive policy. |
Chapter 2. Planning for operational measurements
You can use Ceilometer or collectd to collect telemetry data for autoscaling or Service Telemetry Framework (STF).
2.1. Collectd measurements
The following are the default collectd measurements:
- cpu
- disk free
- disk usage
- hugepages
- interface
- load
- memory
- unixsock
- uptime
2.2. Planning for data storage
Gnocchi stores a collection of data points, where each data point is an aggregate. The storage format is compressed using different techniques. As a result, to calculate the size of a time-series database, you must estimate the size based on the worst-case scenario.
The use of Red Hat OpenStack Platform (RHOSP) Object Storage (swift) for time series database (Gnocchi) storage is only supported for small and non-production environments.
Procedure
Calculate the number of data points:
number of points = timespan / granularity
For example, if you want to retain a year of data with one-minute resolution, use the formula:
number of data points = (365 days X 24 hours X 60 minutes) / 1 minute number of data points = 525600
Calculate the size of the time-series database:
size in bytes = number of data points X 8 bytes
If you apply this formula to the example, the result is 4.1 MB:
size in bytes = 525600 points X 8 bytes = 4204800 bytes = 4.1 MB
This value is an estimated storage requirement for a single aggregated time-series database. If your archive policy uses multiple aggregation methods (min, max, mean, sum, std, count), multiply this value by the number of aggregation methods you use.
2.3. Planning and managing archive policies
You can use an archive policy to configure how you aggregate the metrics and for how long you store the metrics in the time-series database. An archive policy is defined as the number of points over a timespan.
If your archive policy defines a policy of 10 points with a granularity of 1 second, the time series archive keeps up to 10 seconds, each representing an aggregation over 1 second. This means that the time series retains, at a maximum, 10 seconds of data between the more recent point and the older point. The archive policy also defines the aggregate method to use. The default is set to the parameter default_aggregation_methods, where the default values are set to mean, min, max. sum, std, count. So, depending on the use case, the archive policy and the granularity can vary.
To plan an archive policy, ensure that you are familiar with the following concepts:
- Metrics. For more information, see Section 2.3.1, “Metrics”.
- Measures. For more information, see Section 2.3.2, “Creating custom measures”.
2.3.1. Metrics
Gnocchi provides an object type called metric. A metric is anything that you can measure, for example, the CPU usage of a server, the temperature of a room, or the number of bytes sent by a network interface. A metric has the following properties:
- A UUID to identify it
- A name
- The archive policy used to store and aggregate the measures
Additional resources
- For terminology definitions, see Gnocchi Metric-as-a-Service terminology.
2.3.2. Creating custom measures
A measure is an incoming tuple that the API sends to Gnocchi. It consists of a timestamp and a value. You can create your own custom measures.
Procedure
Create a custom measure:
openstack metric measures add -m <MEASURE1> -m <MEASURE2> .. -r <RESOURCE_NAME> <METRIC_NAME>
$ openstack metric measures add -m <MEASURE1> -m <MEASURE2> .. -r <RESOURCE_NAME> <METRIC_NAME>Copy to Clipboard Copied! Toggle word wrap Toggle overflow
2.3.3. Verifying the metric status
You can use the openstack metric command to verify a successful deployment.
Procedure
Verify the deployment:
Copy to Clipboard Copied! Toggle word wrap Toggle overflow
If there are no error messages, your deployment is successful.
2.3.4. Creating an archive policy
You can create an archive policy to define how you aggregate the metrics and for how long you store the metrics in the time-series database.
Procedure
Create an archive policy. Replace <archive-policy-name> with the name of the policy and replace <aggregation-method> with the method of aggregation.
openstack metric archive policy create <archive-policy-name> --definition <definition> \
--aggregation-method <aggregation-method>
$ openstack metric archive policy create <archive-policy-name> --definition <definition> \
--aggregation-method <aggregation-method>
Copy to Clipboard Copied! Toggle word wrap Toggle overflow Note<definition> is the policy definition. Separate multiple attributes with a comma (,). Separate the name and value of the archive policy definition with a colon (:).
2.3.5. Viewing an archive policy
Use the following steps to examine your archive policies.
Procedure
List the archive policies.
openstack metric archive policy list
$ openstack metric archive policy listCopy to Clipboard Copied! Toggle word wrap Toggle overflow View the details of an archive policy:
openstack metric archive-policy show <archive-policy-name>
# openstack metric archive-policy show <archive-policy-name>Copy to Clipboard Copied! Toggle word wrap Toggle overflow
2.3.6. Deleting an archive policy
Use the following step if you want to delete an archive policy.
Procedure
Delete the archive policy. Replace <archive-policy-name> with the name of the policy that you want to delete.
openstack metric archive policy delete <archive-policy-name>
$ openstack metric archive policy delete <archive-policy-name>Copy to Clipboard Copied! Toggle word wrap Toggle overflow
Verification
Check that the archive policy that you deleted is absent from the list of archive policies.
openstack metric archive policy list
$ openstack metric archive policy listCopy to Clipboard Copied! Toggle word wrap Toggle overflow
2.3.7. Creating an archive policy rule
You can use an archive policy rule to configure the mapping between a metric and an archive policy.
Procedure
Create an archive policy rule. Replace <rule-name> with the name of the rule and replace <archive-policy-name> with the name of the archive policy:
openstack metric archive-policy-rule create <rule-name> /
--archive-policy-name  <archive-policy-name>
$ openstack metric archive-policy-rule create <rule-name> /
--archive-policy-name  <archive-policy-name>
Copy to Clipboard Copied! Toggle word wrap Toggle overflow
Chapter 3. Installing and configuring the logs service
You can use log messages for troubleshooting and monitoring system events. The log collection agent Rsyslog collects logs on the client side and sends these log records to a remote Elasticsearch storage system separate from your supported Red Hat OpenStack Platform (RHOSP) environment, for example.
3.1. The log system architecture and components
Monitoring tools use a client-server model, with the client deployed onto the Red Hat OpenStack Platform (RHOSP) overcloud nodes. The Rsyslog service provides client-side logging.
Examples of logs in RHOSP include the following:
- Operating system logs, such as syslog and audit log files.
- Logs from the infrastructure components, such as RabbitMQ and MariaDB.
- Logs from the RHOSP services, such as Identity (keystone) and Compute (nova).
The log files record actions, errors, warnings, and other events. In a distributed environment, collecting the various logs in one location can help you with debugging and administration.
RHOSP director does not deploy the server-side components for logging.
3.2. Enabling logging with Elasticsearch
Elasticsearch is a server-side database that you can use to store logs. To enable the logs service for Elasticsearch, you must authenticate the logs service for Elasticsearch.
The Rsyslog service only uses Elasticsearch as a data store for logging.
Prerequisites
- You have deployed Elasticsearch.
- You have the username, password, and URL of the server.
- To use ElasticSearch 8, your Red Hat OpenStack Platform (RHOSP) deployment must be version 17.1.4 or newer.
Procedure
Create a file in your custom templates directory, such as
$HOME/custom_templates/logging-connector.yaml, that you can edit to configure theRsyslogElasticsearchSettingparameters for your environment, such as in the following example:Copy to Clipboard Copied! Toggle word wrap Toggle overflow - 1
- (Optional) Include the line
esversion.major: "8"to use ElasticSearch 8.
Add the file paths of the
logging-environment-rsyslog.yamland thelogging-connector.yamlenvironment files to theovercloud deploymentcommand:openstack overcloud deploy \ <overcloud_environment_files> \ -e <filepath>/logging-environment-rsyslog.yaml -e $HOME/custom_templates/logging-connector.yaml
$ openstack overcloud deploy \
<overcloud_environment_files> \
-e <filepath>/logging-environment-rsyslog.yaml
-e $HOME/custom_templates/logging-connector.yaml
Copy to Clipboard Copied! Toggle word wrap Toggle overflow -
Replace
<overcloud_environment_files>with the list of environment files in your existing deployment. -
Replace
<filepath>with the file path to yourlogging-environment-rsyslog.yamlfile, for example/usr/share/openstack-tripleo-heat-templates/environments/.
-
Replace
3.3. Configurable logging parameters
This table contains descriptions of logging parameters that you use to configure logging features in Red Hat OpenStack Platform (RHOSP). You can find these parameters in the /usr/share/openstack-tripleo-heat-templates/deployment/logging/rsyslog-container-puppet.yaml file.
| Parameter | Description |
|---|---|
|
|
Configuration for |
|
| Contains the content of the CA cert for the CA that issued the Elasticsearch server cert. |
|
| Contains the content of the client cert for doing client cert authorization against Elasticsearch. |
|
|
Contains the content of the private key corresponding to the cert |
|
| Prompts rsyslog to reopen the input file when the file size on disk is less than the current offset in memory. |
|
| Sets the limit for the size of the log message. |
3.4. Overriding the default path for a log file
If you modify the default containers to include the path to the service log file, you must also modify the default log file path. Every composable service has a <service_name>LoggingSource parameter. For example, for the nova-compute service, the parameter is NovaComputeLoggingSource.
Procedure
To override the default path for the nova-compute service, add the path to the
NovaComputeLoggingSourceparameter in your configuration file:NovaComputeLoggingSource: tag: openstack.nova.compute file: <filepath>/nova-compute.logNovaComputeLoggingSource: tag: openstack.nova.compute file: <filepath>/nova-compute.logCopy to Clipboard Copied! Toggle word wrap Toggle overflow -
Replace
<filepath>with the file path to yournova-compute.logfile -
Ensure that you define the values of the
tagandfileparameters for the service. You can use the default values for the other parameters.
-
Replace
You can modify the format for a specific service. The format passes to the Rsyslog configuration. The following example shows the basic syntax:
<service_name>LoggingSource:
    tag: <service_name>.tag
    path: <service_name>.path
    format: <service_name>.format
<service_name>LoggingSource: tag: <service_name>.tag path: <service_name>.path format: <service_name>.formatCopy to Clipboard Copied! Toggle word wrap Toggle overflow The following example shows a more complex transformation:
Copy to Clipboard Copied! Toggle word wrap Toggle overflow If you enabled centralized logging, you can use the following definition in a custom template to forward additional log files, for example, /var/log/messages:
Copy to Clipboard Copied! Toggle word wrap Toggle overflow
3.5. Modifying the format of a log record
You can modify the format of the start of the log record for a specific service. This passes directly to the Rsyslog configuration.
The default format for the Red Hat OpenStack Platform (RHOSP) log record is ('^[0-9]{4}-[0-9]{2}-[0-9]{2} [0-9]{2}:[0-9]{2}:[0-9]{2}(.[0-9]+ [0-9]+)? (DEBUG|INFO|WARNING|ERROR) ').
Procedure
To add a different regular expression for parsing the start of log records, add
startmsg.regexto the configuration:NovaComputeLoggingSource: tag: openstack.nova.compute file: /some/other/path/nova-compute.log startmsg.regex: `^[0-9]{4}-[0-9]{2}-[0-9]{2} [0-9]{2}:[0-9]{2}:[0-9]{2}(.[0-9]+ \\+[0-9]+)? [A-Z]+ \\([a-z]+\\)`NovaComputeLoggingSource: tag: openstack.nova.compute file: /some/other/path/nova-compute.log startmsg.regex: `^[0-9]{4}-[0-9]{2}-[0-9]{2} [0-9]{2}:[0-9]{2}:[0-9]{2}(.[0-9]+ \\+[0-9]+)? [A-Z]+ \\([a-z]+\\)`Copy to Clipboard Copied! Toggle word wrap Toggle overflow
3.6. Verifying the connection between Rsyslog and Elasticsearch
On the client side, you can test and verify the communication between Rsyslog and Elasticsearch.
Procedure
-
Navigate to the Elasticsearch connection log file, which is
/var/log/rsyslog/omelasticsearch.login the Rsyslog container or/var/log/containers/rsyslog/omelasticsearch.logon the host. If this log file does not exist or if the log file exists but does not contain logs, there is no connection problem. If the log file is present and contains logs, Rsyslog has not connected successfully.
To test the connection from the server side, view the Elasticsearch logs for connection issues.
3.7. Tracebacks
If you are troubleshooting an issue, you can use a traceback log to diagnose the issue. In log files, tracebacks usually have several lines of information, all relating to the same issue.
Rsyslog provides a regular expression to define how a log record starts. Each log record usually starts with a timestamp and the first line of the traceback is the only line that contains this information. Rsyslog bundles the indented records with the first line and sends them as one log record.
For that behaviour configuration option startmsg.regex in <Service>LoggingSource is used. The following regular expression is the default value for all <service>LoggingSource parameters in director:
startmsg.regex='^[0-9]{4}-[0-9]{2}-[0-9]{2} [0-9]{2}:[0-9]{2}:[0-9]{2}(.[0-9]+ [0-9]+)? (DEBUG|INFO|WARNING|ERROR) '
startmsg.regex='^[0-9]{4}-[0-9]{2}-[0-9]{2} [0-9]{2}:[0-9]{2}:[0-9]{2}(.[0-9]+ [0-9]+)? (DEBUG|INFO|WARNING|ERROR) '
When this default does not match log records of your added or modified LoggingSource, you must change startmsg.regex accordingly.
3.8. Location of log files for Red Hat OpenStack Platform services
Each Red Hat OpenStack Platform (RHOSP) component has a separate logging directory containing files specific to a running service.
3.8.1. Bare Metal Provisioning (ironic) log files
| Service | Service name | Log path |
|---|---|---|
| OpenStack Ironic API | openstack-ironic-api.service | /var/log/containers/ironic/ironic-api.log |
| OpenStack Ironic Conductor | openstack-ironic-conductor.service | /var/log/containers/ironic/ironic-conductor.log |
3.8.2. Block Storage (cinder) log files
| Service | Service name | Log path |
|---|---|---|
| Block Storage API | openstack-cinder-api.service | /var/log/containers/cinder-api.log |
| Block Storage Backup | openstack-cinder-backup.service | /var/log/containers/cinder/backup.log |
| Informational messages | The cinder-manage command | /var/log/containers/cinder/cinder-manage.log |
| Block Storage Scheduler | openstack-cinder-scheduler.service | /var/log/containers/cinder/scheduler.log |
| Block Storage Volume | openstack-cinder-volume.service | /var/log/containers/cinder/volume.log |
3.8.3. Compute (nova) log files
| Service | Service name | Log path |
|---|---|---|
| OpenStack Compute API service | openstack-nova-api.service | /var/log/containers/nova/nova-api.log |
| OpenStack Compute certificate server | openstack-nova-cert.service | /var/log/containers/nova/nova-cert.log |
| OpenStack Compute service | openstack-nova-compute.service | /var/log/containers/nova/nova-compute.log |
| OpenStack Compute Conductor service | openstack-nova-conductor.service | /var/log/containers/nova/nova-conductor.log |
| OpenStack Compute VNC console authentication server | openstack-nova-consoleauth.service | /var/log/containers/nova/nova-consoleauth.log |
| Informational messages | nova-manage command | /var/log/containers/nova/nova-manage.log |
| OpenStack Compute NoVNC Proxy service | openstack-nova-novncproxy.service | /var/log/containers/nova/nova-novncproxy.log |
| OpenStack Compute Scheduler service | openstack-nova-scheduler.service | /var/log/containers/nova/nova-scheduler.log |
3.8.4. Dashboard (horizon) log files
| Service | Service name | Log path |
|---|---|---|
| Log of certain user interactions | Dashboard interface | /var/log/containers/horizon/horizon.log |
The Apache HTTP server uses additional log files for the Dashboard web interface, which you can access by using a web browser or command-line client, for example, keystone and nova. You can track Dashboard usage and diagnose faults with the following log files:
| Purpose | Log path |
|---|---|
| All processed HTTP requests | /var/log/containers/httpd/horizon_access.log |
| HTTP errors | /var/log/containers/httpd/horizon_error.log |
| Admin-role API requests | /var/log/containers/httpd/keystone_wsgi_admin_access.log |
| Admin-role API errors | /var/log/containers/httpd/keystone_wsgi_admin_error.log |
| Member-role API requests | /var/log/containers/httpd/keystone_wsgi_main_access.log |
| Member-role API errors | /var/log/containers/httpd/keystone_wsgi_main_error.log |
There is also /var/log/containers/httpd/default_error.log, which stores errors reported by other web services that are running on the same host.
3.8.5. Identity Service (keystone) log files
| Service | Service name | Log Path |
|---|---|---|
| OpenStack Identity Service | openstack-keystone.service | /var/log/containers/keystone/keystone.log |
3.8.6. Image Service (glance) log files
| Service | Service name | Log path |
|---|---|---|
| OpenStack Image Service API server | openstack-glance-api.service | /var/log/containers/glance/api.log |
| OpenStack Image Service Registry server | openstack-glance-registry.service | /var/log/containers/glance/registry.log |
3.8.7. Networking (neutron) log files
| Service | Service name | Log path |
|---|---|---|
| OpenStack Neutron DHCP Agent | neutron-dhcp-agent.service | /var/log/containers/neutron/dhcp-agent.log |
| OpenStack Networking Layer 3 Agent | neutron-l3-agent.service | /var/log/containers/neutron/l3-agent.log |
| Metadata agent service | neutron-metadata-agent.service | /var/log/containers/neutron/metadata-agent.log |
| Metadata namespace proxy | n/a | /var/log/containers/neutron/neutron-ns-metadata-proxy-UUID.log |
| Open vSwitch agent | neutron-openvswitch-agent.service | /var/log/containers/neutron/openvswitch-agent.log |
| OpenStack Networking service | neutron-server.service | /var/log/containers/neutron/server.log |
3.8.8. Object Storage (swift) log files
OpenStack Object Storage sends logs to the system logging facility only.
By default, all Object Storage log files go to /var/log/containers/swift/swift.log, using the local0, local1, and local2 syslog facilities.
The Object Storage log messages are either from REST API services or background daemons.
- The API service messages contain one line per API request. The front-end and back-end services both post messages.
- The daemon messages contain human-readable information about daemon tasks. The source identity is always at the beginning of the line.
Here is an example of a proxy message:
Apr 20 15:20:34 rhev-a24c-01 proxy-server: 127.0.0.1 127.0.0.1 20/Apr/2015/19/20/34 GET /v1/AUTH_zaitcev%3Fformat%3Djson%26marker%3Dtestcont HTTP/1.0 200 - python-swiftclient-2.1.0 AUTH_tk737d6... - 2 - txc454fa8ea4844d909820a-0055355182 - 0.0162 - - 1429557634.806570053 1429557634.822791100
Apr 20 15:20:34 rhev-a24c-01 proxy-server: 127.0.0.1 127.0.0.1 20/Apr/2015/19/20/34 GET /v1/AUTH_zaitcev%3Fformat%3Djson%26marker%3Dtestcont HTTP/1.0 200 - python-swiftclient-2.1.0 AUTH_tk737d6... - 2 - txc454fa8ea4844d909820a-0055355182 - 0.0162 - - 1429557634.806570053 1429557634.822791100Here is an example of daemon messages:
3.8.9. Orchestration (heat) log files
| Service | Service name | Log path |
|---|---|---|
| OpenStack Heat API Service | openstack-heat-api.service | /var/log/containers/heat/heat-api.log |
| OpenStack Heat Engine Service | openstack-heat-engine.service | /var/log/containers/heat/heat-engine.log |
| Orchestration service events | n/a | /var/log/containers/heat/heat-manage.log |
3.8.11. Telemetry (ceilometer) log files
| Service | Service name | Log path |
|---|---|---|
| OpenStack ceilometer notification agent | ceilometer_agent_notification | /var/log/containers/ceilometer/agent-notification.log |
| OpenStack ceilometer central agent | ceilometer_agent_central | /var/log/containers/ceilometer/central.log |
| OpenStack ceilometer collection | openstack-ceilometer-collector.service | /var/log/containers/ceilometer/collector.log |
| OpenStack ceilometer compute agent | ceilometer_agent_compute | /var/log/containers/ceilometer/compute.log |
3.8.12. Log files for supporting services
The following services are used by the core RHOSP components and have their own log directories and files.
| Service | Service name | Log path |
|---|---|---|
| Message broker (RabbitMQ) | rabbitmq-server.service |
/var/log/rabbitmq/rabbit@short_hostname.log |
| Database server (MariaDB) | mariadb.service | /var/log/mariadb/mariadb.log |
| Virtual network switch (Open vSwitch) | openvswitch-nonetwork.service |
/var/log/openvswitch/ovsdb-server.log |
3.8.13. aodh (alarming service) log files
| Service | Container name | Log path |
|---|---|---|
| Alarming API | aodh_api | /var/log/containers/httpd/aodh-api/aodh_wsgi_access.log |
| Alarm evaluator log | aodh_evaluator | /var/log/containers/aodh/aodh-evaluator.log |
| Alarm listener | aodh_listener | /var/log/containers/aodh/aodh-listener.log |
| Alarm notification | aodh_notifier | /var/log/containers/aodh/aodh-notifier.log |
3.8.14. gnocchi (metric storage) log files
| Service | Container name | Log path |
|---|---|---|
| Gnocchi API | gnocchi_api | /var/log/containers/httpd/gnocchi-api/gnocchi_wsgi_access.log |
| Gnocchi metricd | gnocchi_metricd | /var/log/containers/gnocchi/gnocchi-metricd.log |
| Gnocchi statsd | gnocchi_statsd | /var/log/containers/gnocchi/gnocchi-statsd.log |
Chapter 4. collectd plugins
You can configure multiple collectd plugins depending on your Red Hat OpenStack Platform (RHOSP) environment.
The following list of plugins shows the available heat template ExtraConfig parameters that you can set to override the default values. Each section provides the general configuration name for the ExtraConfig option. For example, if there is a collectd plugin called example_plugin, the format of the plugin title is collectd::plugin::example_plugin.
Reference the tables of available parameters for specific plugins, such as in the following example:
ExtraConfig:
  collectd::plugin::example_plugin::<parameter>: <value>
ExtraConfig:
collectd::plugin::example_plugin::<parameter>: <value>Reference the metrics tables of specific plugins for Prometheus or Grafana queries.
4.1. collectd::plugin::aggregation
You can aggregate several values into one with the aggregation plugin. Use the aggregation functions such as sum, average, min, and max to calculate metrics, for example average and total CPU statistics.
| Parameter | Type |
|---|---|
| host | String |
| plugin | String |
| plugininstance | Integer |
| agg_type | String |
| typeinstance | String |
| sethost | String |
| setplugin | String |
| setplugininstance | Integer |
| settypeinstance | String |
| groupby | Array of Strings |
| calculatesum | Boolean |
| calculatenum | Boolean |
| calculateaverage | Boolean |
| calculateminimum | Boolean |
| calculatemaximum | Boolean |
| calculatestddev | Boolean |
Example configuration:
Deploy three aggregate configurations to create the following files:
-
aggregator-calcCpuLoadAvg.conf: average CPU load for all CPU cores grouped by host and state -
aggregator-calcCpuLoadMinMax.conf: minimum and maximum CPU load groups by host and state -
aggregator-calcMemoryTotalMaxAvg.conf: maximum, average, and total for memory grouped by type
The aggregation configurations use the default cpu and memory plugin configurations.
4.2. collectd::plugin::amqp1
Use the amqp1 plugin to write values to an amqp1 message bus, for example, AMQ Interconnect.
| Parameter | Type |
|---|---|
| manage_package | Boolean |
| transport | String |
| host | String |
| port | Integer |
| user | String |
| password | String |
| address | String |
| instances | Hash |
| retry_delay | Integer |
| send_queue_limit | Integer |
| interval | Integer |
Use the send_queue_limit parameter to limit the length of the outgoing metrics queue.
If there is no AMQP1 connection, the plugin continues to queue messages to send, which can result in unbounded memory consumption. The default value is 0, which disables the outgoing metrics queue.
Increase the value of the send_queue_limit parameter if metrics are missing.
Example configuration:
4.3. collectd::plugin::apache
Use the apache plugin to collect Apache data from the mod_status plugin that is provided by the Apache web server. Each instance provided has a per-interval value specified in seconds. If you provide the timeout interval parameter for an instance, the value is in milliseconds.
| Parameter | Type |
|---|---|
| instances | Hash |
| interval | Integer |
| manage-package | Boolean |
| package_install_options | List |
| Parameter | Type |
|---|---|
| url | HTTP URL |
| user | String |
| password | String |
| verifypeer | Boolean |
| verifyhost | Boolean |
| cacert | AbsolutePath |
| sslciphers | String |
| timeout | Integer |
Example configuration:
In this example, the instance name is localhost, which connects to the Apache web server at http://10.0.0.111/mod_status?auto. You must append ?auto to the end of the URL to prevent the status page returning as a type that is incompatible with the plugin.
Additional resources
For more information about configuring the apache plugin, see apache.
4.4. collectd::plugin::battery
Use the battery plugin to report the remaining capacity, power, or voltage of laptop batteries.
| Parameter | Type |
|---|---|
| values_percentage | Boolean |
| report_degraded | Boolean |
| query_state_fs | Boolean |
| interval | Integer |
Additional resources
For more information about configuring the battery plugin, see battery.
4.5. collectd::plugin::bind
Use the bind plugin to retrieve encoded statistics about queries and responses from a DNS server, and submit those values to collectd.
| Parameter | Type |
|---|---|
| url | HTTP URL |
| memorystats | Boolean |
| opcodes | Boolean |
| parsetime | Boolean |
| qtypes | Boolean |
| resolverstats | Boolean |
| serverstats | Boolean |
| zonemaintstats | Boolean |
| views | Array |
| interval | Integer |
| Parameter | Type |
|---|---|
| name | String |
| qtypes | Boolean |
| resolverstats | Boolean |
| cacherrsets | Boolean |
| zones | List of strings |
Example configuration:
4.6. collectd::plugin::ceph
Use the ceph plugin to gather data from ceph daemons.
| Parameter | Type |
|---|---|
| daemons | Array |
| longrunavglatency | Boolean |
| convertspecialmetrictypes | Boolean |
| package_name | String |
Example configuration:
If an Object Storage Daemon (OSD) is not on every node, you must list the OSDs.
When you deploy collectd, the ceph plugin is added to the Ceph nodes. Do not add the ceph plugin on Ceph nodes to CollectdExtraPlugins because this results in a deployment failure.
Additional resources
For more information about configuring the ceph plugin, see ceph.
4.7. collectd::plugins::cgroups
Use the cgroups plugin to collect information for processes in a cgroup.
| Parameter | Type |
|---|---|
| ignore_selected | Boolean |
| interval | Integer |
| cgroups | List |
Additional resources
For more information about configuring the cgroups plugin, see cgroups.
4.8. collectd::plugin::connectivity
Use the connectivity plugin to monitor the state of network interfaces.
If no interfaces are listed, all interfaces are monitored by default.
| Parameter | Type |
|---|---|
| interfaces | Array |
Example configuration:
parameter_defaults:
    ExtraConfig:
        collectd::plugin::connectivity::interfaces:
        - eth0
        - eth1
parameter_defaults:
    ExtraConfig:
        collectd::plugin::connectivity::interfaces:
        - eth0
- eth1Additional resources
For more information about configuring the connectivity plugin, see connectivity.
4.9. collectd::plugin::conntrack
Use the conntrack plugin to track the number of entries in the Linux connection-tracking table. There are no parameters for this plugin.
4.10. collectd::plugin::contextswitch
Use the ContextSwitch plugin to collect the number of context switches that the system handles. The only parameter available is interval, which is a polling interval defined in seconds.
Additional resources
For more information about configuring the contextswitch plugin, see contextswitch.
4.11. collectd::plugin::cpu
Use the cpu plugin to monitor the time that the CPU spends in various states, for example, idle, executing user code, executing system code, waiting for IO-operations, and other states.
The cpu plugin collects jiffies, not percentage values. The value of a jiffy depends on the clock frequency of your hardware platform, and therefore is not an absolute time interval unit.
To report a percentage value, set the Boolean parameters reportbycpu and reportbystate to true, and then set the Boolean parameter valuespercentage to true.
This plugin is enabled by default.
| Name | Description | Query |
|---|---|---|
| idle | Amount of idle time |
|
| interrupt | CPU blocked by interrupts |
|
| nice | Amount of time running low priority processes |
|
| softirq | Amount of cycles spent in servicing interrupt requests |
|
| steal | The percentage of time a virtual CPU waits for a real CPU while the hypervisor is servicing another virtual processor |
|
| system | Amount of time spent on system level (kernel) |
|
| user | Jiffies that user processes use |
|
| wait | CPU waiting on outstanding I/O request |
|
| Parameter | Type | Defaults |
|---|---|---|
| reportbystate | Boolean | true |
| valuespercentage | Boolean | true |
| reportbycpu | Boolean | true |
| reportnumcpu | Boolean | false |
| reportgueststate | Boolean | false |
| subtractgueststate | Boolean | true |
| interval | Integer | 120 |
Example configuration:
parameter_defaults:
    CollectdExtraPlugins:
      - cpu
    ExtraConfig:
        collectd::plugin::cpu::reportbystate: true
parameter_defaults:
    CollectdExtraPlugins:
      - cpu
    ExtraConfig:
collectd::plugin::cpu::reportbystate: trueAdditional resources
For more information about configuring the cpu plugin, see cpu.
4.12. collectd::plugin::cpufreq
Use the cpufreq plugin to collect the current CPU frequency. There are no parameters for this plugin.
4.13. collectd::plugin::csv
Use the csv plugin to write values to a local file in CSV format.
| Parameter | Type |
|---|---|
| datadir | String |
| storerates | Boolean |
| interval | Integer |
4.14. collectd::plugin::df
Use the df plugin to collect disk space usage information for file systems.
This plugin is enabled by default.
| Name | Description | Query |
|---|---|---|
| free | Amount of free disk space |
|
| reserved | Amount of reserved disk space |
|
| used | Amount of used disk space |
|
| Parameter | Type | Defaults |
|---|---|---|
| devices | Array |
|
| fstypes | Array |
|
| ignoreselected | Boolean | true |
| mountpoints | Array |
|
| reportbydevice | Boolean | true |
| reportinodes | Boolean | true |
| reportreserved | Boolean | true |
| valuesabsolute | Boolean | true |
| valuespercentage | Boolean | false |
Example configuration:
parameter_defaults:
  ExtraConfig:
    collectd::plugin::df::fstypes: ['tmpfs','xfs']
parameter_defaults:
  ExtraConfig:
collectd::plugin::df::fstypes: ['tmpfs','xfs']Additional resources
For more information about configuring the df plugin, see df.
4.15. collectd::plugin::disk
Use the disk plugin to collect performance statistics of hard disks and, if supported, partitions.
The disk plugin monitors all disks by default. You can use the ignoreselected parameter to ignore a list of disks. The example configuration ignores the sda, sdb, and sdc disks, and monitors all disks not included in the list.
This plugin is enabled by default.
| Parameter | Type | Defaults |
|---|---|---|
| disks | Array |
|
| ignoreselected | Boolean | false |
| udevnameattr | String | <undefined> |
| Name | Description |
|---|---|
| merged | The number of queued operations that can be merged together, for example, one physical disk access served two or more logical operations. |
| time | The average time an I/O-operation takes to complete. The values might not be accurate. |
| io_time | Time spent doing I/Os (ms). You can use this metric as a device load percentage. A value of 1 second matches 100% of load. |
| weighted_io_time | Measure of both I/O completion time and the backlog that might be accumulating. |
| pending_operations | Shows queue size of pending I/O operations. |
Example configuration:
parameter_defaults:
  ExtraConfig:
    collectd::plugin::disk::disks: ['sda', 'sdb', 'sdc']
    collectd::plugin::disk::ignoreselected: true
parameter_defaults:
  ExtraConfig:
    collectd::plugin::disk::disks: ['sda', 'sdb', 'sdc']
collectd::plugin::disk::ignoreselected: trueAdditional resources
For more information about configuring the disk plugin, see disk.
4.16. collectd::plugin::hugepages
Use the hugepages plugin to collect hugepages information.
This plugin is enabled by default.
This plugin is enabled by default.| Parameter | Type | Defaults |
|---|---|---|
| report_per_node_hp | Boolean | true |
| report_root_hp | Boolean | true |
| values_pages | Boolean | true |
| values_bytes | Boolean | false |
| values_percentage | Boolean | false |
Example configuration:
parameter_defaults:
  ExtraConfig:
    collectd::plugin::hugepages::values_percentage: true
parameter_defaults:
  ExtraConfig:
collectd::plugin::hugepages::values_percentage: trueAdditional resources
-
For more information about configuring the
hugepagesplugin, see hugepages.
4.17. collectd::plugin::interface
Use the interface plugin to measure interface traffic in octets, packets per second, and error rate per second.
This plugin is enabled by default.
This plugin is enabled by default.| Parameter | Type | Default |
|---|---|---|
| interfaces | Array |
|
| ignoreselected | Boolean | false |
| reportinactive | Boolean | true |
Example configuration:
parameter_defaults:
  ExtraConfig:
    collectd::plugin::interface::interfaces:
      - lo
    collectd::plugin::interface::ignoreselected: true
parameter_defaults:
  ExtraConfig:
    collectd::plugin::interface::interfaces:
      - lo
collectd::plugin::interface::ignoreselected: trueAdditional resources
-
For more information about configuring the
interfacesplugin, see interfaces.
4.18. collectd::plugin::load
Use the load plugin to collect the system load and an overview of the system use.
This plugin is enabled by default.
This plugin is enabled by default.| Parameter | Type | Default |
|---|---|---|
| report_relative | Boolean | true |
Example configuration:
parameter_defaults:
  ExtraConfig:
    collectd::plugin::load::report_relative: false
parameter_defaults:
  ExtraConfig:
collectd::plugin::load::report_relative: falseAdditional resources
-
For more information about configuring the
loadplugin, see load.
4.19. collectd::plugin::mcelog
Use the mcelog plugin to send notifications and statistics that are relevant to Machine Check Exceptions when they occur. Configure mcelog to run in daemon mode and enable logging capabilities.
| Parameter | Type |
|---|---|
| Mcelogfile | String |
| Memory |
Hash |
Example configuration:
parameter_defaults:
    CollectdExtraPlugins: mcelog
    CollectdEnableMcelog: true
parameter_defaults:
    CollectdExtraPlugins: mcelog
CollectdEnableMcelog: trueAdditional resources
-
For more information about configuring the
mcelogplugin, see mcelog.
4.20. collectd::plugin::memcached
Use the memcached plugin to retrieve information about memcached cache usage, memory, and other related information.
| Parameter | Type |
|---|---|
| instances | Hash |
| interval | Integer |
Example configuration:
Additional resources
-
For more information about configuring the
memcachedplugin, see memcached.
4.21. collectd::plugin::memory
Use the memory plugin to retrieve information about the memory of the system.
This plugin is enabled by default.
This plugin is enabled by default.| Parameter | Type |
|---|---|
| Defaults | valuesabsolute |
| Boolean | true |
| valuespercentage | Boolean |
Example configuration:
parameter_defaults:
  ExtraConfig:
    collectd::plugin::memory::valuesabsolute: true
    collectd::plugin::memory::valuespercentage: false
parameter_defaults:
  ExtraConfig:
    collectd::plugin::memory::valuesabsolute: true
collectd::plugin::memory::valuespercentage: falseAdditional resources
-
For more information about configuring the
memoryplugin, see memory.
4.22. collectd::plugin::ntpd
Use the ntpd plugin to query a local NTP server that is configured to allow access to statistics, and retrieve information about the configured parameters and the time sync status.
| Parameter | Type |
|---|---|
| host | Hostname |
| port | Port number (Integer) |
| reverselookups | Boolean |
| includeunitid | Boolean |
| interval | Integer |
Example configuration:
Additional resources
-
For more information about configuring the
ntpdplugin, see ntpd.
4.23. collectd::plugin::ovs_stats
Use the ovs_stats plugin to collect statistics of OVS-connected interfaces. The ovs_stats plugin uses the OVSDB management protocol (RFC7047) monitor mechanism to get statistics from OVSDB.
| Parameter | Type |
|---|---|
| address | String |
| bridges | List |
| port | Integer |
| socket | String |
Example configuration:
The following example shows how to enable the ovs_stats plugin. If you deploy your overcloud with OVS, you do not need to enable the ovs_stats plugin.
    parameter_defaults:
        CollectdExtraPlugins:
          - ovs_stats
        ExtraConfig:
          collectd::plugin::ovs_stats::socket: '/run/openvswitch/db.sock'
    parameter_defaults:
        CollectdExtraPlugins:
          - ovs_stats
        ExtraConfig:
collectd::plugin::ovs_stats::socket: '/run/openvswitch/db.sock'Additional resources
-
For more information about configuring the
ovs_statsplugin, see ovs_stats.
4.24. collectd::plugin::processes
The processes plugin provides information about system processes. If you do not specify custom process matching, the plugin collects only the number of processes by state and the process fork rate.
To collect more details about specific processes, you can use the process parameter to specify a process name or the process_match option to specify process names that match a regular expression. The statistics for a process_match output are grouped by process name.
| Parameter | Type | Defaults |
|---|---|---|
| processes | Array | <undefined> |
| process_matches | Array | <undefined> |
| collect_context_switch | Boolean | <undefined> |
| collect_file_descriptor | Boolean | <undefined> |
| collect_memory_maps | Boolean | <undefined> |
Additional resources
-
For more information about configuring the
processesplugin, see [processes].
4.25. collectd::plugin::smart
Use the smart plugin to collect SMART (self-monitoring, analysis and reporting technology) information from physical disks on the node. You must also set the parameter CollectdContainerAdditionalCapAdd to CAP_SYS_RAWIO to allow the smart plugin to read SMART telemetry. If you do not set the CollectdContainerAdditionalCapAdd parameter, the following message is written to the collectd error logs:
smart plugin: Running collectd as root, but the CAP_SYS_RAWIO capability is missing. The plugin's read function will probably fail. Is your init system dropping capabilities?.
| Parameter | Type |
|---|---|
| disks | Array |
| ignoreselected | Boolean |
| interval | Integer |
Example configuration:
parameter_defaults:
  CollectdExtraPlugins:
  - smart

  CollectdContainerAdditionalCapAdd: "CAP_SYS_RAWIO"
parameter_defaults:
  CollectdExtraPlugins:
  - smart

CollectdContainerAdditionalCapAdd: "CAP_SYS_RAWIO"Additional information
-
For more information about configuring the
smartplugin, see smart.
4.26. collectd::plugin::swap
Use the swap plugin to collect information about the available and used swap space.
| Parameter | Type |
|---|---|
| reportbydevice | Boolean |
| reportbytes | Boolean |
| valuesabsolute | Boolean |
| valuespercentage | Boolean |
| reportio | Boolean |
Example configuration:
4.27. collectd::plugin::tcpconns
Use the tcpconns plugin to collect information about the number of TCP connections inbound or outbound from the configured port. The local port configuration represents ingress connections. The remote port configuration represents egress connections.
| Parameter | Type |
|---|---|
| localports | Port (Array) |
| remoteports | Port (Array) |
| listening | Boolean |
| allportssummary | Boolean |
Example configuration:
4.28. collectd::plugin::thermal
Use the thermal plugin to retrieve ACPI thermal zone information.
| Parameter | Type |
|---|---|
| devices | Array |
| ignoreselected | Boolean |
| interval | Integer |
Example configuration:
parameter_defaults:
  CollectdExtraPlugins:
  - thermal
parameter_defaults:
  CollectdExtraPlugins:
- thermal4.29. collectd::plugin::uptime
Use the uptime plugin to collect information about system uptime.
This plugin is enabled by default.
This plugin is enabled by default.| Parameter | Type |
|---|---|
| interval | Integer |
4.30. collectd::plugin::virt
Use the virt plugin to collect CPU, disk, network load, and other metrics through the libvirt API for virtual machines on the host.
This plugin is enabled by default on compute hosts.
| Parameter | Type |
|---|---|
| connection | String |
| refresh_interval | Hash |
| domain | String |
| block_device | String |
| interface_device | String |
| ignore_selected | Boolean |
| plugin_instance_format | String |
| hostname_format | String |
| interface_format | String |
| extra_stats | String |
Example configuration:
ExtraConfig:
  collectd::plugin::virt::hostname_format: "name uuid hostname"
  collectd::plugin::virt::plugin_instance_format: metadata
ExtraConfig:
  collectd::plugin::virt::hostname_format: "name uuid hostname"
collectd::plugin::virt::plugin_instance_format: metadataAdditional resources
For more information about configuring the virt plugin, see virt.
4.31. collectd::plugin::vmem
Use the vmem plugin to collect information about virtual memory from the kernel subsystem.
| Parameter | Type |
|---|---|
| verbose | Boolean |
| interval | Integer |
Example configuration:
4.32. collectd::plugin::write_http
Use the write_http output plugin to submit values to an HTTP server by using POST requests and encoding metrics with JSON, or by using the PUTVAL command.
| Parameter | Type |
|---|---|
| ensure | Enum[present, absent] |
| nodes | Hash[String, Hash[String, Scalar]] |
| urls | Hash[String, Hash[String, Scalar]] |
| manage_package | Boolean |
Example configuration:
Additional resources
-
For more information about configuring the
write_httpplugin, see write_http.
4.33. collectd::plugin::write_kafka
Use the write_kafka plugin to send values to a Kafka topic. Configure the write_kafka plugin with one or more topic blocks. For each topic block, you must specify a unique name and one Kafka producer. You can use the following per-topic parameters inside the topic block:
| Parameter | Type |
|---|---|
| kafka_hosts | Array[String] |
| topics | Hash |
| properties | Hash |
| meta | Hash |
Example configuration:
Additional resources:
For more information about how to configure the write_kafka plugin, see write_kafka.
4.34. Unsupported collectd plugins
The following plugins have undefined use cases for many Red Hat OpenStack Platform (RHOSP) environments, and are therefore unsupported.
| Parameter | Notes |
|---|---|
| cURL |
You can use this plugin to read files with |
| cURL-JSON | You can use this plugin to query JSON data using the cURL library and parse the data according to the configuration. |
| DNS | You can use this plugin to interpret the packets and collect statistics of your DNS traffic on UDP port 53. |
| Entropy | You can use this plugin to report the available entropy on a system. |
| Ethstat | You can use this plugin to read performance statistics from the Ethernet cards. |
| Exec | You can use this plugin to execute scripts or applications and print to STDOUT. |
| fhcount | You can use this plugin to provide statistics about used, unused, and total number of file handles on Linux. |
| FileCount | You can use this plugin to count the number of files in a directory and its subdirectories. |
| FSCache | You can use this plugin to collect information about the file-system-based caching infrastructure for network file systems and other slow media. |
| HDDTemp | You can use this plugin to collect the temperature of hard disks. |
| IntelRDT | You can use this plugin to collect information provided by monitoring features of Intel Resource Director Technology. |
| IPMI | You can use this plugin to read hardware sensors from servers using the Intelligent Platform Management Interface (IPMI). |
| IRQ | You can use this plugin to collect the number of times each interrupt is handled by the operating system. |
| LogFile | You can use this plugin to write to a log file. |
| MySQL | You can use this plugin to connect to a MySQL database and issue a SHOW STATS command periodically. The command returns the server status variables, many of which are collected. |
| Netlink | You can use this plugin to get statistics for interfaces, qdiscs, classes, or filters. |
| Network |
You can use this plugin to interact with other |
| NFS | You can use this plugin to get information about the usage of the Network File System (NFS), version 2, 3, and 4. |
| numa | You can use this plugin to report statistics of the Non-Uniform Memory Access (NUMA) subsystem of Linux. |
| OpenLDAP | You can use this plugin to report the status of OpenLDAP. |
| OpenVPN | You can use this plugin to read the status file printed by OpenVPN. |
| OVS Events | You can use this plugin to monitor the link status of OpenvSwitch-connected interfaces and send notifications when the link state change occurs. |
| PCIe Errors | You can use this plugin to monitor and report PCI Express errors. |
| Ping | You can use this plugin to measure network latency using Internet Control Message Protocol (ICMP) echo requests. |
| procevent | You can use this plugin to monitor process starts and exits. |
| Python | You can use this plugin to bind to python. |
| Sensors |
You can use this plugin to read hardware sensors using |
| Serial | You can use this plugin to collect traffic on the serial interface. |
| SNMP | You can use this plugin to read values from network devices using the Simple Network Management Protocol (SNMP). |
| SNMP Agent | You can use this plugin to handle queries from the principal SNMP agent and return the data collected by read plugins. |
| StatsD |
You can use this plugin to implement the |
| sysevent |
You can use this plugin to listen for incoming |
| SysLog |
You can use this plugin to receive log messages from the |
| Table | You can use this plugin to parse plain text files in table format. |
| Tail |
You can use this plugin to tail log files, in a similar way as the |
| Tail CSV | You can use this plugin to tail CSV files. |
| threshold | You can use this plugin to generate notifications on given thresholds. |
| turbostat | You can use this plugin to read CPU frequency and C-state residency on modern Intel turbo-capable processors. |
| UnixSock |
You can use this plugin to communicate with the |
| Users | You can use this plugin to count the number of users currently logged into the system. |
| UUID | You can use this plugin to determine the uniquie identifier (UUID) of the system that it is running on. |
| Write Graphite |
You can use this plugin to store values in |
| Write HTTP |
You can use this plugin to send the values collected by |
| Write Log | You can use this plugin to write metrics as INFO log messages. |
| Write Prometheus | You can use this plugin to implement a web server that can be scraped by Prometheus. |