此内容没有您所选择的语言版本。
Scalability and performance
Scaling your Red Hat OpenShift Container Platform 4.1 cluster and tuning performance in production environments
Abstract
Chapter 1. Recommended host practices
This topic provides recommended host practices for OpenShift Container Platform.
1.1. Recommended node host practices
The OpenShift Container Platform node configuration file contains important options. For example, two parameters control the maximum number of pods that can be scheduled to a node: podsPerCore and maxPods.
When both options are in use, the lower of the two values limits the number of pods on a node. Exceeding these values can result in:
- Increased CPU utilization.
- Slow pod scheduling.
- Potential out-of-memory scenarios, depending on the amount of memory in the node.
- Exhausting the pool of IP addresses.
- Resource overcommitting, leading to poor user application performance.
In Kubernetes, a pod that is holding a single container actually uses two containers. The second container is used to set up networking prior to the actual container starting. Therefore, a system running 10 pods will actually have 20 containers running.
podsPerCore sets the number of pods the node can run based on the number of processor cores on the node. For example, if podsPerCore is set to 10 on a node with 4 processor cores, the maximum number of pods allowed on the node will be 40.
kubeletConfig:
  podsPerCore: 10
Setting podsPerCore to 0 disables this limit. The default is 0. podsPerCore cannot exceed maxPods.
maxPods sets the number of pods the node can run to a fixed value, regardless of the properties of the node.
 kubeletConfig:
maxPods: 250The kubelet configuration is currently serialized as an ignition configuration, so it can be directly edited. However, there is also a new kubelet-config-controller added to the Machine Config Controller (MCC). This allows you to create a KubeletConfig custom resource (CR) to edit the kubelet parameters.
Procedure
Run:
$ oc get machineconfigThis provides a list of the available machine configuration objects you can select. By default, the two kubelet-related configs are
01-master-kubeletand01-worker-kubelet.To check the current value of max Pods per node, run:
# oc describe node <node-ip> | grep Allocatable -A6Look for
value: pods: <value>.For example:
# oc describe node ip-172-31-128-158.us-east-2.compute.internal | grep Allocatable -A6
Allocatable:
 attachable-volumes-aws-ebs:  25
 cpu:                         3500m
 hugepages-1Gi:               0
 hugepages-2Mi:               0
 memory:                      15341844Ki
 pods:                        250
To set the max Pods per node on the worker nodes, create a YAML file that contains the kubelet configuration. For example,
max-worker-pods.yaml:apiVersion: machineconfiguration.openshift.io/v1 kind: KubeletConfig metadata: name: set-max-pods spec: machineConfigSelector: 01-worker-kubelet kubeletConfig: maxPods: 250The rate at which the kubelet talks to the API server depends on queries per second (QPS) and burst values. The default values,
5forkubeAPIQPSand10forkubeAPIBurst, are good enough if there are limited pods running on each node. Updating the kubelet QPS and burst rates is recommended if there are enough CPU and memory resources on the node:apiVersion: machineconfiguration.openshift.io/v1 kind: KubeletConfig metadata: name: set-max-pods spec: machineConfigPoolSelector: matchLabels: custom-kubelet: large-pods kubeletConfig: maxPods: <pod_count> kubeAPIBurst: <burst_rate> kubeAPIQPS: <QPS>Run:
$ oc label machineconfigpool worker custom-kubelet=large-podsRun:
$ oc create -f change-maxPods-cr.yamlRun:
$ oc get kubeletconfigThis should return
set-max-pods.Depending on the number of worker nodes in the cluster, wait for the worker nodes to be rebooted one by one. For a cluster with 3 worker nodes, this could take about 10 to 15 minutes.
Check for
maxPodschanging for the worker nodes:$ oc describe nodeVerify the change by running:
$ oc get kubeletconfigs set-max-pods -o yamlThis should show a status of
Trueandtype:Success.
Procedure
By default, only one machine is allowed to be unavailable when applying the kubelet-related configuration to the available worker nodes. For a large cluster, it can take a long time for the configuration change to be reflected. At any time, you can adjust the number of machines that are updating to speed up the process. . Run:
+
$ oc edit machineconfigpool workerSet
maxUnavailableto the desired value.spec: maxUnavailable: <node_count>ImportantWhen setting the value, consider the number of worker nodes that can be unavailable without affecting the applications running on the cluster.
1.3. Master node sizing
The master node resource requirements depend on the number of nodes in the cluster. The following master node size recommendations are based on the results of control plane density focused testing.
| Number of worker nodes | CPU cores | Memory (GB) |
|---|---|---|
| 25 | 4 | 16 |
| 100 | 8 | 32 |
| 250 | 16 | 64 |
Because you cannot modify the master node size in a running OpenShift Container Platform 4.1 cluster, you must estimate your total node count and use the suggested master size during installation.
In OpenShift Container Platform 4.1, half of a CPU core (500 millicore) is now reserved by the system by default compared to OpenShift Container Platform 3.11 and previous versions. The sizes are determined taking that into consideration.
1.4. Recommended etcd practices
For large and dense clusters, etcd can suffer from poor performance if the keyspace grows excessively large and exceeds the space quota. Periodic maintenance of etcd including defragmentation needs to be done to free up space in the data store. It is highly recommended that you monitor Prometheus for etcd metrics and defragment it when needed before etcd raises a cluster-wide alarm that puts the cluster into a maintenance mode, which only accepts key reads and deletes. Some of the key metrics to monitor are etcd_server_quota_backend_bytes which is the current quota limit, etcd_mvcc_db_total_size_in_use_in_bytes which indicates the actual database usage after a history compaction, and etcd_debugging_mvcc_db_total_size_in_bytes which shows the database size including free space waiting for defragmentation.
1.5. Additional resources
Chapter 2. Using the Node Tuning Operator
Learn about the Node Tuning Operator and how you can use it to manage node-level tuning by orchestrating the tuned daemon.
2.1. About the Node Tuning Operator
The Node Tuning Operator helps you manage node-level tuning by orchestrating the tuned daemon. The majority of high-performance applications require some level of kernel tuning. The Node Tuning Operator provides a unified management interface to users of node-level sysctls and more flexibility to add custom tuning, which is currently a Technology Preview feature, specified by user needs. The Operator manages the containerized tuned daemon for OpenShift Container Platform as a Kubernetes DaemonSet. It ensures the custom tuning specification is passed to all containerized tuned daemons running in the cluster in the format that the daemons understand. The daemons run on all nodes in the cluster, one per node.
The Node Tuning Operator is part of a standard OpenShift Container Platform installation in version 4.1 and later.
Use this process to access an example Node Tuning Operator specification.
Procedure
Run:
$ oc get Tuned/default -o yaml -n openshift-cluster-node-tuning-operator
2.3. Default profiles set on a cluster
The following are the default profiles set on a cluster.
apiVersion: tuned.openshift.io/v1alpha1
kind: Tuned
metadata:
  name: default
  namespace: openshift-cluster-node-tuning-operator
spec:
  profile:
  - name: "openshift"
    data: |
      [main]
      summary=Optimize systems running OpenShift (parent profile)
      include=${f:virt_check:virtual-guest:throughput-performance}
      [selinux]
      avc_cache_threshold=8192
      [net]
      nf_conntrack_hashsize=131072
      [sysctl]
      net.ipv4.ip_forward=1
      kernel.pid_max=>131072
      net.netfilter.nf_conntrack_max=1048576
      net.ipv4.neigh.default.gc_thresh1=8192
      net.ipv4.neigh.default.gc_thresh2=32768
      net.ipv4.neigh.default.gc_thresh3=65536
      net.ipv6.neigh.default.gc_thresh1=8192
      net.ipv6.neigh.default.gc_thresh2=32768
      net.ipv6.neigh.default.gc_thresh3=65536
      [sysfs]
      /sys/module/nvme_core/parameters/io_timeout=4294967295
      /sys/module/nvme_core/parameters/max_retries=10
  - name: "openshift-control-plane"
    data: |
      [main]
      summary=Optimize systems running OpenShift control plane
      include=openshift
      [sysctl]
      # ktune sysctl settings, maximizing i/o throughput
      #
      # Minimal preemption granularity for CPU-bound tasks:
      # (default: 1 msec#  (1 + ilog(ncpus)), units: nanoseconds)
      kernel.sched_min_granularity_ns=10000000
      # The total time the scheduler will consider a migrated process
      # "cache hot" and thus less likely to be re-migrated
      # (system default is 500000, i.e. 0.5 ms)
      kernel.sched_migration_cost_ns=5000000
      # SCHED_OTHER wake-up granularity.
      #
      # Preemption granularity when tasks wake up.  Lower the value to
      # improve wake-up latency and throughput for latency critical tasks.
      kernel.sched_wakeup_granularity_ns=4000000
  - name: "openshift-node"
    data: |
      [main]
      summary=Optimize systems running OpenShift nodes
      include=openshift
      [sysctl]
      net.ipv4.tcp_fastopen=3
      fs.inotify.max_user_watches=65536
  - name: "openshift-control-plane-es"
    data: |
      [main]
      summary=Optimize systems running ES on OpenShift control-plane
      include=openshift-control-plane
      [sysctl]
      vm.max_map_count=262144
  - name: "openshift-node-es"
    data: |
      [main]
      summary=Optimize systems running ES on OpenShift nodes
      include=openshift-node
      [sysctl]
      vm.max_map_count=262144
  recommend:
  - profile: "openshift-control-plane-es"
    priority: 10
    match:
    - label: "tuned.openshift.io/elasticsearch"
      type: "pod"
      match:
      - label: "node-role.kubernetes.io/master"
      - label: "node-role.kubernetes.io/infra"

  - profile: "openshift-node-es"
    priority: 20
    match:
    - label: "tuned.openshift.io/elasticsearch"
      type: "pod"

  - profile: "openshift-control-plane"
    priority: 30
    match:
    - label: "node-role.kubernetes.io/master"
    - label: "node-role.kubernetes.io/infra"

  - profile: "openshift-node"
priority: 40Custom profiles for custom tuning specification is a Technology Preview feature only. Technology Preview features are not supported with Red Hat production service level agreements (SLAs) and might not be functionally complete. Red Hat does not recommend using them in production. These features provide early access to upcoming product features, enabling customers to test functionality and provide feedback during the development process.
For more information about the support scope of Red Hat Technology Preview features, see https://access.redhat.com/support/offerings/techpreview/.
2.4. Custom tuning specification
The custom resource (CR) for the operator has two major sections. The first section, profile:, is a list of tuned profiles and their names. The second, recommend:, defines the profile selection logic.
Multiple custom tuning specifications can co-exist as multiple CRs in the operator’s namespace. The existence of new CRs or the deletion of old CRs is detected by the Operator. All existing custom tuning specifications are merged and appropriate objects for the containerized tuned daemons are updated.
Profile data
The profile: section lists tuned profiles and their names.
profile:
- name: tuned_profile_1
  data: |
    # Tuned profile specification
    [main]
    summary=Description of tuned_profile_1 profile

    [sysctl]
    net.ipv4.ip_forward=1
    # ... other sysctl's or other tuned daemon plugins supported by the containerized tuned

# ...

- name: tuned_profile_n
  data: |
    # Tuned profile specification
    [main]
    summary=Description of tuned_profile_n profile

    # tuned_profile_n profile settings
Recommended profiles
The profile: selection logic is defined by the recommend: section of the CR:
recommend:
- match:                              # optional; if omitted, profile match is assumed unless a profile with a higher matches first
  <match>                             # an optional array
  priority: <priority>                # profile ordering priority, lower numbers mean higher priority (0 is the highest priority)
  profile: <tuned_profile_name>       # e.g. tuned_profile_1

# ...

- match:
  <match>
  priority: <priority>
  profile: <tuned_profile_name>       # e.g. tuned_profile_n
If <match> is omitted, a profile match (for example, true) is assumed.
<match> is an optional array recursively defined as follows:
- label: <label_name>     # node or pod label name
  value: <label_value>    # optional node or pod label value; if omitted, the presence of <label_name> is enough to match
  type: <label_type>      # optional node or pod type ("node" or "pod"); if omitted, "node" is assumed
  <match>                 # an optional <match> array
If <match> is not omitted, all nested <match> sections must also evaluate to true. Otherwise, false is assumed and the profile with the respective <match> section will not be applied or recommended. Therefore, the nesting (child <match> sections) works as logical AND operator. Conversely, if any item of the <match> array matches, the entire <match> array evaluates to true. Therefore, the array acts as logical OR operator.
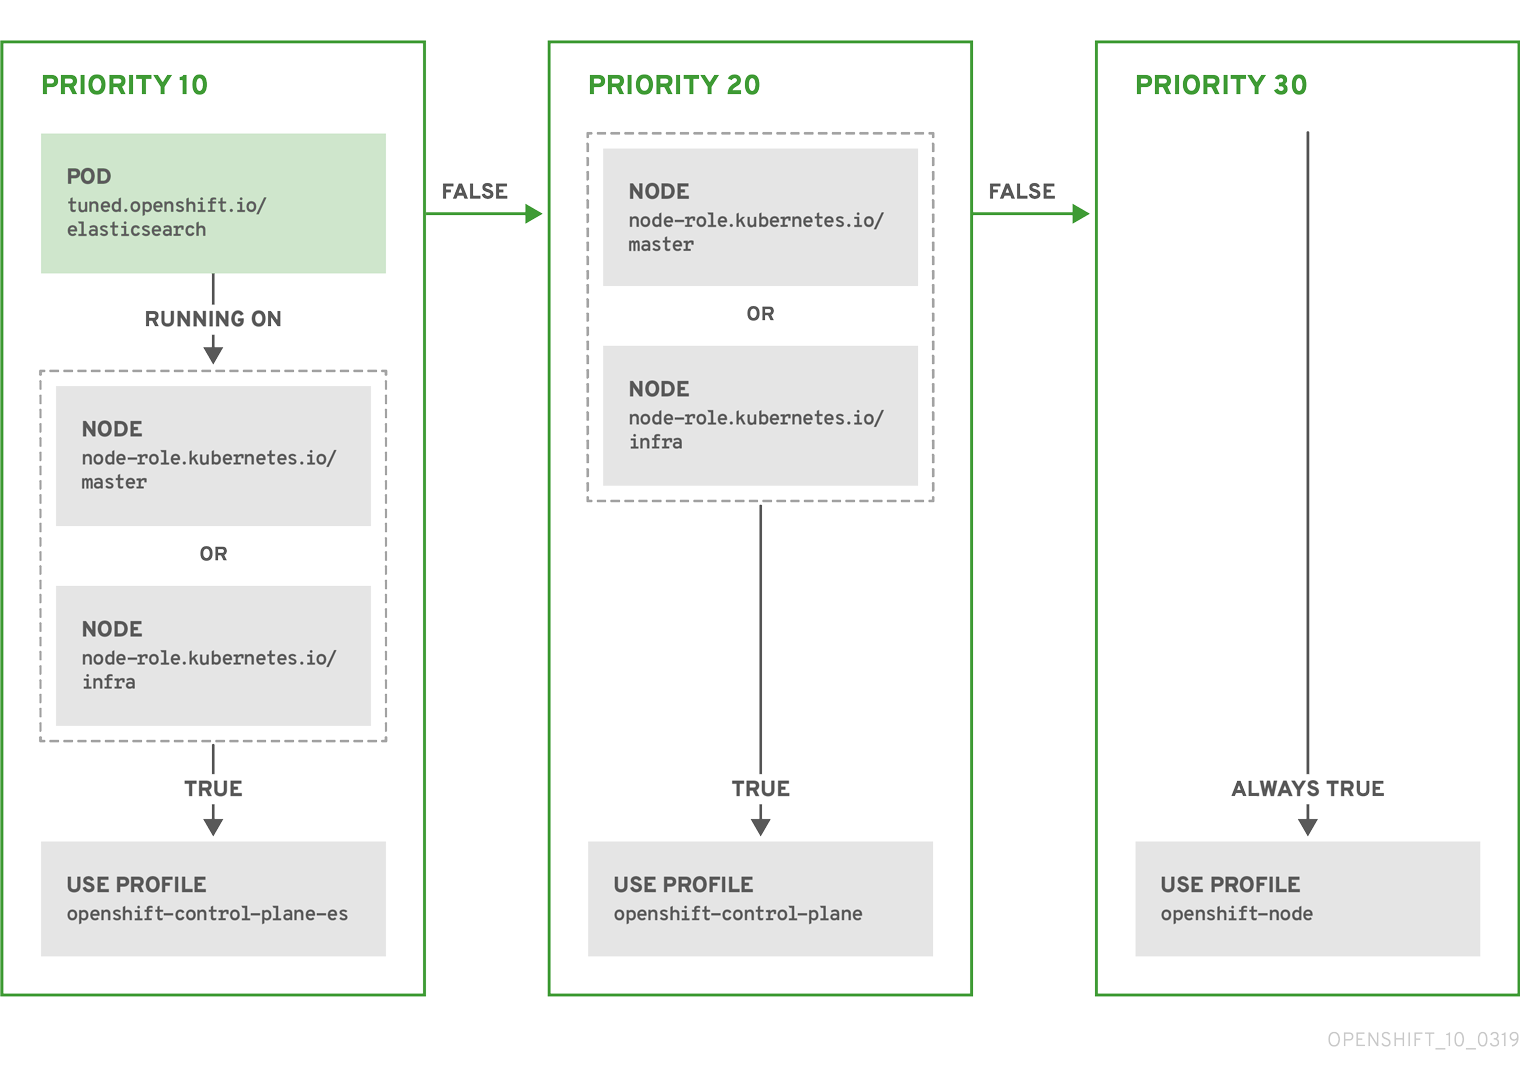
Example
- match:
  - label: tuned.openshift.io/elasticsearch
    match:
    - label: node-role.kubernetes.io/master
    - label: node-role.kubernetes.io/infra
    type: pod
  priority: 10
  profile: openshift-control-plane-es
- match:
  - label: node-role.kubernetes.io/master
  - label: node-role.kubernetes.io/infra
  priority: 20
  profile: openshift-control-plane
- priority: 30
  profile: openshift-node
The CR above is translated for the containerized tuned daemon into its recommend.conf file based on the profile priorities. The profile with the highest priority (10) is openshift-control-plane-es and, therefore, it is considered first. The containerized tuned daemon running on a given node looks to see if there is a pod running on the same node with the tuned.openshift.io/elasticsearch label set. If not, the entire <match> section evaluates as false. If there is such a pod with the label, in order for the <match> section to evaluate to true, the node label also needs to be node-role.kubernetes.io/master or node-role.kubernetes.io/infra.
If the labels for the profile with priority 10 matched, openshift-control-plane-es profile is applied and no other profile is considered. If the node/pod label combination did not match, the second highest priority profile (openshift-control-plane) is considered. This profile is applied if the containerized tuned pod runs on a node with labels node-role.kubernetes.io/master or node-role.kubernetes.io/infra.
Finally, the profile openshift-node has the lowest priority of 30. It lacks the <match> section and, therefore, will always match. It acts as a profile catch-all to set openshift-node profile, if no other profile with higher priority matches on a given node.
2.5. Supported Tuned daemon plug-ins
Excluding the [main] section, the following Tuned plug-ins are supported when using custom profiles defined in the profile: section of the Tuned CR:
- audio
- cpu
- disk
- eeepc_she
- modules
- mounts
- net
- scheduler
- scsi_host
- selinux
- sysctl
- sysfs
- usb
- video
- vm
There is some dynamic tuning functionality provided by some of these plug-ins that is not supported. The following Tuned plug-ins are currently not supported:
- bootloader
- script
- systemd
See Available Tuned Plug-ins and Getting Started with Tuned for more information.
Chapter 3. Using Cluster Loader
Cluster Loader is a tool that deploys large numbers of various objects to a cluster, which creates user-defined cluster objects. Build, configure, and run Cluster Loader to measure performance metrics of your OpenShift Container Platform deployment at various cluster states.
3.1. Installing Cluster Loader
Cluster Loader is included in the origin-tests container image.
Procedure
To pull the
origin-testscontainer image, run:$ sudo podman pull quay.io/openshift/origin-tests:4.1
3.2. Running Cluster Loader
Procedure
Execute Cluster Loader using the built-in test configuration, which deploys five template builds and waits for them to complete:
$ sudo podman run -v ${LOCAL_KUBECONFIG}:/root/.kube/config -i
quay.io/openshift/origin-tests:4.1 /bin/bash -c 'export KUBECONFIG=/root/.kube/config && \
openshift-tests run-test "[Feature:Performance][Serial][Slow] Load cluster should load the \
cluster [Suite:openshift]"'
Alternatively, execute Cluster Loader with a user-defined configuration by setting the environment variable for
VIPERCONFIG:$ sudo podman run -v ${LOCAL_KUBECONFIG}:/root/.kube/config -i quay.io/openshift/origin-tests:4.1 /bin/bash -c 'export KUBECONFIG=/root/.kube/config && \ export VIPERCONFIG=config/test && \ openshift-tests run-test "[Feature:Performance][Serial][Slow] Load cluster should load the \ cluster [Suite:openshift]"'In this example, there is a subdirectory called config/ with a configuration file called test.yml. In the command line, exclude the extension of the configuration file, as the tool will automatically determine the file type and extension.
3.3. Configuring Cluster Loader
The tool creates multiple namespaces (projects), which contain multiple templates or pods.
Locate the configuration files for Cluster Loader in the config/ subdirectory. The pod files and template files referenced in these configuration examples are found in the content/ subdirectory.
3.3.1. Example Cluster Loader configuration file
Cluster Loader’s configuration file is a basic YAML file:
provider: local
ClusterLoader:
  cleanup: true
  projects:
    - num: 1
      basename: clusterloader-cakephp-mysql
      tuning: default
      ifexists: reuse
      templates:
        - num: 1
          file: ./examples/quickstarts/cakephp-mysql.json

    - num: 1
      basename: clusterloader-dancer-mysql
      tuning: default
      ifexists: reuse
      templates:
        - num: 1
          file: ./examples/quickstarts/dancer-mysql.json

    - num: 1
      basename: clusterloader-django-postgresql
      tuning: default
      ifexists: reuse
      templates:
        - num: 1
          file: ./examples/quickstarts/django-postgresql.json

    - num: 1
      basename: clusterloader-nodejs-mongodb
      tuning: default
      ifexists: reuse
      templates:
        - num: 1
          file: ./examples/quickstarts/nodejs-mongodb.json

    - num: 1
      basename: clusterloader-rails-postgresql
      tuning: default
      templates:
        - num: 1
          file: ./examples/quickstarts/rails-postgresql.json

  tuningsets:
    - name: default
      pods:
        stepping:
          stepsize: 5
          pause: 0 s
        rate_limit:
delay: 0 ms- 1
- Optional setting for end-to-end tests. Set to
localto avoid extra log messages. - 2
- The tuning sets allow rate limiting and stepping, the ability to create several batches of pods while pausing in between sets. Cluster Loader monitors completion of the previous step before continuing.
- 3
- Stepping will pause for
Mseconds after eachNobjects are created. - 4
- Rate limiting will wait
Mmilliseconds between the creation of objects.
This example assumes that references to any external template files or podspec files are also mounted into the container.
3.3.2. Configuration fields
| Field | Description |
|---|---|
|
|
Set to |
|
|
A sub-object with one or many definition(s). Under |
|
|
A sub-object with one definition per configuration. |
|
| An optional sub-object with one definition per configuration. Adds synchronization possibilities during object creation. |
| Field | Description |
|---|---|
|
| An integer. One definition of the count of how many projects to create. |
|
|
A string. One definition of the base name for the project. The count of identical namespaces will be appended to |
|
| A string. One definition of what tuning set you want to apply to the objects, which you deploy inside this namespace. |
|
|
A string containing either |
|
| A list of key-value pairs. The key is the ConfigMap name and the value is a path to a file from which you create the ConfigMap. |
|
| A list of key-value pairs. The key is the secret name and the value is a path to a file from which you create the secret. |
|
| A sub-object with one or many definition(s) of pods to deploy. |
|
| A sub-object with one or many definition(s) of templates to deploy. |
| Field | Description |
|---|---|
|
| An integer. The number of pods or templates to deploy. |
|
| A string. The docker image URL to a repository where it can be pulled. |
|
| A string. One definition of the base name for the template (or pod) that you want to create. |
|
| A string. The path to a local file, which is either a PodSpec or template to be created. |
|
|
Key-value pairs. Under |
| Field | Description |
|---|---|
|
| A string. The name of the tuning set which will match the name specified when defining a tuning in a project. |
|
|
A sub-object identifying the |
|
|
A sub-object identifying the |
| Field | Description |
|---|---|
|
| A sub-object. A stepping configuration used if you want to create an object in a step creation pattern. |
|
| A sub-object. A rate-limiting tuning set configuration to limit the object creation rate. |
| Field | Description |
|---|---|
|
| An integer. How many objects to create before pausing object creation. |
|
|
An integer. How many seconds to pause after creating the number of objects defined in |
|
| An integer. How many seconds to wait before failure if the object creation is not successful. |
|
| An integer. How many milliseconds (ms) to wait between creation requests. |
| Field | Description |
|---|---|
|
|
A sub-object with |
|
|
A boolean. Wait for pods with labels matching |
|
|
A boolean. Wait for pods with labels matching |
|
|
A list of selectors to match pods in |
|
|
A string. The synchronization timeout period to wait for pods in |
3.4. Known issues
If the IDENTIFIER parameter is not defined in user templates, template creation fails with error: unknown parameter name "IDENTIFIER". If you deploy templates, add this parameter to your template to avoid this error:
{
  "name": "IDENTIFIER",
  "description": "Number to append to the name of resources",
  "value": "1"
}
If you deploy pods, adding the parameter is unnecessary.
Chapter 4. Using CPU Manager
CPU Manager manages groups of CPUs and constrains workloads to specific CPUs.
CPU Manager is useful for workloads that have some of these attributes:
- Require as much CPU time as possible.
- Are sensitive to processor cache misses.
- Are low-latency network applications.
- Coordinate with other processes and benefit from sharing a single processor cache.
4.1. Setting up CPU Manager
Procedure
Optional: Label a node:
# oc label node perf-node.example.com cpumanager=trueEdit the
MachineConfigPoolof the nodes where CPU Manager should be enabled. In this example, all workers have CPU Manager enabled:# oc edit machineconfigpool workerAdd a label to the worker
MachineConfigPool:metadata: creationTimestamp: 2019-xx-xxx generation: 3 labels: custom-kubelet: cpumanager-enabledCreate a
KubeletConfig,cpumanager-kubeletconfig.yaml, custom resource (CR). Refer to the label created in the previous step to have the correct nodes updated with the newKubeletConfig. See themachineConfigPoolSelectorsection:apiVersion: machineconfiguration.openshift.io/v1 kind: KubeletConfig metadata: name: cpumanager-enabled spec: machineConfigPoolSelector: matchLabels: custom-kubelet: cpumanager-enabled kubeletConfig: cpuManagerPolicy: static cpuManagerReconcilePeriod: 5sCreate the dynamic
KubeletConfig:# oc create -f cpumanager-kubeletconfig.yamlThis adds the CPU Manager feature to the
KubeletConfigand, if needed, the Machine Config Operator (MCO) reboots the node. To enable CPU Manager, a reboot is not needed.Check for the merged
KubeletConfig:# oc get machineconfig 99-worker-XXXXXX-XXXXX-XXXX-XXXXX-kubelet -o json | grep ownerReference -A7 "ownerReferences": [ { "apiVersion": "machineconfiguration.openshift.io/v1", "kind": "KubeletConfig", "name": "cpumanager-enabled", "uid": "7ed5616d-6b72-11e9-aae1-021e1ce18878" } ],Check the worker for the updated
kubelet.conf:# oc debug node/perf-node.example.com sh-4.4# cat /host/etc/kubernetes/kubelet.conf | grep cpuManager cpuManagerPolicy: static1 cpuManagerReconcilePeriod: 5s2 Create a Pod that requests a core or multiple cores. Both limits and requests must have their CPU value set to a whole integer. That is the number of cores that will be dedicated to this Pod:
# cat cpumanager-pod.yaml
apiVersion: v1
kind: Pod
metadata:
  generateName: cpumanager-
spec:
  containers:
  - name: cpumanager
    image: gcr.io/google_containers/pause-amd64:3.0
    resources:
      requests:
        cpu: 1
        memory: "1G"
      limits:
        cpu: 1
        memory: "1G"
  nodeSelector:
    cpumanager: "true"
Create the Pod:
# oc create -f cpumanager-pod.yamlVerify that the Pod is scheduled to the node that you labeled:
# oc describe pod cpumanager
Name:               cpumanager-6cqz7
Namespace:          default
Priority:           0
PriorityClassName:  <none>
Node:  perf-node.example.com/xxx.xx.xx.xxx
...
 Limits:
      cpu:     1
      memory:  1G
    Requests:
      cpu:        1
      memory:     1G
...
QoS Class:       Guaranteed
Node-Selectors:  cpumanager=true
Verify that the
cgroupsare set up correctly. Get the process ID (PID) of thepauseprocess:# ├─init.scope │ └─1 /usr/lib/systemd/systemd --switched-root --system --deserialize 17 └─kubepods.slice ├─kubepods-pod69c01f8e_6b74_11e9_ac0f_0a2b62178a22.slice │ ├─crio-b5437308f1a574c542bdf08563b865c0345c8f8c0b0a655612c.scope │ └─32706 /pausePods of quality of service (QoS) tier
Guaranteedare placed within thekubepods.slice. Pods of other QoS tiers end up in childcgroupsofkubepods:# cd /sys/fs/cgroup/cpuset/kubepods.slice/kubepods-pod69c01f8e_6b74_11e9_ac0f_0a2b62178a22.slice/crio-b5437308f1ad1a7db0574c542bdf08563b865c0345c86e9585f8c0b0a655612c.scope # for i in `ls cpuset.cpus tasks` ; do echo -n "$i "; cat $i ; done cpuset.cpus 1 tasks 32706Check the allowed CPU list for the task:
# grep ^Cpus_allowed_list /proc/32706/status
 Cpus_allowed_list:    1
Verify that another pod (in this case, the pod in the
burstableQoS tier) on the system cannot run on the core allocated for theGuaranteedpod:# cat /sys/fs/cgroup/cpuset/kubepods.slice/kubepods-besteffort.slice/kubepods-besteffort-podc494a073_6b77_11e9_98c0_06bba5c387ea.slice/crio-c56982f57b75a2420947f0afc6cafe7534c5734efc34157525fa9abbf99e3849.scope/cpuset.cpus 0# oc describe node perf-node.example.com ... Capacity: attachable-volumes-aws-ebs: 39 cpu: 2 ephemeral-storage: 124768236Ki hugepages-1Gi: 0 hugepages-2Mi: 0 memory: 8162900Ki pods: 250 Allocatable: attachable-volumes-aws-ebs: 39 cpu: 1500m ephemeral-storage: 124768236Ki hugepages-1Gi: 0 hugepages-2Mi: 0 memory: 7548500Ki pods: 250 ------- ---- ------------ ---------- --------------- ------------- --- default cpumanager-6cqz7 1 (66%) 1 (66%) 1G (12%) 1G (12%) 29m Allocated resources: (Total limits may be over 100 percent, i.e., overcommitted.) Resource Requests Limits -------- -------- ------ cpu 1440m (96%) 1 (66%)This VM has two CPU cores. You set
kube-reservedto 500 millicores, meaning half of one core is subtracted from the total capacity of the node to arrive at theNode Allocatableamount. You can see thatAllocatable CPUis 1500 millicores. This means you can run one of the CPU Manager pods since each will take one whole core. A whole core is equivalent to 1000 millicores. If you try to schedule a second pod, the system will accept the pod, but it will never be scheduled:NAME READY STATUS RESTARTS AGE cpumanager-6cqz7 1/1 Running 0 33m cpumanager-7qc2t 0/1 Pending 0 11s
Chapter 5. Scaling the Cluster Monitoring Operator
OpenShift Container Platform exposes metrics that the Cluster Monitoring Operator collects and stores in the Prometheus-based monitoring stack. As an OpenShift Container Platform administrator, you can view system resources, containers and components metrics in one dashboard interface, Grafana.
5.1. Prometheus database storage requirements
Red Hat performed various tests for different scale sizes.
| Number of Nodes | Number of Pods | Prometheus storage growth per day | Prometheus storage growth per 15 days | RAM Space (per scale size) | Network (per tsdb chunk) |
|---|---|---|---|---|---|
| 50 | 1800 | 6.3 GB | 94 GB | 6 GB | 16 MB |
| 100 | 3600 | 13 GB | 195 GB | 10 GB | 26 MB |
| 150 | 5400 | 19 GB | 283 GB | 12 GB | 36 MB |
| 200 | 7200 | 25 GB | 375 GB | 14 GB | 46 MB |
Approximately 20 percent of the expected size was added as overhead to ensure that the storage requirements do not exceed the calculated value.
The above calculation is for the default OpenShift Container Platform Cluster Monitoring Operator.
CPU utilization has minor impact. The ratio is approximately 1 core out of 40 per 50 nodes and 1800 pods.
Lab environment
In a previous release, all experiments were performed in an OpenShift Container Platform on OpenStack environment:
- Infra nodes (VMs) - 40 cores, 157 GB RAM.
- CNS nodes (VMs) - 16 cores, 62 GB RAM, NVMe drives.
Currently, OpenStack environments are not supported for OpenShift Container Platform 4.1.
Recommendations for OpenShift Container Platform
- Use at least three infrastructure (infra) nodes.
- Use at least three openshift-container-storage nodes with non-volatile memory express (NVMe) drives.
5.2. Configuring cluster monitoring
Procedure
To increase the storage capacity for Prometheus:
Create a YAML configuration file, `cluster-monitoring-config.yml. For example:
apiVersion: v1
kind: ConfigMap
data:
  config.yaml: |
    prometheusOperator:
      baseImage: quay.io/coreos/prometheus-operator
      prometheusConfigReloaderBaseImage: quay.io/coreos/prometheus-config-reloader
      configReloaderBaseImage: quay.io/coreos/configmap-reload
      nodeSelector:
        node-role.kubernetes.io/infra: ""
    prometheusK8s:
      retention: {{PROMETHEUS_RETENTION_PERIOD}}
1 baseImage: openshift/prometheus nodeSelector: node-role.kubernetes.io/infra: "" volumeClaimTemplate: spec: storageClassName: gp2 resources: requests: storage: {{PROMETHEUS_STORAGE_SIZE}}2 alertmanagerMain: baseImage: openshift/prometheus-alertmanager nodeSelector: node-role.kubernetes.io/infra: "" volumeClaimTemplate: spec: storageClassName: gp2 resources: requests: storage: {{ALERTMANAGER_STORAGE_SIZE}}3 nodeExporter: baseImage: openshift/prometheus-node-exporter kubeRbacProxy: baseImage: quay.io/coreos/kube-rbac-proxy kubeStateMetrics: baseImage: quay.io/coreos/kube-state-metrics nodeSelector: node-role.kubernetes.io/infra: "" grafana: baseImage: grafana/grafana nodeSelector: node-role.kubernetes.io/infra: "" auth: baseImage: openshift/oauth-proxy k8sPrometheusAdapter: nodeSelector: node-role.kubernetes.io/infra: "" metadata: name: cluster-monitoring-config namespace: openshift-monitoring- 1
- A typical value is
PROMETHEUS_RETENTION_PERIOD=15d. Units are measured in time using one of these suffixes: s, m, h, d. - 2
- A typical value is
PROMETHEUS_STORAGE_SIZE=2000Gi. Storage values can be a plain integer or as a fixed-point integer using one of these suffixes: E, P, T, G, M, K. You can also use the power-of-two equivalents: Ei, Pi, Ti, Gi, Mi, Ki. - 3
- A typical value is
ALERTMANAGER_STORAGE_SIZE=20Gi. Storage values can be a plain integer or as a fixed-point integer using one of these suffixes: E, P, T, G, M, K. You can also use the power-of-two equivalents: Ei, Pi, Ti, Gi, Mi, Ki.
- Set the values like the retention period and storage sizes.
Apply the changes by running:
$ oc create -f cluster-monitoring-config.yml
Consider the following tested object maximums when you plan your OpenShift Container Platform cluster.
These guidelines are based on the largest possible cluster. For smaller clusters, the maximums are lower. There are many factors that influence the stated thresholds, including the etcd version or storage data format.
In most cases, exceeding these numbers results in lower overall performance. It does not necessarily mean that the cluster will fail.
| Limit type | 3.9 tested maximum | 3.10 tested maximum | 3.11 tested maximum | 4.1 tested maximum |
|---|---|---|---|---|
| Number of nodes | 2,000 | 2,000 | 2,000 | 2,000 |
| Number of pods [a] | 120,000 | 150,000 | 150,000 | 150,000 |
| Number of pods per node | 250 | 250 | 250 | 250 |
| Number of pods per core | There is no default value. | There is no default value. | There is no default value. | There is no default value. |
| Number of namespaces [b] | 10,000 | 10,000 | 10,000 | 10,000 |
| Number of builds: Pipeline Strategy | 10,000 (Default pod RAM 512 Mi) | 10,000 (Default pod RAM 512 Mi) | 10,000 (Default pod RAM 512 Mi) | 10,000 (Default pod RAM 512 Mi) |
| Number of pods per namespace [c] | 3,000 | 3,000 | 25,000 | 25,000 |
| Number of services [d] | 10,000 | 10,000 | 10,000 | 10,000 |
| Number of services per namespace | N/A | 5,000 | 5,000 | 5,000 |
| Number of back-ends per service | 5,000 | 5,000 | 5,000 | 5,000 |
| Number of deployments per namespace [c] | 2,000 | 2,000 | 2,000 | 2,000 |
[a]
The pod count displayed here is the number of test pods. The actual number of pods depends on the application’s memory, CPU, and storage requirements.
[b]
When there are a large number of active projects, etcd might suffer from poor performance if the keyspace grows excessively large and exceeds the space quota. Periodic maintenance of etcd, including defragmentaion, is highly recommended to free etcd storage.
[c]
There are a number of control loops in the system that must iterate over all objects in a given namespace as a reaction to some changes in state. Having a large number of objects of a given type in a single namespace can make those loops expensive and slow down processing given state changes. The limit assumes that the system has enough CPU, memory, and disk to satisfy the application requirements.
[d]
Each service port and each service back-end has a corresponding entry in iptables. The number of back-ends of a given service impact the size of the endpoints objects, which impacts the size of data that is being sent all over the system.
| ||||
In OpenShift Container Platform 4.1, half of a CPU core (500 millicore) is now reserved by the system compared to OpenShift Container Platform 3.11 and previous versions.
In OpenShift Container Platform 4.1, the tested node limit has been lowered until scale tests can be run at a higher node count.
Oversubscribing the physical resources on a node affects resource guarantees the Kubernetes scheduler makes during pod placement. Learn what measures you can take to avoid memory swapping.
Some of the tested maximums are stretched only in a single dimension. They will vary when many objects are running on the cluster.
The numbers noted in this documentation are based on Red Hat’s test methodology, setup, configuration, and tunings. These numbers can vary based on your own individual setup and environments.
While planning your environment, determine how many pods are expected to fit per node:
Required Pods per Cluster / Pods per Node = Total Number of Nodes NeededThe current maximum number of pods per node is 250. However, the number of pods that fit on a node is dependent on the application itself. Consider the application’s memory, CPU, and storage requirements, as described in How to plan your environment according to application requirements.
Example scenario
If you want to scope your cluster at 2200 pods, assuming the 250 maximum pods per node, you would need at least nine nodes:
2200 / 250 = 8.8If you increase the number of nodes to 20, then the pod distribution changes to 110 pods per node:
2200 / 20 = 110Where:
Required Pods per Cluster / Total Number of Nodes = Expected Pods per NodeConsider an example application environment:
| Pod type | Pod quantity | Max memory | CPU cores | Persistent storage |
|---|---|---|---|---|
| apache | 100 | 500 MB | 0.5 | 1 GB |
| node.js | 200 | 1 GB | 1 | 1 GB |
| postgresql | 100 | 1 GB | 2 | 10 GB |
| JBoss EAP | 100 | 1 GB | 1 | 1 GB |
Extrapolated requirements: 550 CPU cores, 450GB RAM, and 1.4TB storage.
Instance size for nodes can be modulated up or down, depending on your preference. Nodes are often resource overcommitted. In this deployment scenario, you can choose to run additional smaller nodes or fewer larger nodes to provide the same amount of resources. Factors such as operational agility and cost-per-instance should be considered.
| Node type | Quantity | CPUs | RAM (GB) |
|---|---|---|---|
| Nodes (option 1) | 100 | 4 | 16 |
| Nodes (option 2) | 50 | 8 | 32 |
| Nodes (option 3) | 25 | 16 | 64 |
Some applications lend themselves well to overcommitted environments, and some do not. Most Java applications and applications that use huge pages are examples of applications that would not allow for overcommitment. That memory can not be used for other applications. In the example above, the environment would be roughly 30 percent overcommitted, a common ratio.
Chapter 7. Optimizing storage
Optimizing storage helps to minimize storage use across all resources. By optimizing storage, administrators help ensure that existing storage resources are working in an efficient manner.
7.1. Available persistent storage options
Understand your persistent storage options so that you can optimize your OpenShift Container Platform environment.
| Storage type | Description | Examples |
|---|---|---|
| Block |
| AWS EBS and VMware vSphere support dynamic persistent volume (PV) provisioning natively in OpenShift Container Platform. |
| File |
| RHEL NFS, NetApp NFS [a], and Vendor NFS |
| Object |
| AWS S3 |
[a]
NetApp NFS supports dynamic PV provisioning when using the Trident plug-in.
| ||
Currently, CNS is not supported in OpenShift Container Platform 4.1.
7.2. Recommended configurable storage technology
The following table summarizes the recommended and configurable storage technologies for the given OpenShift Container Platform cluster application.
| Storage type | ROX [a] | RWX [b] | Registry | Scaled registry | Metrics [c] | Logging | Apps |
|---|---|---|---|---|---|---|---|
| Block | Yes [d] | No | Configurable | Not configurable | Recommended | Recommended | Recommended |
| File | Yes [d] | Yes | Configurable | Configurable | Configurable [e] | Configurable [f] | Recommended |
| Object | Yes | Yes | Recommended | Recommended | Not configurable | Not configurable | Not configurable [g] |
[a]
ReadOnlyMany
[b]
ReadWriteMany
[c]
Prometheus is the underlying technology used for metrics.
[d]
This does not apply to physical disk, VM physical disk, VMDK, loopback over NFS, AWS EBS, and Azure Disk.
[e]
For metrics, using file storage with the ReadWriteMany (RWX) access mode is unreliable. If you use file storage, do not configure the RWX access mode on any PersistentVolumeClaims that are configured for use with metrics.
[f]
For logging, using any shared storage would be an anti-pattern. One volume per elasticsearch is required.
[g]
Object storage is not consumed through OpenShift Container Platform’s PVs/persistent volume claims (PVCs). Apps must integrate with the object storage REST API.
| |||||||
A scaled registry is an OpenShift Container Platform registry where three or more pod replicas are running.
7.2.1. Specific application storage recommendations
Testing shows issues with using the NFS server on RHEL as storage backend for the container image registry. This includes the OpenShift Container Registry and Quay, Cassandra for metrics storage, and Elasticsearch for logging storage. Therefore, using NFS to back PVs used by core services is not recommended.
Other NFS implementations on the marketplace might not have these issues. Contact the individual NFS implementation vendor for more information on any testing that was possibly completed against these OpenShift core components.
7.2.1.1. Registry
In a non-scaled/high-availability (HA) OpenShift Container Platform registry cluster deployment:
- The preferred storage technology is object storage followed by block storage. The storage technology does not have to support RWX access mode.
- The storage technology must ensure read-after-write consistency. All NAS storage are not recommended for OpenShift Container Platform Registry cluster deployment with production workloads.
-
While
hostPathvolumes are configurable for a non-scaled/HA OpenShift Container Platform Registry, they are not recommended for cluster deployment.
7.2.1.2. Scaled registry
In a scaled/HA OpenShift Container Platform registry cluster deployment:
- The preferred storage technology is object storage. The storage technology must support RWX access mode and must ensure read-after-write consistency.
- File storage and block storage are not recommended for a scaled/HA OpenShift Container Platform registry cluster deployment with production workloads.
- All NAS storage are not recommended for OpenShift Container Platform Registry cluster deployment with production workloads.
7.2.1.3. Metrics
In an OpenShift Container Platform hosted metrics cluster deployment:
- The preferred storage technology is block storage.
Testing shows significant unrecoverable corruptions using file storage and, therefore, file storage is not recommended for use with metrics.
There are file storage implementations in the marketplace that might not have these issues. Contact the individual storage vendor for more information on any testing that was possibly completed against these OpenShift core components.
7.2.1.4. Logging
In an OpenShift Container Platform hosted logging cluster deployment:
- The preferred storage technology is block storage.
- It is not recommended to use NAS storage for a hosted metrics cluster deployment with production workloads.
Testing shows issues with using the NFS server on RHEL as storage backend for the container image registry. This includes Elasticsearch for logging storage. Therefore, using NFS to back PVs used by core services is not recommended.
Other NFS implementations on the marketplace might not have these issues. Contact the individual NFS implementation vendor for more information on any testing that was possibly completed against these OpenShift core components.
7.2.1.5. Applications
Application use cases vary from application to application, as described in the following examples:
- Storage technologies that support dynamic PV provisioning have low mount time latencies, and are not tied to nodes to support a healthy cluster.
- Application developers are responsible for knowing and understanding the storage requirements for their application, and how it works with the provided storage to ensure that issues do not occur when an application scales or interacts with the storage layer.
- OpenShift Container Platform Internal etcd: For the best etcd reliability, the lowest consistent latency storage technology is preferable.
- OpenStack Cinder: OpenStack Cinder tends to be adept in ROX access mode use cases.
- Databases: Databases (RDBMSs, NoSQL DBs, etc.) tend to perform best with dedicated block storage.
Chapter 8. Optimizing routing
The OpenShift Container Platform HAProxy router scales to optimize performance.
8.1. Baseline router performance
The OpenShift Container Platform router is the Ingress point for all external traffic destined for OpenShift Container Platform services.
When evaluating a single HAProxy router performance in terms of HTTP requests handled per second, the performance varies depending on many factors. In particular:
- HTTP keep-alive/close mode
- route type
- TLS session resumption client support
- number of concurrent connections per target route
- number of target routes
- back end server page size
- underlying infrastructure (network/SDN solution, CPU, and so on)
While performance in your specific environment will vary, Red Hat lab tests on a public cloud instance of size 4 vCPU/16GB RAM, a single HAProxy router handling 100 routes terminated by backends serving 1kB static pages is able to handle the following number of transactions per second.
In HTTP keep-alive mode scenarios:
| Encryption | LoadBalancerService | HostNetwork |
|---|---|---|
| none | 21515 | 29622 |
| edge | 16743 | 22913 |
| passthrough | 36786 | 53295 |
| re-encrypt | 21583 | 25198 |
In HTTP close (no keep-alive) scenarios:
| Encryption | LoadBalancerService | HostNetwork |
|---|---|---|
| none | 5719 | 8273 |
| edge | 2729 | 4069 |
| passthrough | 4121 | 5344 |
| re-encrypt | 2320 | 2941 |
Default router configuration with ROUTER_THREADS=4 was used and two different endpoint publishing strategies (LoadBalancerService/HostNetwork) tested. TLS session resumption was used for encrypted routes. With HTTP keep-alive, a single HAProxy router is capable of saturating 1 Gbit NIC at page sizes as small as 8 kB.
When running on bare metal with modern processors, you can expect roughly twice the performance of the public cloud instance above. This overhead is introduced by the virtualization layer in place on public clouds and holds mostly true for private cloud-based virtualization as well. The following table is a guide on how many applications to use behind the router:
| Number of applications | Application type |
|---|---|
| 5-10 | static file/web server or caching proxy |
| 100-1000 | applications generating dynamic content |
In general, HAProxy can support routes for 5 to 1000 applications, depending on the technology in use. Router performance might be limited by the capabilities and performance of the applications behind it, such as language or static versus dynamic content.
Router sharding should be used to serve more routes towards applications and help horizontally scale the routing tier.
8.2. Router performance optimizations
OpenShift Container Platform no longer supports modifying router deployments by setting environment variables such as ROUTER_THREADS, ROUTER_DEFAULT_TUNNEL_TIMEOUT, ROUTER_DEFAULT_CLIENT_TIMEOUT, ROUTER_DEFAULT_SERVER_TIMEOUT, and RELOAD_INTERVAL.
You can modify the router deployment, but if the Ingress Operator is enabled, the configuration is overwritten.
9.1. What huge pages do
Memory is managed in blocks known as pages. On most systems, a page is 4Ki. 1Mi of memory is equal to 256 pages; 1Gi of memory is 256,000 pages, and so on. CPUs have a built-in memory management unit that manages a list of these pages in hardware. The Translation Lookaside Buffer (TLB) is a small hardware cache of virtual-to-physical page mappings. If the virtual address passed in a hardware instruction can be found in the TLB, the mapping can be determined quickly. If not, a TLB miss occurs, and the system falls back to slower, software-based address translation, resulting in performance issues. Since the size of the TLB is fixed, the only way to reduce the chance of a TLB miss is to increase the page size.
A huge page is a memory page that is larger than 4Ki. On x86_64 architectures, there are two common huge page sizes: 2Mi and 1Gi. Sizes vary on other architectures. In order to use huge pages, code must be written so that applications are aware of them. Transparent Huge Pages (THP) attempt to automate the management of huge pages without application knowledge, but they have limitations. In particular, they are limited to 2Mi page sizes. THP can lead to performance degradation on nodes with high memory utilization or fragmentation due to defragmenting efforts of THP, which can lock memory pages. For this reason, some applications may be designed to (or recommend) usage of pre-allocated huge pages instead of THP.
In OpenShift Container Platform, applications in a pod can allocate and consume pre-allocated huge pages.
9.2. How huge pages are consumed by apps
Nodes must pre-allocate huge pages in order for the node to report its huge page capacity. A node can only pre-allocate huge pages for a single size.
Huge pages can be consumed through container-level resource requirements using the resource name hugepages-<size>, where size is the most compact binary notation using integer values supported on a particular node. For example, if a node supports 2048KiB page sizes, it exposes a schedulable resource hugepages-2Mi. Unlike CPU or memory, huge pages do not support over-commitment.
apiVersion: v1
kind: Pod
metadata:
  generateName: hugepages-volume-
spec:
  containers:
  - securityContext:
      privileged: true
    image: rhel7:latest
    command:
    - sleep
    - inf
    name: example
    volumeMounts:
    - mountPath: /dev/hugepages
      name: hugepage
    resources:
      limits:
        hugepages-2Mi: 100Mi
        memory: "1Gi"
        cpu: "1"
  volumes:
  - name: hugepage
    emptyDir:
medium: HugePages- 1
- Specify the amount of memory for
hugepagesas the exact amount to be allocated. Do not specify this value as the amount of memory forhugepagesmultiplied by the size of the page. For example, given a huge page size of 2MB, if you want to use 100MB of huge-page-backed RAM for your application, then you would allocate 50 huge pages. OpenShift Container Platform handles the math for you. As in the above example, you can specify100MBdirectly.
Allocating huge pages of a specific size
Some platforms support multiple huge page sizes. To allocate huge pages of a specific size, precede the huge pages boot command parameters with a huge page size selection parameter hugepagesz=<size>. The <size> value must be specified in bytes with an optional scale suffix [kKmMgG]. The default huge page size can be defined with the default_hugepagesz=<size> boot parameter.
Huge page requirements
- Huge page requests must equal the limits. This is the default if limits are specified, but requests are not.
- Huge pages are isolated at a pod scope. Container isolation is planned in a future iteration.
-
EmptyDirvolumes backed by huge pages must not consume more huge page memory than the pod request. -
Applications that consume huge pages via
shmget()withSHM_HUGETLBmust run with a supplemental group that matches proc/sys/vm/hugetlb_shm_group.
Additional resources
9.3. Configuring huge pages
Nodes must pre-allocate huge pages used in an OpenShift Container Platform cluster. Use the Node Tuning Operator to allocate huge pages on a specific node.
Procedure
Label the node so that the Node Tuning Operator knows on which node to apply the tuned profile, which describes how many huge pages should be allocated:
$ oc label node <node_using_hugepages> hugepages=trueCreate a file with the following content and name it
hugepages_tuning.yaml:apiVersion: tuned.openshift.io/v1 kind: Tuned metadata: name: hugepages1 namespace: openshift-cluster-node-tuning-operator spec: profile:2 - data: | [main] summary=Configuration for hugepages include=openshift-node [vm] transparent_hugepages=never [sysctl] vm.nr_hugepages=1024 name: node-hugepages recommend: - match:3 - label: hugepages priority: 30 profile: node-hugepagesCreate the custom
hugepagestuned profile by using thehugepages_tuning.yamlfile:$ oc create -f hugepages_tuning.yamlAfter creating the profile, the Operator applies the new profile to the correct node and allocates huge pages. Check the logs of a tuned pod on a node using huge pages to verify:
$ oc logs <tuned_pod_on_node_using_hugepages> \
    -n openshift-cluster-node-tuning-operator | grep 'applied$' | tail -n1

2019-08-08 07:20:41,286 INFO     tuned.daemon.daemon: static tuning from profile 'node-hugepages' applied
Legal Notice
Copyright © Red Hat
OpenShift documentation is licensed under the Apache License 2.0 (https://www.apache.org/licenses/LICENSE-2.0).
Modified versions must remove all Red Hat trademarks.
Portions adapted from https://github.com/kubernetes-incubator/service-catalog/ with modifications by Red Hat.
Red Hat, Red Hat Enterprise Linux, the Red Hat logo, the Shadowman logo, JBoss, OpenShift, Fedora, the Infinity logo, and RHCE are trademarks of Red Hat, Inc., registered in the United States and other countries.
Linux® is the registered trademark of Linus Torvalds in the United States and other countries.
Java® is a registered trademark of Oracle and/or its affiliates.
XFS® is a trademark of Silicon Graphics International Corp. or its subsidiaries in the United States and/or other countries.
MySQL® is a registered trademark of MySQL AB in the United States, the European Union and other countries.
Node.js® is an official trademark of the OpenJS Foundation.
The OpenStack® Word Mark and OpenStack logo are either registered trademarks/service marks or trademarks/service marks of the OpenStack Foundation, in the United States and other countries and are used with the OpenStack Foundation’s permission. We are not affiliated with, endorsed or sponsored by the OpenStack Foundation, or the OpenStack community.
All other trademarks are the property of their respective owners.