モニタリング
OpenShift Container Platform でのモニタリングスタックの設定および使用
概要
第1章 クラスターモニタリング
1.1. クラスターモニタリングについて
OpenShift Container Platform には、Prometheus オープンソースプロジェクトおよびその幅広いエコシステムをベースとする事前に設定され、事前にインストールされた自己更新型のモニタリングスタックが同梱されます。これはクラスターのモニタリング機能を提供し、クラスター管理者に問題の発生を即時に通知するアラートのセットと Grafana ダッシュボードのセットを提供します。クラスターモニタリングスタックは、OpenShift Container Platform クラスターのモニタリング用のみにサポートされています。
今後の OpenShift Container Platform の更新との互換性を確保するために、指定されたモニタリングスタックのオプションのみを設定することがサポートされます。
1.1.1. スタックコンポーネントおよびモニタリングターゲット
モニタリングスタックには、以下の 3 つのコンポーネントが含まれます。
| コンポーネント | 説明 |
|---|---|
| クラスターモニタリング Operator | OpenShift Container Platform クラスターモニタリング Operator (CMO) は、スタックの中心的なコンポーネントです。これは、デプロイされたモニタリングコンポーネントおよびリソースを制御し、それらを最新の状態に保ちます。 |
| Prometheus Operator | Prometheus Operator (PO) は、Prometheus および Alertmanager インスタンスを作成し、設定し、管理します。また、Kubernetes ラベルのクエリーに基づいてモニタリングターゲットの設定を自動生成します。 |
| Prometheus | Prometheus は、システムおよびサービスのモニタリングシステムであり、モニタリングスタックのベースとなります。 |
| Prometheus アダプター | Prometheus アダプターは、Horizontal Pod Autoscaling のクラスターリソースメトリクス API を公開します。リソースメトリクスは CPU およびメモリーの使用率です。 |
| Alertmanager 0.14.0 | Alertmanager サービスは、Prometheus によって送信されるアラートを処理します。 |
|
|
|
|
|
OpenShift Container Platform 固有のリソースのメトリクスを追加すると、 |
|
|
|
| Thanos Querier | Thanos Querier は集約を有効にし、オプションで単一のマルチテナントインターフェースでのクラスターおよびユーザーワークロードのメトリクスの重複を除去します。 |
| Grafana | Grafana 解析プラットフォームは、メトリクスの分析および可視化のためのダッシュボードを提供します。モニタリングスタックおよびダッシュボードと共に提供される Grafana インスタンスは読み取り専用です。 |
モニタリグスタックのすべてのコンポーネントはスタックによってモニターされ、OpenShift Container Platform の更新時に自動的に更新されます。
スタック自体のコンポーネントに加え、モニタリングスタックは以下をモニターします。
- CoreDNS
- Elasticsearch(ロギングがインストールされている場合)
- etcd
- Fluentd(ロギングがインストールされている場合)
- HAProxy
- イメージレジストリー
- Kubelets
- Kubernetes apiserver
- Kubernetes controller manager
- Kubernetes scheduler
- Metering(メータリングがインストールされている場合)
- OpenShift apiserver
- OpenShift コントロールマネージャー
- Operator Lifecycle Manager (OLM)
- Telemeter クライアント
各 OpenShift Container Platform コンポーネントはそれぞれのモニタリング設定を行います。コンポーネントのモニタリングについての問題は、Bugzilla で一般的なモニタリングコンポーネントではなく、該当するコンポーネントに対してバグを報告してください。
他の OpenShift Container Platform フレームワークのコンポーネントもメトリクスを公開する場合があります。詳細については、それぞれのドキュメントを参照してください。
1.1.2. 次のステップ
1.2. モニタリングスタックの設定
OpenShift Container Platform 4 よりも前のバージョンでは、 Prometheus クラスターモニタリングスタックは Ansible インベントリーファイルで設定されていました。そのため、スタックは利用可能な設定オプションのサブセットを Ansible 変数として公開し、スタックは OpenShift Container Platform のインストール前に設定していました。
OpenShift Container Platform 4 では、Ansible は OpenShift Container Platform をインストールするのに使用される主要なテクノロジーではなくなりました。インストールプログラムは、インストールの前に大幅に限定された設定オプションのみを提供します。ほとんどの OpenShift フレームワークコンポーネント (Prometheus クラスターモニタリングスタックを含む) の設定はインストール後に行われます。
このセクションでは、サポートされている設定内容を説明し、モニタリングスタックの設定方法を示し、いくつかの一般的な設定シナリオを示します。
1.2.1. 前提条件
- モニタリングスタックには、追加のリソース要件があります。詳細は、「Cluster Monitoring Operator のスケーリング」を参照し、十分なリソースがあることを確認してください。
1.2.2. メンテナンスとサポート
OpenShift Container Platform モニタリングの設定は、本書で説明されているオプションを使用して行う方法がサポートされている方法です。サポートされていない他の設定は使用しないでください。設定のパラダイムが Prometheus リリース間で変更される可能性があり、このような変更には、設定のすべての可能性が制御されている場合のみ適切に対応できます。本セクションで説明されている設定以外の設定を使用する場合、cluster-monitoring-operator が差分を調整するため、変更内容は失われます。Operator はデフォルトで定義された状態へすべてを元に戻します。
明示的にサポート対象外とされているケースには、以下が含まれます。
-
追加の
ServiceMonitorオブジェクトをopenshift-*namespace に作成する。これにより、クラスターモニタリング Prometheus インスタンスの収集ターゲットが拡張されます。これは、対応不可能な競合および負荷の差異を生じさせる可能性があるため、Prometheus のセットアップが不安定になる可能性があります。 -
予期しない
ConfigMapオブジェクトまたはPrometheusRuleオブジェクトの作成。これにより、クラスターモニタリング Prometheus インスタンスに追加のアラートおよび記録ルールが組み込まれます。 - スタックのリソースの変更。Prometheus Monitoring Stack スタックは、そのリソースが常に期待される状態にあることを確認します。これらが変更される場合、スタックはこれらをリセットします。
- 目的に合わせてスタックのリソースを使用する。Prometheus クラスターモニタリングスタックによって作成されるリソースは、後方互換性の保証がないために他のリソースで使用されることは意図されていません。
- クラスターモニタリング Operator によるモニタリングスタックの調整を停止する。
- 新規アラートルールの追加。
- モニタリングスタック Grafana インスタンスの変更。
1.2.3. クラスターモニタリング ConfigMap の作成
OpenShift Container Platform モニタリングスタックを設定するには、クラスターモニタリング ConfigMap を作成する必要があります。
前提条件
- cluster-admin ロールを持つユーザーとしてクラスターにアクセスできる。
-
OpenShift CLI (
oc) がインストールされている。
手順
cluster-monitoring-configConfigMap オブジェクトが存在するかどうかを確認します。$ oc -n openshift-monitoring get configmap cluster-monitoring-configConfigMap が存在しない場合:
以下の YAML マニフェストを作成します。以下の例では、このファイルは
cluster-monitoring-config.yamlという名前です。apiVersion: v1 kind: ConfigMap metadata: name: cluster-monitoring-config namespace: openshift-monitoring data: config.yaml: |設定を適用して ConfigMap を作成します。
$ oc apply -f cluster-monitoring-config.yaml
1.2.4. クラスターモニタリングスタックの設定
ConfigMap を使用して Prometheus クラスターモニタリングスタックを設定することができます。ConfigMap はクラスターモニタリング Operator を設定し、その後にスタックのコンポーネントが設定されます。
前提条件
-
cluster-adminロールを持つユーザーとしてクラスターにアクセスできます。 - OpenShift CLI (oc) がインストールされている。
-
cluster-monitoring-configConfigMap オブジェクトを作成している。
手順
cluster-monitoring-configConfigMap の編集を開始します。$ oc -n openshift-monitoring edit configmap cluster-monitoring-config設定を、
data/config.yamlの下に値とキーのペア<component_name>: <component_configuration>として配置します。apiVersion: v1 kind: ConfigMap metadata: name: cluster-monitoring-config namespace: openshift-monitoring data: config.yaml: | <component>: <configuration_for_the_component><component>および<configuration_for_the_component>を随時置き換えます。たとえば、Prometheus の Persistent Volume Claim (永続ボリューム要求、PVC) を設定するために、この ConfigMap を作成します。
apiVersion: v1 kind: ConfigMap metadata: name: cluster-monitoring-config namespace: openshift-monitoring data: config.yaml: | prometheusK8s: volumeClaimTemplate: spec: storageClassName: fast volumeMode: Filesystem resources: requests: storage: 40Giここで、prometheusK8s は Prometheus コンポーネントを定義し、続く行ではその設定を定義します。
- 変更を適用するためにファイルを保存します。新規設定の影響を受けた Pod は自動的に再起動されます。
追加リソース
-
cluster-monitoring-configConfigMap オブジェクトを作成する方法については、「Creating a cluster monitoring ConfigMap」を参照してください。
1.2.5. 設定可能なモニタリングコンポーネント
以下の表は、設定可能なモニタリングコンポーネントと、ConfigMap でコンポーネントを指定するために使用されるキーを示しています。
| コンポーネント | キー |
|---|---|
| Prometheus Operator |
|
| Prometheus |
|
| Alertmanager 0.14.0 |
|
| kube-state-metrics |
|
| openshift-state-metrics |
|
| Grafana |
|
| Telemeter クライアント |
|
| Prometheus アダプター |
|
この一覧では、Prometheus および Alertmanager のみが多数の設定オプションを持ちます。通常、その他のすべてのコンポーネントは指定されたノードにデプロイされるように nodeSelector フィールドのみを提供します。
1.2.6. モニタリングコンポーネントの異なるノードへの移動
モニタリングスタックコンポーネントのいずれかを指定されたノードに移動できます。
前提条件
-
cluster-adminロールを持つユーザーとしてクラスターにアクセスできます。 - OpenShift CLI (oc) がインストールされている。
-
cluster-monitoring-configConfigMap オブジェクトを作成している。
手順
cluster-monitoring-configConfigMap の編集を開始します。$ oc -n openshift-monitoring edit configmap cluster-monitoring-configコンポーネントの
nodeSelector制約をdata/config.yamlに指定します。apiVersion: v1 kind: ConfigMap metadata: name: cluster-monitoring-config namespace: openshift-monitoring data: config.yaml: | <component>: nodeSelector: <node_key>: <node_value> <node_key>: <node_value> <...><component>を適宜置き換え、<node_key>: <node_value>を、宛先ノードを指定するキーと値のペアのマップに置き換えます。通常は、単一のキーと値のペアのみが使用されます。コンポーネントは、指定されたキーと値のペアのそれぞれをラベルとして持つノードでのみ実行できます。ノードには追加のラベルを持たせることもできます。
たとえば、コンポーネントを
foo: barというラベルが付けられたノードに移動するには、以下を使用します。apiVersion: v1 kind: ConfigMap metadata: name: cluster-monitoring-config namespace: openshift-monitoring data: config.yaml: | prometheusOperator: nodeSelector: foo: bar prometheusK8s: nodeSelector: foo: bar alertmanagerMain: nodeSelector: foo: bar kubeStateMetrics: nodeSelector: foo: bar grafana: nodeSelector: foo: bar telemeterClient: nodeSelector: foo: bar k8sPrometheusAdapter: nodeSelector: foo: bar openshiftStateMetrics: nodeSelector: node-role.kubernetes.io/infra: ""- 変更を適用するためにファイルを保存します。新しい設定の影響を受けるコンポーネントは新しいノードに自動的に移動します。
追加リソース
-
cluster-monitoring-configConfigMap オブジェクトを作成する方法については、「Creating a cluster monitoring ConfigMap」を参照してください。 - ノードセレクターの使用についての詳細は、「Placing pods on specific nodes using node selectors」を参照してください。
-
nodeSelector制約についての詳細は、Kubernetes ドキュメント を参照してください。
1.2.7. モニタリングコンポーネントへの容認 (Toleration) の割り当て
容認をモニタリングスタックのコンポーネントに割り当て、それらをテイントされたノードに移動することができます。
前提条件
-
cluster-adminロールを持つユーザーとしてクラスターにアクセスできます。 - OpenShift CLI (oc) がインストールされている。
-
cluster-monitoring-configConfigMap オブジェクトを作成している。
手順
cluster-monitoring-configConfigMap の編集を開始します。$ oc -n openshift-monitoring edit configmap cluster-monitoring-configコンポーネントの
tolerationsを指定します。apiVersion: v1 kind: ConfigMap metadata: name: cluster-monitoring-config namespace: openshift-monitoring data: config.yaml: | <component>: tolerations: <toleration_specification><component>および<toleration_specification>を随時置き換えます。たとえば、
oc adm taint nodes node1 key1=value1:NoScheduleのテイントにより、スケジューラーがfoo: barノードに Pod を配置するのを防ぎます。alertmanagerMainコンポーネントを、そのテイントを無視して、foo: barにalertmanagerMainを配置するには、通常以下の容認を使用します。apiVersion: v1 kind: ConfigMap metadata: name: cluster-monitoring-config namespace: openshift-monitoring data: config.yaml: | alertmanagerMain: nodeSelector: foo: bar tolerations: - key: "key1" operator: "Equal" value: "value1" effect: "NoSchedule"- 変更を適用するためにファイルを保存します。新しいコンポーネントの配置設定が自動的に適用されます。
追加リソース
-
cluster-monitoring-configConfigMap オブジェクトを作成する方法については、「Creating a cluster monitoring ConfigMap」を参照してください。 - テイントおよび容認 (Toleration) については、OpenShift Container Platform ドキュメントを参照してください。
- テイントおよび容認 (Toleration) については、Kubernetes ドキュメントを参照してください。
1.2.8. 永続ストレージの設定
クラスターモニタリングを永続ストレージと共に実行すると、メトリクスは永続ボリューム (PV) に保存され、Pod の再起動または再作成後も維持されます。これは、メトリクスデータまたはアラートデータをデータ損失から保護する必要がある場合に適しています。実稼働環境では、永続ストレージを設定することを強く推奨します。IO デマンドが高いため、ローカルストレージを使用することが有利になります。
「設定可能な推奨のストレージ技術」を参照してください。
1.2.9. 前提条件
- ディスクが一杯にならないように、十分なローカル永続ストレージを確保します。必要な永続ストレージは Pod 数によって異なります。永続ストレージのシステム要件については、「Prometheus データベースのストレージ要件」を参照してください。
- Persistent Volume Claime (永続ボリューム要求、PVC) で要求される永続ボリューム (PV) が利用できる状態にあることを確認する必要があります。各レプリカに 1 つの PV が必要です。 Prometheus には 2 つのレプリカがあり、Alertmanager には 3 つのレプリカがあるため、モニタリングスタック全体をサポートするには、合計で 5 つの PV が必要になります。PV は、ローカルストレージ Operator で利用できる必要があります。動的にプロビジョニングされるストレージを有効にすると、この設定は適用されません。
- ストレージのブロックタイプを使用します。
- ローカル永続ストレージを設定します。
1.2.9.1. ローカル Persistent Volume Claim(永続ボリューム要求、PVC)の設定
Prometheus または Alertmanager で永続ボリューム (PV) を使用するには、まず Persistent Volume Claim (永続ボリューム要求、PVC) を設定する必要があります。
前提条件
-
cluster-adminロールを持つユーザーとしてクラスターにアクセスできます。 - OpenShift CLI (oc) がインストールされている。
-
cluster-monitoring-configConfigMap オブジェクトを作成している。
手順
cluster-monitoring-configConfigMap を編集します。$ oc -n openshift-monitoring edit configmap cluster-monitoring-configコンポーネントの PVC 設定を
data/config.yamlの下に配置します。apiVersion: v1 kind: ConfigMap metadata: name: cluster-monitoring-config namespace: openshift-monitoring data: config.yaml: | <component>: volumeClaimTemplate: metadata: name: <PVC_name_prefix> spec: storageClassName: <storage_class> resources: requests: storage: <amount_of_storage>volumeClaimTemplateの指定方法については、PersistentVolumeClaims についての Kubernetes ドキュメント を参照してください。たとえば、Prometheus のローカル永続ストレージを要求する PVC を設定するには、以下を使用します。
apiVersion: v1
kind: ConfigMap
metadata:
  name: cluster-monitoring-config
  namespace: openshift-monitoring
data:
  config.yaml: |
    prometheusK8s:
      volumeClaimTemplate:
        metadata:
          name: localpvc
        spec:
          storageClassName: local-storage
          resources:
            requests:
              storage: 40Gi
上記の例では、ローカルストレージ Operator によって作成されるストレージクラスは
local-storageと呼ばれます。Alertmanager のローカル永続ストレージを要求する PVC を設定するには、以下を実行します。
apiVersion: v1 kind: ConfigMap metadata: name: cluster-monitoring-config namespace: openshift-monitoring data: config.yaml: | alertmanagerMain: volumeClaimTemplate: metadata: name: localpvc spec: storageClassName: local-storage resources: requests: storage: 40Gi- 変更を適用するためにファイルを保存します。新規設定の影響を受けた Pod は自動的に再起動され、新規ストレージ設定が適用されます。
1.2.9.2. Prometheus メトリクスデータの保持期間の編集
デフォルトで、Prometheus クラスターモニタリングスタックは、Prometheus データの保持期間を 15 日間に設定します。この保持期間は、データ削除のタイミングを調整するために変更できます。
前提条件
-
cluster-adminロールを持つユーザーとしてクラスターにアクセスできます。 - OpenShift CLI (oc) がインストールされている。
-
cluster-monitoring-configConfigMap オブジェクトを作成している。
手順
cluster-monitoring-configConfigMap の編集を開始します。$ oc -n openshift-monitoring edit configmap cluster-monitoring-config保持期間の設定を
data/config.yamlに配置します。apiVersion: v1 kind: ConfigMap metadata: name: cluster-monitoring-config namespace: openshift-monitoring data: config.yaml: | prometheusK8s: retention: <time_specification><time_specification>を、ms(ミリ秒)、s(秒)、m(分)、h(時間)、d(日)、w(週)、またはy(年) が直後に続く数字に置き換えます。たとえば、保持期間を 24 時間に設定するには、以下を使用します。
apiVersion: v1 kind: ConfigMap metadata: name: cluster-monitoring-config namespace: openshift-monitoring data: config.yaml: | prometheusK8s: retention: 24h- 変更を適用するためにファイルを保存します。新規設定の影響を受けた Pod は自動的に再起動されます。
追加リソース
-
cluster-monitoring-configConfigMap オブジェクトを作成する方法については、「Creating a cluster monitoring ConfigMap」を参照してください。 - 永続ストレージについて
- ストレージの最適化
1.2.10. Alertmanager の設定
Prometheus Alertmanager は、以下を含む受信アラートを管理するコンポーネントです。
- アラートの非通知 (silence)
- アラートの抑制 (inhibition)
- アラートの集約 (aggregation)
- アラートの安定した重複排除
- アラートのグループ化
- メール、PagerDuty、および HipChat などの受信手段によるグループ化されたアラート通知の送信
1.2.10.1. Alertmanager のデフォルト設定
OpenShift Container Platform Monitoring Alertmanager クラスターのデフォルト設定:
global:
  resolve_timeout: 5m
route:
  group_wait: 30s
  group_interval: 5m
  repeat_interval: 12h
  receiver: default
  routes:
  - match:
      alertname: Watchdog
    repeat_interval: 5m
    receiver: watchdog
receivers:
- name: default
- name: watchdog
OpenShift Container Platform モニタリングには、継続的に実行される Watchdog アラートが同梱されます。Alertmanager は、たとえば PagerDuty などの通知プロバイダーに、Watchdog アラートの通知を繰り返し送信します。プロバイダーは通常、Watchdog アラートの受信を停止する際に管理者に通知するよう設定されます。このメカニズムは、Prometheus の継続的な運用、および Alertmanager と通知プロバイダー間の継続的な通信を可能にします。
1.2.10.2. カスタム Alertmanager 設定の適用
alertmanager-main シークレットを openshift-monitoring namespace 内で編集して、デフォルトの Alertmanager 設定を上書きできます。
前提条件
-
JSON データを処理するための
jqツールがインストールされていること
手順
現在アクティブな Alertmanager 設定をファイル
alertmanager.yamlに出力します。$ oc -n openshift-monitoring get secret alertmanager-main --template='{{ index .data "alertmanager.yaml" }}' |base64 -d > alertmanager.yamlファイル
alertmanager.yamlの設定を新規設定に変更します。global: resolve_timeout: 5m route: group_wait: 30s group_interval: 5m repeat_interval: 12h receiver: default routes: - match: alertname: Watchdog repeat_interval: 5m receiver: watchdog - match: service: <your_service>1 routes: - match: <your_matching_rules>2 receiver: <receiver>3 receivers: - name: default - name: watchdog - name: <receiver> <receiver_configuration>たとえば、この一覧では通知用に PagerDuty を設定しています。
global:
  resolve_timeout: 5m
route:
  group_wait: 30s
  group_interval: 5m
  repeat_interval: 12h
  receiver: default
  routes:
  - match:
      alertname: Watchdog
    repeat_interval: 5m
    receiver: watchdog
  - match: service: example-app routes: - match: severity: critical receiver: team-frontend-page
receivers:
- name: default
- name: watchdog
- name: team-frontend-page pagerduty_configs: - service_key: "your-key"
この設定では、
example-appサービスで発生する、重大度がcriticalのアラートが、team-frontend-pageレシーバーを使用して送信されます。 つまり、これらのアラートは選択された送信先に対して設定されます。新規設定をファイルで適用します。
$ oc -n openshift-monitoring create secret generic alertmanager-main --from-file=alertmanager.yaml --dry-run -o=yaml | oc -n openshift-monitoring replace secret --filename=-
追加リソース
- PagerDuty についての詳細は、PagerDuty の公式サイトを参照してください。
-
service_keyを取得する方法については、『PagerDuty Prometheus Integration Guide 』を参照してください。 - 各種のアラートレシーバー経由でアラートを設定する方法については、「Alertmanager configuration」を参照してください。
1.2.10.3. アラートルール
デフォルトで、OpenShift Container Platform クラスター モニタリングには事前に定義されたアラートルールのセットが同梱されます。
以下に留意してください。
- デフォルトのアラートルールは OpenShift Container Platform クラスター用に使用され、それ以外の目的では使用されません。たとえば、クラスターの永続ボリュームについてのアラートを取得できますが、カスタム namespace の永続ボリュームについてのアラートは取得できません。
- 現時点で、カスタムアラートルールを追加することはできません。
- 一部のアラートルールには同じ名前が付けられています。これは意図的な理由によるものです。それらは同じイベントについてのアラートを送信しますが、それぞれ異なるしきい値、重大度、およびそれらの両方が設定されます。
- 抑制ルールを使用すると、高い重大度のアラートが発生する場合に重大度の低いアラートが抑制されます。
1.2.10.4. 有効なアラートルールのアクションの一覧表示
現時点でクラスターに適用されるアラートルールを一覧表示できます。
手順
必要なポート転送を設定します。
$ oc -n openshift-monitoring port-forward svc/prometheus-operated 9090有効なアラートルールおよびそれらのプロパティーが含まれる JSON オブジェクトを取得します。
$ curl -s http://localhost:9090/api/v1/rules | jq '[.data.groups[].rules[] | select(.type=="alerting")]'
[
  {
    "name": "ClusterOperatorDown",
    "query": "cluster_operator_up{job=\"cluster-version-operator\"} == 0",
    "duration": 600,
    "labels": {
      "severity": "critical"
    },
    "annotations": {
      "message": "Cluster operator {{ $labels.name }} has not been available for 10 mins. Operator may be down or disabled, cluster will not be kept up to date and upgrades will not be possible."
    },
    "alerts": [],
    "health": "ok",
    "type": "alerting"
  },
  {
    "name": "ClusterOperatorDegraded",
    ...
追加リソース
- Alertmanager ドキュメントを参照してください。
1.2.11. 次のステップ
- クラスターアラートの管理
- リモート正常性レポートを確認し、必要な場合はこれをオプトアウトします。
1.3. クラスターアラートの管理
OpenShift Container Platform 4.3 は、Alertmanager の Web インターフェースを提供します。これを使用してアラートを管理できます。 このセクションでは、アラート UI を使用する方法について説明します。
1.3.1. アラート UI の内容
このセクションでは、アラート UI、つまり Alertmanager の Web インターフェースの内容について説明します。
アラート UI の主なページとして、Alerts、Silences、および YAML というページがあります。
Alerts ページは、OpenShift Container Platform Web コンソールの Monitoring → Alerting → Alerts をクリックしてアクセスできます。
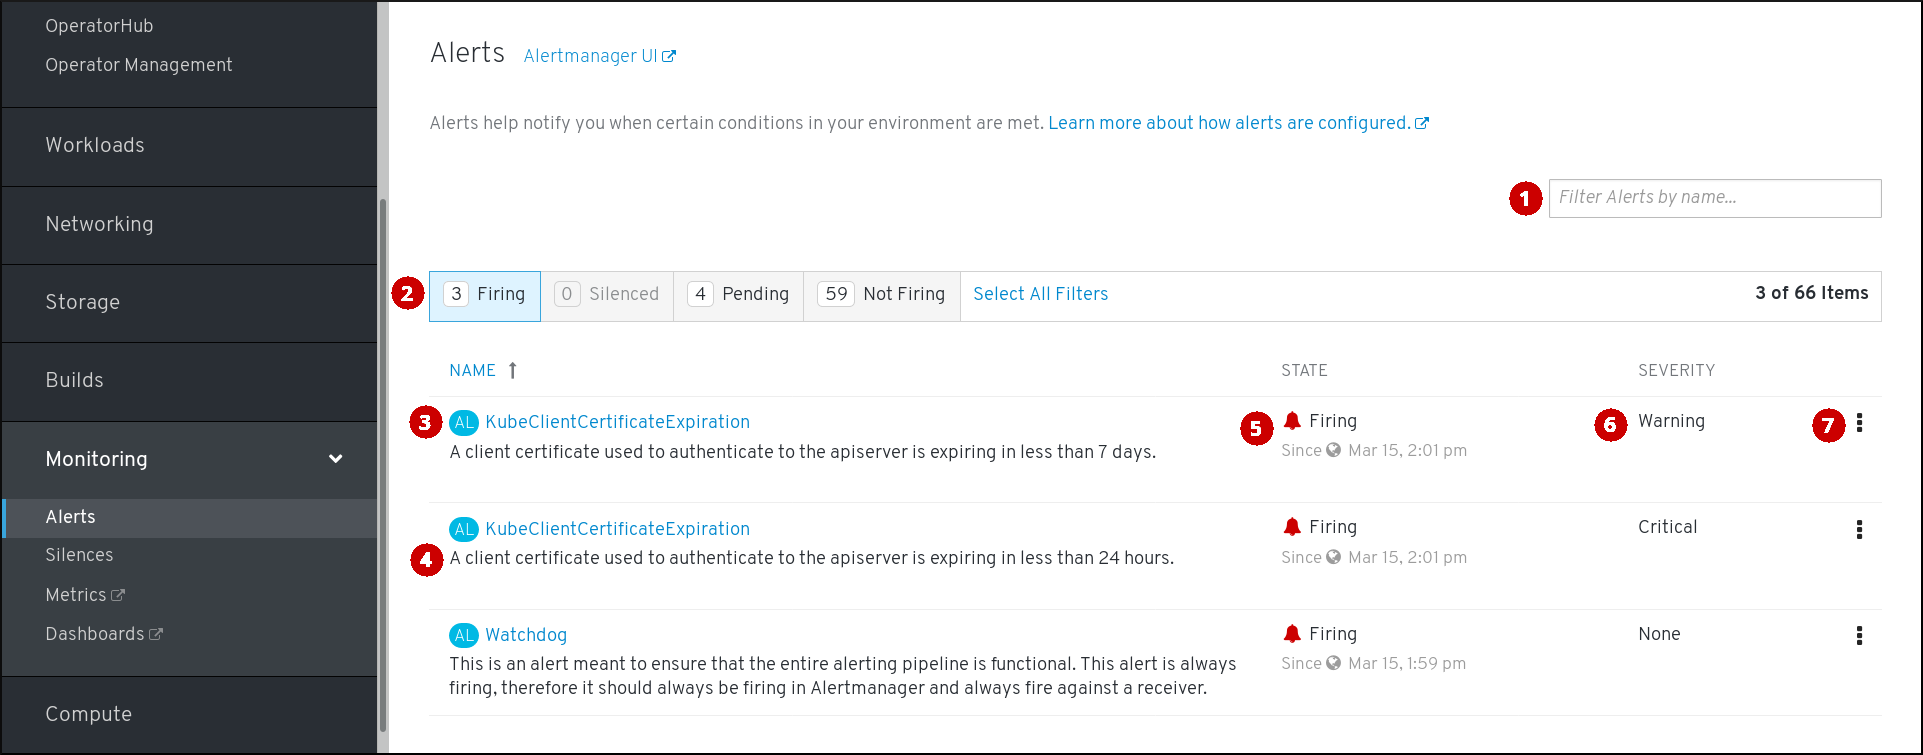
- 名前によるアラートのフィルター。
- 状態によるアラートのフィルター。アラートを実行するには、一部のアラートにおいて、タイムアウトの間に特定の条件が true である必要があります。アラートの条件が現時点で true であるが、タイムアウトに達していない場合、このアラートは Pending 状態になります。
- アラート名。
- アラートの説明。
- アラートの現在の状態と、アラートがこの状態に切り替わった時。
- アラートの重大度レベルの値。
- アラートに関して実行できるアクション。
Silences ページは、OpenShift Container Platform Web コンソールの Monitoring → Alerting → Silences をクリックしてアクセスできます。
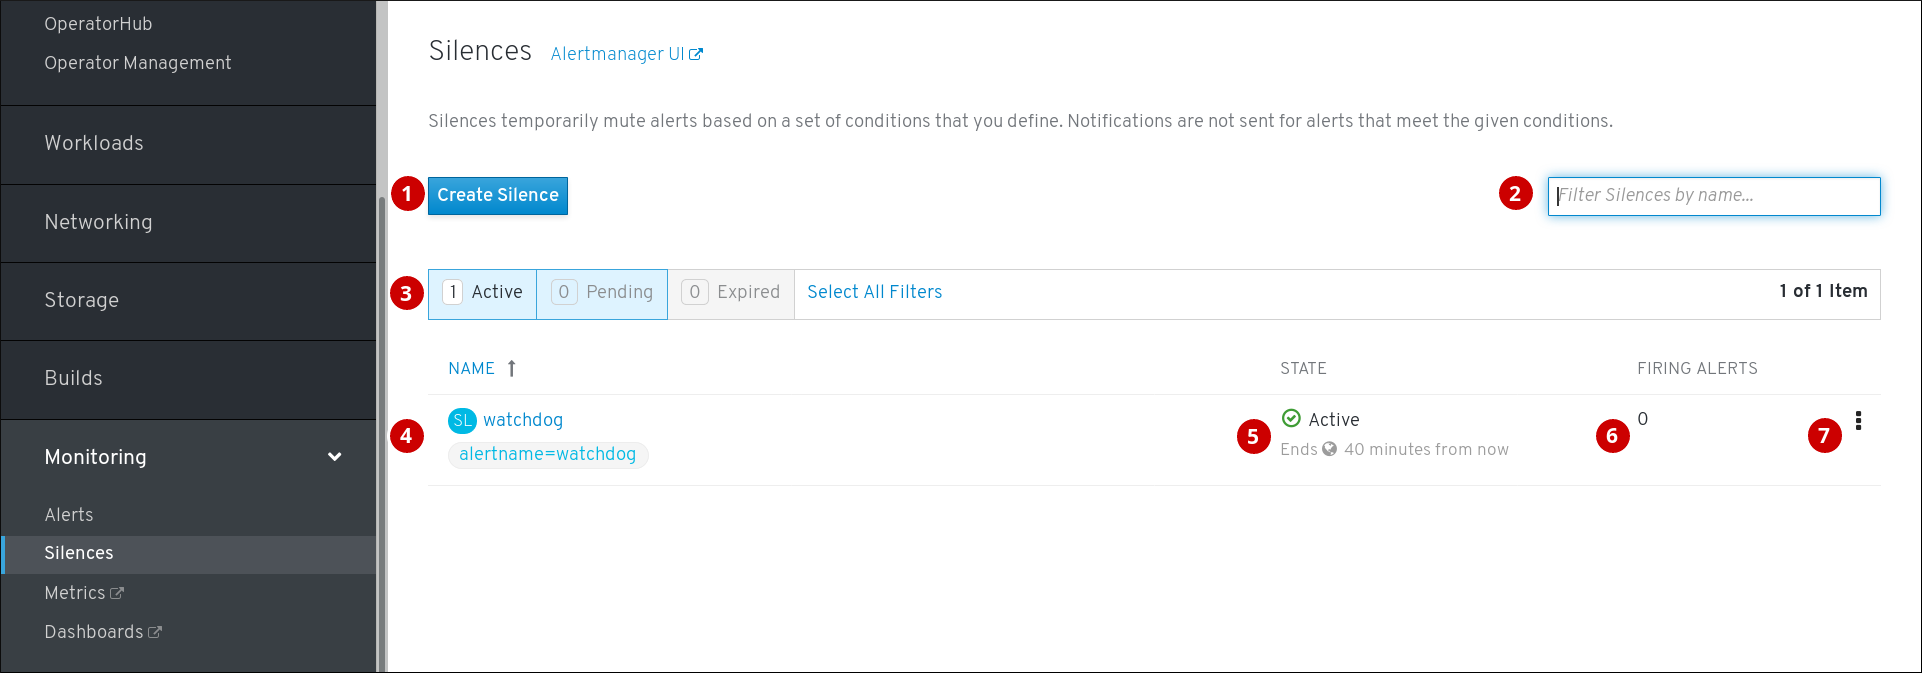
- アラートのサイレンスの作成。
- 名前によるサイレンスのフィルター。
- 状態によるサイレンスのフィルター。サイレンスが保留中の場合、これは後で開始するようにスケジュールされているため、アクティブな状態ではありません。また、サイレンスの期間が過ぎると、終了時間に達したためにアクティブでなくなります。
- サイレンスの説明。これには、一致するアラートの仕様も含まれます。
- サイレンスの現在の状態。サイレンスがアクティブな場合は終了時間を示し、保留状態の場合は、開始時間を示します。
- サイレンス機能によってサイレンスにされているアラート数。
- サイレンスに関して実行できるアクション。
YAML ページには、OpenShift Container Platform Web コンソールの Monitoring → Alerting → YAML をクリックしてアクセスできます。
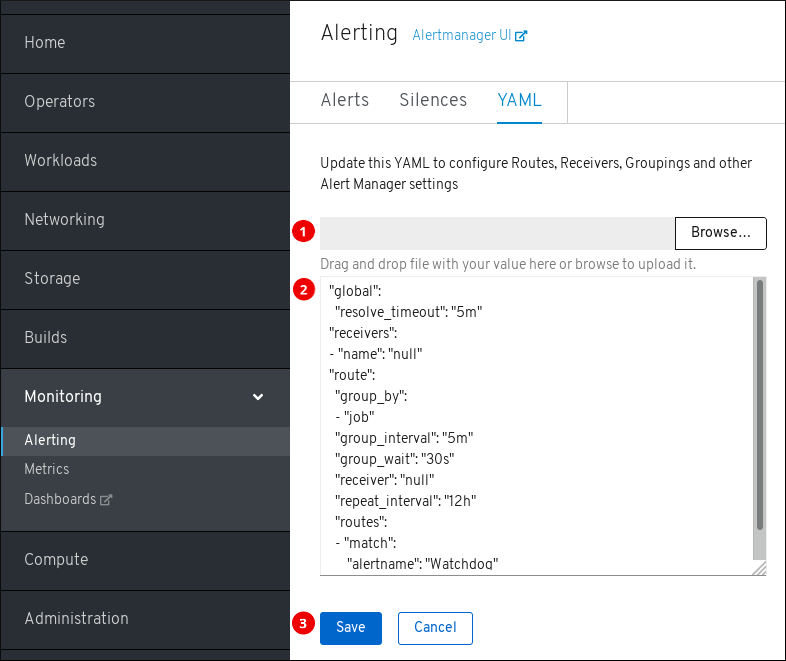
- Alertmanager 設定でファイルをアップロードします。
- 現在の Alertmanager 設定を検査し、これを編集します。
- 更新された Alertmanager 設定を保存します。
また、これらのページのそれぞれのタイトルの横には、古い Alertmanager インターフェースへのリンクがあります。
追加リソース
- Alertmanager 設定の変更については、「Configuring Alertmanager」を参照してください。
1.3.2. アラートおよびアラートルールについての情報の取得
アラートを見つけ、アラートおよびその規定するアラートルールについての情報を表示できます。
手順
- OpenShift Container Platform Web コンソールを開き、Monitoring → Alerting → Alerts ページに移動します。
- オプション: Filter Alerts by nameフィールドを使用して、名前でアラートをフィルター します。
- オプション: 1 つ以上の状態ボタン Firing、Silenced、Pending、Not firing を使用して、状態でアラートをフィルターします。
- オプション: 1 つ以上の Name、State、および Severity 列ヘッダーをクリックして、アラートを並び替えます。
アラートの表示後に、アラートまたはアラートを規定するアラートルールの詳細のいずれかを表示できます。
アラートの詳細を表示するには、アラートの名前をクリックします。これは、アラートの詳細を含むページです。
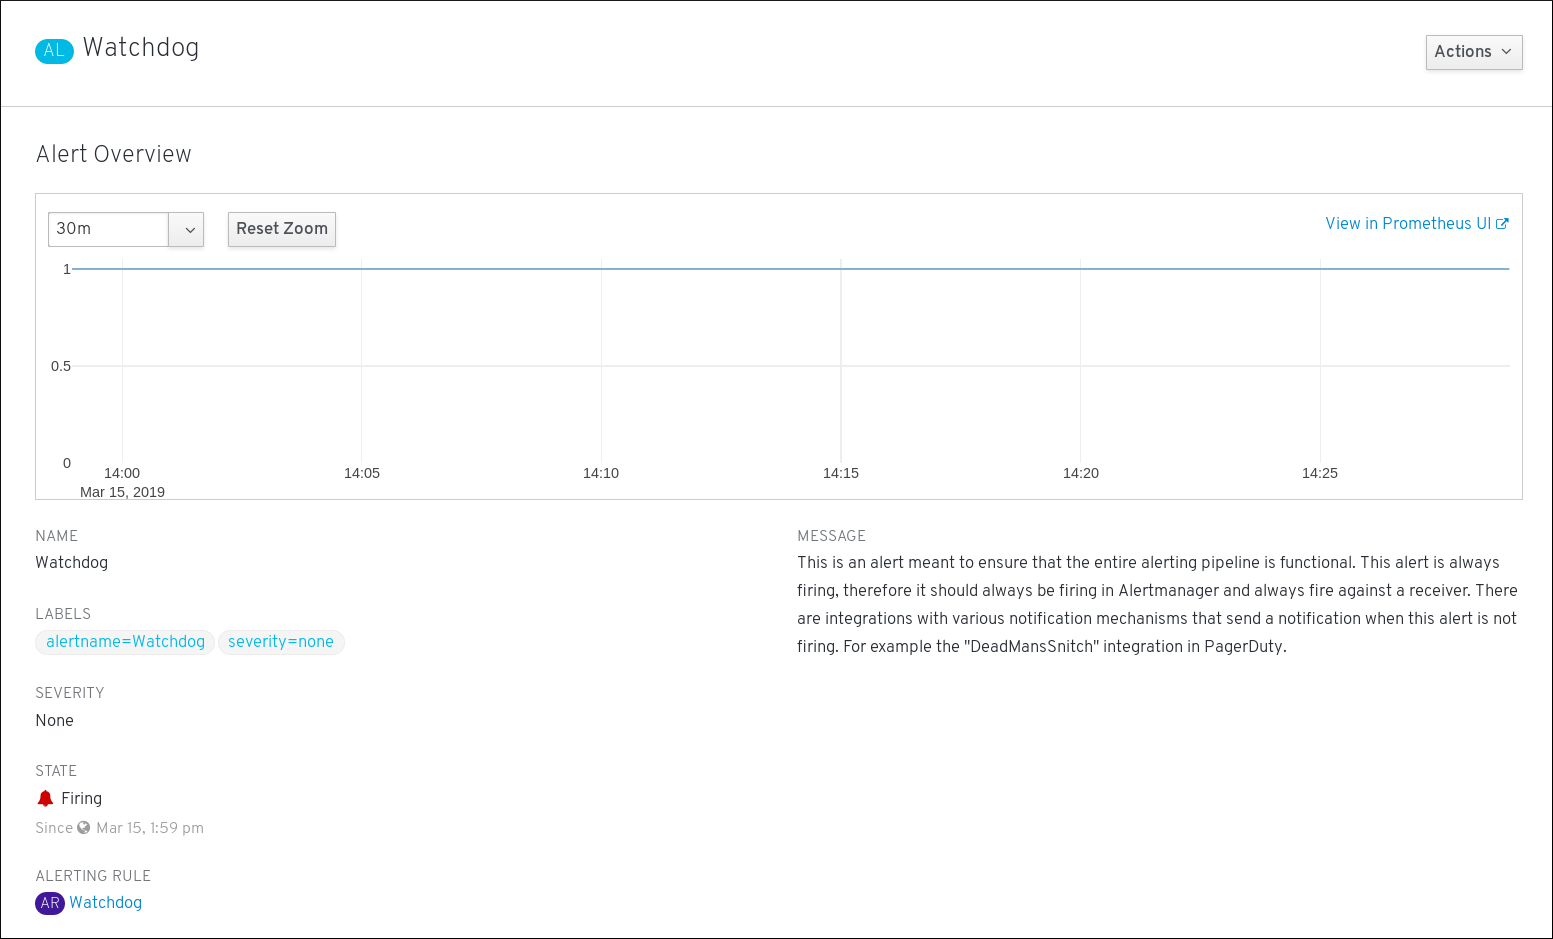
このページには、アラートの時系列を示すグラフがあります。また、以下をはじめとするアラートについての情報も含まれます。
- アラートを規定するアラートルールへのリンク
- アラートの説明。
アラートルールの詳細を表示するには、最後の列のボタンをクリックし、View Alerting Rule を選択します。これは、アラートルールの詳細が含まれるページです。
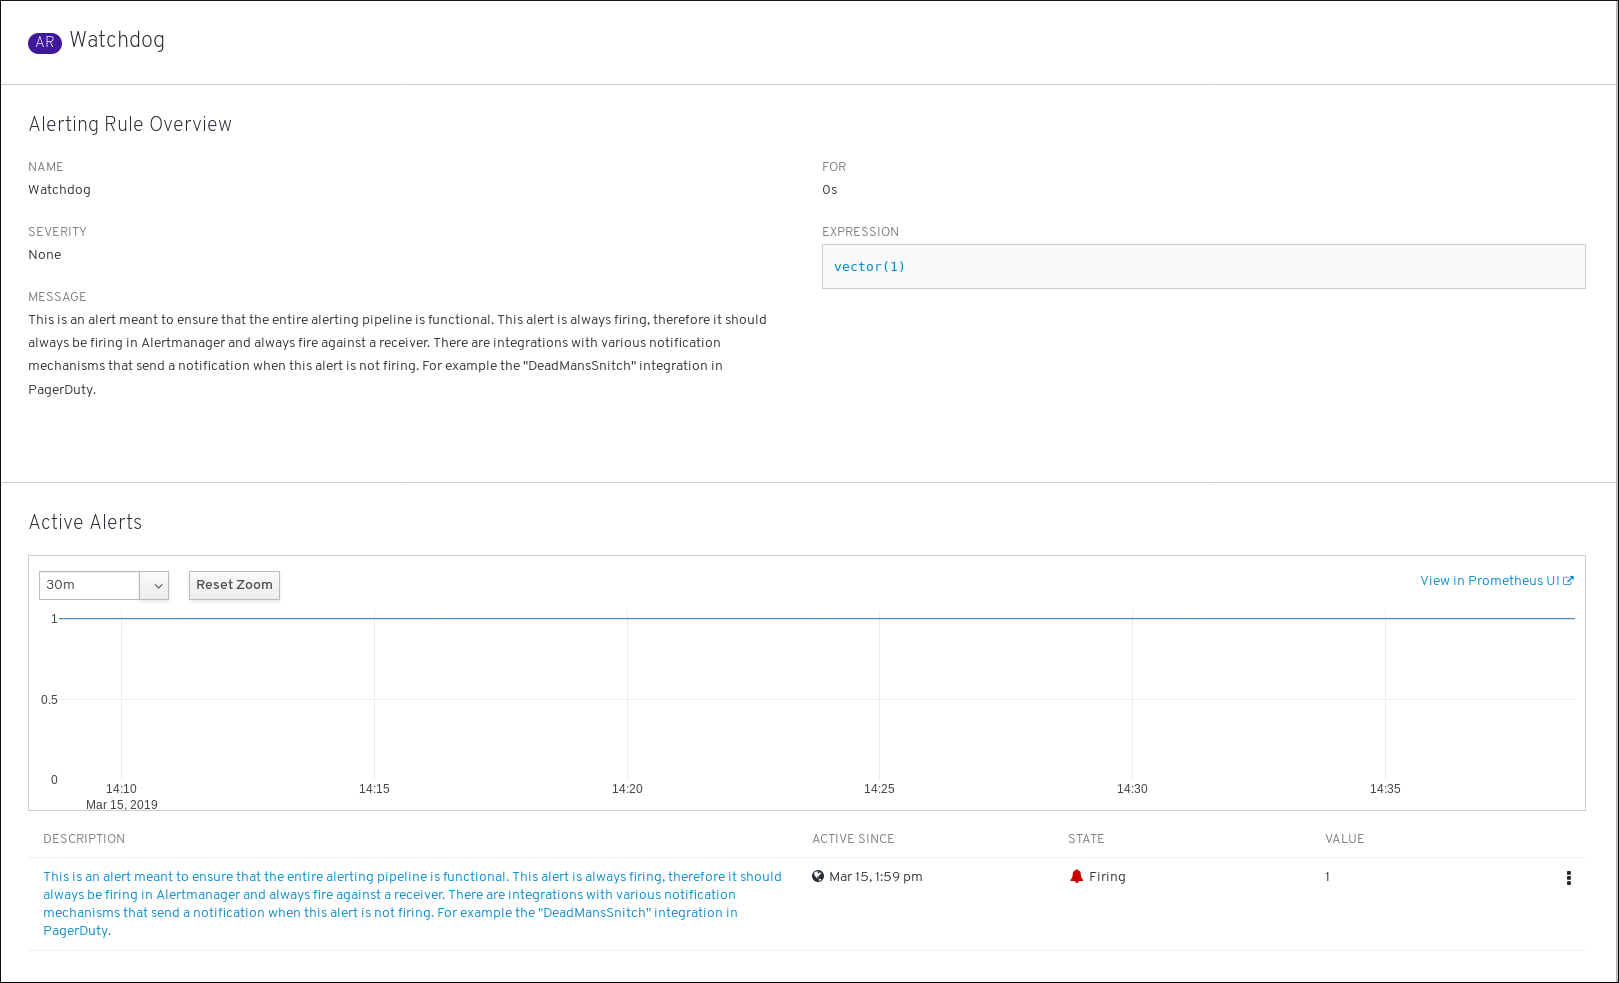
このページには、以下をはじめとするアラートルールについての情報が含まれます。
- アラートルール名、重大度、および説明
- アラートを発生させるための条件を定義する式
- アラートを発生させるための条件が true である期間
- アラートルールに規定される各アラートのグラフ。 アラートを発生させる際に使用する値が表示されます。
- アラートルールで規定されるすべてのアラートについての表
1.3.3. アラートをサイレンスにする
特定のアラート、または定義する仕様に一致するアラートのいずれかをサイレンスにすることができます。
手順
アラート仕様を作成してアラートのセットをサイレンスにするには、以下を実行します。
- OpenShift Container Platform Web コンソールの Monitoring → Alerting → Silences ページに移動します。
- Create Silence をクリックします。
- Create Silence フォームにデータを設定します。
- サイレンスを作成するには、Create をクリックします。
特定のアラートをサイレンスにするには、以下を実行します。
- OpenShift Container Platform Web コンソールの Monitoring → Alerting → Alerts ページに移動します。
- サイレンスにする必要のあるアラートについて、最後の列のボタンをクリックし、Silence Alert をクリックします。Create Silence フォームが、選択したアラートの事前にデータが設定された仕様と共に表示されます。
- オプション: サイレンスを変更します。
- サイレンスを作成するには、Create をクリックします。
1.3.4. サイレンスについての情報の取得
サイレンスを検索し、その詳細状態を表示できます。
手順
- OpenShift Container Platform Web コンソールを開き、Monitoring → Alerting → Silences ページに移動します。
- オプション: Filter Silences by name フィールドを使用して、名前でサイレンスをフィルターします。
- オプション: 1 つ以上の状態ボタン Active、Pending、Expired を使用して、状態でサイレンスをフィルターします。
- オプション: 1 つ以上の Name、State、および Firing alerts 列ヘッダーをクリックしてサイレンスを並び替えます。
サイレンスの表示後、その名前をクリックして、以下をはじめとする詳細情報を確認します。
- アラート仕様
- 状態
- 開始時間
- 終了時間
- 発生するアラートの数および一覧
1.3.5. サイレンスの編集
サイレンスは編集することができます。 これにより、既存のサイレンスが期限切れとなり、変更された設定で新規のサイレンスが作成されます。
手順
- Monitoring → Alerting → Silences ページに移動します。
変更するサイレンスについて、最後の列のボタンをクリックし、Edit silence をクリックします。
または、特定のサイレンスについて、 Silence Overview 画面で Actions → Edit Silence をクリックできます。
- Edit Silence 画面では、変更を入力し、Save ボタンをクリックします。これにより、既存のサイレンスが期限切れとなり、選択された設定でサイレンスが作成されます。
1.3.6. 有効期限切れにするサイレンス
サイレンスは有効期限切れにすることができます。サイレンスはいったん期限切れになると、永久に無効にされます。
手順
- Monitoring → Alerting → Silences ページに移動します。
期限切れにするサイレンスについては、最後の列のボタンをクリックし、Expire Silence をクリックします。
または、特定のサイレンスについて、Silence Overview ページで Actions → Expire Silence ボタンをクリックできます。
- Expire Silence をクリックして確定します。これにより、サイレンスが期限切れになります。
1.3.7. 次のステップ
1.4. クラスターメトリクスの検査
OpenShift Container Platform 4.3 は、Prometheus への Web インターフェースを提供します。 これにより、Prometheus のクエリー言語 (PromQL) のクエリーを実行し、プロットに可視化されるメトリクスを検査できます。この機能により、クラスターの状態に関する詳細な概要が提供され、問題のトラブルシューティングが可能になります。
1.4.1. メトリクス UI の内容
このセクションでは、メトリクス UI、Prometheus への Web インターフェースの内容について表示し、説明します。
Metricsページは、OpenShift Container Platform Web コンソールの Monitoring → Metrics をクリックしてアクセスできます。
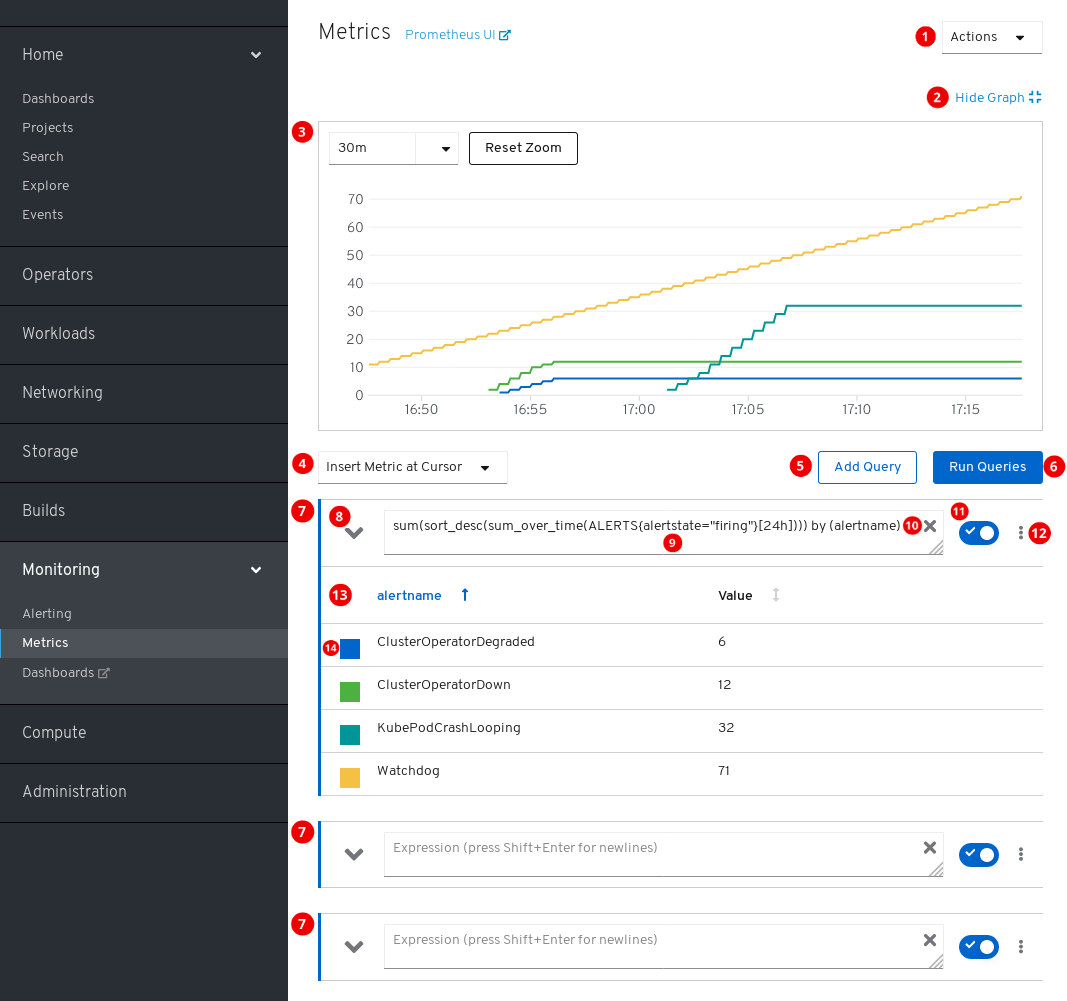
アクション。
- クエリーを追加します。
- すべてのクエリーテーブルを展開するか、または折りたたみます。
- すべてのクエリーを削除します。
- プロットを非表示にします。
- 対話式のプロット。
- 利用可能なメトリクスのカタログ。
- クエリーを追加します。
- クエリーを実行します。
- クエリーフォーム。
- フォームを展開または折りたたみます。
- クエリー。
- クエリーをクリアします。
- クエリーを有効または無効にします。
特定のクエリーのアクション。
- クエリーを有効または無効にします。
- プロットからすべてのクエリーのシリーズを表示または非表示にします。
- クエリーを削除します。
- クエリーのメトリクステーブル。
- メトリクスのグラフに割り当てられた色。四角をクリックして、メトリクスのグラフを表示するか、非表示にします。
また、ページのタイトルの横には古い Prometheus インターフェースへのリンクもあります。
1.4.2. メトリクスクエリーの実行
メトリクスを使用するには、1 つまたは複数の Prometheus クエリー言語 (PromQL) クエリーを入力します。
手順
- OpenShift Container Platform Web コンソールを開き、Monitoring → Metrics ページに移動します。
クエリーフィールドに PromQL クエリーを入力します。
- 利用可能なすべてのメトリクスおよび PromQL 機能を表示するには、Insert Metric at Cursor をクリックします。
- 複数のクエリーについて、Add Query をクリックします。
-
クエリーを削除するには、クエリーの
 をクリックしてから Delete query を選択します。
- クエリーを実行せずに維持するには、Disable query ボタンをクリックします。
クエリーの作成が完了したら、Run Queries ボタンをクリックします。クエリーからのメトリクスはプロットで可視化されます。クエリーが無効な場合、UI にはエラーメッセージが表示されます。
注記大量のデータで動作するクエリーは、時系列グラフの描画時にタイムアウトするか、またはブラウザーをオーバーロードする可能性があります。これを回避するには、グラフを非表示にし、メトリクステーブルのみを使用してクエリーを調整する必要があります。次に、使用できるクエリーを確認した後に、グラフを描画できるようにプロットを有効にします。
- オプション: ページ URL には、実行したクエリーが含まれます。このクエリーのセットを再度使用できるようにするには、この URL を保存します。
追加リソース
Prometheus Query Language ドキュメントを参照してください。
1.4.3. 視覚化されたメトリクスの使用
クエリーの実行後に、メトリクスが対話式プロットに表示されます。プロットの X 軸は時間を表します。Y 軸はメトリクスの値を表します。各メトリクスは彩色グラフとして表示されます。プロットを操作し、メトリクスを参照できます。
手順
最初に、有効なすべてのクエリーからのすべてのメトリクスがプロットに表示されます。表示されるメトリクスを選択できます。
-
クエリーからすべてのメトリクスを非表示にするには、クエリーの
をクリックし、Hide all series をクリックします。
- 特定のメトリクスを非表示にするには、クエリーテーブルに移動し、メトリクス名の横にある色の付いた四角をクリックします。
-
クエリーからすべてのメトリクスを非表示にするには、クエリーの
プロットをズームアップし、表示される時間範囲を変更するには、以下のいずれかを行います。
- プロットを水平にクリックし、ドラッグして、時間範囲を視覚的に選択します。
- 左上隅のメニューを使用して、時間範囲を選択します。
時間の範囲をリセットするには、Reset Zoom をクリックします。
- 特定の時点のすべてのクエリーの出力を表示するには、その時点のプロットにてマウスのカーソルを保持します。クエリーの出力はポップアップに表示されます。
- 特定クエリーのメトリクスの詳細については、ドロップダウンボタンを使用してクエリーの表を展開します。すべてのメトリクスは現在の値で表示されます。
- プロットを非表示にするには、Hide Graph をクリックします。
1.4.4. メトリックへの管理者以外のアクセス
開発者は、プロジェクト内のアプリケーションまたはサービスのユーザーワークロードのモニタリングを有効にできます。管理者は、同一の機能を使用してインフラストラクチャーワークロードのモニタリングを有効にできます。この場合、プロジェクトの開発者または管理者は、Web コンソールで Developer パースペクティブを使用して、公開されたメトリクスを検査できます。
Developer パースペクティブを使用したメトリクスの検査はテクノロジープレビュー機能としてのみご利用いただけます。テクノロジープレビュー機能は Red Hat の実稼働環境でのサービスレベルアグリーメント (SLA) ではサポートされていないため、Red Hat では実稼働環境での使用を推奨していません。Red Hat は実稼働環境でこれらを使用することを推奨していません。これらの機能は、近々発表予定の製品機能をリリースに先駆けてご提供することにより、お客様は機能性をテストし、開発プロセス中にフィードバックをお寄せいただくことができます。
Red Hat のテクノロジープレビュー機能のサポート範囲についての詳細は、https://access.redhat.com/ja/support/offerings/techpreview/ を参照してください。
追加リソース
独自のサービスのモニタリングについてのドキュメントを参照してください。これには、クラスター以外のメトリクスに開発者または特権のあるユーザーとしてアクセスするための詳細情報が含まれます。
1.4.5. 次のステップ
1.5. Prometheus、Alertmanager、および Grafana へのアクセス
モニタリングスタックによって収集されるデータを使用するには、Prometheus、Alertmanager、および Grafana インターフェースを使用できます。これらのインターフェースはデフォルトで利用可能です。
1.5.1. Web コンソールの使用による Prometheus、Alerting UI、および Grafana へのアクセス
OpenShift Container Platform Web コンソールで Web ブラウザーを使用し、Prometheus、Alerting、および Grafana Web UI にアクセスできます。
この手順でアクセスされる Alerting UI は、Alertmanager の新規インターフェースです。
前提条件
-
認証は、OpenShift Container Platform アイデンティティーに対して行われ、OpenShift Container Platform の他の場所で使用されるのと同じ認証情報および認証方法が使用されます。
cluster-monitoring-viewクラスターロールなどの、すべての namespace への読み取りアクセスを持つロールを使用する必要があります。
手順
- OpenShift Container Platform Web コンソールに移動し、認証します。
Prometheus にアクセスするには、"Monitoring" → "Metrics" ページに移動します。
Alerting UI にアクセスするには、"Monitoring" → "Alerting" ページに移動します。
Grafana にアクセスするには、"Monitoring" → "Dashboards" ページに移動します。
1.5.2. Prometheus、Alertmanager、および Grafana への直接アクセス
oc ツールおよび Web ブラウザーを使用して、Prometheus、Alertmanager、および Grafana Web UI にアクセスできます。
この手順でアクセスされる Alertmanager UI は、 Alertmanager の古いインターフェースです。
前提条件
-
認証は、OpenShift Container Platform アイデンティティーに対して行われ、OpenShift Container Platform の他の場所で使用されるのと同じ認証情報および認証方法が使用されます。
cluster-monitoring-viewクラスターロールなどの、すべての namespace への読み取りアクセスを持つロールを使用する必要があります。
手順
以下を実行します。
$ oc -n openshift-monitoring get routes NAME HOST/PORT ... alertmanager-main alertmanager-main-openshift-monitoring.apps._url_.openshift.com ... grafana grafana-openshift-monitoring.apps._url_.openshift.com ... prometheus-k8s prometheus-k8s-openshift-monitoring.apps._url_.openshift.com ...https://をアドレスに追加します。 暗号化されていない接続を使用して Web UI にアクセスすることはできません。たとえば、以下は Alertmanager の生成される URL です。
https://alertmanager-main-openshift-monitoring.apps._url_.openshift.com- web ブラウザーを使用してアドレスに移動し、認証します。
追加リソース
- Alertmanager の新規インターフェースの説明については、「クラスターアラートの管理」を参照してください。
モニタリングルートは Cluster Monitoring Operator によって管理され、ユーザーが変更することはできません。
第2章 独自のサービスのモニタリング
クラスターのモニタリングに加えて、独自のサービスについて OpenShift Monitoring を使用できます。これを使用することにより、追加のモニタリングソリューションを使用する必要はありません。また、これはモニタリングの一元化に役立ちます。さらに、サービスのメトリクスへのアクセスを、クラスター管理者以外にも拡張できます。これにより、開発者および任意のユーザーがこれらのメトリクスにアクセスできます。
カスタム Prometheus インスタンスおよび Operator Lifecycle Manager (OLM) でインストールされる Prometheus Operator では、ユーザー定義のワークロードモニタリングが有効である場合にこれに関する問題が生じる可能性があります。カスタム Prometheus インスタンスは OpenShift Container Platform ではサポートされません。
独自のサービスのモニタリングはテクノロジープレビュー機能としてのみご利用いただけます。テクノロジープレビュー機能は Red Hat の実稼働環境でのサービスレベルアグリーメント (SLA) ではサポートされていないため、Red Hat では実稼働環境での使用を推奨していません。Red Hat は実稼働環境でこれらを使用することを推奨していません。これらの機能は、近々発表予定の製品機能をリリースに先駆けてご提供することにより、お客様は機能性をテストし、開発プロセス中にフィードバックをお寄せいただくことができます。
Red Hat のテクノロジープレビュー機能のサポート範囲についての詳細は、https://access.redhat.com/ja/support/offerings/techpreview/ を参照してください。
2.1. 独自のサービスのモニタリングの有効化
独自のサービスのモニタリングを有効にするには、クラスターモニタリング ConfigMap に techPreviewUserWorkload/enabled フラグを設定します。
前提条件
-
cluster-adminロールを持つユーザーとしてクラスターにアクセスできます。 - OpenShift CLI (oc) がインストールされている。
-
cluster-monitoring-configConfigMap オブジェクトを作成している。
手順
cluster-monitoring-configConfigMap の編集を開始します。$ oc -n openshift-monitoring edit configmap cluster-monitoring-configdata/config.yamlでtechPreviewUserWorkload設定をtrueに設定します。apiVersion: v1 kind: ConfigMap metadata: name: cluster-monitoring-config namespace: openshift-monitoring data: config.yaml: | techPreviewUserWorkload: enabled: true- 変更を適用するためにファイルを保存します。独自のサービスのモニタリングが自動的に有効にされます。
オプション:
prometheus-user-workload Podが作成されていることを確認できます。$ oc -n openshift-user-workload-monitoring get pod NAME READY STATUS RESTARTS AGE prometheus-operator-85bbb7b64d-7jwjd 1/1 Running 0 3m24s prometheus-user-workload-0 5/5 Running 1 3m13s prometheus-user-workload-1 5/5 Running 1 3m13s
追加リソース
-
cluster-monitoring-configConfigMap オブジェクトを作成する方法については、「Creating a cluster monitoring ConfigMap」を参照してください。
2.2. サンプルサービスのデプロイ
独自のサービスのモニタリングをテストするために、サンプルサービスをデプロイすることができます。
手順
-
サービス設定の YAML ファイルを作成します。この例では、
prometheus-example-app.yamlという名前です。 サービスをデプロイするための設定をファイルに入力します。
apiVersion: v1
kind: Namespace
metadata:
  name: ns1
---
apiVersion: apps/v1
kind: Deployment
metadata:
  labels:
    app: prometheus-example-app
  name: prometheus-example-app
  namespace: ns1
spec:
  replicas: 1
  selector:
    matchLabels:
      app: prometheus-example-app
  template:
    metadata:
      labels:
        app: prometheus-example-app
    spec:
      containers:
      - image: quay.io/brancz/prometheus-example-app:v0.2.0
        imagePullPolicy: IfNotPresent
        name: prometheus-example-app
---
apiVersion: v1
kind: Service
metadata:
  labels:
    app: prometheus-example-app
  name: prometheus-example-app
  namespace: ns1
spec:
  ports:
  - port: 8080
    protocol: TCP
    targetPort: 8080
    name: web
  selector:
    app: prometheus-example-app
  type: ClusterIP
この設定は、
prometheus-example-appという名前のサービスをns1プロジェクトにデプロイします。このサービスは、カスタムversionメトリクスを公開します。設定ファイルをクラスターに適用します。
$ oc apply -f prometheus-example-app.yamlサービスをデプロイするには多少時間がかかります。
サービスが実行中であることを確認できます。
$ oc -n ns1 get pod
NAME                                      READY     STATUS    RESTARTS   AGE
prometheus-example-app-7857545cb7-sbgwq   1/1       Running   0          81m
2.3. メトリクスコレクションを設定するためのロールの作成
以下の手順では、「メトリクスコレクションの設定」で説明されているように、ユーザーによるサービスのメトリクスコレクションの設定を可能にするロールの作成方法について説明します。
手順
-
新規ロールの YAML ファイルを作成します。この例では、
custom-metrics-role.yamlという名前です。 monitor-crd-editロールの設定をファイルに入力します。kind: ClusterRole apiVersion: rbac.authorization.k8s.io/v1 metadata: name: monitor-crd-edit rules: - apiGroups: ["monitoring.coreos.com"] resources: ["prometheusrules", "servicemonitors", "podmonitors"] verbs: ["get", "list", "watch", "create", "update", "patch", "delete"]このロールにより、ユーザーはサービスのメトリクス収集をセットアップできます。
設定ファイルをクラスターに適用します。
$ oc apply -f custom-metrics-role.yamlこれでロールが作成されます。
2.4. ロールのユーザーへの付与
以下の手順では、monitor-crd-edit ロールをユーザーに割り当てる方法を説明します。
前提条件
- ユーザーを作成する必要があります。
-
「メトリクスコレクションを設定するためのロールの作成」で説明されている
monitor-crd-editロールが必要です。
手順
- Web コンソールで、User Management → Role Bindings → Create Binding に移動します。
- Binding Typeで、「Namespace Role Binding」タイプを選択します。
- Name に、バインディングの名前を入力します。
- Namespace で、アクセスを付与する namespace を選択します。
-
Role Name に、
monitor-crd-editを入力します。 - Subject で User を選択します。
-
Subject Name に、ユーザーの名前を入力します (例:
johnsmith)。 -
ロールバインディングを確認します。ユーザーに
monitor-crd-editロールが割り当てられるので、ユーザーは namespace にサービスにメトリクスコレクションを設定することができます。
2.5. メトリクスコレクションの設定
サービスが公開するメトリクスを使用するには、OpenShift Monitoring を、/metrics エンドポイントからメトリクスを収集できるように設定する必要があります。これは、ServiceMonitor、サービスのモニタリング方法を指定するカスタムリソース定義 (CRD)、または PodMonitor、Pod のモニタリング方法を指定する CRD を使用して実行できます。前者の場合はサービスオブジェクトが必要ですが、後者の場合は不要です。これにより、Prometheus は Pod によって公開されるメトリクスエンドポイントからメトリクスを直接収集することができます。
以下の手順では、サービスの ServiceMonitor を作成する方法を説明します。
前提条件
-
クラスター管理者または
monitor-crd-editロールを持つユーザーとしてログインします。
手順
-
ServiceMonitor 設定の YAML ファイルを作成します。この例では、ファイルは
example-app-service-monitor.yamlという名前です。 ServiceMonitor を作成するための設定をファイルに入力します。
apiVersion: monitoring.coreos.com/v1
kind: ServiceMonitor
metadata:
  labels:
    k8s-app: prometheus-example-monitor
  name: prometheus-example-monitor
  namespace: ns1
spec:
  endpoints:
  - interval: 30s
    port: web
    scheme: http
  selector:
    matchLabels:
      app: prometheus-example-app
この設定により、OpenShift Monitoring は「サンプルサービスのデプロイ」でデプロイされるサンプルサービスによって公開されるメトリクスを収集します。これには、単一の
versionメトリクスが含まれます。設定ファイルをクラスターに適用します。
$ oc apply -f example-app-service-monitor.yamlServiceMonitor をデプロイするのに多少時間がかかります。
ServiceMonitor が実行中であることを確認できます。
$ oc -n ns1 get servicemonitor
NAME                         AGE
prometheus-example-monitor   81m
追加リソース
ServiceMonitor および PodMonitor についての詳細は、Prometheus Operator API のドキュメントを参照してください。
2.6. アラートルールの作成
サービスの選択したメトリクスの値に基づいてアラートを出すアラートルールを作成できます。
現行バージョンのテクノロジープレビューでは、管理者のみが Prometheus UI および Web コンソールを使用してアラートルールにアクセスできます。
手順
-
アラートルールの YAML ファイルを作成します。この例では、
example-app-alerting-rule.yamlという名前です。 アラートルールの設定をファイルに入力します。
注記以下の式は、独自のサービスで公開されるメトリクスのみを参照できます。現時点で、既存のクラスターメトリクスを関連付けることはできません。
apiVersion: monitoring.coreos.com/v1
kind: PrometheusRule
metadata:
  name: example-alert
  namespace: ns1
spec:
  groups:
  - name: example
    rules:
    - alert: VersionAlert
      expr: version{job="prometheus-example-app"} == 0
この設定により、
example-alertという名前のアラートルールが作成されます。これは、サンプルサービスで公開されるversionメトリクスが0になるとアラートを出します。設定ファイルをクラスターに適用します。
$ oc apply -f example-app-alerting-rule.yamlアラートルールの作成には多少時間がかかります。
2.7. ユーザーへの表示アクセスの付与
デフォルトでは、クラスター管理者ユーザーと開発者のみがサービスからメトリクスにアクセスできます。以下の手順では、特定のプロジェクトのメトリクスのアクセスを任意のユーザーに付与する方法を説明します。
前提条件
- ユーザーを作成する必要があります。
- クラスター管理者としてログインする必要があります。
手順
このコマンドを実行して、<namespace> でサービスのすべてのメトリクスへの <user> アクセスを付与します。
$ oc policy add-role-to-user view <user> -n <namespace>たとえば、
ns1namespace への表示アクセスをユーザーbobwilliamsに付与するには、以下を実行します。$ oc policy add-role-to-user view bobwilliams -n ns1-
または、Web コンソールで Developer パースペクティブに切り替え、Advanced → Project Access をクリックします。ここから適切な namespace を選択し、
viewロールをユーザーに割り当てることができます。
2.8. サービスのメトリクスへのアクセス
独自のサービスのモニタリングを有効にし、サービスをデプロイし、そのサービスのメトリクスコレクションをセットアップしたら、クラスター管理者、開発者またはプロジェクトの表示パーミッションを持つユーザーとしてサービスのメトリクスにアクセスできます。
OpenShift Container Platform Monitoring に同梱される Grafana インスタンスは読み取り専用であり、インフラストラクチャー関連のダッシュボードのみを表示します。
前提条件
- モニターするサービスをデプロイする必要があります。
- 独自のサービスのモニタリングを有効にする必要があります。
- サービスについてのメトリクスの収集を設定する必要があります。
- クラスター管理者、開発者またはプロジェクトの表示パーミッションを持つユーザーとしてログインする必要があります。
手順
Prometheus Web インターフェースにアクセスします。
メトリクスにクラスター管理者としてアクセスするには、OpenShift Container Platform Web コンソールに移動し、Administrator パースペクティブに切り替えてから Monitoring → Metrics をクリックします。
注記クラスター管理者は、Administrator パースペクティブを使用する場合、すべてのクラスターメトリクスおよびすべてのプロジェクトのカスタムサービスメトリクスにアクセスできます。
注記クラスター管理者のみが Alertmanager および Prometheus UI にアクセスできます。
メトリクスを開発者またはパーミッションを持つユーザーとしてアクセスするには、OpenShift Container Platform Web コンソールに移動し、Developer パーステクティブに切り替えた後に Advanced → Metrics をクリックします。メトリクスを表示するプロジェクトを選択します。
注記開発者は Developer パースペクティブのみを使用できます。単一プロジェクトからのみメトリクスをクエリーできます。
- PromQL インターフェースを使用して、サービスのクエリーを実行します。
追加リソース
- PromQL インターフェースの使用についてのセクションを参照してください。
第3章 自動スケーリングのカスタムアプリケーションメトリクスの公開
Horizontal Pod Autoscaler のカスタムアプリケーションメトリクスをエクスポートできます。
Prometheus アダプターはテクノロジープレビュー機能です。テクノロジープレビュー機能は Red Hat の実稼働環境でのサービスレベルアグリーメント (SLA) ではサポートされていないため、Red Hat では実稼働環境での使用を推奨していません。Red Hat は実稼働環境でこれらを使用することを推奨していません。これらの機能は、近々発表予定の製品機能をリリースに先駆けてご提供することにより、お客様は機能性をテストし、開発プロセス中にフィードバックをお寄せいただくことができます。
Red Hat のテクノロジープレビュー機能のサポート範囲についての詳細は、https://access.redhat.com/ja/support/offerings/techpreview/ を参照してください。
3.1. Horizontal Pod Autoscaling のカスタムアプリケーションメトリクスの公開
prometheus-adapter リソースを使用して、Horizontal Pod Autoscaler のカスタムアプリケーションメトリクスを公開できます。
前提条件
-
カスタム Prometheus インスタンスがインストールされていること。この例では、Prometheus が
defaultnamespace にインストールされていることが前提になります。 -
アプリケーションのモニタリングを設定されていること。この例では、アプリケーションとそのサービスモニターが
defaultnamespace にインストールされていることが前提になります。
手順
-
設定の YAML ファイルを作成します。この例では、これは
deploy.yamlというファイルになります。 prometheus-adapterのサービスアカウント、必要なロールおよびロールバインディングを作成するための設定を追加します。kind: ServiceAccount apiVersion: v1 metadata: name: custom-metrics-apiserver namespace: default --- apiVersion: rbac.authorization.k8s.io/v1 kind: ClusterRole metadata: name: custom-metrics-server-resources rules: - apiGroups: - custom.metrics.k8s.io resources: ["*"] verbs: ["*"] --- apiVersion: rbac.authorization.k8s.io/v1 kind: ClusterRole metadata: name: custom-metrics-resource-reader rules: - apiGroups: - "" resources: - namespaces - pods - services verbs: - get - list --- apiVersion: rbac.authorization.k8s.io/v1 kind: ClusterRoleBinding metadata: name: custom-metrics:system:auth-delegator roleRef: apiGroup: rbac.authorization.k8s.io kind: ClusterRole name: system:auth-delegator subjects: - kind: ServiceAccount name: custom-metrics-apiserver namespace: default --- apiVersion: rbac.authorization.k8s.io/v1 kind: RoleBinding metadata: name: custom-metrics-auth-reader namespace: kube-system roleRef: apiGroup: rbac.authorization.k8s.io kind: Role name: extension-apiserver-authentication-reader subjects: - kind: ServiceAccount name: custom-metrics-apiserver namespace: default --- apiVersion: rbac.authorization.k8s.io/v1 kind: ClusterRoleBinding metadata: name: custom-metrics-resource-reader roleRef: apiGroup: rbac.authorization.k8s.io kind: ClusterRole name: custom-metrics-resource-reader subjects: - kind: ServiceAccount name: custom-metrics-apiserver namespace: default --- apiVersion: rbac.authorization.k8s.io/v1 kind: ClusterRoleBinding metadata: name: hpa-controller-custom-metrics roleRef: apiGroup: rbac.authorization.k8s.io kind: ClusterRole name: custom-metrics-server-resources subjects: - kind: ServiceAccount name: horizontal-pod-autoscaler namespace: kube-system ---prometheus-adapterのカスタムメトリクスの設定を追加します。apiVersion: v1 kind: ConfigMap metadata: name: adapter-config namespace: default data: config.yaml: | rules: - seriesQuery: 'http_requests_total{namespace!="",pod!=""}'1 resources: overrides: namespace: {resource: "namespace"} pod: {resource: "pod"} service: {resource: "service"} name: matches: "^(.*)_total" as: "${1}_per_second"2 metricsQuery: 'sum(rate(<<.Series>>{<<.LabelMatchers>>}[2m])) by (<<.GroupBy>>)' ---prometheus-adapterを API サービスとして登録するための設定を追加します。apiVersion: v1 kind: Service metadata: annotations: service.alpha.openshift.io/serving-cert-secret-name: prometheus-adapter-tls labels: name: prometheus-adapter name: prometheus-adapter namespace: default spec: ports: - name: https port: 443 targetPort: 6443 selector: app: prometheus-adapter type: ClusterIP --- apiVersion: apiregistration.k8s.io/v1beta1 kind: APIService metadata: name: v1beta1.custom.metrics.k8s.io spec: service: name: prometheus-adapter namespace: default group: custom.metrics.k8s.io version: v1beta1 insecureSkipTLSVerify: true groupPriorityMinimum: 100 versionPriority: 100 ---使用する Prometheus アダプターイメージを表示します。
$ kubectl get -n openshift-monitoring deploy/prometheus-adapter -o jsonpath="{..image}" quay.io/openshift-release-dev/ocp-v4.3-art-dev@sha256:76db3c86554ad7f581ba33844d6a6ebc891236f7db64f2d290c3135ba81c264cprometheus-adapterをデプロイするための設定を追加します。apiVersion: apps/v1 kind: Deployment metadata: labels: app: prometheus-adapter name: prometheus-adapter namespace: default spec: replicas: 1 selector: matchLabels: app: prometheus-adapter template: metadata: labels: app: prometheus-adapter name: prometheus-adapter spec: serviceAccountName: custom-metrics-apiserver containers: - name: prometheus-adapter image: openshift-release-dev/ocp-v4.3-art-dev1 args: - --secure-port=6443 - --tls-cert-file=/var/run/serving-cert/tls.crt - --tls-private-key-file=/var/run/serving-cert/tls.key - --logtostderr=true - --prometheus-url=http://prometheus-operated.default.svc:9090/ - --metrics-relist-interval=1m - --v=4 - --config=/etc/adapter/config.yaml ports: - containerPort: 6443 volumeMounts: - mountPath: /var/run/serving-cert name: volume-serving-cert readOnly: true - mountPath: /etc/adapter/ name: config readOnly: true - mountPath: /tmp name: tmp-vol volumes: - name: volume-serving-cert secret: secretName: prometheus-adapter-tls - name: config configMap: name: adapter-config - name: tmp-vol emptyDir: {}- 1
image: openshift-release-dev/ocp-v4.3-art-devは、直前の手順にある Prometheus Adapter イメージを指定します。
設定ファイルをクラスターに適用します。
$ oc apply -f deploy.yaml- アプリケーションのメトリクスが公開され、Horizontal Pod Autoscaling を設定するために使用できます。
追加リソース
Legal Notice
Copyright © Red Hat
OpenShift documentation is licensed under the Apache License 2.0 (https://www.apache.org/licenses/LICENSE-2.0).
Modified versions must remove all Red Hat trademarks.
Portions adapted from https://github.com/kubernetes-incubator/service-catalog/ with modifications by Red Hat.
Red Hat, Red Hat Enterprise Linux, the Red Hat logo, the Shadowman logo, JBoss, OpenShift, Fedora, the Infinity logo, and RHCE are trademarks of Red Hat, Inc., registered in the United States and other countries.
Linux® is the registered trademark of Linus Torvalds in the United States and other countries.
Java® is a registered trademark of Oracle and/or its affiliates.
XFS® is a trademark of Silicon Graphics International Corp. or its subsidiaries in the United States and/or other countries.
MySQL® is a registered trademark of MySQL AB in the United States, the European Union and other countries.
Node.js® is an official trademark of the OpenJS Foundation.
The OpenStack® Word Mark and OpenStack logo are either registered trademarks/service marks or trademarks/service marks of the OpenStack Foundation, in the United States and other countries and are used with the OpenStack Foundation’s permission. We are not affiliated with, endorsed or sponsored by the OpenStack Foundation, or the OpenStack community.
All other trademarks are the property of their respective owners.