監視ツール設定ガイド
OpenStack のロギングおよび監視ツールについてのガイド
概要
Red Hat ドキュメントへのフィードバック (英語のみ)
Red Hat ドキュメントに対するご意見をお聞かせください。ドキュメントの改善点があればお知らせください。
Jira でドキュメントのフィードバックを提供する
ドキュメントに関するフィードバックを提供するには、Create Issue フォームを使用します。Red Hat OpenStack Platform Jira プロジェクトで Jira Issue が作成され、フィードバックの進行状況を追跡できます。
- Jira にログインしていることを確認してください。Jira アカウントをお持ちでない場合は、アカウントを作成してフィードバックを送信してください。
- Create Issue をクリックして、Create Issue ページを開きます。
- Summary フィールドと Description フィールドに入力します。Description フィールドに、ドキュメントの URL、章またはセクション番号、および問題の詳しい説明を入力します。フォーム内の他のフィールドは変更しないでください。
- Create をクリックします。
第1章 Red Hat OpenStack Platform 監視ツールの概要
監視ツールは、オペレーターが OpenStack 環境を維持管理するのに役立つオプションのツールセットです。これらのツールは、以下の機能を果たします。
- 集中ロギング: OpenStack 環境の全コンポーネントからのログを 1 つの場所に収集することができます。すべてのノードとサービスにわたって問題を特定することができます。また、オプションで Red Hat にログデータをエクスポートして、問題を診断するサポートを受けることもできます。
- 可用性監視: OpenStack 環境内の全コンポーネントを監視して、いずれかのコンポーネントが現在停止中または機能していない状態かどうかを判断します。また、問題が確認された時にシステムがアラートを送信するように設定することも可能です。
1.1. 監視コンポーネントのサポート状況
以下の表に、Red Hat OpenStack Platform (RHOSP) の監視用コンポーネントに対するサポート状況を示します。
| コンポーネント | 以降でフルサポート | 非推奨化 | 以降で削除 | 注記 |
|---|---|---|---|---|
| Aodh | RHOSP 9 | RHOSP 15 | 自動スケーリングのユースケースでサポートされています。 | |
| Ceilometer | RHOSP 4 | 自動スケーリングおよびサービステレメトリーフレームワーク (STF) のユースケースで RHOSP のメトリクスとイベントの収集がサポートされています。 | ||
| Collectd | RHOSP 11 | RHOSP 17.1 | STF のインフラストラクチャーメトリクスの収集がサポートされています。 | |
| Gnocchi | RHOSP 9 | RHOSP 15 | 自動スケーリングのユースケースのメトリックのストレージがサポートされています。 | |
| Panko | RHOSP 11 | RHOSP 12、RHOSP 14 以降、デフォルトではインストールされていません | RHOSP 17.0 | |
| QDR | RHOSP 13 | RHOSP 17.1 | RHOSP から STF へのメトリクスおよびイベントデータの送信がサポートされています。 |
第2章 監視アーキテクチャー
監視ツールは、Red Hat OpenStack Platform オーバークラウドノードにクラウドがデプロイされているクライアント/サーバーモデルを使用します。Rsyslog サービスは、クライアント側の集中ロギング (CL) を提供し、有効な collectd-sensubility プラグインは、クライアント側の可用性監視 (AM) を提供します。
2.1. 集中ロギング
Red Hat OpenStack 環境では、一元的な場所に全サービスからログを収集すると、デバッグと管理が容易になります。これらのログは、syslog や audit ログファイルなどのオペレーティングシステム、RabbitMQ や MariaDB などのインフラストラクチャーコンポーネント、Identity や Compute などの OpenStack サービスから収集されます。
集中ロギングのツールチェーンは、以下のコンポーネントで設定されます。
- ログ収集エージェント (Rsyslog)
- データストア (Elasticsearch)
- API/プレゼンテーション層 (Kibana)
Red Hat OpenStack Platform director は、集中ロギング向けのサーバー側のコンポーネントはデプロイしません。Red Hat は、Elasticsearch データベースおよび Kibana を含むサーバー側のコンポーネントはサポートしません。
2.2. 可用性監視
可用性監視により、OpenStack 環境全体にわたる全コンポーネントのハイレベルな機能性を一元的に監視できます。
可用性監視のツールチェーンは、複数のコンポーネントで設定されます。
- 監視エージェント (sensubility プラグインが有効な collectd)
- 監視リレー/プロキシー (RabbitMQ)
- 監視コントローラー/サーバー (Sensu サーバー)
- API/プレゼンテーション層 (Uchiwa)
Red Hat OpenStack Platform director は、サーバー側の可用性監視のコンポーネントはデプロイしません。Red Hat では、Uchiwa、Sensu Server、Sensu API plus、RabbitMQ、監視ノードで実行する Redis インスタンスなどのサーバー側のコンポーネントはサポートしていません。
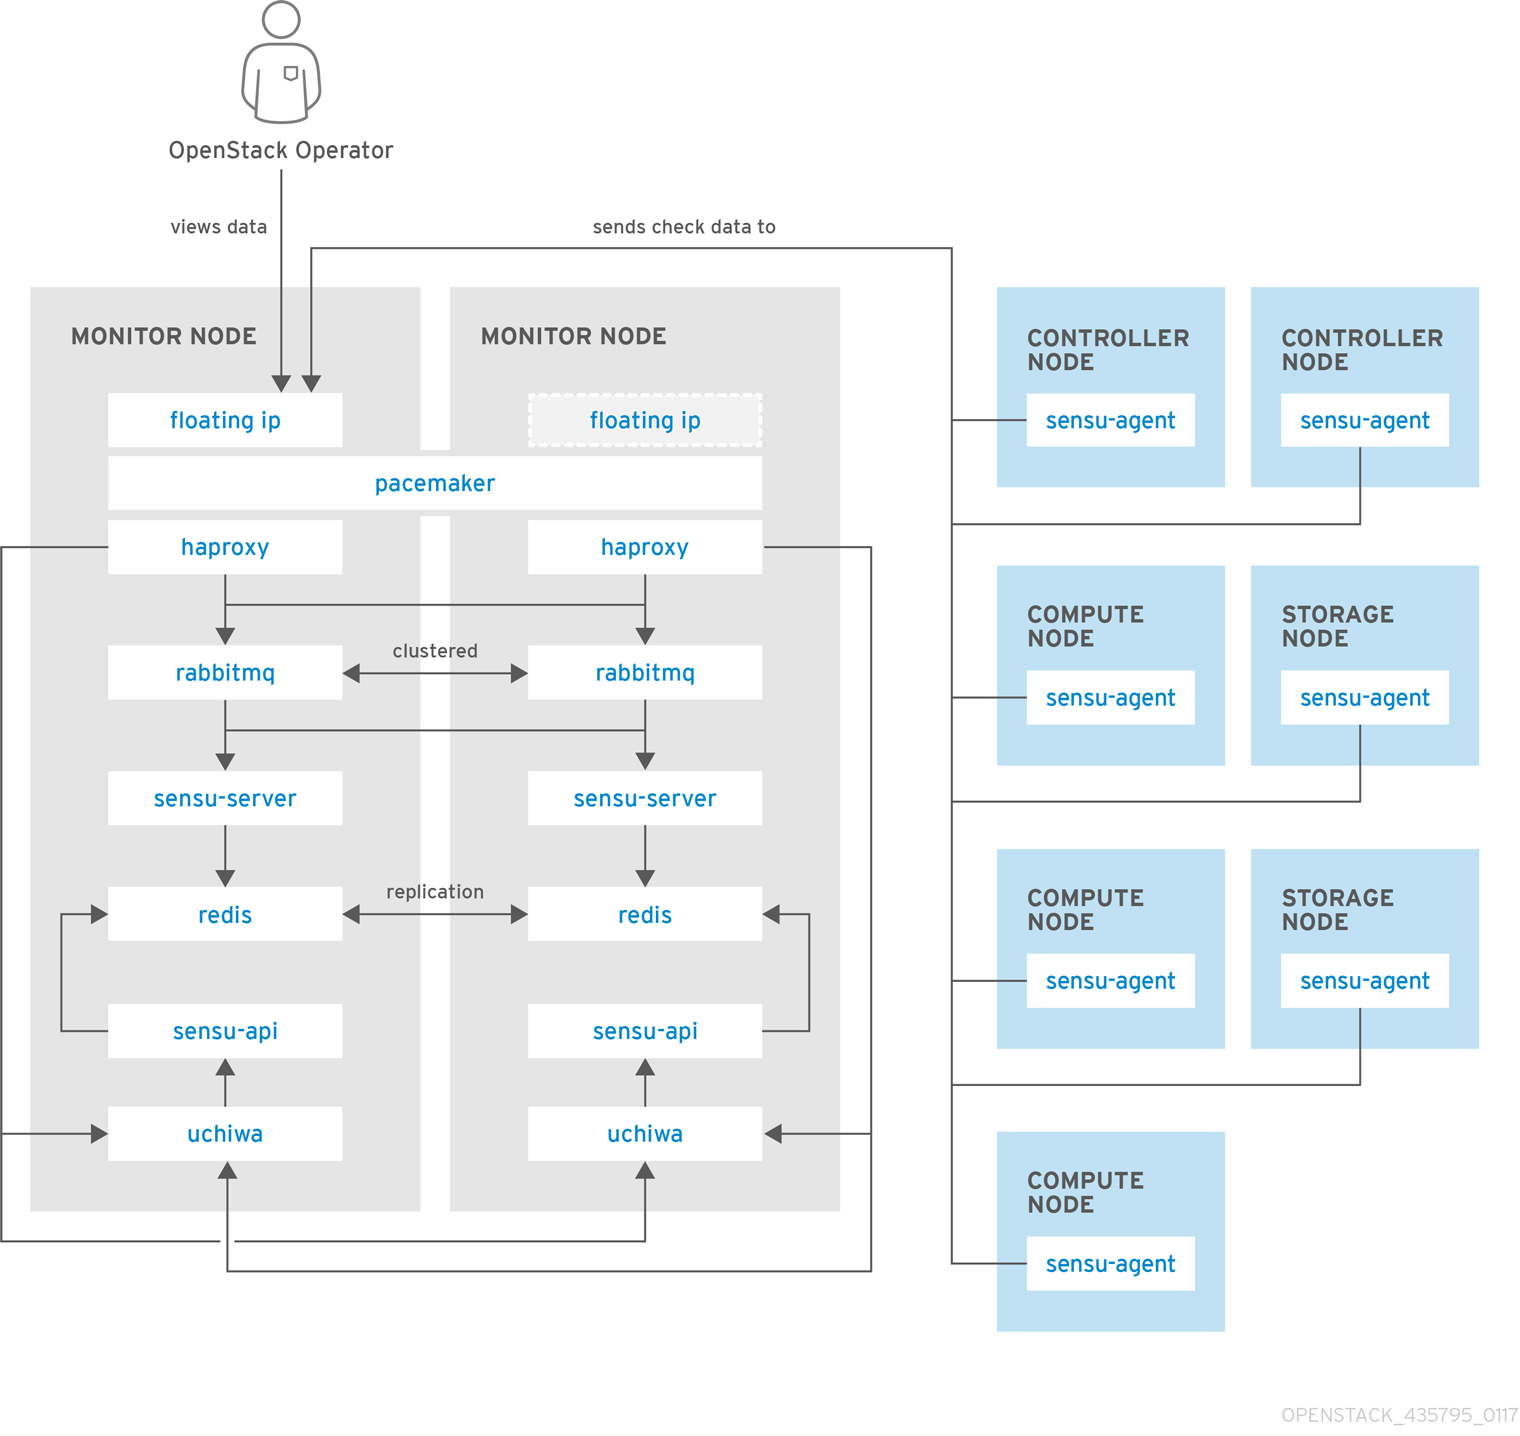
以下の図は、可用性監視のコンポーネントとそれらの対話を示しています。
青で示した項目は Red Hat のサポート対象コンポーネントです。
図2.1 可用性監視のハイレベルアーキテクチャー

図2.2 Red Hat OpenStack Platform の単一ノードデプロイメント
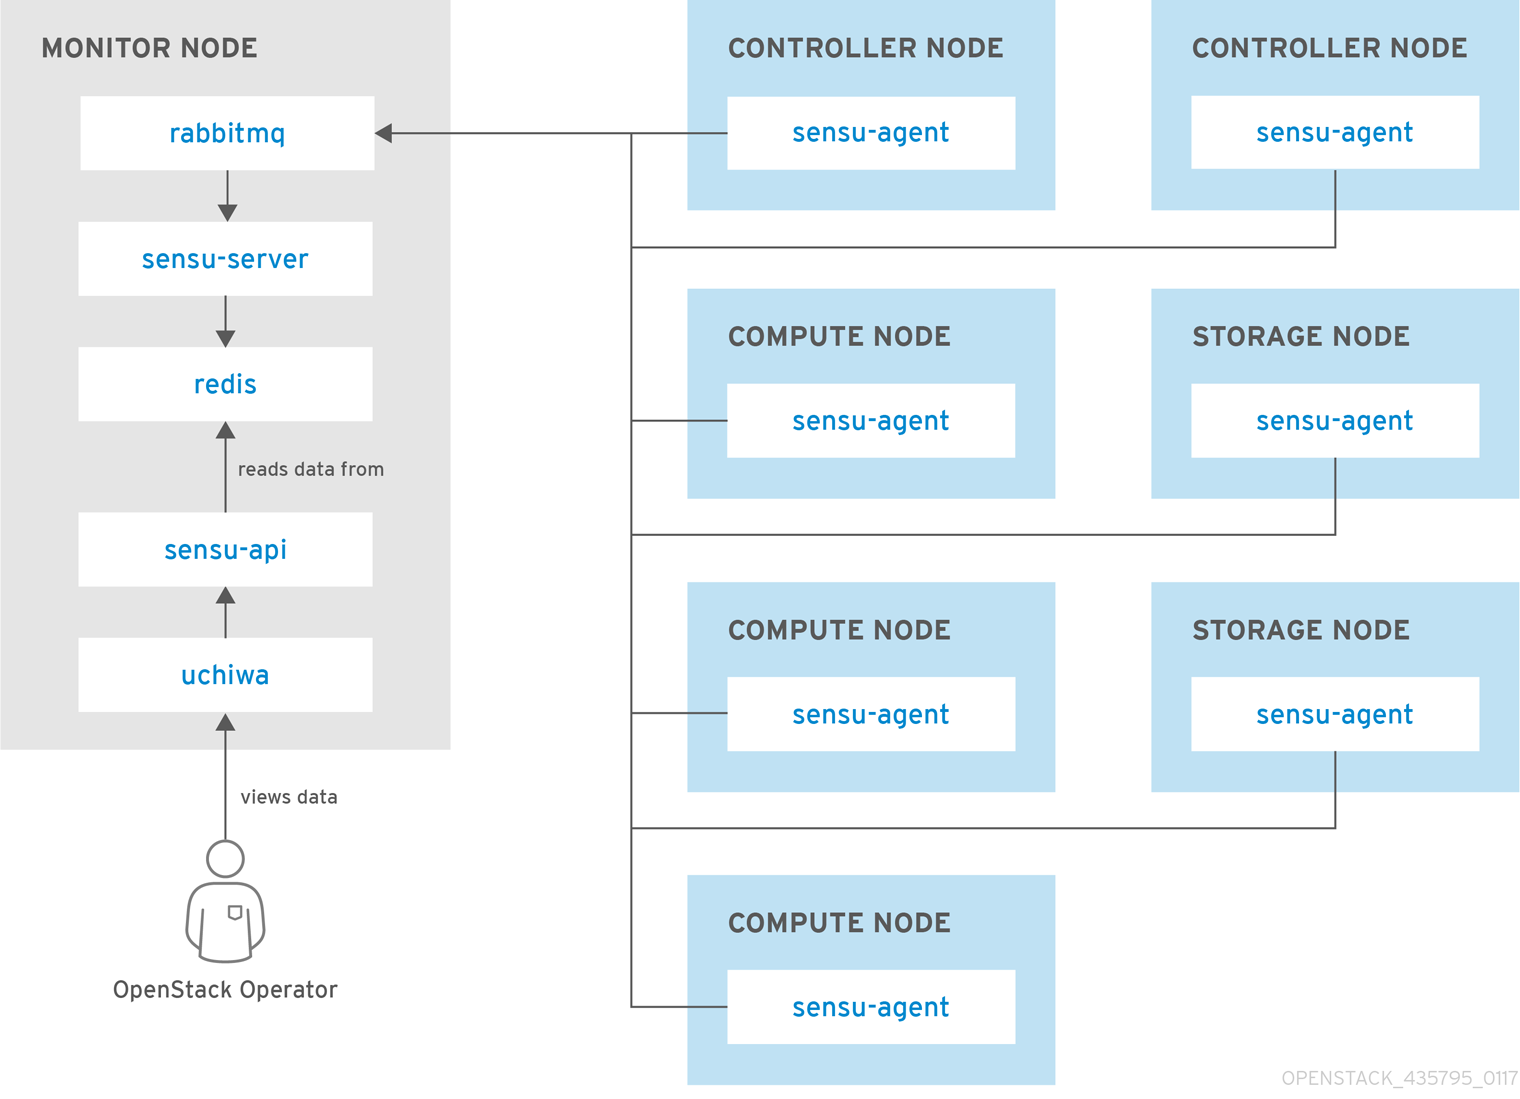
図2.3 Red Hat OpenStack Platform の HA デプロイメント
第3章 クライアント側のツールのインストール
オーバークラウドをデプロイする前に、各クライアントに適用する設定を決定する必要があります。Heat テンプレートコレクションからサンプルの環境ファイルをコピーし、使用している環境に応じてファイルを変更します。
3.1. 集中ロギングのクライアントパラメーターの設定
詳細は、ロギング、監視、トラブルシューティング ガイドの Elasticsearch を使用した集中ロギングの有効化 を参照してください。
3.2. 監視クライアントパラメーターの設定
監視ソリューションは、定期的にシステム情報を収集し、データ収集エージェントを使用してさまざまな方法で値を保管し、監視するメカニズムを提供します。Red Hat は、collectd をコレクションエージェントとしてサポートします。collectd-sensubility は collectd の機能拡張であり、RabbitMQ を介して Sensu サーバー側と通信します。Service Telemetry Framework (STF) を使用してデータを保存し、続いてシステムの監視、パフォーマンスのボトルネックの特定、将来のシステム負荷の予測を行うことができます。Service Telemetry Framework についての詳細は、Service Telemetry Framework 1.3 を参照してください。
collectd および collectd-sensubility を設定するには、以下の手順を実行します。
ホームディレクトリーに
/home/templates/customなどのconfig.yamlを作成し、MetricsQdrConnectorsパラメーター が STF サーバー側をポイントするように設定します。Copy to Clipboard Copied! Toggle word wrap Toggle overflow config.yamlファイルで、CollectdExtraPluginsの下に使用するプラグインをリスト表示します。ExtraConfigセクションにパラメーターを指定することもできます。デフォルトでは、collectd にはcpu、df、disk、hugepages、interface、load、memory、processes、tcpconns、unixsock、uptimeプラグインが付属しています。プラグインは、CollectdExtraPluginsパラメーターを使用してさらに追加できます。また、ExtraConfigオプションを使用して、CollectdExtraPluginsの設定情報を追加することもできます。たとえば、virtプラグインを有効にし、接続文字列とホスト名の形式を設定するには、以下の構文を使用します。Copy to Clipboard Copied! Toggle word wrap Toggle overflow 注記unixsockプラグインは削除しないでください。削除すると、collectd コンテナーは正常ではないと永続的に指定されます。オプション: AMQ Interconnect でメトリックおよびイベントデータを収集するには、
MetricsQdrExternalEndpoint: true行をconfig.yamlファイルに追加します。parameter_defaults: MetricsQdrExternalEndpoint: trueparameter_defaults: MetricsQdrExternalEndpoint: trueCopy to Clipboard Copied! Toggle word wrap Toggle overflow collectd-sensubility を有効にするには、以下の環境設定を
config.yamlファイルに追加します。Copy to Clipboard Copied! Toggle word wrap Toggle overflow オーバークラウドをデプロイする。overcloud deploy コマンドに、
config.yamlとcollectd-write-qdr.yamlのほか、qdr-*.yamlファイルのいずれかを含めます。openstack overcloud deploy -e /home/templates/custom/config.yaml -e tripleo-heat-templates/environments/metrics/collectd-write-qdr.yaml -e tripleo-heat-templates/environments/metrics/qdr-form-controller-mesh.yaml
$ openstack overcloud deploy
-e  /home/templates/custom/config.yaml
-e tripleo-heat-templates/environments/metrics/collectd-write-qdr.yaml
-e tripleo-heat-templates/environments/metrics/qdr-form-controller-mesh.yaml
Copy to Clipboard Copied! Toggle word wrap Toggle overflow -
オプション: オーバークラウドの RabbitMQ 監視を有効にするには、
overcloud deployコマンドにcollectd-read-rabbitmq.yamlファイルを追加します。
関連情報
- YAML ファイルの詳細は、「YAML ファイル」 を参照してください。
- collectd プラグインの詳細は、「collectd プラグインの設定」 を参照してください。
- Service Telemetry Framework の詳細は、Service Telemetry Framework 1.3 を参照してください。
3.3. AMQ Interconnect を使用したデータの収集
メトリックおよびイベントデータ消費のために利用可能な AMQ Interconnect アドレスにサブスクライブするには、クライアント接続用に AMQ Interconnect を公開する環境ファイルを作成し、オーバークラウドをデプロイします。
Service Telemetry Operator は、単一クラウドデプロイメント用の全データ取得およびデータストレージコンポーネントのデプロイメントを単純化します。データストレージドメインを複数のクラウドと共有するには、Service Telemetry Framework 1.3 の Configuring multiple clouds を参照してください。
なお、Service Telemetry Framework (STF) で採用されている QDR メッシュモードと QDR エッジモードの切り替えはできません。また、STF のデータ収集を有効にした場合は、QDR のメッシュモードを使用することはできません。
手順
-
Red Hat OpenStack Platform アンダークラウドに
stackユーザーとしてログオンします。 -
/home/stackディレクトリーにdata-collection.yamlという名前の設定ファイルを作成します。 外部エンドポイントを有効にするには、
MetricsQdrExternalEndpoint: trueパラメーターをdata-collection.yamlファイルに追加します。parameter_defaults: MetricsQdrExternalEndpoint: trueparameter_defaults: MetricsQdrExternalEndpoint: trueCopy to Clipboard Copied! Toggle word wrap Toggle overflow collectd および AMQ Interconnect を有効にするには、以下のファイルを Red Hat OpenStack Platform director デプロイメントに追加します。
-
data-collection.yaml環境ファイル クライアント側の AMQ Interconnect が外部エンドポイントに接続できるようにする
qdr-form-controller-mesh.yamlファイルopenstack overcloud deploy <other arguments> --templates /usr/share/openstack-tripleo-heat-templates \ --environment-file <...other-environment-files...> \ --environment-file /usr/share/openstack-tripleo-heat-templates/environments/metrics/qdr-form-controller-mesh.yaml \ --environment-file /home/stack/data-collection.yaml
openstack overcloud deploy <other arguments> --templates /usr/share/openstack-tripleo-heat-templates \ --environment-file <...other-environment-files...> \ --environment-file /usr/share/openstack-tripleo-heat-templates/environments/metrics/qdr-form-controller-mesh.yaml \ --environment-file /home/stack/data-collection.yamlCopy to Clipboard Copied! Toggle word wrap Toggle overflow
-
-
オプション: Ceilometer および collectd イベントを収集するには、
overcloud deployコマンドにceilometer-write-qdr.yamlおよびcollectd-write-qdr.yamlファイルを含めます。 - オーバークラウドをデプロイする。
関連情報
- YAML ファイルの詳細は、「YAML ファイル」 を参照してください。
3.4. collectd プラグインの設定
Red Hat OpenStack Platform director には、多くの設定を選択できます。お使いの環境に応じて複数の collectd プラグインを設定できます。各プラグインのドキュメントには、説明と設定例が記載されています。一部のプラグインには、Grafana または Prometheus からクエリーできるメトリックのテーブルと、設定可能なオプションのリスト (利用可能な場合) があります。
関連情報
- collectd プラグインオプションの完全な一覧を表示するには、Service Telemetry Framework の collectd plugins を参照してください。
3.5. YAML ファイル
collectd を設定する際に、overcloud deploy コマンドに以下の YAML ファイルを追加することができます。
-
collectd-read-rabbitmq.yaml:python-collect-rabbitmqを有効にし、オーバークラウドの RabbitMQ インスタンスを監視するように設定します。 -
collectd-write-qdr.yaml: collectd が AMQ Interconnect を使用して Telemetry および通知データを送信できるようにします。 -
qdr-edge-only.yaml: AMQ Interconnect のデプロイメントを有効にします。各オーバークラウドノードでは、エッジモードで 1 つのローカルの qdrouterd サービスが実行および操作されます。たとえば、受信したデータを直接定義されたMetricsQdrConnectorsに送信し ます。 -
qdr-form-controller-mesh.yaml: AMQ Interconnect のデプロイメントを有効にします。各オーバークラウドノードでは、1 つのローカルの qdrouterd サービスが実行され、メッシュトポロジーを形成します。たとえば、コントローラー上の AMQ Interconnect ルーターは、定義されたMetricsQdrConnectorsに接続して内部ルーターモードで動作し、他のノードタイプ上の AMQ Interconnect ルーターは、エッジモードでコントローラー上で実行される内部ルーターに接続されます。
関連情報
collectd の設定に関する詳細は、「監視クライアントパラメーターの設定」 を参照してください。