Scalability and performance
Scaling your OpenShift Container Platform cluster and tuning performance in production environments
Abstract
Chapter 1. OpenShift Container Platform scalability and performance overview
OpenShift Container Platform provides best practices and tools to help you optimize the performance and scale of your clusters. The following documentation provides information on recommended performance and scalability practices, reference design specifications, optimization, and low latency tuning.
To contact Red Hat support, see Getting support.
Some performance and scalability Operators have release cycles that are independent from OpenShift Container Platform release cycles. For more information, see OpenShift Operators.
1.1. Recommended performance and scalability practices
Recommended control plane practices
1.2. Telco reference design specifications
1.3. Planning, optimization, and measurement
Planning your environment according to object maximums
Recommended practices for IBM Z and IBM LinuxONE
Using the Node Tuning Operator
Using CPU Manager and Topology Manager
Scheduling NUMA-aware workloads
Optimizing storage, routing, networking and CPU usage
Managing bare metal hosts and events
What are huge pages and how are they used by apps
Low latency tuning for improving cluster stability and partitioning workload
Improving cluster stability in high latency environments using worker latency profiles
Chapter 2. Recommended performance and scalability practices
2.1. Recommended control plane practices
To ensure optimal performance and scalability, apply the recommended practices for OpenShift Container Platform control planes. By understanding these recommended practices, you can configure your environment to handle increasing workloads while maintaining stability.
2.1.1. Recommended practices for scaling the cluster
To scale your cluster effectively, apply the recommended practices for installations with cloud provider integration. By understanding this guidance, you can optimize performance and ensure stability as you increase the size of your environment.
Apply the following best practices to scale the number of compute machines in your OpenShift Container Platform cluster. You scale the worker machines by increasing or decreasing the number of replicas that are defined in the compute machine set.
When scaling up the cluster to higher node counts:
- Spread nodes across all of the available zones for higher availability.
- Scale up by no more than 25 to 50 machines at once.
-
Consider creating new compute machine sets in each available zone with alternative instance types of similar size to help mitigate any periodic provider capacity constraints. For example, on AWS, use
m5.largeandm5d.large.
Cloud providers might implement a quota for API services. Therefore, gradually scale the cluster.
The controller might not be able to create the machines if the replicas in the compute machine sets are set to higher numbers all at one time. The number of requests the cloud platform, which OpenShift Container Platform is deployed on top of, is able to handle impacts the process. The controller starts to query more while trying to create, check, and update the machines with the status. The cloud platform on which OpenShift Container Platform is deployed has API request limits; excessive queries might lead to machine creation failures due to cloud platform limitations.
Enable machine health checks when scaling to large node counts. In case of failures, the health checks monitor the condition and automatically repair unhealthy machines.
When scaling large and dense clusters to lower node counts, it might take large amounts of time because the process involves draining or evicting the objects running on the nodes being terminated in parallel. Also, the client might start to throttle the requests if there are too many objects to evict. The default client queries per second (QPS) and burst rates are currently set to 50 and 100 respectively. These values cannot be modified in OpenShift Container Platform.
2.1.2. Control plane node sizing
To ensure optimal performance and stability, determine the resource requirements for control plane nodes. These sizing guidelines depend on the number and type of nodes and objects in your cluster.
The following control plane node size recommendations are based on the results of a control plane density focused testing, or Cluster-density. This test creates the following objects across a given number of namespaces:
- 1 image stream
- 1 build
-
5 deployments, with 2 pod replicas in a
sleepstate, mounting 4 secrets, 4 config maps, and 1 downward API volume each - 5 services, each one pointing to the TCP/8080 and TCP/8443 ports of one of the previous deployments
- 1 route pointing to the first of the previous services
- 10 secrets containing 2048 random string characters
- 10 config maps containing 2048 random string characters
| Number of compute nodes | Cluster-density (namespaces) | CPU cores | Memory (GB) |
|---|---|---|---|
| 24 | 500 | 4 | 16 |
| 120 | 1000 | 8 | 32 |
| 252 | 4000 | 16, but 24 if using the OVN-Kubernetes network plug-in | 64, but 128 if using the OVN-Kubernetes network plug-in |
| 501, but untested with the OVN-Kubernetes network plug-in | 4000 | 16 | 96 |
The data from the table above is based on an OpenShift Container Platform running on top of AWS, using r5.4xlarge instances as control-plane nodes and m5.2xlarge instances as compute nodes.
On a large and dense cluster with three control plane nodes, the CPU and memory usage will spike up when one of the nodes is stopped, rebooted, or fails. The failures can be due to unexpected issues with power, network, underlying infrastructure, or intentional cases where the cluster is restarted after shutting it down to save costs. The remaining two control plane nodes must handle the load in order to be highly available, which leads to increase in the resource usage. This is also expected during upgrades because the control plane nodes are cordoned, drained, and rebooted serially to apply the operating system updates, as well as the control plane Operators update. To avoid cascading failures, keep the overall CPU and memory resource usage on the control plane nodes to at most 60% of all available capacity to handle the resource usage spikes. Increase the CPU and memory on the control plane nodes accordingly to avoid potential downtime due to lack of resources.
The node sizing varies depending on the number of nodes and object counts in the cluster. It also depends on whether the objects are actively being created on the cluster. During object creation, the control plane is more active in terms of resource usage compared to when the objects are in the running phase.
Operator Lifecycle Manager (OLM ) runs on the control plane nodes and its memory footprint depends on the number of namespaces and user installed operators that OLM needs to manage on the cluster. Control plane nodes need to be sized accordingly to avoid OOM kills. Following data points are based on the results from cluster maximums testing.
| Number of namespaces | OLM memory at idle state (GB) | OLM memory with 5 user operators installed (GB) |
|---|---|---|
| 500 | 0.823 | 1.7 |
| 1000 | 1.2 | 2.5 |
| 1500 | 1.7 | 3.2 |
| 2000 | 2 | 4.4 |
| 3000 | 2.7 | 5.6 |
| 4000 | 3.8 | 7.6 |
| 5000 | 4.2 | 9.02 |
| 6000 | 5.8 | 11.3 |
| 7000 | 6.6 | 12.9 |
| 8000 | 6.9 | 14.8 |
| 9000 | 8 | 17.7 |
| 10,000 | 9.9 | 21.6 |
You can modify the control plane node size in a running OpenShift Container Platform 4.16 cluster for the following configurations only:
- Clusters installed with a user-provisioned installation method.
- AWS clusters installed with an installer-provisioned infrastructure installation method.
- Clusters that use a control plane machine set to manage control plane machines.
For all other configurations, you must estimate your total node count and use the suggested control plane node size during installation.
The recommendations are based on the data points captured on OpenShift Container Platform clusters with OpenShift SDN as the network plugin.
In OpenShift Container Platform 4.16, half of a CPU core (500 millicore) is now reserved by the system by default compared to OpenShift Container Platform 3.11 and previous versions. The sizes are determined taking that into consideration.
2.2. Selecting a larger AWS instance type for control plane machines
If the control plane machines in an Amazon Web Services (AWS) cluster require more resources, you can select a larger AWS instance type for the control plane machines to use.
The procedure for clusters that use a control plane machine set is different from the procedure for clusters that do not use a control plane machine set.
If you are uncertain about the state of the ControlPlaneMachineSet CR in your cluster, you can verify the CR status.
2.2.2. Changing the Amazon Web Services instance type by using a control plane machine set
You can change the Amazon Web Services (AWS) instance type that your control plane machines use by updating the specification in the control plane machine set custom resource (CR).
Prerequisites
- Your AWS cluster uses a control plane machine set.
Procedure
Edit the following line under the
providerSpecfield:providerSpec: value: ... instanceType: <compatible_aws_instance_type>-
<compatible_aws_instance_type>: Specifies a larger AWS instance type with the same base as the previous selection. For example, you can changem6i.xlargetom6i.2xlargeorm6i.4xlarge.
-
- Save your changes.
2.2.3. Changing the Amazon Web Services instance type by using the AWS console
You can change the Amazon Web Services (AWS) instance type that your control plane machines use by updating the instance type in the AWS console.
Prerequisites
- You have access to the AWS console with the permissions required to modify the EC2 Instance for your cluster.
-
You have access to the OpenShift Container Platform cluster as a user with the
cluster-adminrole.
Procedure
- Open the AWS console and fetch the instances for the control plane machines.
Choose one control plane machine instance.
- For the selected control plane machine, back up the etcd data by creating an etcd snapshot. For more information, see "Backing up etcd".
- In the AWS console, stop the control plane machine instance.
- Select the stopped instance, and click Actions → Instance Settings → Change instance type.
-
Change the instance to a larger type, ensuring that the type is the same base as the previous selection, and apply changes. For example, you can change
m6i.xlargetom6i.2xlargeorm6i.4xlarge. - Start the instance.
-
If your OpenShift Container Platform cluster has a corresponding
Machineobject for the instance, update the instance type of the object to match the instance type set in the AWS console.
- Repeat this process for each control plane machine.
2.3. Recommended infrastructure practices
This topic provides recommended performance and scalability practices for infrastructure in OpenShift Container Platform.
2.3.1. Infrastructure node sizing
Infrastructure nodes are nodes that are labeled to run pieces of the OpenShift Container Platform environment. The infrastructure node resource requirements depend on the cluster age, nodes, and objects in the cluster, as these factors can lead to an increase in the number of metrics or time series in Prometheus. The following infrastructure node size recommendations are based on the results observed in cluster-density testing detailed in the Control plane node sizing section, where the monitoring stack and the default ingress-controller were moved to these nodes.
| Number of worker nodes | Cluster density, or number of namespaces | CPU cores | Memory (GB) |
|---|---|---|---|
| 27 | 500 | 4 | 24 |
| 120 | 1000 | 8 | 48 |
| 252 | 4000 | 16 | 128 |
| 501 | 4000 | 32 | 128 |
In general, three infrastructure nodes are recommended per cluster.
These sizing recommendations should be used as a guideline. Prometheus is a highly memory intensive application; the resource usage depends on various factors including the number of nodes, objects, the Prometheus metrics scraping interval, metrics or time series, and the age of the cluster. In addition, the router resource usage can also be affected by the number of routes and the amount/type of inbound requests.
These recommendations apply only to infrastructure nodes hosting Monitoring, Ingress and Registry infrastructure components installed during cluster creation.
In OpenShift Container Platform 4.16, half of a CPU core (500 millicore) is now reserved by the system by default compared to OpenShift Container Platform 3.11 and previous versions. This influences the stated sizing recommendations.
2.3.2. Scaling the Cluster Monitoring Operator
OpenShift Container Platform exposes metrics that the Cluster Monitoring Operator (CMO) collects and stores in the Prometheus-based monitoring stack. As an administrator, you can view dashboards for system resources, containers, and components metrics in the OpenShift Container Platform web console by navigating to Observe → Dashboards.
2.3.3. Prometheus database storage requirements
Red Hat performed various tests for different scale sizes.
- The following Prometheus storage requirements are not prescriptive and should be used as a reference. Higher resource consumption might be observed in your cluster depending on workload activity and resource density, including the number of pods, containers, routes, or other resources exposing metrics collected by Prometheus.
- You can configure the size-based data retention policy to suit your storage requirements.
| Number of nodes | Number of pods (2 containers per pod) | Prometheus storage growth per day | Prometheus storage growth per 15 days | Network (per tsdb chunk) |
|---|---|---|---|---|
| 50 | 1800 | 6.3 GB | 94 GB | 16 MB |
| 100 | 3600 | 13 GB | 195 GB | 26 MB |
| 150 | 5400 | 19 GB | 283 GB | 36 MB |
| 200 | 7200 | 25 GB | 375 GB | 46 MB |
Approximately 20 percent of the expected size was added as overhead to ensure that the storage requirements do not exceed the calculated value.
The above calculation is for the default OpenShift Container Platform Cluster Monitoring Operator.
CPU utilization has minor impact. The ratio is approximately 1 core out of 40 per 50 nodes and 1800 pods.
Recommendations for OpenShift Container Platform
- Use at least two infrastructure (infra) nodes.
- Use at least three openshift-container-storage nodes with non-volatile memory express (SSD or NVMe) drives.
2.3.4. Configuring cluster monitoring
You can increase the storage capacity for the Prometheus component in the cluster monitoring stack.
Procedure
To increase the storage capacity for Prometheus:
Create a YAML configuration file,
cluster-monitoring-config.yaml. For example:apiVersion: v1 kind: ConfigMap data: config.yaml: | prometheusK8s: retention: {{PROMETHEUS_RETENTION_PERIOD}}1 nodeSelector: node-role.kubernetes.io/infra: "" volumeClaimTemplate: spec: storageClassName: {{STORAGE_CLASS}}2 resources: requests: storage: {{PROMETHEUS_STORAGE_SIZE}}3 alertmanagerMain: nodeSelector: node-role.kubernetes.io/infra: "" volumeClaimTemplate: spec: storageClassName: {{STORAGE_CLASS}}4 resources: requests: storage: {{ALERTMANAGER_STORAGE_SIZE}}5 metadata: name: cluster-monitoring-config namespace: openshift-monitoring- 1
- The default value of Prometheus retention is
PROMETHEUS_RETENTION_PERIOD=15d. Units are measured in time using one of these suffixes: s, m, h, d. - 2 4
- The storage class for your cluster.
- 3
- A typical value is
PROMETHEUS_STORAGE_SIZE=2000Gi. Storage values can be a plain integer or a fixed-point integer using one of these suffixes: E, P, T, G, M, K. You can also use the power-of-two equivalents: Ei, Pi, Ti, Gi, Mi, Ki. - 5
- A typical value is
ALERTMANAGER_STORAGE_SIZE=20Gi. Storage values can be a plain integer or a fixed-point integer using one of these suffixes: E, P, T, G, M, K. You can also use the power-of-two equivalents: Ei, Pi, Ti, Gi, Mi, Ki.
- Add values for the retention period, storage class, and storage sizes.
- Save the file.
Apply the changes by running:
$ oc create -f cluster-monitoring-config.yaml
2.4. Recommended etcd practices
This topic provides recommended performance and scalability practices for etcd in OpenShift Container Platform.
2.4.1. Recommended etcd practices
Because etcd writes data to disk and persists proposals on disk, its performance depends on disk performance. Although etcd is not particularly I/O intensive, it requires a low latency block device for optimal performance and stability. Because etcd’s consensus protocol depends on persistently storing metadata to a log (WAL), etcd is sensitive to disk-write latency. Slow disks and disk activity from other processes can cause long fsync latencies.
Those latencies can cause etcd to miss heartbeats, not commit new proposals to the disk on time, and ultimately experience request timeouts and temporary leader loss. High write latencies also lead to an OpenShift API slowness, which affects cluster performance. Because of these reasons, avoid colocating other workloads on the control-plane nodes that are I/O sensitive or intensive and share the same underlying I/O infrastructure.
In terms of latency, run etcd on top of a block device that can write at least 50 IOPS of 8000 bytes long sequentially. That is, with a latency of 10ms, keep in mind that uses fdatasync to synchronize each write in the WAL. For heavy loaded clusters, sequential 500 IOPS of 8000 bytes (2 ms) are recommended. To measure those numbers, you can use a benchmarking tool, such as fio.
To achieve such performance, run etcd on machines that are backed by SSD or NVMe disks with low latency and high throughput. Consider single-level cell (SLC) solid-state drives (SSDs), which provide 1 bit per memory cell, are durable and reliable, and are ideal for write-intensive workloads.
The load on etcd arises from static factors, such as the number of nodes and pods, and dynamic factors, including changes in endpoints due to pod autoscaling, pod restarts, job executions, and other workload-related events. To accurately size your etcd setup, you must analyze the specific requirements of your workload. Consider the number of nodes, pods, and other relevant factors that impact the load on etcd.
The following hard drive practices provide optimal etcd performance:
- Use dedicated etcd drives. Avoid drives that communicate over the network, such as iSCSI. Do not place log files or other heavy workloads on etcd drives.
- Prefer drives with low latency to support fast read and write operations.
- Prefer high-bandwidth writes for faster compactions and defragmentation.
- Prefer high-bandwidth reads for faster recovery from failures.
- Use solid state drives as a minimum selection. Prefer NVMe drives for production environments.
- Use server-grade hardware for increased reliability.
Avoid NAS or SAN setups and spinning drives. Ceph Rados Block Device (RBD) and other types of network-attached storage can result in unpredictable network latency. To provide fast storage to etcd nodes at scale, use PCI passthrough to pass NVM devices directly to the nodes.
Always benchmark by using utilities such as fio. You can use such utilities to continuously monitor the cluster performance as it increases.
Avoid using the Network File System (NFS) protocol or other network based file systems.
Some key metrics to monitor on a deployed OpenShift Container Platform cluster are p99 of etcd disk write ahead log duration and the number of etcd leader changes. Use Prometheus to track these metrics.
The etcd member database sizes can vary in a cluster during normal operations. This difference does not affect cluster upgrades, even if the leader size is different from the other members.
To validate the hardware for etcd before or after you create the OpenShift Container Platform cluster, you can use fio.
Prerequisites
- Container runtimes such as Podman or Docker are installed on the machine that you are testing.
-
Data is written to the
/var/lib/etcdpath.
Procedure
Run fio and analyze the results:
If you use Podman, run this command:
$ sudo podman run --volume /var/lib/etcd:/var/lib/etcd:Z quay.io/cloud-bulldozer/etcd-perfIf you use Docker, run this command:
$ sudo docker run --volume /var/lib/etcd:/var/lib/etcd:Z quay.io/cloud-bulldozer/etcd-perf
The output reports whether the disk is fast enough to host etcd by comparing the 99th percentile of the fsync metric captured from the run to see if it is less than 10 ms. A few of the most important etcd metrics that might affected by I/O performance are as follow:
-
etcd_disk_wal_fsync_duration_seconds_bucketmetric reports the etcd’s WAL fsync duration -
etcd_disk_backend_commit_duration_seconds_bucketmetric reports the etcd backend commit latency duration -
etcd_server_leader_changes_seen_totalmetric reports the leader changes
Because etcd replicates the requests among all the members, its performance strongly depends on network input/output (I/O) latency. High network latencies result in etcd heartbeats taking longer than the election timeout, which results in leader elections that are disruptive to the cluster. A key metric to monitor on a deployed OpenShift Container Platform cluster is the 99th percentile of etcd network peer latency on each etcd cluster member. Use Prometheus to track the metric.
The histogram_quantile(0.99, rate(etcd_network_peer_round_trip_time_seconds_bucket[2m])) metric reports the round trip time for etcd to finish replicating the client requests between the members. Ensure that it is less than 50 ms.
2.4.2. Moving etcd to a different disk
You can move etcd from a shared disk to a separate disk to prevent or resolve performance issues.
The Machine Config Operator (MCO) is responsible for mounting a secondary disk for OpenShift Container Platform 4.16 container storage.
This encoded script only supports device names for the following device types:
- SCSI or SATA
-
/dev/sd* - Virtual device
-
/dev/vd* - NVMe
-
/dev/nvme*[0-9]*n*
Limitations
-
When the new disk is attached to the cluster, the etcd database is part of the root mount. It is not part of the secondary disk or the intended disk when the primary node is recreated. As a result, the primary node will not create a separate
/var/lib/etcdmount.
Prerequisites
- You have a backup of your cluster’s etcd data.
-
You have installed the OpenShift CLI (
oc). -
You have access to the cluster with
cluster-adminprivileges. - Add additional disks before uploading the machine configuration.
-
The
MachineConfigPoolmust matchmetadata.labels[machineconfiguration.openshift.io/role]. This applies to a controller, worker, or a custom pool.
This procedure does not move parts of the root file system, such as /var/, to another disk or partition on an installed node.
This procedure is not supported when using control plane machine sets.
Procedure
Attach the new disk to the cluster and verify that the disk is detected in the node by running the
lsblkcommand in a debug shell:$ oc debug node/<node_name># lsblkNote the device name of the new disk reported by the
lsblkcommand.Create the following script and name it
etcd-find-secondary-device.sh:#!/bin/bash set -uo pipefail for device in <device_type_glob>; do1 /usr/sbin/blkid "${device}" &> /dev/null if [ $? == 2 ]; then echo "secondary device found ${device}" echo "creating filesystem for etcd mount" mkfs.xfs -L var-lib-etcd -f "${device}" &> /dev/null udevadm settle touch /etc/var-lib-etcd-mount exit fi done echo "Couldn't find secondary block device!" >&2 exit 77- 1
- Replace
<device_type_glob>with a shell glob for your block device type. For SCSI or SATA drives, use/dev/sd*; for virtual drives, use/dev/vd*; for NVMe drives, use/dev/nvme*[0-9]*n*.
Create a base64-encoded string from the
etcd-find-secondary-device.shscript and note its contents:$ base64 -w0 etcd-find-secondary-device.shCreate a
MachineConfigYAML file namedetcd-mc.ymlwith contents such as the following:apiVersion: machineconfiguration.openshift.io/v1 kind: MachineConfig metadata: labels: machineconfiguration.openshift.io/role: master name: 98-var-lib-etcd spec: config: ignition: version: 3.4.0 storage: files: - path: /etc/find-secondary-device mode: 0755 contents: source: data:text/plain;charset=utf-8;base64,<encoded_etcd_find_secondary_device_script>1 systemd: units: - name: find-secondary-device.service enabled: true contents: | [Unit] Description=Find secondary device DefaultDependencies=false After=systemd-udev-settle.service Before=local-fs-pre.target ConditionPathExists=!/etc/var-lib-etcd-mount [Service] RemainAfterExit=yes ExecStart=/etc/find-secondary-device RestartForceExitStatus=77 [Install] WantedBy=multi-user.target - name: var-lib-etcd.mount enabled: true contents: | [Unit] Before=local-fs.target [Mount] What=/dev/disk/by-label/var-lib-etcd Where=/var/lib/etcd Type=xfs TimeoutSec=120s [Install] RequiredBy=local-fs.target - name: sync-var-lib-etcd-to-etcd.service enabled: true contents: | [Unit] Description=Sync etcd data if new mount is empty DefaultDependencies=no After=var-lib-etcd.mount var.mount Before=crio.service [Service] Type=oneshot RemainAfterExit=yes ExecCondition=/usr/bin/test ! -d /var/lib/etcd/member ExecStart=/usr/sbin/setsebool -P rsync_full_access 1 ExecStart=/bin/rsync -ar /sysroot/ostree/deploy/rhcos/var/lib/etcd/ /var/lib/etcd/ ExecStart=/usr/sbin/semanage fcontext -a -t container_var_lib_t '/var/lib/etcd(/.*)?' ExecStart=/usr/sbin/setsebool -P rsync_full_access 0 TimeoutSec=0 [Install] WantedBy=multi-user.target graphical.target - name: restorecon-var-lib-etcd.service enabled: true contents: | [Unit] Description=Restore recursive SELinux security contexts DefaultDependencies=no After=var-lib-etcd.mount Before=crio.service [Service] Type=oneshot RemainAfterExit=yes ExecStart=/sbin/restorecon -R /var/lib/etcd/ TimeoutSec=0 [Install] WantedBy=multi-user.target graphical.target- 1
- Replace
<encoded_etcd_find_secondary_device_script>with the encoded script contents that you noted.
Verification steps
Run the
grep /var/lib/etcd /proc/mountscommand in a debug shell for the node to ensure that the disk is mounted:$ oc debug node/<node_name># grep -w "/var/lib/etcd" /proc/mountsExample output
/dev/sdb /var/lib/etcd xfs rw,seclabel,relatime,attr2,inode64,logbufs=8,logbsize=32k,noquota 0 0
2.4.3. Defragmenting etcd data
For large and dense clusters, etcd can suffer from poor performance if the keyspace grows too large and exceeds the space quota. Periodically maintain and defragment etcd to free up space in the data store. Monitor Prometheus for etcd metrics and defragment it when required; otherwise, etcd can raise a cluster-wide alarm that puts the cluster into a maintenance mode that accepts only key reads and deletes.
Monitor these key metrics:
-
etcd_server_quota_backend_bytes, which is the current quota limit -
etcd_mvcc_db_total_size_in_use_in_bytes, which indicates the actual database usage after a history compaction -
etcd_mvcc_db_total_size_in_bytes, which shows the database size, including free space waiting for defragmentation
Defragment etcd data to reclaim disk space after events that cause disk fragmentation, such as etcd history compaction.
History compaction is performed automatically every five minutes and leaves gaps in the back-end database. This fragmented space is available for use by etcd, but is not available to the host file system. You must defragment etcd to make this space available to the host file system.
Defragmentation occurs automatically, but you can also trigger it manually.
Automatic defragmentation is good for most cases, because the etcd operator uses cluster information to determine the most efficient operation for the user.
2.4.3.1. Automatic defragmentation
The etcd Operator automatically defragments disks. No manual intervention is needed.
Verify that the defragmentation process is successful by viewing one of these logs:
- etcd logs
- cluster-etcd-operator pod
- operator status error log
Automatic defragmentation can cause leader election failure in various OpenShift core components, such as the Kubernetes controller manager, which triggers a restart of the failing component. The restart is harmless and either triggers failover to the next running instance or the component resumes work again after the restart.
Example log output for successful defragmentation
etcd member has been defragmented: <member_name>, memberID: <member_id>Example log output for unsuccessful defragmentation
failed defrag on member: <member_name>, memberID: <member_id>: <error_message>2.4.3.2. Manual defragmentation
A Prometheus alert indicates when you need to use manual defragmentation. The alert is displayed in two cases:
- When etcd uses more than 50% of its available space for more than 10 minutes
- When etcd is actively using less than 50% of its total database size for more than 10 minutes
You can also determine whether defragmentation is needed by checking the etcd database size in MB that will be freed by defragmentation with the PromQL expression: (etcd_mvcc_db_total_size_in_bytes - etcd_mvcc_db_total_size_in_use_in_bytes)/1024/1024
Defragmenting etcd is a blocking action. The etcd member will not respond until defragmentation is complete. For this reason, wait at least one minute between defragmentation actions on each of the pods to allow the cluster to recover.
Follow this procedure to defragment etcd data on each etcd member.
Prerequisites
-
You have access to the cluster as a user with the
cluster-adminrole.
Procedure
Determine which etcd member is the leader, because the leader should be defragmented last.
Get the list of etcd pods:
$ oc -n openshift-etcd get pods -l k8s-app=etcd -o wideExample output
etcd-ip-10-0-159-225.example.redhat.com 3/3 Running 0 175m 10.0.159.225 ip-10-0-159-225.example.redhat.com <none> <none> etcd-ip-10-0-191-37.example.redhat.com 3/3 Running 0 173m 10.0.191.37 ip-10-0-191-37.example.redhat.com <none> <none> etcd-ip-10-0-199-170.example.redhat.com 3/3 Running 0 176m 10.0.199.170 ip-10-0-199-170.example.redhat.com <none> <none>Choose a pod and run the following command to determine which etcd member is the leader:
$ oc rsh -n openshift-etcd etcd-ip-10-0-159-225.example.redhat.com etcdctl endpoint status --cluster -w tableExample output
Defaulting container name to etcdctl. Use 'oc describe pod/etcd-ip-10-0-159-225.example.redhat.com -n openshift-etcd' to see all of the containers in this pod. +---------------------------+------------------+---------+---------+-----------+------------+-----------+------------+--------------------+--------+ | ENDPOINT | ID | VERSION | DB SIZE | IS LEADER | IS LEARNER | RAFT TERM | RAFT INDEX | RAFT APPLIED INDEX | ERRORS | +---------------------------+------------------+---------+---------+-----------+------------+-----------+------------+--------------------+--------+ | https://10.0.191.37:2379 | 251cd44483d811c3 | 3.5.9 | 104 MB | false | false | 7 | 91624 | 91624 | | | https://10.0.159.225:2379 | 264c7c58ecbdabee | 3.5.9 | 104 MB | false | false | 7 | 91624 | 91624 | | | https://10.0.199.170:2379 | 9ac311f93915cc79 | 3.5.9 | 104 MB | true | false | 7 | 91624 | 91624 | | +---------------------------+------------------+---------+---------+-----------+------------+-----------+------------+--------------------+--------+Based on the
IS LEADERcolumn of this output, thehttps://10.0.199.170:2379endpoint is the leader. Matching this endpoint with the output of the previous step, the pod name of the leader isetcd-ip-10-0-199-170.example.redhat.com.
Defragment an etcd member.
Connect to the running etcd container, passing in the name of a pod that is not the leader:
$ oc rsh -n openshift-etcd etcd-ip-10-0-159-225.example.redhat.comUnset the
ETCDCTL_ENDPOINTSenvironment variable:sh-4.4# unset ETCDCTL_ENDPOINTSDefragment the etcd member:
sh-4.4# etcdctl --command-timeout=30s --endpoints=https://localhost:2379 defragExample output
Finished defragmenting etcd member[https://localhost:2379]If a timeout error occurs, increase the value for
--command-timeoutuntil the command succeeds.Verify that the database size was reduced:
sh-4.4# etcdctl endpoint status -w table --clusterExample output
+---------------------------+------------------+---------+---------+-----------+------------+-----------+------------+--------------------+--------+ | ENDPOINT | ID | VERSION | DB SIZE | IS LEADER | IS LEARNER | RAFT TERM | RAFT INDEX | RAFT APPLIED INDEX | ERRORS | +---------------------------+------------------+---------+---------+-----------+------------+-----------+------------+--------------------+--------+ | https://10.0.191.37:2379 | 251cd44483d811c3 | 3.5.9 | 104 MB | false | false | 7 | 91624 | 91624 | | | https://10.0.159.225:2379 | 264c7c58ecbdabee | 3.5.9 | 41 MB | false | false | 7 | 91624 | 91624 | |1 | https://10.0.199.170:2379 | 9ac311f93915cc79 | 3.5.9 | 104 MB | true | false | 7 | 91624 | 91624 | | +---------------------------+------------------+---------+---------+-----------+------------+-----------+------------+--------------------+--------+This example shows that the database size for this etcd member is now 41 MB as opposed to the starting size of 104 MB.
Repeat these steps to connect to each of the other etcd members and defragment them. Always defragment the leader last.
Wait at least one minute between defragmentation actions to allow the etcd pod to recover. Until the etcd pod recovers, the etcd member will not respond.
If any
NOSPACEalarms were triggered due to the space quota being exceeded, clear them.Check if there are any
NOSPACEalarms:sh-4.4# etcdctl alarm listExample output
memberID:12345678912345678912 alarm:NOSPACEClear the alarms:
sh-4.4# etcdctl alarm disarm
2.4.4. Setting tuning parameters for etcd
You can set the control plane hardware speed to "Standard", "Slower", or the default, which is "".
The default setting allows the system to decide which speed to use. This value enables upgrades from versions where this feature does not exist, as the system can select values from previous versions.
By selecting one of the other values, you are overriding the default. If you see many leader elections due to timeouts or missed heartbeats and your system is set to "" or "Standard", set the hardware speed to "Slower" to make the system more tolerant to the increased latency.
2.4.4.1. Changing hardware speed tolerance
To change the hardware speed tolerance for etcd, complete the following steps.
Procedure
Check to see what the current value is by entering the following command:
$ oc describe etcd/cluster | grep "Control Plane Hardware Speed"Example output
Control Plane Hardware Speed: <VALUE>NoteIf the output is empty, the field has not been set and should be considered as the default ("").
Change the value by entering the following command. Replace
<value>with one of the valid values:"","Standard", or"Slower":$ oc patch etcd/cluster --type=merge -p '{"spec": {"controlPlaneHardwareSpeed": "<value>"}}'The following table indicates the heartbeat interval and leader election timeout for each profile. These values are subject to change.
Expand Profile
ETCD_HEARTBEAT_INTERVAL
ETCD_LEADER_ELECTION_TIMEOUT
""Varies depending on platform
Varies depending on platform
Standard100
1000
Slower500
2500
Review the output:
Example output
etcd.operator.openshift.io/cluster patchedIf you enter any value besides the valid values, error output is displayed. For example, if you entered
"Faster"as the value, the output is as follows:Example output
The Etcd "cluster" is invalid: spec.controlPlaneHardwareSpeed: Unsupported value: "Faster": supported values: "", "Standard", "Slower"Verify that the value was changed by entering the following command:
$ oc describe etcd/cluster | grep "Control Plane Hardware Speed"Example output
Control Plane Hardware Speed: ""Wait for etcd pods to roll out:
$ oc get pods -n openshift-etcd -wThe following output shows the expected entries for master-0. Before you continue, wait until all masters show a status of
4/4 Running.Example output
installer-9-ci-ln-qkgs94t-72292-9clnd-master-0 0/1 Pending 0 0s installer-9-ci-ln-qkgs94t-72292-9clnd-master-0 0/1 Pending 0 0s installer-9-ci-ln-qkgs94t-72292-9clnd-master-0 0/1 ContainerCreating 0 0s installer-9-ci-ln-qkgs94t-72292-9clnd-master-0 0/1 ContainerCreating 0 1s installer-9-ci-ln-qkgs94t-72292-9clnd-master-0 1/1 Running 0 2s installer-9-ci-ln-qkgs94t-72292-9clnd-master-0 0/1 Completed 0 34s installer-9-ci-ln-qkgs94t-72292-9clnd-master-0 0/1 Completed 0 36s installer-9-ci-ln-qkgs94t-72292-9clnd-master-0 0/1 Completed 0 36s etcd-guard-ci-ln-qkgs94t-72292-9clnd-master-0 0/1 Running 0 26m etcd-ci-ln-qkgs94t-72292-9clnd-master-0 4/4 Terminating 0 11m etcd-ci-ln-qkgs94t-72292-9clnd-master-0 4/4 Terminating 0 11m etcd-ci-ln-qkgs94t-72292-9clnd-master-0 0/4 Pending 0 0s etcd-ci-ln-qkgs94t-72292-9clnd-master-0 0/4 Init:1/3 0 1s etcd-ci-ln-qkgs94t-72292-9clnd-master-0 0/4 Init:2/3 0 2s etcd-ci-ln-qkgs94t-72292-9clnd-master-0 0/4 PodInitializing 0 3s etcd-ci-ln-qkgs94t-72292-9clnd-master-0 3/4 Running 0 4s etcd-guard-ci-ln-qkgs94t-72292-9clnd-master-0 1/1 Running 0 26m etcd-ci-ln-qkgs94t-72292-9clnd-master-0 3/4 Running 0 20s etcd-ci-ln-qkgs94t-72292-9clnd-master-0 4/4 Running 0 20sEnter the following command to review to the values:
$ oc describe -n openshift-etcd pod/<ETCD_PODNAME> | grep -e HEARTBEAT_INTERVAL -e ELECTION_TIMEOUTNoteThese values might not have changed from the default.
2.4.5. Increasing the database size for etcd
You can set the disk quota in gibibytes (GiB) for each etcd instance. If you set a disk quota for your etcd instance, you can specify integer values from 8 to 32. The default value is 8. You can specify only increasing values.
You might want to increase the disk quota if you encounter a low space alert. This alert indicates that the cluster is too large to fit in etcd despite automatic compaction and defragmentation. If you see this alert, you need to increase the disk quota immediately because after etcd runs out of space, writes fail.
Another scenario where you might want to increase the disk quota is if you encounter an excessive database growth alert. This alert is a warning that the database might grow too large in the next four hours. In this scenario, consider increasing the disk quota so that you do not eventually encounter a low space alert and possible write fails.
If you increase the disk quota, the disk space that you specify is not immediately reserved. Instead, etcd can grow to that size if needed. Ensure that etcd is running on a dedicated disk that is larger than the value that you specify for the disk quota.
For large etcd databases, the control plane nodes must have additional memory and storage. Because you must account for the API server cache, the minimum memory required is at least three times the configured size of the etcd database.
Increasing the database size for etcd is a Technology Preview feature only. Technology Preview features are not supported with Red Hat production service level agreements (SLAs) and might not be functionally complete. Red Hat does not recommend using them in production. These features provide early access to upcoming product features, enabling customers to test functionality and provide feedback during the development process.
For more information about the support scope of Red Hat Technology Preview features, see Technology Preview Features Support Scope.
2.4.5.1. Changing the etcd database size
To change the database size for etcd, complete the following steps.
Procedure
Check the current value of the disk quota for each etcd instance by entering the following command:
$ oc describe etcd/cluster | grep "Backend Quota"Example output
Backend Quota Gi B: <value>Change the value of the disk quota by entering the following command:
$ oc patch etcd/cluster --type=merge -p '{"spec": {"backendQuotaGiB": <value>}}'Example output
etcd.operator.openshift.io/cluster patched
Verification
Verify that the new value for the disk quota is set by entering the following command:
$ oc describe etcd/cluster | grep "Backend Quota"The etcd Operator automatically rolls out the etcd instances with the new values.
Verify that the etcd pods are up and running by entering the following command:
$ oc get pods -n openshift-etcdThe following output shows the expected entries.
Example output
NAME READY STATUS RESTARTS AGE etcd-ci-ln-b6kfsw2-72292-mzwbq-master-0 4/4 Running 0 39m etcd-ci-ln-b6kfsw2-72292-mzwbq-master-1 4/4 Running 0 37m etcd-ci-ln-b6kfsw2-72292-mzwbq-master-2 4/4 Running 0 41m etcd-guard-ci-ln-b6kfsw2-72292-mzwbq-master-0 1/1 Running 0 51m etcd-guard-ci-ln-b6kfsw2-72292-mzwbq-master-1 1/1 Running 0 49m etcd-guard-ci-ln-b6kfsw2-72292-mzwbq-master-2 1/1 Running 0 54m installer-5-ci-ln-b6kfsw2-72292-mzwbq-master-1 0/1 Completed 0 51m installer-7-ci-ln-b6kfsw2-72292-mzwbq-master-0 0/1 Completed 0 46m installer-7-ci-ln-b6kfsw2-72292-mzwbq-master-1 0/1 Completed 0 44m installer-7-ci-ln-b6kfsw2-72292-mzwbq-master-2 0/1 Completed 0 49m installer-8-ci-ln-b6kfsw2-72292-mzwbq-master-0 0/1 Completed 0 40m installer-8-ci-ln-b6kfsw2-72292-mzwbq-master-1 0/1 Completed 0 38m installer-8-ci-ln-b6kfsw2-72292-mzwbq-master-2 0/1 Completed 0 42m revision-pruner-7-ci-ln-b6kfsw2-72292-mzwbq-master-0 0/1 Completed 0 43m revision-pruner-7-ci-ln-b6kfsw2-72292-mzwbq-master-1 0/1 Completed 0 43m revision-pruner-7-ci-ln-b6kfsw2-72292-mzwbq-master-2 0/1 Completed 0 43m revision-pruner-8-ci-ln-b6kfsw2-72292-mzwbq-master-0 0/1 Completed 0 42m revision-pruner-8-ci-ln-b6kfsw2-72292-mzwbq-master-1 0/1 Completed 0 42m revision-pruner-8-ci-ln-b6kfsw2-72292-mzwbq-master-2 0/1 Completed 0 42mVerify that the disk quota value is updated for the etcd pod by entering the following command:
$ oc describe -n openshift-etcd pod/<etcd_podname> | grep "ETCD_QUOTA_BACKEND_BYTES"The value might not have changed from the default value of
8.Example output
ETCD_QUOTA_BACKEND_BYTES: 8589934592NoteWhile the value that you set is an integer in GiB, the value shown in the output is converted to bytes.
2.4.5.2. Troubleshooting
If you encounter issues when you try to increase the database size for etcd, the following troubleshooting steps might help.
2.4.5.2.1. Value is too small
If the value that you specify is less than 8, you see the following error message:
$ oc patch etcd/cluster --type=merge -p '{"spec": {"backendQuotaGiB": 5}}'Example error message
The Etcd "cluster" is invalid:
* spec.backendQuotaGiB: Invalid value: 5: spec.backendQuotaGiB in body should be greater than or equal to 8
* spec.backendQuotaGiB: Invalid value: "integer": etcd backendQuotaGiB may not be decreased
To resolve this issue, specify an integer between 8 and 32.
2.4.5.2.2. Value is too large
If the value that you specify is greater than 32, you see the following error message:
$ oc patch etcd/cluster --type=merge -p '{"spec": {"backendQuotaGiB": 64}}'Example error message
The Etcd "cluster" is invalid: spec.backendQuotaGiB: Invalid value: 64: spec.backendQuotaGiB in body should be less than or equal to 32
To resolve this issue, specify an integer between 8 and 32.
2.4.5.2.3. Value is decreasing
If the value is set to a valid value between 8 and 32, you cannot decrease the value. Otherwise, you see an error message.
Check to see the current value by entering the following command:
$ oc describe etcd/cluster | grep "Backend Quota"Example output
Backend Quota Gi B: 10Decrease the disk quota value by entering the following command:
$ oc patch etcd/cluster --type=merge -p '{"spec": {"backendQuotaGiB": 8}}'Example error message
The Etcd "cluster" is invalid: spec.backendQuotaGiB: Invalid value: "integer": etcd backendQuotaGiB may not be decreased-
To resolve this issue, specify an integer greater than
10.
Chapter 3. Reference design specifications
3.1. Telco core and RAN DU reference design specifications
The telco core reference design specification (RDS) describes OpenShift Container Platform 4.16 clusters running on commodity hardware that can support large scale telco applications including control plane and some centralized data plane functions.
The telco RAN RDS describes the configuration for clusters running on commodity hardware to host 5G workloads in the Radio Access Network (RAN).
3.1.1. Reference design specifications for telco 5G deployments
Red Hat and certified partners offer deep technical expertise and support for networking and operational capabilities required to run telco applications on OpenShift Container Platform 4.16 clusters.
Red Hat’s telco partners require a well-integrated, well-tested, and stable environment that can be replicated at scale for enterprise 5G solutions. The telco core and RAN DU reference design specifications (RDS) outline the recommended solution architecture based on a specific version of OpenShift Container Platform. Each RDS describes a tested and validated platform configuration for telco core and RAN DU use models. The RDS ensures an optimal experience when running your applications by defining the set of critical KPIs for telco 5G core and RAN DU. Following the RDS minimizes high severity escalations and improves application stability.
5G use cases are evolving and your workloads are continually changing. Red Hat is committed to iterating over the telco core and RAN DU RDS to support evolving requirements based on customer and partner feedback.
3.1.2. Reference design scope
The telco core and telco RAN reference design specifications (RDS) capture the recommended, tested, and supported configurations to get reliable and repeatable performance for clusters running the telco core and telco RAN profiles.
Each RDS includes the released features and supported configurations that are engineered and validated for clusters to run the individual profiles. The configurations provide a baseline OpenShift Container Platform installation that meets feature and KPI targets. Each RDS also describes expected variations for each individual configuration. Validation of each RDS includes many long duration and at-scale tests.
The validated reference configurations are updated for each major Y-stream release of OpenShift Container Platform. Z-stream patch releases are periodically re-tested against the reference configurations.
3.1.3. Deviations from the reference design
Deviating from the validated telco core and telco RAN DU reference design specifications (RDS) can have significant impact beyond the specific component or feature that you change. Deviations require analysis and engineering in the context of the complete solution.
All deviations from the RDS should be analyzed and documented with clear action tracking information. Due diligence is expected from partners to understand how to bring deviations into line with the reference design. This might require partners to provide additional resources to engage with Red Hat to work towards enabling their use case to achieve a best in class outcome with the platform. This is critical for the supportability of the solution and ensuring alignment across Red Hat and with partners.
Deviation from the RDS can have some or all of the following consequences:
- It can take longer to resolve issues.
- There is a risk of missing project service-level agreements (SLAs), project deadlines, end provider performance requirements, and so on.
Unapproved deviations may require escalation at executive levels.
NoteRed Hat prioritizes the servicing of requests for deviations based on partner engagement priorities.
3.2. Telco RAN DU reference design specification
3.2.1. Telco RAN DU 4.16 reference design overview
The Telco RAN distributed unit (DU) 4.16 reference design configures an OpenShift Container Platform 4.16 cluster running on commodity hardware to host telco RAN DU workloads. It captures the recommended, tested, and supported configurations to get reliable and repeatable performance for a cluster running the telco RAN DU profile.
3.2.1.1. Deployment architecture overview
You deploy the telco RAN DU 4.16 reference configuration to managed clusters from a centrally managed RHACM hub cluster. The reference design specification (RDS) includes configuration of the managed clusters and the hub cluster components.
Figure 3.1. Telco RAN DU deployment architecture overview

3.2.2. Telco RAN DU use model overview
Use the following information to plan telco RAN DU workloads, cluster resources, and hardware specifications for the hub cluster and managed single-node OpenShift clusters.
3.2.2.1. Telco RAN DU application workloads
DU worker nodes must have 3rd Generation Xeon (Ice Lake) 2.20 GHz or better CPUs with firmware tuned for maximum performance.
5G RAN DU user applications and workloads should conform to the following best practices and application limits:
- Develop cloud-native network functions (CNFs) that conform to the latest version of the CNF best practices guide.
- Use SR-IOV for high performance networking.
Use exec probes sparingly and only when no other suitable options are available
-
Do not use exec probes if a CNF uses CPU pinning. Use other probe implementations, for example,
httpGetortcpSocket. - When you need to use exec probes, limit the exec probe frequency and quantity. The maximum number of exec probes must be kept below 10, and frequency must not be set to less than 10 seconds.
-
Do not use exec probes if a CNF uses CPU pinning. Use other probe implementations, for example,
- Avoid using exec probes unless there is absolutely no viable alternative.
Startup probes require minimal resources during steady-state operation. The limitation on exec probes applies primarily to liveness and readiness probes.
3.2.2.2. Telco RAN DU representative reference application workload characteristics
The representative reference application workload has the following characteristics:
- Has a maximum of 15 pods and 30 containers for the vRAN application including its management and control functions
-
Uses a maximum of 2
ConfigMapand 4SecretCRs per pod - Uses a maximum of 10 exec probes with a frequency of not less than 10 seconds
Incremental application load on the
kube-apiserveris less than 10% of the cluster platform usageNoteYou can extract CPU load can from the platform metrics. For example:
query=avg_over_time(pod:container_cpu_usage:sum{namespace="openshift-kube-apiserver"}[30m])- Application logs are not collected by the platform log collector
- Aggregate traffic on the primary CNI is less than 1 MBps
3.2.2.3. Telco RAN DU worker node cluster resource utilization
The maximum number of running pods in the system, inclusive of application workloads and OpenShift Container Platform pods, is 120.
- Resource utilization
OpenShift Container Platform resource utilization varies depending on many factors including application workload characteristics such as:
- Pod count
- Type and frequency of probes
- Messaging rates on primary CNI or secondary CNI with kernel networking
- API access rate
- Logging rates
- Storage IOPS
Cluster resource requirements are applicable under the following conditions:
- The cluster is running the described representative application workload.
- The cluster is managed with the constraints described in "Telco RAN DU worker node cluster resource utilization".
- Components noted as optional in the RAN DU use model configuration are not applied.
You will need to do additional analysis to determine the impact on resource utilization and ability to meet KPI targets for configurations outside the scope of the Telco RAN DU reference design. You might have to allocate additional resources in the cluster depending on your requirements.
3.2.2.4. Hub cluster management characteristics
Red Hat Advanced Cluster Management (RHACM) is the recommended cluster management solution. Configure it to the following limits on the hub cluster:
- Configure a maximum of 5 RHACM policies with a compliant evaluation interval of at least 10 minutes.
- Use a maximum of 10 managed cluster templates in policies. Where possible, use hub-side templating.
Disable all RHACM add-ons except for the
policy-controllerandobservability-controlleradd-ons. SetObservabilityto the default configuration.ImportantConfiguring optional components or enabling additional features will result in additional resource usage and can reduce overall system performance.
For more information, see Reference design deployment components.
| Metric | Limit | Notes |
|---|---|---|
| CPU usage | Less than 4000 mc – 2 cores (4 hyperthreads) | Platform CPU is pinned to reserved cores, including both hyperthreads in each reserved core. The system is engineered to use 3 CPUs (3000mc) at steady-state to allow for periodic system tasks and spikes. |
| Memory used | Less than 16G |
3.2.2.5. Telco RAN DU RDS components
The following sections describe the various OpenShift Container Platform components and configurations that you use to configure and deploy clusters to run telco RAN DU workloads.
Figure 3.2. Telco RAN DU reference design components
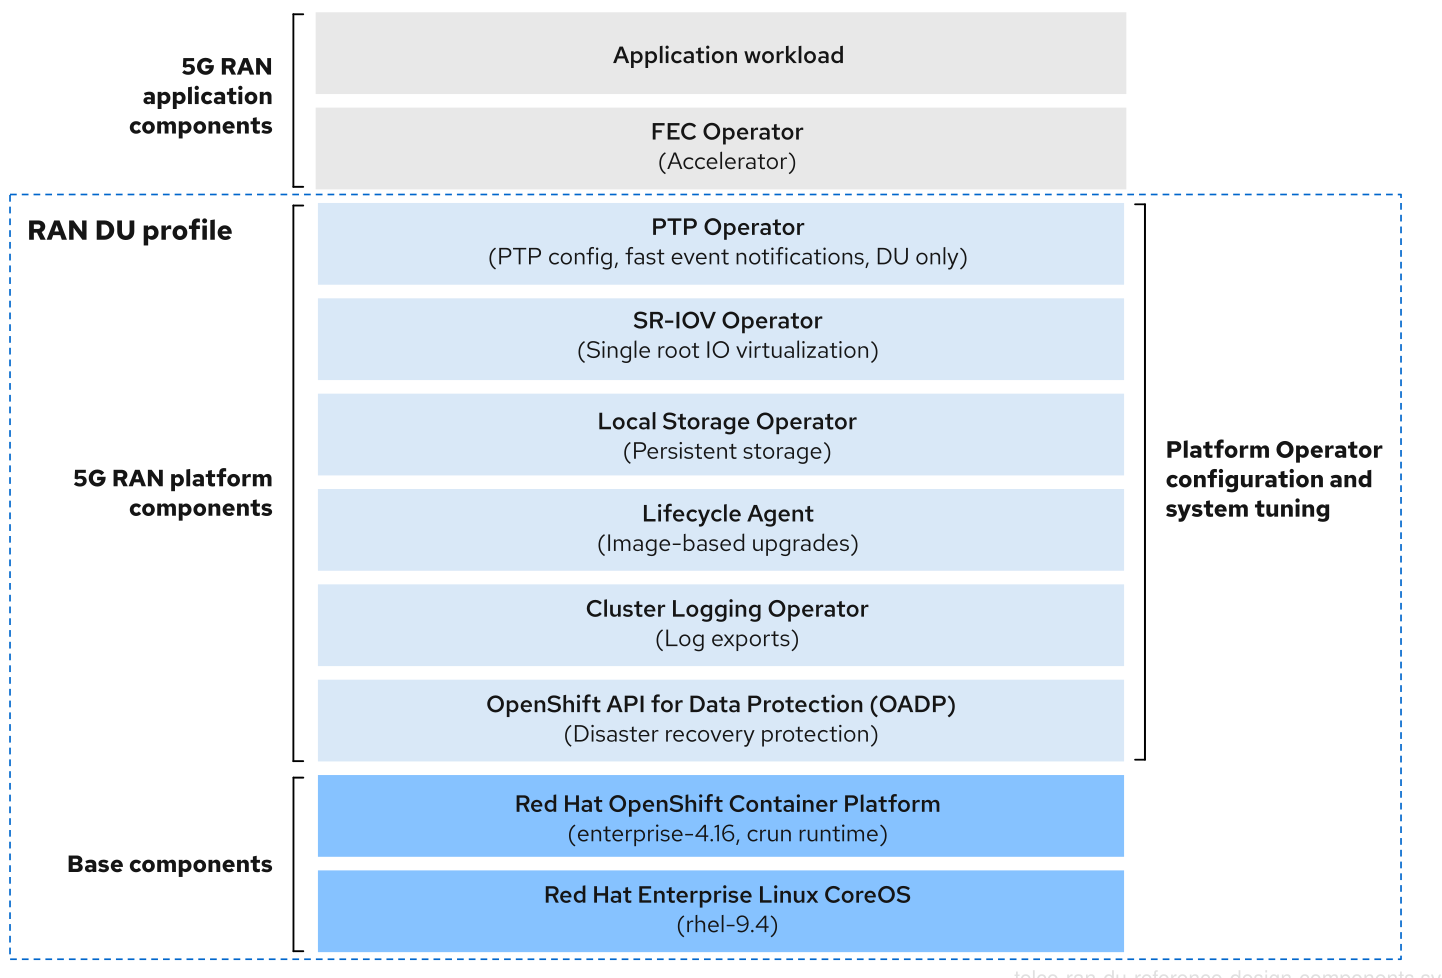
Ensure that components that are not included in the telco RAN DU profile do not affect the CPU resources allocated to workload applications.
Out of tree drivers are not supported.
3.2.3. Telco RAN DU 4.16 reference design components
The following sections describe the various OpenShift Container Platform components and configurations that you use to configure and deploy clusters to run RAN DU workloads.
3.2.3.1. Host firmware tuning
- New in this release
- No reference design updates in this release
- Description
Configure system level performance. See Configuring host firmware for low latency and high performance for recommended settings.
If Ironic inspection is enabled, the firmware setting values are available from the per-cluster
BareMetalHostCR on the hub cluster. You enable Ironic inspection with a label in thespec.clusters.nodesfield in theSiteConfigCR that you use to install the cluster. For example:nodes: - hostName: "example-node1.example.com" ironicInspect: "enabled"NoteThe telco RAN DU reference
SiteConfigdoes not enable theironicInspectfield by default.- Limits and requirements
- Hyperthreading must be enabled
- Engineering considerations
Tune all settings for maximum performance
NoteYou can tune firmware selections for power savings at the expense of performance as required.
3.2.3.2. Node Tuning Operator
- New in this release
-
With this release, the Node Tuning Operator supports setting CPU frequencies in the
PerformanceProfilefor reserved and isolated core CPUs. This is an optional feature that you can use to define specific frequencies. Use this feature to set specific frequencies by enabling theintel_pstateCPUFreqdriver in the Intel hardware. You must follow Intel’s recommendations on frequencies for FlexRAN-like applications, which requires the default CPU frequency to be set to a lower value than default running frequency. -
Previously, for the RAN DU-profile, setting the
realTimeworkload hint totruein thePerformanceProfilealways disabled theintel_pstate. With this release, the Node Tuning Operator detects the underlying Intel hardware usingTuneDand appropriately sets theintel_pstatekernel parameter based on the processor’s generation. - In this release, OpenShift Container Platform deployments with a performance profile now default to using cgroups v2 as the underlying resource management layer. If you run workloads that are not ready for this change, you can still revert to using the older cgroups v1 mechanism.
-
With this release, the Node Tuning Operator supports setting CPU frequencies in the
- Description
You tune the cluster performance by creating a performance profile. Settings that you configure with a performance profile include:
- Selecting the realtime or non-realtime kernel.
-
Allocating cores to a reserved or isolated
cpuset. OpenShift Container Platform processes allocated to the management workload partition are pinned to reserved set. - Enabling kubelet features (CPU manager, topology manager, and memory manager).
- Configuring huge pages.
- Setting additional kernel arguments.
- Setting per-core power tuning and max CPU frequency.
- Reserved and isolated core frequency tuning.
- Limits and requirements
The Node Tuning Operator uses the
PerformanceProfileCR to configure the cluster. You need to configure the following settings in the RAN DU profilePerformanceProfileCR:- Select reserved and isolated cores and ensure that you allocate at least 4 hyperthreads (equivalent to 2 cores) on Intel 3rd Generation Xeon (Ice Lake) 2.20 GHz CPUs or better with firmware tuned for maximum performance.
-
Set the reserved
cpusetto include both hyperthread siblings for each included core. Unreserved cores are available as allocatable CPU for scheduling workloads. Ensure that hyperthread siblings are not split across reserved and isolated cores. - Configure reserved and isolated CPUs to include all threads in all cores based on what you have set as reserved and isolated CPUs.
- Set core 0 of each NUMA node to be included in the reserved CPU set.
- Set the huge page size to 1G.
You should not add additional workloads to the management partition. Only those pods which are part of the OpenShift management platform should be annotated into the management partition.
- Engineering considerations
You should use the RT kernel to meet performance requirements.
NoteYou can use the non-RT kernel if required.
- The number of huge pages that you configure depends on the application workload requirements. Variation in this parameter is expected and allowed.
- Variation is expected in the configuration of reserved and isolated CPU sets based on selected hardware and additional components in use on the system. Variation must still meet the specified limits.
- Hardware without IRQ affinity support impacts isolated CPUs. To ensure that pods with guaranteed whole CPU QoS have full use of the allocated CPU, all hardware in the server must support IRQ affinity. For more information, see About support of IRQ affinity setting.
cgroup v1 is a deprecated feature. Deprecated functionality is still included in OpenShift Container Platform and continues to be supported; however, it will be removed in a future release of this product and is not recommended for new deployments.
For the most recent list of major functionality that has been deprecated or removed within OpenShift Container Platform, refer to the Deprecated and removed features section of the OpenShift Container Platform release notes.
3.2.3.3. PTP Operator
- New in this release
- Configuring linuxptp services as grandmaster clock (T-GM) for dual Intel E810 Westport Channel NICs is now a generally available feature.
-
You can configure the
linuxptpservicesptp4landphc2sysas a highly available (HA) system clock for dual PTP boundary clocks (T-BC).
- Description
See PTP timing for details of support and configuration of PTP in cluster nodes. The DU node can run in the following modes:
- As an ordinary clock (OC) synced to a grandmaster clock or boundary clock (T-BC)
- As a grandmaster clock synced from GPS with support for single or dual card E810 Westport Channel NICs.
- As dual boundary clocks (one per NIC) with support for E810 Westport Channel NICs
- Allow for High Availability of the system clock when there are multiple time sources on different NICs.
- Optional: as a boundary clock for radio units (RUs)
Events and metrics for grandmaster clocks are a Tech Preview feature added in the 4.14 telco RAN DU RDS. For more information see Using the PTP hardware fast event notifications framework.
You can subscribe applications to PTP events that happen on the node where the DU application is running.
- Limits and requirements
- Limited to two boundary clocks for dual NIC and HA
- Limited to two WPC card configuration for T-GM
- Engineering considerations
- Configurations are provided for ordinary clock, boundary clock, grandmaster clock, or PTP-HA
-
PTP fast event notifications uses
ConfigMapCRs to store PTP event subscriptions - Use Intel E810-XXV-4T Westport Channel NICs for PTP grandmaster clocks with GPS timing, minimum firmware version 4.40
3.2.3.4. SR-IOV Operator
- New in this release
-
With this release, you can use the SR-IOV Network Operator to configure QinQ (802.1ad and 802.1q) tagging. QinQ tagging provides efficient traffic management by enabling the use of both inner and outer VLAN tags. Outer VLAN tagging is hardware accelerated, leading to faster network performance. The update extends beyond the SR-IOV Network Operator itself. You can now configure QinQ on externally managed VFs by setting the outer VLAN tag using
nmstate. QinQ support varies across different NICs. For a comprehensive list of known limitations for specific NIC models, see Configuring QinQ support for SR-IOV enabled workloads in the Additional resources section. - With this release, you can configure the SR-IOV Network Operator to drain nodes in parallel during network policy updates, dramatically accelerating the setup process. This translates to significant time savings, especially for large cluster deployments that previously took hours or even days to complete.
-
With this release, you can use the SR-IOV Network Operator to configure QinQ (802.1ad and 802.1q) tagging. QinQ tagging provides efficient traffic management by enabling the use of both inner and outer VLAN tags. Outer VLAN tagging is hardware accelerated, leading to faster network performance. The update extends beyond the SR-IOV Network Operator itself. You can now configure QinQ on externally managed VFs by setting the outer VLAN tag using
- Description
-
The SR-IOV Operator provisions and configures the SR-IOV CNI and device plugins. Both
netdevice(kernel VFs) andvfio(DPDK) devices are supported. - Limits and requirements
- Use OpenShift Container Platform supported devices
- SR-IOV and IOMMU enablement in BIOS: The SR-IOV Network Operator will automatically enable IOMMU on the kernel command line.
- SR-IOV VFs do not receive link state updates from the PF. If link down detection is needed you must configure this at the protocol level.
-
You can apply multi-network policies on
netdevicedrivers types only. Multi-network policies require theiptablestool, which cannot managevfiodriver types.
- Engineering considerations
-
SR-IOV interfaces with the
vfiodriver type are typically used to enable additional secondary networks for applications that require high throughput or low latency. -
Customer variation on the configuration and number of
SriovNetworkandSriovNetworkNodePolicycustom resources (CRs) is expected. -
IOMMU kernel command-line settings are applied with a
MachineConfigCR at install time. This ensures that theSriovOperatorCR does not cause a reboot of the node when adding them. - SR-IOV support for draining nodes in parallel is not applicable in a single-node OpenShift cluster.
-
If you exclude the
SriovOperatorConfigCR from your deployment, the CR will not be created automatically. - In scenarios where you pin or restrict workloads to specific nodes, the SR-IOV parallel node drain feature will not result in the rescheduling of pods. In these scenarios, the SR-IOV Operator disables the parallel node drain functionality.
-
SR-IOV interfaces with the
3.2.3.5. Logging
- New in this release
- Cluster Logging Operator 6.0 is new in this release. Update your existing implementation to adapt to the new version of the API. You must remove the old Operator artifacts by using policies. For more information, see Additional resources.
- Description
- Use logging to collect logs from the far edge node for remote analysis. The recommended log collector is Vector.
- Engineering considerations
- Handling logs beyond the infrastructure and audit logs, for example, from the application workload requires additional CPU and network bandwidth based on additional logging rate.
As of OpenShift Container Platform 4.14, Vector is the reference log collector.
NoteUse of fluentd in the RAN use model is deprecated.
3.2.3.6. SRIOV-FEC Operator
- New in this release
- No reference design updates in this release
- Description
- SRIOV-FEC Operator is an optional 3rd party Certified Operator supporting FEC accelerator hardware.
- Limits and requirements
Starting with FEC Operator v2.7.0:
-
SecureBootis supported -
The
vfiodriver for thePFrequires the usage ofvfio-tokenthat is injected into Pods. Applications in the pod can pass theVFtoken to DPDK by using the EAL parameter--vfio-vf-token.
-
- Engineering considerations
-
The SRIOV-FEC Operator uses CPU cores from the
isolatedCPU set. - You can validate FEC readiness as part of the pre-checks for application deployment, for example, by extending the validation policy.
-
The SRIOV-FEC Operator uses CPU cores from the
3.2.3.7. Local Storage Operator
- New in this release
- No reference design updates in this release
- Description
-
You can create persistent volumes that can be used as
PVCresources by applications with the Local Storage Operator. The number and type ofPVresources that you create depends on your requirements. - Engineering considerations
-
Create backing storage for
PVCRs before creating thePV. This can be a partition, a local volume, LVM volume, or full disk. Refer to the device listing in
LocalVolumeCRs by the hardware path used to access each device to ensure correct allocation of disks and partitions. Logical names (for example,/dev/sda) are not guaranteed to be consistent across node reboots.For more information, see the RHEL 9 documentation on device identifiers.
-
Create backing storage for
3.2.3.8. LVMS Operator
- New in this release
- No reference design updates in this release
LVMS Operator is an optional component.
When you use the LVMS Operator as the storage solution, it replaces the Local Storage Operator, and the CPU required will be assigned to the management partition as platform overhead. The reference configuration must include one of these storage solutions but not both.
- Description
The LVMS Operator provides dynamic provisioning of block and file storage. The LVMS Operator creates logical volumes from local devices that can be used as
PVCresources by applications. Volume expansion and snapshots are also possible.The following example configuration creates a
vg1volume group that leverages all available disks on the node except the installation disk:StorageLVMCluster.yaml
apiVersion: lvm.topolvm.io/v1alpha1 kind: LVMCluster metadata: name: storage-lvmcluster namespace: openshift-storage annotations: ran.openshift.io/ztp-deploy-wave: "10" spec: storage: deviceClasses: - name: vg1 thinPoolConfig: name: thin-pool-1 sizePercent: 90 overprovisionRatio: 10- Limits and requirements
- In single-node OpenShift clusters, persistent storage must be provided by either LVMS or local storage, not both.
- Engineering considerations
- Ensure that sufficient disks or partitions are available for storage requirements.
3.2.3.9. Workload partitioning
- New in this release
- No reference design updates in this release
- Description
Workload partitioning pins OpenShift platform and Day 2 Operator pods that are part of the DU profile to the reserved
cpusetand removes the reserved CPU from node accounting. This leaves all unreserved CPU cores available for user workloads.The method of enabling and configuring workload partitioning changed in OpenShift Container Platform 4.14.
- 4.14 and later
Configure partitions by setting installation parameters:
cpuPartitioningMode: AllNodes-
Configure management partition cores with the reserved CPU set in the
PerformanceProfileCR
- 4.13 and earlier
-
Configure partitions with extra
MachineConfigurationCRs applied at install-time
-
Configure partitions with extra
- Limits and requirements
-
NamespaceandPodCRs must be annotated to allow the pod to be applied to the management partition - Pods with CPU limits cannot be allocated to the partition. This is because mutation can change the pod QoS.
- For more information about the minimum number of CPUs that can be allocated to the management partition, see Node Tuning Operator.
-
- Engineering considerations
- Workload Partitioning pins all management pods to reserved cores. A sufficient number of cores must be allocated to the reserved set to account for operating system, management pods, and expected spikes in CPU use that occur when the workload starts, the node reboots, or other system events happen.
3.2.3.10. Cluster tuning
- New in this release
- No reference design updates in this release
- Description
- See the section Cluster capabilities section for a full list of optional components that you enable or disable before installation.
- Limits and requirements
- Cluster capabilities are not available for installer-provisioned installation methods.
You must apply all platform tuning configurations. The following table lists the required platform tuning configurations:
Expand Table 3.2. Cluster capabilities configurations Feature Description Remove optional cluster capabilities
Reduce the OpenShift Container Platform footprint by disabling optional cluster Operators on single-node OpenShift clusters only.
- Remove all optional Operators except the Marketplace and Node Tuning Operators.
Configure cluster monitoring
Configure the monitoring stack for reduced footprint by doing the following:
-
Disable the local
alertmanagerandtelemetercomponents. -
If you use RHACM observability, the CR must be augmented with appropriate
additionalAlertManagerConfigsCRs to forward alerts to the hub cluster. Reduce the
Prometheusretention period to 24h.NoteThe RHACM hub cluster aggregates managed cluster metrics.
Disable networking diagnostics
Disable networking diagnostics for single-node OpenShift because they are not required.
Configure a single OperatorHub catalog source
Configure the cluster to use a single catalog source that contains only the Operators required for a RAN DU deployment. Each catalog source increases the CPU use on the cluster. Using a single
CatalogSourcefits within the platform CPU budget.Disable the Console Operator
If the cluster was deployed with the console disabled, the
ConsoleCR (ConsoleOperatorDisable.yaml) is not needed. If the cluster was deployed with the console enabled, you must apply theConsoleCR.
- Engineering considerations
- In this release, OpenShift Container Platform deployments use Control Groups version 2 (cgroup v2) by default. As a consequence, performance profiles in a cluster use cgroups v2 for the underlying resource management layer. If workloads running on the cluster require cgroups v1, you can configure nodes to use cgroups v1. You can make this configuration as part of the initial cluster deployment.
3.2.3.11. Machine configuration
- New in this release
- No reference design updates in this release
- Limits and requirements
The CRI-O wipe disable
MachineConfigassumes that images on disk are static other than during scheduled maintenance in defined maintenance windows. To ensure the images are static, do not set the podimagePullPolicyfield toAlways.Expand Table 3.3. Machine configuration options Feature Description Container runtime
Sets the container runtime to
crunfor all node roles.kubelet config and container mount hiding
Reduces the frequency of kubelet housekeeping and eviction monitoring to reduce CPU usage. Create a container mount namespace, visible to kubelet and CRI-O, to reduce system mount scanning resource usage.
SCTP
Optional configuration (enabled by default) Enables SCTP. SCTP is required by RAN applications but disabled by default in RHCOS.
kdump
Optional configuration (enabled by default) Enables kdump to capture debug information when a kernel panic occurs.
CRI-O wipe disable
Disables automatic wiping of the CRI-O image cache after unclean shutdown.
SR-IOV-related kernel arguments
Includes additional SR-IOV related arguments in the kernel command line.
RCU Normal systemd service
Sets
rcu_normalafter the system is fully started.One-shot time sync
Runs a one-time system time synchronization job for control plane or worker nodes.
3.2.3.12. Lifecycle Agent
- New in this release
- Use the Lifecycle Agent to enable image-based upgrades for single-node OpenShift clusters.
- Description
- The Lifecycle Agent provides local lifecycle management services for single-node OpenShift clusters.
- Limits and requirements
- The Lifecycle Agent is not applicable in multi-node clusters or single-node OpenShift clusters with an additional worker.
- Requires a persistent volume.
3.2.3.13. Reference design deployment components
The following sections describe the various OpenShift Container Platform components and configurations that you use to configure the hub cluster with Red Hat Advanced Cluster Management (RHACM).
3.2.3.13.1. Red Hat Advanced Cluster Management (RHACM)
- New in this release
-
You can now use
PolicyGeneratorresources and Red Hat Advanced Cluster Management (RHACM) to deploy polices for managed clusters with GitOps ZTP. This is a Technology Preview feature.
-
You can now use
- Description
RHACM provides Multi Cluster Engine (MCE) installation and ongoing lifecycle management functionality for deployed clusters. You declaratively specify configurations and upgrades with
PolicyCRs and apply the policies to clusters with the RHACM policy controller as managed by Topology Aware Lifecycle Manager.- GitOps Zero Touch Provisioning (ZTP) uses the MCE feature of RHACM
- Configuration, upgrades, and cluster status are managed with the RHACM policy controller
During installation RHACM can apply labels to individual nodes as configured in the
SiteConfigcustom resource (CR).- Limits and requirements
-
A single hub cluster supports up to 3500 deployed single-node OpenShift clusters with 5
PolicyCRs bound to each cluster.
-
A single hub cluster supports up to 3500 deployed single-node OpenShift clusters with 5
- Engineering considerations
- Use RHACM policy hub-side templating to better scale cluster configuration. You can significantly reduce the number of policies by using a single group policy or small number of general group policies where the group and per-cluster values are substituted into templates.
-
Cluster specific configuration: managed clusters typically have some number of configuration values that are specific to the individual cluster. These configurations should be managed using RHACM policy hub-side templating with values pulled from
ConfigMapCRs based on the cluster name. - To save CPU resources on managed clusters, policies that apply static configurations should be unbound from managed clusters after GitOps ZTP installation of the cluster.
3.2.3.13.2. Topology Aware Lifecycle Manager (TALM)
- New in this release
- No reference design updates in this release
- Description
- Managed updates
TALM is an Operator that runs only on the hub cluster for managing how changes (including cluster and Operator upgrades, configuration, and so on) are rolled out to the network. TALM does the following:
-
Progressively applies updates to fleets of clusters in user-configurable batches by using
PolicyCRs. -
Adds
ztp-donelabels or other user configurable labels on a per-cluster basis
-
Progressively applies updates to fleets of clusters in user-configurable batches by using
- Precaching for single-node OpenShift clusters
TALM supports optional precaching of OpenShift Container Platform, OLM Operator, and additional user images to single-node OpenShift clusters before initiating an upgrade.
A
PreCachingConfigcustom resource is available for specifying optional pre-caching configurations. For example:apiVersion: ran.openshift.io/v1alpha1 kind: PreCachingConfig metadata: name: example-config namespace: example-ns spec: additionalImages: - quay.io/foobar/application1@sha256:3d5800990dee7cd4727d3fe238a97e2d2976d3808fc925ada29c559a47e2e - quay.io/foobar/application2@sha256:3d5800123dee7cd4727d3fe238a97e2d2976d3808fc925ada29c559a47adf - quay.io/foobar/applicationN@sha256:4fe1334adfafadsf987123adfffdaf1243340adfafdedga0991234afdadfs spaceRequired: 45 GiB1 overrides: preCacheImage: quay.io/test_images/pre-cache:latest platformImage: quay.io/openshift-release-dev/ocp-release@sha256:3d5800990dee7cd4727d3fe238a97e2d2976d3808fc925ada29c559a47e2e operatorsIndexes: - registry.example.com:5000/custom-redhat-operators:1.0.0 operatorsPackagesAndChannels: - local-storage-operator: stable - ptp-operator: stable - sriov-network-operator: stable excludePrecachePatterns:2 - aws - vsphere
- Limits and requirements
- TALM supports concurrent cluster deployment in batches of 400
- Precaching and backup features are for single-node OpenShift clusters only.
- Engineering considerations
-
The
PreCachingConfigCR is optional and does not need to be created if you just wants to precache platform related (OpenShift and OLM Operator) images. ThePreCachingConfigCR must be applied before referencing it in theClusterGroupUpgradeCR.
-
The
3.2.3.13.3. GitOps and GitOps ZTP plugins
- New in this release
- No reference design updates in this release
- Description
GitOps and GitOps ZTP plugins provide a GitOps-based infrastructure for managing cluster deployment and configuration. Cluster definitions and configurations are maintained as a declarative state in Git. ZTP plugins provide support for generating installation CRs from the
SiteConfigCR and automatic wrapping of configuration CRs in policies based onPolicyGenTemplateCRs.You can deploy and manage multiple versions of OpenShift Container Platform on managed clusters using the baseline reference configuration CRs. You can also use custom CRs alongside the baseline CRs.
- Limits
-
300
SiteConfigCRs per ArgoCD application. You can use multiple applications to achieve the maximum number of clusters supported by a single hub cluster. -
Content in the
/source-crsfolder in Git overrides content provided in the GitOps ZTP plugin container. Git takes precedence in the search path. Add the
/source-crsfolder in the same directory as thekustomization.yamlfile, which includes thePolicyGenTemplateas a generator.NoteAlternative locations for the
/source-crsdirectory are not supported in this context.
-
300
- Engineering considerations
-
To avoid confusion or unintentional overwriting of files when updating content, use unique and distinguishable names for user-provided CRs in the
/source-crsfolder and extra manifests in Git. -
The
SiteConfigCR allows multiple extra-manifest paths. When files with the same name are found in multiple directory paths, the last file found takes precedence. This allows you to put the full set of version-specific Day 0 manifests (extra-manifests) in Git and reference them from theSiteConfigCR. With this feature, you can deploy multiple OpenShift Container Platform versions to managed clusters simultaneously. -
The
extraManifestPathfield of theSiteConfigCR is deprecated from OpenShift Container Platform 4.15 and later. Use the newextraManifests.searchPathsfield instead.
-
To avoid confusion or unintentional overwriting of files when updating content, use unique and distinguishable names for user-provided CRs in the
3.2.3.13.4. Agent-based installer
- New in this release
- No reference design updates in this release
- Description
Agent-based installer (ABI) provides installation capabilities without centralized infrastructure. The installation program creates an ISO image that you mount to the server. When the server boots it installs OpenShift Container Platform and supplied extra manifests.
NoteYou can also use ABI to install OpenShift Container Platform clusters without a hub cluster. An image registry is still required when you use ABI in this manner.
Agent-based installer (ABI) is an optional component.
- Limits and requirements
- You can supply a limited set of additional manifests at installation time.
-
You must include
MachineConfigurationCRs that are required by the RAN DU use case.
- Engineering considerations
- ABI provides a baseline OpenShift Container Platform installation.
- You install Day 2 Operators and the remainder of the RAN DU use case configurations after installation.
3.2.4. Telco RAN distributed unit (DU) reference configuration CRs
Use the following custom resources (CRs) to configure and deploy OpenShift Container Platform clusters with the telco RAN DU profile. Some of the CRs are optional depending on your requirements. CR fields you can change are annotated in the CR with YAML comments.
You can extract the complete set of RAN DU CRs from the ztp-site-generate container image. See Preparing the GitOps ZTP site configuration repository for more information.
3.2.4.1. Day 2 Operators reference CRs
| Component | Reference CR | Optional | New in this release |
|---|---|---|---|
| Cluster logging | No | No | |
| Cluster logging | No | No | |
| Cluster logging | No | No | |
| Cluster logging | No | No | |
| Cluster logging | No | No | |
| Lifecycle Agent | Yes | Yes | |
| Lifecycle Agent | Yes | Yes | |
| Lifecycle Agent | Yes | Yes | |
| Lifecycle Agent | Yes | Yes | |
| Local Storage Operator | Yes | No | |
| Local Storage Operator | Yes | No | |
| Local Storage Operator | Yes | No | |
| Local Storage Operator | Yes | No | |
| Local Storage Operator | Yes | No | |
| LVM Storage | No | Yes | |
| LVM Storage | No | Yes | |
| LVM Storage | No | Yes | |
| LVM Storage | No | Yes | |
| LVM Storage | No | Yes | |
| Node Tuning Operator | No | No | |
| Node Tuning Operator | No | No | |
| PTP fast event notifications | Yes | Yes | |
| PTP fast event notifications | Yes | Yes | |
| PTP fast event notifications | Yes | Yes | |
| PTP fast event notifications | Yes | Yes | |
| PTP fast event notifications | Yes | No | |
| PTP Operator | No | No | |
| PTP Operator | No | No | |
| PTP Operator | No | No | |
| PTP Operator | No | Yes | |
| PTP Operator | No | No | |
| PTP Operator | No | No | |
| PTP Operator | No | No | |
| PTP Operator | No | No | |
| PTP Operator | No | No | |
| PTP Operator | No | No | |
| SR-IOV FEC Operator | Yes | No | |
| SR-IOV FEC Operator | Yes | No | |
| SR-IOV FEC Operator | Yes | No | |
| SR-IOV FEC Operator | Yes | No | |
| SR-IOV Operator | No | No | |
| SR-IOV Operator | No | No | |
| SR-IOV Operator | No | No | |
| SR-IOV Operator | No | Yes | |
| SR-IOV Operator | No | No | |
| SR-IOV Operator | No | No | |
| SR-IOV Operator | No | No |
3.2.4.2. Cluster tuning reference CRs
| Component | Reference CR | Optional | New in this release |
|---|---|---|---|
| Cluster capabilities | No | No | |
| Console Operator disable | No | No | |
| Disabling network diagnostics | No | No | |
| Monitoring configuration | No | No | |
| OperatorHub | No | No | |
| OperatorHub | No | No | |
| OperatorHub | No | No | |
| OperatorHub | No | No | |
| OperatorHub | Yes | No |
3.2.4.3. Machine configuration reference CRs
| Component | Reference CR | Optional | New in this release |
|---|---|---|---|
| Container runtime (crun) | No | No | |
| Container runtime (crun) | No | No | |
| Disabling CRI-O wipe | No | No | |
| Disabling CRI-O wipe | No | No | |
| Enabling kdump | No | No | |
| Enabling kdump | No | No | |
| Kubelet configuration and container mount hiding | No | No | |
| Kubelet configuration and container mount hiding | No | No | |
| One-shot time sync | No | No | |
| One-shot time sync | No | No | |
| SCTP | No | No | |
| SCTP | No | No | |
| Set RCU Normal | No | No | |
| Set RCU Normal | No | No | |
| SR-IOV related kernel arguments | No | Yes | |
| SR-IOV related kernel arguments | No | No |
3.2.4.4. YAML reference
The following is a complete reference for all the custom resources (CRs) that make up the telco RAN DU 4.16 reference configuration.
3.2.4.4.1. Day 2 Operators reference YAML
ClusterLogForwarder.yaml
apiVersion: "logging.openshift.io/v1"
kind: ClusterLogForwarder
metadata:
name: instance
namespace: openshift-logging
annotations: {}
spec:
# outputs: $outputs
# pipelines: $pipelines
#apiVersion: "logging.openshift.io/v1"
#kind: ClusterLogForwarder
#metadata:
# name: instance
# namespace: openshift-logging
#spec:
# outputs:
# - type: "kafka"
# name: kafka-open
# url: tcp://10.46.55.190:9092/test
# pipelines:
# - inputRefs:
# - audit
# - infrastructure
# labels:
# label1: test1
# label2: test2
# label3: test3
# label4: test4
# name: all-to-default
# outputRefs:
# - kafka-openClusterLogging.yaml
apiVersion: logging.openshift.io/v1
kind: ClusterLogging
metadata:
name: instance
namespace: openshift-logging
annotations: {}
spec:
managementState: "Managed"
collection:
type: "vector"ClusterLogNS.yaml
---
apiVersion: v1
kind: Namespace
metadata:
name: openshift-logging
annotations:
workload.openshift.io/allowed: managementClusterLogOperGroup.yaml
---
apiVersion: operators.coreos.com/v1
kind: OperatorGroup
metadata:
name: cluster-logging
namespace: openshift-logging
annotations: {}
spec:
targetNamespaces:
- openshift-loggingClusterLogSubscription.yaml
apiVersion: operators.coreos.com/v1alpha1
kind: Subscription
metadata:
name: cluster-logging
namespace: openshift-logging
annotations: {}
spec:
channel: "stable"
name: cluster-logging
source: redhat-operators-disconnected
sourceNamespace: openshift-marketplace
installPlanApproval: Manual
status:
state: AtLatestKnownImageBasedUpgrade.yaml
apiVersion: lca.openshift.io/v1
kind: ImageBasedUpgrade
metadata:
name: upgrade
spec:
stage: Idle
# When setting `stage: Prep`, remember to add the seed image reference object below.
# seedImageRef:
# image: $image
# version: $versionLcaSubscription.yaml
apiVersion: operators.coreos.com/v1alpha1
kind: Subscription
metadata:
name: lifecycle-agent
namespace: openshift-lifecycle-agent
annotations: {}
spec:
channel: "stable"
name: lifecycle-agent
source: redhat-operators-disconnected
sourceNamespace: openshift-marketplace
installPlanApproval: Manual
status:
state: AtLatestKnownLcaSubscriptionNS.yaml
apiVersion: v1
kind: Namespace
metadata:
name: openshift-lifecycle-agent
annotations:
workload.openshift.io/allowed: management
labels:
kubernetes.io/metadata.name: openshift-lifecycle-agentLcaSubscriptionOperGroup.yaml
apiVersion: operators.coreos.com/v1
kind: OperatorGroup
metadata:
name: lifecycle-agent
namespace: openshift-lifecycle-agent
annotations: {}
spec:
targetNamespaces:
- openshift-lifecycle-agentStorageClass.yaml
apiVersion: storage.k8s.io/v1
kind: StorageClass
metadata:
annotations: {}
name: example-storage-class
provisioner: kubernetes.io/no-provisioner
reclaimPolicy: DeleteStorageLV.yaml
apiVersion: "local.storage.openshift.io/v1"
kind: "LocalVolume"
metadata:
name: "local-disks"
namespace: "openshift-local-storage"
annotations: {}
spec:
logLevel: Normal
managementState: Managed
storageClassDevices:
# The list of storage classes and associated devicePaths need to be specified like this example:
- storageClassName: "example-storage-class"
volumeMode: Filesystem
fsType: xfs
# The below must be adjusted to the hardware.
# For stability and reliability, it's recommended to use persistent
# naming conventions for devicePaths, such as /dev/disk/by-path.
devicePaths:
- /dev/disk/by-path/pci-0000:05:00.0-nvme-1
#---
## How to verify
## 1. Create a PVC
# apiVersion: v1
# kind: PersistentVolumeClaim
# metadata:
# name: local-pvc-name
# spec:
# accessModes:
# - ReadWriteOnce
# volumeMode: Filesystem
# resources:
# requests:
# storage: 100Gi
# storageClassName: example-storage-class
#---
## 2. Create a pod that mounts it
# apiVersion: v1
# kind: Pod
# metadata:
# labels:
# run: busybox
# name: busybox
# spec:
# containers:
# - image: quay.io/quay/busybox:latest
# name: busybox
# resources: {}
# command: ["/bin/sh", "-c", "sleep infinity"]
# volumeMounts:
# - name: local-pvc
# mountPath: /data
# volumes:
# - name: local-pvc
# persistentVolumeClaim:
# claimName: local-pvc-name
# dnsPolicy: ClusterFirst
# restartPolicy: Always
## 3. Run the pod on the cluster and verify the size and access of the `/data` mountStorageNS.yaml
apiVersion: v1
kind: Namespace
metadata:
name: openshift-local-storage
annotations:
workload.openshift.io/allowed: managementStorageOperGroup.yaml
apiVersion: operators.coreos.com/v1
kind: OperatorGroup
metadata:
name: openshift-local-storage
namespace: openshift-local-storage
annotations: {}
spec:
targetNamespaces:
- openshift-local-storageStorageSubscription.yaml
apiVersion: operators.coreos.com/v1alpha1
kind: Subscription
metadata:
name: local-storage-operator
namespace: openshift-local-storage
annotations: {}
spec:
channel: "stable"
name: local-storage-operator
source: redhat-operators-disconnected
sourceNamespace: openshift-marketplace
installPlanApproval: Manual
status:
state: AtLatestKnownLVMOperatorStatus.yaml
# This CR verifies the installation/upgrade of the Sriov Network Operator
apiVersion: operators.coreos.com/v1
kind: Operator
metadata:
name: lvms-operator.openshift-storage
annotations: {}
status:
components:
refs:
- kind: Subscription
namespace: openshift-storage
conditions:
- type: CatalogSourcesUnhealthy
status: "False"
- kind: InstallPlan
namespace: openshift-storage
conditions:
- type: Installed
status: "True"
- kind: ClusterServiceVersion
namespace: openshift-storage
conditions:
- type: Succeeded
status: "True"
reason: InstallSucceededStorageLVMCluster.yaml
apiVersion: lvm.topolvm.io/v1alpha1
kind: LVMCluster
metadata:
name: lvmcluster
namespace: openshift-storage
annotations: {}
spec: {}
#example: creating a vg1 volume group leveraging all available disks on the node
# except the installation disk.
# storage:
# deviceClasses:
# - name: vg1
# thinPoolConfig:
# name: thin-pool-1
# sizePercent: 90
# overprovisionRatio: 10StorageLVMSubscription.yaml
apiVersion: operators.coreos.com/v1alpha1
kind: Subscription
metadata:
name: lvms-operator
namespace: openshift-storage
annotations: {}
spec:
channel: "stable"
name: lvms-operator
source: redhat-operators-disconnected
sourceNamespace: openshift-marketplace
installPlanApproval: Manual
status:
state: AtLatestKnownStorageLVMSubscriptionNS.yaml
apiVersion: v1
kind: Namespace
metadata:
name: openshift-storage
labels:
workload.openshift.io/allowed: "management"
openshift.io/cluster-monitoring: "true"
annotations: {}StorageLVMSubscriptionOperGroup.yaml
apiVersion: operators.coreos.com/v1
kind: OperatorGroup
metadata:
name: lvms-operator-operatorgroup
namespace: openshift-storage
annotations: {}
spec:
targetNamespaces:
- openshift-storagePerformanceProfile.yaml
apiVersion: performance.openshift.io/v2
kind: PerformanceProfile
metadata:
# if you change this name make sure the 'include' line in TunedPerformancePatch.yaml
# matches this name: include=openshift-node-performance-${PerformanceProfile.metadata.name}
# Also in file 'validatorCRs/informDuValidator.yaml':
# name: 50-performance-${PerformanceProfile.metadata.name}
name: openshift-node-performance-profile
annotations:
ran.openshift.io/reference-configuration: "ran-du.redhat.com"
spec:
additionalKernelArgs:
- "rcupdate.rcu_normal_after_boot=0"
- "efi=runtime"
- "vfio_pci.enable_sriov=1"
- "vfio_pci.disable_idle_d3=1"
- "module_blacklist=irdma"
cpu:
isolated: $isolated
reserved: $reserved
hugepages:
defaultHugepagesSize: $defaultHugepagesSize
pages:
- size: $size
count: $count
node: $node
machineConfigPoolSelector:
pools.operator.machineconfiguration.openshift.io/$mcp: ""
nodeSelector:
node-role.kubernetes.io/$mcp: ''
numa:
topologyPolicy: "restricted"
# To use the standard (non-realtime) kernel, set enabled to false
realTimeKernel:
enabled: true
workloadHints:
# WorkloadHints defines the set of upper level flags for different type of workloads.
# See https://github.com/openshift/cluster-node-tuning-operator/blob/master/docs/performanceprofile/performance_profile.md#workloadhints
# for detailed descriptions of each item.
# The configuration below is set for a low latency, performance mode.
realTime: true
highPowerConsumption: false
perPodPowerManagement: falseTunedPerformancePatch.yaml
apiVersion: tuned.openshift.io/v1
kind: Tuned
metadata:
name: performance-patch
namespace: openshift-cluster-node-tuning-operator
annotations: {}
spec:
profile:
- name: performance-patch
# Please note:
# - The 'include' line must match the associated PerformanceProfile name, following below pattern
# include=openshift-node-performance-${PerformanceProfile.metadata.name}
# - When using the standard (non-realtime) kernel, remove the kernel.timer_migration override from
# the [sysctl] section and remove the entire section if it is empty.
data: |
[main]
summary=Configuration changes profile inherited from performance created tuned
include=openshift-node-performance-openshift-node-performance-profile
[scheduler]
group.ice-ptp=0:f:10:*:ice-ptp.*
group.ice-gnss=0:f:10:*:ice-gnss.*
group.ice-dplls=0:f:10:*:ice-dplls.*
[service]
service.stalld=start,enable
service.chronyd=stop,disable
recommend:
- machineConfigLabels:
machineconfiguration.openshift.io/role: "$mcp"
priority: 19
profile: performance-patchPtpConfigBoundaryForEvent.yaml
apiVersion: ptp.openshift.io/v1
kind: PtpConfig
metadata:
name: boundary
namespace: openshift-ptp
annotations: {}
spec:
profile:
- name: "boundary"
ptp4lOpts: "-2 --summary_interval -4"
phc2sysOpts: "-a -r -m -n 24 -N 8 -R 16"
ptpSchedulingPolicy: SCHED_FIFO
ptpSchedulingPriority: 10
ptpSettings:
logReduce: "true"
ptp4lConf: |
# The interface name is hardware-specific
[$iface_slave]
masterOnly 0
[$iface_master_1]
masterOnly 1
[$iface_master_2]
masterOnly 1
[$iface_master_3]
masterOnly 1
[global]
#
# Default Data Set
#
twoStepFlag 1
slaveOnly 0
priority1 128
priority2 128
domainNumber 24
#utc_offset 37
clockClass 248
clockAccuracy 0xFE
offsetScaledLogVariance 0xFFFF
free_running 0
freq_est_interval 1
dscp_event 0
dscp_general 0
dataset_comparison G.8275.x
G.8275.defaultDS.localPriority 128
#
# Port Data Set
#
logAnnounceInterval -3
logSyncInterval -4
logMinDelayReqInterval -4
logMinPdelayReqInterval -4
announceReceiptTimeout 3
syncReceiptTimeout 0
delayAsymmetry 0
fault_reset_interval -4
neighborPropDelayThresh 20000000
masterOnly 0
G.8275.portDS.localPriority 128
#
# Run time options
#
assume_two_step 0
logging_level 6
path_trace_enabled 0
follow_up_info 0
hybrid_e2e 0
inhibit_multicast_service 0
net_sync_monitor 0
tc_spanning_tree 0
tx_timestamp_timeout 50
unicast_listen 0
unicast_master_table 0
unicast_req_duration 3600
use_syslog 1
verbose 0
summary_interval 0
kernel_leap 1
check_fup_sync 0
clock_class_threshold 135
#
# Servo Options
#
pi_proportional_const 0.0
pi_integral_const 0.0
pi_proportional_scale 0.0
pi_proportional_exponent -0.3
pi_proportional_norm_max 0.7
pi_integral_scale 0.0
pi_integral_exponent 0.4
pi_integral_norm_max 0.3
step_threshold 2.0
first_step_threshold 0.00002
max_frequency 900000000
clock_servo pi
sanity_freq_limit 200000000
ntpshm_segment 0
#
# Transport options
#
transportSpecific 0x0
ptp_dst_mac 01:1B:19:00:00:00
p2p_dst_mac 01:80:C2:00:00:0E
udp_ttl 1
udp6_scope 0x0E
uds_address /var/run/ptp4l
#
# Default interface options
#
clock_type BC
network_transport L2
delay_mechanism E2E
time_stamping hardware
tsproc_mode filter
delay_filter moving_median
delay_filter_length 10
egressLatency 0
ingressLatency 0
boundary_clock_jbod 0
#
# Clock description
#
productDescription ;;
revisionData ;;
manufacturerIdentity 00:00:00
userDescription ;
timeSource 0xA0
recommend:
- profile: "boundary"
priority: 4
match:
- nodeLabel: "node-role.kubernetes.io/$mcp"PtpConfigForHAForEvent.yaml
apiVersion: ptp.openshift.io/v1
kind: PtpConfig
metadata:
name: boundary-ha
namespace: openshift-ptp
annotations: {}
spec:
profile:
- name: "boundary-ha"
ptp4lOpts: " "
phc2sysOpts: "-a -r -m -n 24 -N 8 -R 16"
ptpSchedulingPolicy: SCHED_FIFO
ptpSchedulingPriority: 10
ptpSettings:
logReduce: "true"
haProfiles: "$profile1,$profile2"
recommend:
- profile: "boundary-ha"
priority: 4
match:
- nodeLabel: "node-role.kubernetes.io/$mcp"PtpConfigMasterForEvent.yaml
# The grandmaster profile is provided for testing only
# It is not installed on production clusters
apiVersion: ptp.openshift.io/v1
kind: PtpConfig
metadata:
name: grandmaster
namespace: openshift-ptp
annotations: {}
spec:
profile:
- name: "grandmaster"
# The interface name is hardware-specific
interface: $interface
ptp4lOpts: "-2 --summary_interval -4"
phc2sysOpts: "-a -r -m -n 24 -N 8 -R 16"
ptpSchedulingPolicy: SCHED_FIFO
ptpSchedulingPriority: 10
ptpSettings:
logReduce: "true"
ptp4lConf: |
[global]
#
# Default Data Set
#
twoStepFlag 1
slaveOnly 0
priority1 128
priority2 128
domainNumber 24
#utc_offset 37
clockClass 255
clockAccuracy 0xFE
offsetScaledLogVariance 0xFFFF
free_running 0
freq_est_interval 1
dscp_event 0
dscp_general 0
dataset_comparison G.8275.x
G.8275.defaultDS.localPriority 128
#
# Port Data Set
#
logAnnounceInterval -3
logSyncInterval -4
logMinDelayReqInterval -4
logMinPdelayReqInterval -4
announceReceiptTimeout 3
syncReceiptTimeout 0
delayAsymmetry 0
fault_reset_interval -4
neighborPropDelayThresh 20000000
masterOnly 0
G.8275.portDS.localPriority 128
#
# Run time options
#
assume_two_step 0
logging_level 6
path_trace_enabled 0
follow_up_info 0
hybrid_e2e 0
inhibit_multicast_service 0
net_sync_monitor 0
tc_spanning_tree 0
tx_timestamp_timeout 50
unicast_listen 0
unicast_master_table 0
unicast_req_duration 3600
use_syslog 1
verbose 0
summary_interval 0
kernel_leap 1
check_fup_sync 0
clock_class_threshold 7
#
# Servo Options
#
pi_proportional_const 0.0
pi_integral_const 0.0
pi_proportional_scale 0.0
pi_proportional_exponent -0.3
pi_proportional_norm_max 0.7
pi_integral_scale 0.0
pi_integral_exponent 0.4
pi_integral_norm_max 0.3
step_threshold 2.0
first_step_threshold 0.00002
max_frequency 900000000
clock_servo pi
sanity_freq_limit 200000000
ntpshm_segment 0
#
# Transport options
#
transportSpecific 0x0
ptp_dst_mac 01:1B:19:00:00:00
p2p_dst_mac 01:80:C2:00:00:0E
udp_ttl 1
udp6_scope 0x0E
uds_address /var/run/ptp4l
#
# Default interface options
#
clock_type OC
network_transport L2
delay_mechanism E2E
time_stamping hardware
tsproc_mode filter
delay_filter moving_median
delay_filter_length 10
egressLatency 0
ingressLatency 0
boundary_clock_jbod 0
#
# Clock description
#
productDescription ;;
revisionData ;;
manufacturerIdentity 00:00:00
userDescription ;
timeSource 0xA0
recommend:
- profile: "grandmaster"
priority: 4
match:
- nodeLabel: "node-role.kubernetes.io/$mcp"PtpConfigSlaveForEvent.yaml
apiVersion: ptp.openshift.io/v1
kind: PtpConfig
metadata:
name: du-ptp-slave
namespace: openshift-ptp
annotations: {}
spec:
profile:
- name: "slave"
# The interface name is hardware-specific
interface: $interface
ptp4lOpts: "-2 -s --summary_interval -4"
phc2sysOpts: "-a -r -m -n 24 -N 8 -R 16"
ptpSchedulingPolicy: SCHED_FIFO
ptpSchedulingPriority: 10
ptpSettings:
logReduce: "true"
ptp4lConf: |
[global]
#
# Default Data Set
#
twoStepFlag 1
slaveOnly 1
priority1 128
priority2 128
domainNumber 24
#utc_offset 37
clockClass 255
clockAccuracy 0xFE
offsetScaledLogVariance 0xFFFF
free_running 0
freq_est_interval 1
dscp_event 0
dscp_general 0
dataset_comparison G.8275.x
G.8275.defaultDS.localPriority 128
#
# Port Data Set
#
logAnnounceInterval -3
logSyncInterval -4
logMinDelayReqInterval -4
logMinPdelayReqInterval -4
announceReceiptTimeout 3
syncReceiptTimeout 0
delayAsymmetry 0
fault_reset_interval -4
neighborPropDelayThresh 20000000
masterOnly 0
G.8275.portDS.localPriority 128
#
# Run time options
#
assume_two_step 0
logging_level 6
path_trace_enabled 0
follow_up_info 0
hybrid_e2e 0
inhibit_multicast_service 0
net_sync_monitor 0
tc_spanning_tree 0
tx_timestamp_timeout 50
unicast_listen 0
unicast_master_table 0
unicast_req_duration 3600
use_syslog 1
verbose 0
summary_interval 0
kernel_leap 1
check_fup_sync 0
clock_class_threshold 7
#
# Servo Options
#
pi_proportional_const 0.0
pi_integral_const 0.0
pi_proportional_scale 0.0
pi_proportional_exponent -0.3
pi_proportional_norm_max 0.7
pi_integral_scale 0.0
pi_integral_exponent 0.4
pi_integral_norm_max 0.3
step_threshold 2.0
first_step_threshold 0.00002
max_frequency 900000000
clock_servo pi
sanity_freq_limit 200000000
ntpshm_segment 0
#
# Transport options
#
transportSpecific 0x0
ptp_dst_mac 01:1B:19:00:00:00
p2p_dst_mac 01:80:C2:00:00:0E
udp_ttl 1
udp6_scope 0x0E
uds_address /var/run/ptp4l
#
# Default interface options
#
clock_type OC
network_transport L2
delay_mechanism E2E
time_stamping hardware
tsproc_mode filter
delay_filter moving_median
delay_filter_length 10
egressLatency 0
ingressLatency 0
boundary_clock_jbod 0
#
# Clock description
#
productDescription ;;
revisionData ;;
manufacturerIdentity 00:00:00
userDescription ;
timeSource 0xA0
recommend:
- profile: "slave"
priority: 4
match:
- nodeLabel: "node-role.kubernetes.io/$mcp"PtpOperatorConfigForEvent.yaml
apiVersion: ptp.openshift.io/v1
kind: PtpOperatorConfig
metadata:
name: default
namespace: openshift-ptp
annotations: {}
spec:
daemonNodeSelector:
node-role.kubernetes.io/$mcp: ""
ptpEventConfig:
enableEventPublisher: true
transportHost: "http://ptp-event-publisher-service-NODE_NAME.openshift-ptp.svc.cluster.local:9043"PtpConfigBoundary.yaml
apiVersion: ptp.openshift.io/v1
kind: PtpConfig
metadata:
name: boundary
namespace: openshift-ptp
annotations: {}
spec:
profile:
- name: "boundary"
ptp4lOpts: "-2"
phc2sysOpts: "-a -r -n 24"
ptpSchedulingPolicy: SCHED_FIFO
ptpSchedulingPriority: 10
ptpSettings:
logReduce: "true"
ptp4lConf: |
# The interface name is hardware-specific
[$iface_slave]
masterOnly 0
[$iface_master_1]
masterOnly 1
[$iface_master_2]
masterOnly 1
[$iface_master_3]
masterOnly 1
[global]
#
# Default Data Set
#
twoStepFlag 1
slaveOnly 0
priority1 128
priority2 128
domainNumber 24
#utc_offset 37
clockClass 248
clockAccuracy 0xFE
offsetScaledLogVariance 0xFFFF
free_running 0
freq_est_interval 1
dscp_event 0
dscp_general 0
dataset_comparison G.8275.x
G.8275.defaultDS.localPriority 128
#
# Port Data Set
#
logAnnounceInterval -3
logSyncInterval -4
logMinDelayReqInterval -4
logMinPdelayReqInterval -4
announceReceiptTimeout 3
syncReceiptTimeout 0
delayAsymmetry 0
fault_reset_interval -4
neighborPropDelayThresh 20000000
masterOnly 0
G.8275.portDS.localPriority 128
#
# Run time options
#
assume_two_step 0
logging_level 6
path_trace_enabled 0
follow_up_info 0
hybrid_e2e 0
inhibit_multicast_service 0
net_sync_monitor 0
tc_spanning_tree 0
tx_timestamp_timeout 50
unicast_listen 0
unicast_master_table 0
unicast_req_duration 3600
use_syslog 1
verbose 0
summary_interval 0
kernel_leap 1
check_fup_sync 0
clock_class_threshold 135
#
# Servo Options
#
pi_proportional_const 0.0
pi_integral_const 0.0
pi_proportional_scale 0.0
pi_proportional_exponent -0.3
pi_proportional_norm_max 0.7
pi_integral_scale 0.0
pi_integral_exponent 0.4
pi_integral_norm_max 0.3
step_threshold 2.0
first_step_threshold 0.00002
max_frequency 900000000
clock_servo pi
sanity_freq_limit 200000000
ntpshm_segment 0
#
# Transport options
#
transportSpecific 0x0
ptp_dst_mac 01:1B:19:00:00:00
p2p_dst_mac 01:80:C2:00:00:0E
udp_ttl 1
udp6_scope 0x0E
uds_address /var/run/ptp4l
#
# Default interface options
#
clock_type BC
network_transport L2
delay_mechanism E2E
time_stamping hardware
tsproc_mode filter
delay_filter moving_median
delay_filter_length 10
egressLatency 0
ingressLatency 0
boundary_clock_jbod 0
#
# Clock description
#
productDescription ;;
revisionData ;;
manufacturerIdentity 00:00:00
userDescription ;
timeSource 0xA0
recommend:
- profile: "boundary"
priority: 4
match:
- nodeLabel: "node-role.kubernetes.io/$mcp"PtpConfigDualCardGmWpc.yaml
# The grandmaster profile is provided for testing only
# It is not installed on production clusters
# In this example two cards $iface_nic1 and $iface_nic2 are connected via
# SMA1 ports by a cable and $iface_nic2 receives 1PPS signals from $iface_nic1
apiVersion: ptp.openshift.io/v1
kind: PtpConfig
metadata:
name: grandmaster
namespace: openshift-ptp
annotations: {}
spec:
profile:
- name: "grandmaster"
ptp4lOpts: "-2 --summary_interval -4"
phc2sysOpts: -r -u 0 -m -w -N 8 -R 16 -s $iface_nic1 -n 24
ptpSchedulingPolicy: SCHED_FIFO
ptpSchedulingPriority: 10
ptpSettings:
logReduce: "true"
plugins:
e810:
enableDefaultConfig: false
settings:
LocalMaxHoldoverOffSet: 1500
LocalHoldoverTimeout: 14400
MaxInSpecOffset: 1500
pins: $e810_pins
# "$iface_nic1":
# "U.FL2": "0 2"
# "U.FL1": "0 1"
# "SMA2": "0 2"
# "SMA1": "2 1"
# "$iface_nic2":
# "U.FL2": "0 2"
# "U.FL1": "0 1"
# "SMA2": "0 2"
# "SMA1": "1 1"
ublxCmds:
- args: #ubxtool -P 29.20 -z CFG-HW-ANT_CFG_VOLTCTRL,1
- "-P"
- "29.20"
- "-z"
- "CFG-HW-ANT_CFG_VOLTCTRL,1"
reportOutput: false
- args: #ubxtool -P 29.20 -e GPS
- "-P"
- "29.20"
- "-e"
- "GPS"
reportOutput: false
- args: #ubxtool -P 29.20 -d Galileo
- "-P"
- "29.20"
- "-d"
- "Galileo"
reportOutput: false
- args: #ubxtool -P 29.20 -d GLONASS
- "-P"
- "29.20"
- "-d"
- "GLONASS"
reportOutput: false
- args: #ubxtool -P 29.20 -d BeiDou
- "-P"
- "29.20"
- "-d"
- "BeiDou"
reportOutput: false
- args: #ubxtool -P 29.20 -d SBAS
- "-P"
- "29.20"
- "-d"
- "SBAS"
reportOutput: false
- args: #ubxtool -P 29.20 -t -w 5 -v 1 -e SURVEYIN,600,50000
- "-P"
- "29.20"
- "-t"
- "-w"
- "5"
- "-v"
- "1"
- "-e"
- "SURVEYIN,600,50000"
reportOutput: true
- args: #ubxtool -P 29.20 -p MON-HW
- "-P"
- "29.20"
- "-p"
- "MON-HW"
reportOutput: true
- args: #ubxtool -P 29.20 -p CFG-MSG,1,38,300
- "-P"
- "29.20"
- "-p"
- "CFG-MSG,1,38,300"
reportOutput: true
ts2phcOpts: " "
ts2phcConf: |
[nmea]
ts2phc.master 1
[global]
use_syslog 0
verbose 1
logging_level 7
ts2phc.pulsewidth 100000000
#cat /dev/GNSS to find available serial port
#example value of gnss_serialport is /dev/ttyGNSS_1700_0
ts2phc.nmea_serialport $gnss_serialport
leapfile /usr/share/zoneinfo/leap-seconds.list
[$iface_nic1]
ts2phc.extts_polarity rising
ts2phc.extts_correction 0
[$iface_nic2]
ts2phc.master 0
ts2phc.extts_polarity rising
#this is a measured value in nanoseconds to compensate for SMA cable delay
ts2phc.extts_correction -10
ptp4lConf: |
[$iface_nic1]
masterOnly 1
[$iface_nic1_1]
masterOnly 1
[$iface_nic1_2]
masterOnly 1
[$iface_nic1_3]
masterOnly 1
[$iface_nic2]
masterOnly 1
[$iface_nic2_1]
masterOnly 1
[$iface_nic2_2]
masterOnly 1
[$iface_nic2_3]
masterOnly 1
[global]
#
# Default Data Set
#
twoStepFlag 1
priority1 128
priority2 128
domainNumber 24
#utc_offset 37
clockClass 6
clockAccuracy 0x27
offsetScaledLogVariance 0xFFFF
free_running 0
freq_est_interval 1
dscp_event 0
dscp_general 0
dataset_comparison G.8275.x
G.8275.defaultDS.localPriority 128
#
# Port Data Set
#
logAnnounceInterval -3
logSyncInterval -4
logMinDelayReqInterval -4
logMinPdelayReqInterval 0
announceReceiptTimeout 3
syncReceiptTimeout 0
delayAsymmetry 0
fault_reset_interval -4
neighborPropDelayThresh 20000000
masterOnly 0
G.8275.portDS.localPriority 128
#
# Run time options
#
assume_two_step 0
logging_level 6
path_trace_enabled 0
follow_up_info 0
hybrid_e2e 0
inhibit_multicast_service 0
net_sync_monitor 0
tc_spanning_tree 0
tx_timestamp_timeout 50
unicast_listen 0
unicast_master_table 0
unicast_req_duration 3600
use_syslog 1
verbose 0
summary_interval -4
kernel_leap 1
check_fup_sync 0
clock_class_threshold 7
#
# Servo Options
#
pi_proportional_const 0.0
pi_integral_const 0.0
pi_proportional_scale 0.0
pi_proportional_exponent -0.3
pi_proportional_norm_max 0.7
pi_integral_scale 0.0
pi_integral_exponent 0.4
pi_integral_norm_max 0.3
step_threshold 2.0
first_step_threshold 0.00002
clock_servo pi
sanity_freq_limit 200000000
ntpshm_segment 0
#
# Transport options
#
transportSpecific 0x0
ptp_dst_mac 01:1B:19:00:00:00
p2p_dst_mac 01:80:C2:00:00:0E
udp_ttl 1
udp6_scope 0x0E
uds_address /var/run/ptp4l
#
# Default interface options
#
clock_type BC
network_transport L2
delay_mechanism E2E
time_stamping hardware
tsproc_mode filter
delay_filter moving_median
delay_filter_length 10
egressLatency 0
ingressLatency 0
boundary_clock_jbod 1
#
# Clock description
#
productDescription ;;
revisionData ;;
manufacturerIdentity 00:00:00
userDescription ;
timeSource 0x20
recommend:
- profile: "grandmaster"
priority: 4
match:
- nodeLabel: "node-role.kubernetes.io/$mcp"PtpConfigThreeCardGmWpc.yaml
# In this example, the three cards are connected via SMA cables:
# - $iface_nic1 has the GNSS signal input
# - $iface_nic2 SMA1 is connected to $iface_nic1 SMA1
# - $iface_nic3 SMA1 is connected to $iface_nic1 SMA2
apiVersion: ptp.openshift.io/v1
kind: PtpConfig
metadata:
name: grandmaster
namespace: openshift-ptp
annotations:
{}
spec:
profile:
- name: grandmaster
ptp4lOpts: -2 --summary_interval -4
phc2sysOpts: -r -u 0 -m -N 8 -R 16 -s $iface_nic1 -n 24
ptpSchedulingPolicy: SCHED_FIFO
ptpSchedulingPriority: 10
ptpSettings:
logReduce: "true"
plugins:
e810:
enableDefaultConfig: false
settings:
LocalHoldoverTimeout: 14400
LocalMaxHoldoverOffSet: 1500
MaxInSpecOffset: 1500
pins:
# Syntax guide:
# - The 1st number in each pair must be one of:
# 0 - Disabled
# 1 - RX
# 2 - TX
# - The 2nd number in each pair must match the channel number
$iface_nic1:
SMA1: 2 1
SMA2: 2 2
U.FL1: 0 1
U.FL2: 0 2
$iface_nic2:
SMA1: 1 1
SMA2: 0 2
U.FL1: 0 1
U.FL2: 0 2
$iface_nic3:
SMA1: 1 1
SMA2: 0 2
U.FL1: 0 1
U.FL2: 0 2
ublxCmds:
- args: #ubxtool -P 29.20 -z CFG-HW-ANT_CFG_VOLTCTRL,1
- "-P"
- "29.20"
- "-z"
- "CFG-HW-ANT_CFG_VOLTCTRL,1"
reportOutput: false
- args: #ubxtool -P 29.20 -e GPS
- "-P"
- "29.20"
- "-e"
- "GPS"
reportOutput: false
- args: #ubxtool -P 29.20 -d Galileo
- "-P"
- "29.20"
- "-d"
- "Galileo"
reportOutput: false
- args: #ubxtool -P 29.20 -d GLONASS
- "-P"
- "29.20"
- "-d"
- "GLONASS"
reportOutput: false
- args: #ubxtool -P 29.20 -d BeiDou
- "-P"
- "29.20"
- "-d"
- "BeiDou"
reportOutput: false
- args: #ubxtool -P 29.20 -d SBAS
- "-P"
- "29.20"
- "-d"
- "SBAS"
reportOutput: false
- args: #ubxtool -P 29.20 -t -w 5 -v 1 -e SURVEYIN,600,50000
- "-P"
- "29.20"
- "-t"
- "-w"
- "5"
- "-v"
- "1"
- "-e"
- "SURVEYIN,600,50000"
reportOutput: true
- args: #ubxtool -P 29.20 -p MON-HW
- "-P"
- "29.20"
- "-p"
- "MON-HW"
reportOutput: true
- args: #ubxtool -P 29.20 -p CFG-MSG,1,38,248
- "-P"
- "29.20"
- "-p"
- "CFG-MSG,1,38,248"
reportOutput: true
ts2phcOpts: " "
ts2phcConf: |
[nmea]
ts2phc.master 1
[global]
use_syslog 0
verbose 1
logging_level 7
ts2phc.pulsewidth 100000000
#example value of nmea_serialport is /dev/gnss0
ts2phc.nmea_serialport (?<gnss_serialport>[/\w\s/]+)
leapfile /usr/share/zoneinfo/leap-seconds.list
[$iface_nic1]
ts2phc.extts_polarity rising
ts2phc.extts_correction 0
[$iface_nic2]
ts2phc.master 0
ts2phc.extts_polarity rising
#this is a measured value in nanoseconds to compensate for SMA cable delay
ts2phc.extts_correction -10
[$iface_nic3]
ts2phc.master 0
ts2phc.extts_polarity rising
#this is a measured value in nanoseconds to compensate for SMA cable delay
ts2phc.extts_correction -10
ptp4lConf: |
[$iface_nic1]
masterOnly 1
[$iface_nic1_1]
masterOnly 1
[$iface_nic1_2]
masterOnly 1
[$iface_nic1_3]
masterOnly 1
[$iface_nic2]
masterOnly 1
[$iface_nic2_1]
masterOnly 1
[$iface_nic2_2]
masterOnly 1
[$iface_nic2_3]
masterOnly 1
[$iface_nic3]
masterOnly 1
[$iface_nic3_1]
masterOnly 1
[$iface_nic3_2]
masterOnly 1
[$iface_nic3_3]
masterOnly 1
[global]
#
# Default Data Set
#
twoStepFlag 1
priority1 128
priority2 128
domainNumber 24
#utc_offset 37
clockClass 6
clockAccuracy 0x27
offsetScaledLogVariance 0xFFFF
free_running 0
freq_est_interval 1
dscp_event 0
dscp_general 0
dataset_comparison G.8275.x
G.8275.defaultDS.localPriority 128
#
# Port Data Set
#
logAnnounceInterval -3
logSyncInterval -4
logMinDelayReqInterval -4
logMinPdelayReqInterval 0
announceReceiptTimeout 3
syncReceiptTimeout 0
delayAsymmetry 0
fault_reset_interval -4
neighborPropDelayThresh 20000000
masterOnly 0
G.8275.portDS.localPriority 128
#
# Run time options
#
assume_two_step 0
logging_level 6
path_trace_enabled 0
follow_up_info 0
hybrid_e2e 0
inhibit_multicast_service 0
net_sync_monitor 0
tc_spanning_tree 0
tx_timestamp_timeout 50
unicast_listen 0
unicast_master_table 0
unicast_req_duration 3600
use_syslog 1
verbose 0
summary_interval -4
kernel_leap 1
check_fup_sync 0
clock_class_threshold 7
#
# Servo Options
#
pi_proportional_const 0.0
pi_integral_const 0.0
pi_proportional_scale 0.0
pi_proportional_exponent -0.3
pi_proportional_norm_max 0.7
pi_integral_scale 0.0
pi_integral_exponent 0.4
pi_integral_norm_max 0.3
step_threshold 2.0
first_step_threshold 0.00002
clock_servo pi
sanity_freq_limit 200000000
ntpshm_segment 0
#
# Transport options
#
transportSpecific 0x0
ptp_dst_mac 01:1B:19:00:00:00
p2p_dst_mac 01:80:C2:00:00:0E
udp_ttl 1
udp6_scope 0x0E
uds_address /var/run/ptp4l
#
# Default interface options
#
clock_type BC
network_transport L2
delay_mechanism E2E
time_stamping hardware
tsproc_mode filter
delay_filter moving_median
delay_filter_length 10
egressLatency 0
ingressLatency 0
boundary_clock_jbod 1
#
# Clock description
#
productDescription ;;
revisionData ;;
manufacturerIdentity 00:00:00
userDescription ;
timeSource 0x20
ptpClockThreshold:
holdOverTimeout: 5
maxOffsetThreshold: 100
minOffsetThreshold: -100
recommend:
- profile: grandmaster
priority: 4
match:
- nodeLabel: node-role.kubernetes.io/$mcpPtpConfigForHA.yaml
apiVersion: ptp.openshift.io/v1
kind: PtpConfig
metadata:
name: boundary-ha
namespace: openshift-ptp
annotations: {}
spec:
profile:
- name: "boundary-ha"
ptp4lOpts: ""
phc2sysOpts: "-a -r -n 24"
ptpSchedulingPolicy: SCHED_FIFO
ptpSchedulingPriority: 10
ptpSettings:
logReduce: "true"
haProfiles: "$profile1,$profile2"
recommend:
- profile: "boundary-ha"
priority: 4
match:
- nodeLabel: "node-role.kubernetes.io/$mcp"PtpConfigGmWpc.yaml
# The grandmaster profile is provided for testing only
# It is not installed on production clusters
apiVersion: ptp.openshift.io/v1
kind: PtpConfig
metadata:
name: grandmaster
namespace: openshift-ptp
annotations: {}
spec:
profile:
- name: "grandmaster"
ptp4lOpts: "-2 --summary_interval -4"
phc2sysOpts: -r -u 0 -m -w -N 8 -R 16 -s $iface_master -n 24
ptpSchedulingPolicy: SCHED_FIFO
ptpSchedulingPriority: 10
ptpSettings:
logReduce: "true"
plugins:
e810:
enableDefaultConfig: false
settings:
LocalMaxHoldoverOffSet: 1500
LocalHoldoverTimeout: 14400
MaxInSpecOffset: 1500
pins: $e810_pins
# "$iface_master":
# "U.FL2": "0 2"
# "U.FL1": "0 1"
# "SMA2": "0 2"
# "SMA1": "0 1"
ublxCmds:
- args: #ubxtool -P 29.20 -z CFG-HW-ANT_CFG_VOLTCTRL,1
- "-P"
- "29.20"
- "-z"
- "CFG-HW-ANT_CFG_VOLTCTRL,1"
reportOutput: false
- args: #ubxtool -P 29.20 -e GPS
- "-P"
- "29.20"
- "-e"
- "GPS"
reportOutput: false
- args: #ubxtool -P 29.20 -d Galileo
- "-P"
- "29.20"
- "-d"
- "Galileo"
reportOutput: false
- args: #ubxtool -P 29.20 -d GLONASS
- "-P"
- "29.20"
- "-d"
- "GLONASS"
reportOutput: false
- args: #ubxtool -P 29.20 -d BeiDou
- "-P"
- "29.20"
- "-d"
- "BeiDou"
reportOutput: false
- args: #ubxtool -P 29.20 -d SBAS
- "-P"
- "29.20"
- "-d"
- "SBAS"
reportOutput: false
- args: #ubxtool -P 29.20 -t -w 5 -v 1 -e SURVEYIN,600,50000
- "-P"
- "29.20"
- "-t"
- "-w"
- "5"
- "-v"
- "1"
- "-e"
- "SURVEYIN,600,50000"
reportOutput: true
- args: #ubxtool -P 29.20 -p MON-HW
- "-P"
- "29.20"
- "-p"
- "MON-HW"
reportOutput: true
- args: #ubxtool -P 29.20 -p CFG-MSG,1,38,300
- "-P"
- "29.20"
- "-p"
- "CFG-MSG,1,38,300"
reportOutput: true
ts2phcOpts: " "
ts2phcConf: |
[nmea]
ts2phc.master 1
[global]
use_syslog 0
verbose 1
logging_level 7
ts2phc.pulsewidth 100000000
#cat /dev/GNSS to find available serial port
#example value of gnss_serialport is /dev/ttyGNSS_1700_0
ts2phc.nmea_serialport $gnss_serialport
leapfile /usr/share/zoneinfo/leap-seconds.list
[$iface_master]
ts2phc.extts_polarity rising
ts2phc.extts_correction 0
ptp4lConf: |
[$iface_master]
masterOnly 1
[$iface_master_1]
masterOnly 1
[$iface_master_2]
masterOnly 1
[$iface_master_3]
masterOnly 1
[global]
#
# Default Data Set
#
twoStepFlag 1
priority1 128
priority2 128
domainNumber 24
#utc_offset 37
clockClass 6
clockAccuracy 0x27
offsetScaledLogVariance 0xFFFF
free_running 0
freq_est_interval 1
dscp_event 0
dscp_general 0
dataset_comparison G.8275.x
G.8275.defaultDS.localPriority 128
#
# Port Data Set
#
logAnnounceInterval -3
logSyncInterval -4
logMinDelayReqInterval -4
logMinPdelayReqInterval 0
announceReceiptTimeout 3
syncReceiptTimeout 0
delayAsymmetry 0
fault_reset_interval -4
neighborPropDelayThresh 20000000
masterOnly 0
G.8275.portDS.localPriority 128
#
# Run time options
#
assume_two_step 0
logging_level 6
path_trace_enabled 0
follow_up_info 0
hybrid_e2e 0
inhibit_multicast_service 0
net_sync_monitor 0
tc_spanning_tree 0
tx_timestamp_timeout 50
unicast_listen 0
unicast_master_table 0
unicast_req_duration 3600
use_syslog 1
verbose 0
summary_interval -4
kernel_leap 1
check_fup_sync 0
clock_class_threshold 7
#
# Servo Options
#
pi_proportional_const 0.0
pi_integral_const 0.0
pi_proportional_scale 0.0
pi_proportional_exponent -0.3
pi_proportional_norm_max 0.7
pi_integral_scale 0.0
pi_integral_exponent 0.4
pi_integral_norm_max 0.3
step_threshold 2.0
first_step_threshold 0.00002
clock_servo pi
sanity_freq_limit 200000000
ntpshm_segment 0
#
# Transport options
#
transportSpecific 0x0
ptp_dst_mac 01:1B:19:00:00:00
p2p_dst_mac 01:80:C2:00:00:0E
udp_ttl 1
udp6_scope 0x0E
uds_address /var/run/ptp4l
#
# Default interface options
#
clock_type BC
network_transport L2
delay_mechanism E2E
time_stamping hardware
tsproc_mode filter
delay_filter moving_median
delay_filter_length 10
egressLatency 0
ingressLatency 0
boundary_clock_jbod 0
#
# Clock description
#
productDescription ;;
revisionData ;;
manufacturerIdentity 00:00:00
userDescription ;
timeSource 0x20
recommend:
- profile: "grandmaster"
priority: 4
match:
- nodeLabel: "node-role.kubernetes.io/$mcp"PtpConfigSlave.yaml
apiVersion: ptp.openshift.io/v1
kind: PtpConfig
metadata:
name: ordinary
namespace: openshift-ptp
annotations: {}
spec:
profile:
- name: "ordinary"
# The interface name is hardware-specific
interface: $interface
ptp4lOpts: "-2 -s"
phc2sysOpts: "-a -r -n 24"
ptpSchedulingPolicy: SCHED_FIFO
ptpSchedulingPriority: 10
ptpSettings:
logReduce: "true"
ptp4lConf: |
[global]
#
# Default Data Set
#
twoStepFlag 1
slaveOnly 1
priority1 128
priority2 128
domainNumber 24
#utc_offset 37
clockClass 255
clockAccuracy 0xFE
offsetScaledLogVariance 0xFFFF
free_running 0
freq_est_interval 1
dscp_event 0
dscp_general 0
dataset_comparison G.8275.x
G.8275.defaultDS.localPriority 128
#
# Port Data Set
#
logAnnounceInterval -3
logSyncInterval -4
logMinDelayReqInterval -4
logMinPdelayReqInterval -4
announceReceiptTimeout 3
syncReceiptTimeout 0
delayAsymmetry 0
fault_reset_interval -4
neighborPropDelayThresh 20000000
masterOnly 0
G.8275.portDS.localPriority 128
#
# Run time options
#
assume_two_step 0
logging_level 6
path_trace_enabled 0
follow_up_info 0
hybrid_e2e 0
inhibit_multicast_service 0
net_sync_monitor 0
tc_spanning_tree 0
tx_timestamp_timeout 50
unicast_listen 0
unicast_master_table 0
unicast_req_duration 3600
use_syslog 1
verbose 0
summary_interval 0
kernel_leap 1
check_fup_sync 0
clock_class_threshold 7
#
# Servo Options
#
pi_proportional_const 0.0
pi_integral_const 0.0
pi_proportional_scale 0.0
pi_proportional_exponent -0.3
pi_proportional_norm_max 0.7
pi_integral_scale 0.0
pi_integral_exponent 0.4
pi_integral_norm_max 0.3
step_threshold 2.0
first_step_threshold 0.00002
max_frequency 900000000
clock_servo pi
sanity_freq_limit 200000000
ntpshm_segment 0
#
# Transport options
#
transportSpecific 0x0
ptp_dst_mac 01:1B:19:00:00:00
p2p_dst_mac 01:80:C2:00:00:0E
udp_ttl 1
udp6_scope 0x0E
uds_address /var/run/ptp4l
#
# Default interface options
#
clock_type OC
network_transport L2
delay_mechanism E2E
time_stamping hardware
tsproc_mode filter
delay_filter moving_median
delay_filter_length 10
egressLatency 0
ingressLatency 0
boundary_clock_jbod 0
#
# Clock description
#
productDescription ;;
revisionData ;;
manufacturerIdentity 00:00:00
userDescription ;
timeSource 0xA0
recommend:
- profile: "ordinary"
priority: 4
match:
- nodeLabel: "node-role.kubernetes.io/$mcp"PtpOperatorConfig.yaml
apiVersion: ptp.openshift.io/v1
kind: PtpOperatorConfig
metadata:
name: default
namespace: openshift-ptp
annotations: {}
spec:
daemonNodeSelector:
node-role.kubernetes.io/$mcp: ""PtpSubscription.yaml
---
apiVersion: operators.coreos.com/v1alpha1
kind: Subscription
metadata:
name: ptp-operator-subscription
namespace: openshift-ptp
annotations: {}
spec:
channel: "stable"
name: ptp-operator
source: redhat-operators-disconnected
sourceNamespace: openshift-marketplace
installPlanApproval: Manual
status:
state: AtLatestKnownPtpSubscriptionNS.yaml
---
apiVersion: v1
kind: Namespace
metadata:
name: openshift-ptp
annotations:
workload.openshift.io/allowed: management
labels:
openshift.io/cluster-monitoring: "true"PtpSubscriptionOperGroup.yaml
apiVersion: operators.coreos.com/v1
kind: OperatorGroup
metadata:
name: ptp-operators
namespace: openshift-ptp
annotations: {}
spec:
targetNamespaces:
- openshift-ptpAcceleratorsNS.yaml
apiVersion: v1
kind: Namespace
metadata:
name: vran-acceleration-operators
annotations: {}AcceleratorsOperGroup.yaml
apiVersion: operators.coreos.com/v1
kind: OperatorGroup
metadata:
name: vran-operators
namespace: vran-acceleration-operators
annotations: {}
spec:
targetNamespaces:
- vran-acceleration-operatorsAcceleratorsSubscription.yaml
apiVersion: operators.coreos.com/v1alpha1
kind: Subscription
metadata:
name: sriov-fec-subscription
namespace: vran-acceleration-operators
annotations: {}
spec:
channel: stable
name: sriov-fec
source: certified-operators
sourceNamespace: openshift-marketplace
installPlanApproval: Manual
status:
state: AtLatestKnownSriovFecClusterConfig.yaml
apiVersion: sriovfec.intel.com/v2
kind: SriovFecClusterConfig
metadata:
name: config
namespace: vran-acceleration-operators
annotations: {}
spec:
drainSkip: $drainSkip # true if SNO, false by default
priority: 1
nodeSelector:
node-role.kubernetes.io/master: ""
acceleratorSelector:
pciAddress: $pciAddress
physicalFunction:
pfDriver: "vfio-pci"
vfDriver: "vfio-pci"
vfAmount: 16
bbDevConfig: $bbDevConfig
#Recommended configuration for Intel ACC100 (Mount Bryce) FPGA here: https://github.com/smart-edge-open/openshift-operator/blob/main/spec/openshift-sriov-fec-operator.md#sample-cr-for-wireless-fec-acc100
#Recommended configuration for Intel N3000 FPGA here: https://github.com/smart-edge-open/openshift-operator/blob/main/spec/openshift-sriov-fec-operator.md#sample-cr-for-wireless-fec-n3000SriovNetwork.yaml
apiVersion: sriovnetwork.openshift.io/v1
kind: SriovNetwork
metadata:
name: ""
namespace: openshift-sriov-network-operator
annotations: {}
spec:
# resourceName: ""
networkNamespace: openshift-sriov-network-operator
# vlan: ""
# spoofChk: ""
# ipam: ""
# linkState: ""
# maxTxRate: ""
# minTxRate: ""
# vlanQoS: ""
# trust: ""
# capabilities: ""SriovNetworkNodePolicy.yaml
apiVersion: sriovnetwork.openshift.io/v1
kind: SriovNetworkNodePolicy
metadata:
name: $name
namespace: openshift-sriov-network-operator
annotations: {}
spec:
# The attributes for Mellanox/Intel based NICs as below.
# deviceType: netdevice/vfio-pci
# isRdma: true/false
deviceType: $deviceType
isRdma: $isRdma
nicSelector:
# The exact physical function name must match the hardware used
pfNames: [$pfNames]
nodeSelector:
node-role.kubernetes.io/$mcp: ""
numVfs: $numVfs
priority: $priority
resourceName: $resourceNameSriovOperatorConfig.yaml
apiVersion: sriovnetwork.openshift.io/v1
kind: SriovOperatorConfig
metadata:
name: default
namespace: openshift-sriov-network-operator
annotations: {}
spec:
configDaemonNodeSelector:
"node-role.kubernetes.io/$mcp": ""
# Injector and OperatorWebhook pods can be disabled (set to "false") below
# to reduce the number of management pods. It is recommended to start with the
# webhook and injector pods enabled, and only disable them after verifying the
# correctness of user manifests.
# If the injector is disabled, containers using sr-iov resources must explicitly assign
# them in the "requests"/"limits" section of the container spec, for example:
# containers:
# - name: my-sriov-workload-container
# resources:
# limits:
# openshift.io/<resource_name>: "1"
# requests:
# openshift.io/<resource_name>: "1"
enableInjector: false
enableOperatorWebhook: false
logLevel: 0SriovOperatorConfigForSNO.yaml
apiVersion: sriovnetwork.openshift.io/v1
kind: SriovOperatorConfig
metadata:
name: default
namespace: openshift-sriov-network-operator
annotations: {}
spec:
configDaemonNodeSelector:
"node-role.kubernetes.io/$mcp": ""
# Injector and OperatorWebhook pods can be disabled (set to "false") below
# to reduce the number of management pods. It is recommended to start with the
# webhook and injector pods enabled, and only disable them after verifying the
# correctness of user manifests.
# If the injector is disabled, containers using sr-iov resources must explicitly assign
# them in the "requests"/"limits" section of the container spec, for example:
# containers:
# - name: my-sriov-workload-container
# resources:
# limits:
# openshift.io/<resource_name>: "1"
# requests:
# openshift.io/<resource_name>: "1"
enableInjector: false
enableOperatorWebhook: false
# Disable drain is needed for Single Node Openshift
disableDrain: true
logLevel: 0SriovSubscription.yaml
apiVersion: operators.coreos.com/v1alpha1
kind: Subscription
metadata:
name: sriov-network-operator-subscription
namespace: openshift-sriov-network-operator
annotations: {}
spec:
channel: "stable"
name: sriov-network-operator
source: redhat-operators-disconnected
sourceNamespace: openshift-marketplace
installPlanApproval: Manual
status:
state: AtLatestKnownSriovSubscriptionNS.yaml
apiVersion: v1
kind: Namespace
metadata:
name: openshift-sriov-network-operator
annotations:
workload.openshift.io/allowed: managementSriovSubscriptionOperGroup.yaml
apiVersion: operators.coreos.com/v1
kind: OperatorGroup
metadata:
name: sriov-network-operators
namespace: openshift-sriov-network-operator
annotations: {}
spec:
targetNamespaces:
- openshift-sriov-network-operator3.2.4.4.2. Cluster tuning reference YAML
example-sno.yaml
# example-node1-bmh-secret & assisted-deployment-pull-secret need to be created under same namespace example-sno
---
apiVersion: ran.openshift.io/v1
kind: SiteConfig
metadata:
name: "example-sno"
namespace: "example-sno"
spec:
baseDomain: "example.com"
pullSecretRef:
name: "assisted-deployment-pull-secret"
clusterImageSetNameRef: "openshift-4.16"
sshPublicKey: "ssh-rsa AAAA..."
clusters:
- clusterName: "example-sno"
networkType: "OVNKubernetes"
# installConfigOverrides is a generic way of passing install-config
# parameters through the siteConfig. The 'capabilities' field configures
# the composable openshift feature. In this 'capabilities' setting, we
# remove all the optional set of components.
# Notes:
# - OperatorLifecycleManager is needed for 4.15 and later
# - NodeTuning is needed for 4.13 and later, not for 4.12 and earlier
# - Ingress is needed for 4.16 and later
installConfigOverrides: |
{
"capabilities": {
"baselineCapabilitySet": "None",
"additionalEnabledCapabilities": [
"NodeTuning",
"OperatorLifecycleManager",
"Ingress"
]
}
}
# It is strongly recommended to include crun manifests as part of the additional install-time manifests for 4.13+.
# The crun manifests can be obtained from source-crs/optional-extra-manifest/ and added to the git repo ie.sno-extra-manifest.
# extraManifestPath: sno-extra-manifest
clusterLabels:
# These example cluster labels correspond to the bindingRules in the PolicyGenTemplate examples
du-profile: "latest"
# These example cluster labels correspond to the bindingRules in the PolicyGenTemplate examples in ../policygentemplates:
# ../policygentemplates/common-ranGen.yaml will apply to all clusters with 'common: true'
common: true
# ../policygentemplates/group-du-sno-ranGen.yaml will apply to all clusters with 'group-du-sno: ""'
group-du-sno: ""
# ../policygentemplates/example-sno-site.yaml will apply to all clusters with 'sites: "example-sno"'
# Normally this should match or contain the cluster name so it only applies to a single cluster
sites: "example-sno"
clusterNetwork:
- cidr: 1001:1::/48
hostPrefix: 64
machineNetwork:
- cidr: 1111:2222:3333:4444::/64
serviceNetwork:
- 1001:2::/112
additionalNTPSources:
- 1111:2222:3333:4444::2
# Initiates the cluster for workload partitioning. Setting specific reserved/isolated CPUSets is done via PolicyTemplate
# please see Workload Partitioning Feature for a complete guide.
cpuPartitioningMode: AllNodes
# Optionally; This can be used to override the KlusterletAddonConfig that is created for this cluster:
#crTemplates:
# KlusterletAddonConfig: "KlusterletAddonConfigOverride.yaml"
nodes:
- hostName: "example-node1.example.com"
role: "master"
# Optionally; This can be used to configure desired BIOS setting on a host:
#biosConfigRef:
# filePath: "example-hw.profile"
bmcAddress: "idrac-virtualmedia+https://[1111:2222:3333:4444::bbbb:1]/redfish/v1/Systems/System.Embedded.1"
bmcCredentialsName:
name: "example-node1-bmh-secret"
bootMACAddress: "AA:BB:CC:DD:EE:11"
# Use UEFISecureBoot to enable secure boot
bootMode: "UEFI"
rootDeviceHints:
deviceName: "/dev/disk/by-path/pci-0000:01:00.0-scsi-0:2:0:0"
# disk partition at `/var/lib/containers` with ignitionConfigOverride. Some values must be updated. See DiskPartitionContainer.md for more details
ignitionConfigOverride: |
{
"ignition": {
"version": "3.2.0"
},
"storage": {
"disks": [
{
"device": "/dev/disk/by-id/wwn-0x6b07b250ebb9d0002a33509f24af1f62",
"partitions": [
{
"label": "var-lib-containers",
"sizeMiB": 0,
"startMiB": 250000
}
],
"wipeTable": false
}
],
"filesystems": [
{
"device": "/dev/disk/by-partlabel/var-lib-containers",
"format": "xfs",
"mountOptions": [
"defaults",
"prjquota"
],
"path": "/var/lib/containers",
"wipeFilesystem": true
}
]
},
"systemd": {
"units": [
{
"contents": "# Generated by Butane\n[Unit]\nRequires=systemd-fsck@dev-disk-by\\x2dpartlabel-var\\x2dlib\\x2dcontainers.service\nAfter=systemd-fsck@dev-disk-by\\x2dpartlabel-var\\x2dlib\\x2dcontainers.service\n\n[Mount]\nWhere=/var/lib/containers\nWhat=/dev/disk/by-partlabel/var-lib-containers\nType=xfs\nOptions=defaults,prjquota\n\n[Install]\nRequiredBy=local-fs.target",
"enabled": true,
"name": "var-lib-containers.mount"
}
]
}
}
nodeNetwork:
interfaces:
- name: eno1
macAddress: "AA:BB:CC:DD:EE:11"
config:
interfaces:
- name: eno1
type: ethernet
state: up
ipv4:
enabled: false
ipv6:
enabled: true
address:
# For SNO sites with static IP addresses, the node-specific,
# API and Ingress IPs should all be the same and configured on
# the interface
- ip: 1111:2222:3333:4444::aaaa:1
prefix-length: 64
dns-resolver:
config:
search:
- example.com
server:
- 1111:2222:3333:4444::2
routes:
config:
- destination: ::/0
next-hop-interface: eno1
next-hop-address: 1111:2222:3333:4444::1
table-id: 254ConsoleOperatorDisable.yaml
apiVersion: operator.openshift.io/v1
kind: Console
metadata:
name: cluster
spec:
managementState: RemovedDisableSnoNetworkDiag.yaml
apiVersion: operator.openshift.io/v1
kind: Network
metadata:
name: cluster
annotations: {}
spec:
disableNetworkDiagnostics: trueReduceMonitoringFootprint.yaml
apiVersion: v1
kind: ConfigMap
metadata:
name: cluster-monitoring-config
namespace: openshift-monitoring
annotations: {}
data:
config.yaml: |
alertmanagerMain:
enabled: false
telemeterClient:
enabled: false
prometheusK8s:
retention: 24h09-openshift-marketplace-ns.yaml
# Taken from https://github.com/operator-framework/operator-marketplace/blob/53c124a3f0edfd151652e1f23c87dd39ed7646bb/manifests/01_namespace.yaml
# Update it as the source evolves.
apiVersion: v1
kind: Namespace
metadata:
annotations:
openshift.io/node-selector: ""
workload.openshift.io/allowed: "management"
labels:
openshift.io/cluster-monitoring: "true"
pod-security.kubernetes.io/enforce: baseline
pod-security.kubernetes.io/enforce-version: v1.25
pod-security.kubernetes.io/audit: baseline
pod-security.kubernetes.io/audit-version: v1.25
pod-security.kubernetes.io/warn: baseline
pod-security.kubernetes.io/warn-version: v1.25
name: "openshift-marketplace"DefaultCatsrc.yaml
apiVersion: operators.coreos.com/v1alpha1
kind: CatalogSource
metadata:
name: default-cat-source
namespace: openshift-marketplace
annotations:
target.workload.openshift.io/management: '{"effect": "PreferredDuringScheduling"}'
spec:
displayName: default-cat-source
image: $imageUrl
publisher: Red Hat
sourceType: grpc
updateStrategy:
registryPoll:
interval: 1h
status:
connectionState:
lastObservedState: READYDisableOLMPprof.yaml
apiVersion: v1
kind: ConfigMap
metadata:
name: collect-profiles-config
namespace: openshift-operator-lifecycle-manager
annotations: {}
data:
pprof-config.yaml: |
disabled: TrueDisconnectedICSP.yaml
apiVersion: operator.openshift.io/v1alpha1
kind: ImageContentSourcePolicy
metadata:
name: disconnected-internal-icsp
annotations: {}
spec:
# repositoryDigestMirrors:
# - $mirrorsOperatorHub.yaml
apiVersion: config.openshift.io/v1
kind: OperatorHub
metadata:
name: cluster
annotations: {}
spec:
disableAllDefaultSources: true3.2.4.4.3. Machine configuration reference YAML
enable-crun-master.yaml
apiVersion: machineconfiguration.openshift.io/v1
kind: ContainerRuntimeConfig
metadata:
name: enable-crun-master
spec:
machineConfigPoolSelector:
matchLabels:
pools.operator.machineconfiguration.openshift.io/master: ""
containerRuntimeConfig:
defaultRuntime: crunenable-crun-worker.yaml
apiVersion: machineconfiguration.openshift.io/v1
kind: ContainerRuntimeConfig
metadata:
name: enable-crun-worker
spec:
machineConfigPoolSelector:
matchLabels:
pools.operator.machineconfiguration.openshift.io/worker: ""
containerRuntimeConfig:
defaultRuntime: crun99-crio-disable-wipe-master.yaml
# Automatically generated by extra-manifests-builder
# Do not make changes directly.
apiVersion: machineconfiguration.openshift.io/v1
kind: MachineConfig
metadata:
labels:
machineconfiguration.openshift.io/role: master
name: 99-crio-disable-wipe-master
spec:
config:
ignition:
version: 3.2.0
storage:
files:
- contents:
source: data:text/plain;charset=utf-8;base64,W2NyaW9dCmNsZWFuX3NodXRkb3duX2ZpbGUgPSAiIgo=
mode: 420
path: /etc/crio/crio.conf.d/99-crio-disable-wipe.toml99-crio-disable-wipe-worker.yaml
# Automatically generated by extra-manifests-builder
# Do not make changes directly.
apiVersion: machineconfiguration.openshift.io/v1
kind: MachineConfig
metadata:
labels:
machineconfiguration.openshift.io/role: worker
name: 99-crio-disable-wipe-worker
spec:
config:
ignition:
version: 3.2.0
storage:
files:
- contents:
source: data:text/plain;charset=utf-8;base64,W2NyaW9dCmNsZWFuX3NodXRkb3duX2ZpbGUgPSAiIgo=
mode: 420
path: /etc/crio/crio.conf.d/99-crio-disable-wipe.toml06-kdump-master.yaml
# Automatically generated by extra-manifests-builder
# Do not make changes directly.
apiVersion: machineconfiguration.openshift.io/v1
kind: MachineConfig
metadata:
labels:
machineconfiguration.openshift.io/role: master
name: 06-kdump-enable-master
spec:
config:
ignition:
version: 3.2.0
systemd:
units:
- enabled: true
name: kdump.service
kernelArguments:
- crashkernel=512M06-kdump-worker.yaml
# Automatically generated by extra-manifests-builder
# Do not make changes directly.
apiVersion: machineconfiguration.openshift.io/v1
kind: MachineConfig
metadata:
labels:
machineconfiguration.openshift.io/role: worker
name: 06-kdump-enable-worker
spec:
config:
ignition:
version: 3.2.0
systemd:
units:
- enabled: true
name: kdump.service
kernelArguments:
- crashkernel=512M01-container-mount-ns-and-kubelet-conf-master.yaml
# Automatically generated by extra-manifests-builder
# Do not make changes directly.
apiVersion: machineconfiguration.openshift.io/v1
kind: MachineConfig
metadata:
labels:
machineconfiguration.openshift.io/role: master
name: container-mount-namespace-and-kubelet-conf-master
spec:
config:
ignition:
version: 3.2.0
storage:
files:
- contents:
source: data:text/plain;charset=utf-8;base64,IyEvYmluL2Jhc2gKCmRlYnVnKCkgewogIGVjaG8gJEAgPiYyCn0KCnVzYWdlKCkgewogIGVjaG8gVXNhZ2U6ICQoYmFzZW5hbWUgJDApIFVOSVQgW2VudmZpbGUgW3Zhcm5hbWVdXQogIGVjaG8KICBlY2hvIEV4dHJhY3QgdGhlIGNvbnRlbnRzIG9mIHRoZSBmaXJzdCBFeGVjU3RhcnQgc3RhbnphIGZyb20gdGhlIGdpdmVuIHN5c3RlbWQgdW5pdCBhbmQgcmV0dXJuIGl0IHRvIHN0ZG91dAogIGVjaG8KICBlY2hvICJJZiAnZW52ZmlsZScgaXMgcHJvdmlkZWQsIHB1dCBpdCBpbiB0aGVyZSBpbnN0ZWFkLCBhcyBhbiBlbnZpcm9ubWVudCB2YXJpYWJsZSBuYW1lZCAndmFybmFtZSciCiAgZWNobyAiRGVmYXVsdCAndmFybmFtZScgaXMgRVhFQ1NUQVJUIGlmIG5vdCBzcGVjaWZpZWQiCiAgZXhpdCAxCn0KClVOSVQ9JDEKRU5WRklMRT0kMgpWQVJOQU1FPSQzCmlmIFtbIC16ICRVTklUIHx8ICRVTklUID09ICItLWhlbHAiIHx8ICRVTklUID09ICItaCIgXV07IHRoZW4KICB1c2FnZQpmaQpkZWJ1ZyAiRXh0cmFjdGluZyBFeGVjU3RhcnQgZnJvbSAkVU5JVCIKRklMRT0kKHN5c3RlbWN0bCBjYXQgJFVOSVQgfCBoZWFkIC1uIDEpCkZJTEU9JHtGSUxFI1wjIH0KaWYgW1sgISAtZiAkRklMRSBdXTsgdGhlbgogIGRlYnVnICJGYWlsZWQgdG8gZmluZCByb290IGZpbGUgZm9yIHVuaXQgJFVOSVQgKCRGSUxFKSIKICBleGl0CmZpCmRlYnVnICJTZXJ2aWNlIGRlZmluaXRpb24gaXMgaW4gJEZJTEUiCkVYRUNTVEFSVD0kKHNlZCAtbiAtZSAnL15FeGVjU3RhcnQ9LipcXCQvLC9bXlxcXSQvIHsgcy9eRXhlY1N0YXJ0PS8vOyBwIH0nIC1lICcvXkV4ZWNTdGFydD0uKlteXFxdJC8geyBzL15FeGVjU3RhcnQ9Ly87IHAgfScgJEZJTEUpCgppZiBbWyAkRU5WRklMRSBdXTsgdGhlbgogIFZBUk5BTUU9JHtWQVJOQU1FOi1FWEVDU1RBUlR9CiAgZWNobyAiJHtWQVJOQU1FfT0ke0VYRUNTVEFSVH0iID4gJEVOVkZJTEUKZWxzZQogIGVjaG8gJEVYRUNTVEFSVApmaQo=
mode: 493
path: /usr/local/bin/extractExecStart
- contents:
source: data:text/plain;charset=utf-8;base64,IyEvYmluL2Jhc2gKbnNlbnRlciAtLW1vdW50PS9ydW4vY29udGFpbmVyLW1vdW50LW5hbWVzcGFjZS9tbnQgIiRAIgo=
mode: 493
path: /usr/local/bin/nsenterCmns
systemd:
units:
- contents: |
[Unit]
Description=Manages a mount namespace that both kubelet and crio can use to share their container-specific mounts
[Service]
Type=oneshot
RemainAfterExit=yes
RuntimeDirectory=container-mount-namespace
Environment=RUNTIME_DIRECTORY=%t/container-mount-namespace
Environment=BIND_POINT=%t/container-mount-namespace/mnt
ExecStartPre=bash -c "findmnt ${RUNTIME_DIRECTORY} || mount --make-unbindable --bind ${RUNTIME_DIRECTORY} ${RUNTIME_DIRECTORY}"
ExecStartPre=touch ${BIND_POINT}
ExecStart=unshare --mount=${BIND_POINT} --propagation slave mount --make-rshared /
ExecStop=umount -R ${RUNTIME_DIRECTORY}
name: container-mount-namespace.service
- dropins:
- contents: |
[Unit]
Wants=container-mount-namespace.service
After=container-mount-namespace.service
[Service]
ExecStartPre=/usr/local/bin/extractExecStart %n /%t/%N-execstart.env ORIG_EXECSTART
EnvironmentFile=-/%t/%N-execstart.env
ExecStart=
ExecStart=bash -c "nsenter --mount=%t/container-mount-namespace/mnt \
${ORIG_EXECSTART}"
name: 90-container-mount-namespace.conf
name: crio.service
- dropins:
- contents: |
[Unit]
Wants=container-mount-namespace.service
After=container-mount-namespace.service
[Service]
ExecStartPre=/usr/local/bin/extractExecStart %n /%t/%N-execstart.env ORIG_EXECSTART
EnvironmentFile=-/%t/%N-execstart.env
ExecStart=
ExecStart=bash -c "nsenter --mount=%t/container-mount-namespace/mnt \
${ORIG_EXECSTART} --housekeeping-interval=30s"
name: 90-container-mount-namespace.conf
- contents: |
[Service]
Environment="OPENSHIFT_MAX_HOUSEKEEPING_INTERVAL_DURATION=60s"
Environment="OPENSHIFT_EVICTION_MONITORING_PERIOD_DURATION=30s"
name: 30-kubelet-interval-tuning.conf
name: kubelet.service01-container-mount-ns-and-kubelet-conf-worker.yaml
# Automatically generated by extra-manifests-builder
# Do not make changes directly.
apiVersion: machineconfiguration.openshift.io/v1
kind: MachineConfig
metadata:
labels:
machineconfiguration.openshift.io/role: worker
name: container-mount-namespace-and-kubelet-conf-worker
spec:
config:
ignition:
version: 3.2.0
storage:
files:
- contents:
source: data:text/plain;charset=utf-8;base64,IyEvYmluL2Jhc2gKCmRlYnVnKCkgewogIGVjaG8gJEAgPiYyCn0KCnVzYWdlKCkgewogIGVjaG8gVXNhZ2U6ICQoYmFzZW5hbWUgJDApIFVOSVQgW2VudmZpbGUgW3Zhcm5hbWVdXQogIGVjaG8KICBlY2hvIEV4dHJhY3QgdGhlIGNvbnRlbnRzIG9mIHRoZSBmaXJzdCBFeGVjU3RhcnQgc3RhbnphIGZyb20gdGhlIGdpdmVuIHN5c3RlbWQgdW5pdCBhbmQgcmV0dXJuIGl0IHRvIHN0ZG91dAogIGVjaG8KICBlY2hvICJJZiAnZW52ZmlsZScgaXMgcHJvdmlkZWQsIHB1dCBpdCBpbiB0aGVyZSBpbnN0ZWFkLCBhcyBhbiBlbnZpcm9ubWVudCB2YXJpYWJsZSBuYW1lZCAndmFybmFtZSciCiAgZWNobyAiRGVmYXVsdCAndmFybmFtZScgaXMgRVhFQ1NUQVJUIGlmIG5vdCBzcGVjaWZpZWQiCiAgZXhpdCAxCn0KClVOSVQ9JDEKRU5WRklMRT0kMgpWQVJOQU1FPSQzCmlmIFtbIC16ICRVTklUIHx8ICRVTklUID09ICItLWhlbHAiIHx8ICRVTklUID09ICItaCIgXV07IHRoZW4KICB1c2FnZQpmaQpkZWJ1ZyAiRXh0cmFjdGluZyBFeGVjU3RhcnQgZnJvbSAkVU5JVCIKRklMRT0kKHN5c3RlbWN0bCBjYXQgJFVOSVQgfCBoZWFkIC1uIDEpCkZJTEU9JHtGSUxFI1wjIH0KaWYgW1sgISAtZiAkRklMRSBdXTsgdGhlbgogIGRlYnVnICJGYWlsZWQgdG8gZmluZCByb290IGZpbGUgZm9yIHVuaXQgJFVOSVQgKCRGSUxFKSIKICBleGl0CmZpCmRlYnVnICJTZXJ2aWNlIGRlZmluaXRpb24gaXMgaW4gJEZJTEUiCkVYRUNTVEFSVD0kKHNlZCAtbiAtZSAnL15FeGVjU3RhcnQ9LipcXCQvLC9bXlxcXSQvIHsgcy9eRXhlY1N0YXJ0PS8vOyBwIH0nIC1lICcvXkV4ZWNTdGFydD0uKlteXFxdJC8geyBzL15FeGVjU3RhcnQ9Ly87IHAgfScgJEZJTEUpCgppZiBbWyAkRU5WRklMRSBdXTsgdGhlbgogIFZBUk5BTUU9JHtWQVJOQU1FOi1FWEVDU1RBUlR9CiAgZWNobyAiJHtWQVJOQU1FfT0ke0VYRUNTVEFSVH0iID4gJEVOVkZJTEUKZWxzZQogIGVjaG8gJEVYRUNTVEFSVApmaQo=
mode: 493
path: /usr/local/bin/extractExecStart
- contents:
source: data:text/plain;charset=utf-8;base64,IyEvYmluL2Jhc2gKbnNlbnRlciAtLW1vdW50PS9ydW4vY29udGFpbmVyLW1vdW50LW5hbWVzcGFjZS9tbnQgIiRAIgo=
mode: 493
path: /usr/local/bin/nsenterCmns
systemd:
units:
- contents: |
[Unit]
Description=Manages a mount namespace that both kubelet and crio can use to share their container-specific mounts
[Service]
Type=oneshot
RemainAfterExit=yes
RuntimeDirectory=container-mount-namespace
Environment=RUNTIME_DIRECTORY=%t/container-mount-namespace
Environment=BIND_POINT=%t/container-mount-namespace/mnt
ExecStartPre=bash -c "findmnt ${RUNTIME_DIRECTORY} || mount --make-unbindable --bind ${RUNTIME_DIRECTORY} ${RUNTIME_DIRECTORY}"
ExecStartPre=touch ${BIND_POINT}
ExecStart=unshare --mount=${BIND_POINT} --propagation slave mount --make-rshared /
ExecStop=umount -R ${RUNTIME_DIRECTORY}
name: container-mount-namespace.service
- dropins:
- contents: |
[Unit]
Wants=container-mount-namespace.service
After=container-mount-namespace.service
[Service]
ExecStartPre=/usr/local/bin/extractExecStart %n /%t/%N-execstart.env ORIG_EXECSTART
EnvironmentFile=-/%t/%N-execstart.env
ExecStart=
ExecStart=bash -c "nsenter --mount=%t/container-mount-namespace/mnt \
${ORIG_EXECSTART}"
name: 90-container-mount-namespace.conf
name: crio.service
- dropins:
- contents: |
[Unit]
Wants=container-mount-namespace.service
After=container-mount-namespace.service
[Service]
ExecStartPre=/usr/local/bin/extractExecStart %n /%t/%N-execstart.env ORIG_EXECSTART
EnvironmentFile=-/%t/%N-execstart.env
ExecStart=
ExecStart=bash -c "nsenter --mount=%t/container-mount-namespace/mnt \
${ORIG_EXECSTART} --housekeeping-interval=30s"
name: 90-container-mount-namespace.conf
- contents: |
[Service]
Environment="OPENSHIFT_MAX_HOUSEKEEPING_INTERVAL_DURATION=60s"
Environment="OPENSHIFT_EVICTION_MONITORING_PERIOD_DURATION=30s"
name: 30-kubelet-interval-tuning.conf
name: kubelet.service99-sync-time-once-master.yaml
# Automatically generated by extra-manifests-builder
# Do not make changes directly.
apiVersion: machineconfiguration.openshift.io/v1
kind: MachineConfig
metadata:
labels:
machineconfiguration.openshift.io/role: master
name: 99-sync-time-once-master
spec:
config:
ignition:
version: 3.2.0
systemd:
units:
- contents: |
[Unit]
Description=Sync time once
After=network-online.target
Wants=network-online.target
[Service]
Type=oneshot
TimeoutStartSec=300
ExecCondition=/bin/bash -c 'systemctl is-enabled chronyd.service --quiet && exit 1 || exit 0'
ExecStart=/usr/sbin/chronyd -n -f /etc/chrony.conf -q
RemainAfterExit=yes
[Install]
WantedBy=multi-user.target
enabled: true
name: sync-time-once.service99-sync-time-once-worker.yaml
# Automatically generated by extra-manifests-builder
# Do not make changes directly.
apiVersion: machineconfiguration.openshift.io/v1
kind: MachineConfig
metadata:
labels:
machineconfiguration.openshift.io/role: worker
name: 99-sync-time-once-worker
spec:
config:
ignition:
version: 3.2.0
systemd:
units:
- contents: |
[Unit]
Description=Sync time once
After=network-online.target
Wants=network-online.target
[Service]
Type=oneshot
TimeoutStartSec=300
ExecCondition=/bin/bash -c 'systemctl is-enabled chronyd.service --quiet && exit 1 || exit 0'
ExecStart=/usr/sbin/chronyd -n -f /etc/chrony.conf -q
RemainAfterExit=yes
[Install]
WantedBy=multi-user.target
enabled: true
name: sync-time-once.service03-sctp-machine-config-master.yaml
# Automatically generated by extra-manifests-builder
# Do not make changes directly.
apiVersion: machineconfiguration.openshift.io/v1
kind: MachineConfig
metadata:
labels:
machineconfiguration.openshift.io/role: master
name: load-sctp-module-master
spec:
config:
ignition:
version: 2.2.0
storage:
files:
- contents:
source: data:,
verification: {}
filesystem: root
mode: 420
path: /etc/modprobe.d/sctp-blacklist.conf
- contents:
source: data:text/plain;charset=utf-8,sctp
filesystem: root
mode: 420
path: /etc/modules-load.d/sctp-load.conf03-sctp-machine-config-worker.yaml
# Automatically generated by extra-manifests-builder
# Do not make changes directly.
apiVersion: machineconfiguration.openshift.io/v1
kind: MachineConfig
metadata:
labels:
machineconfiguration.openshift.io/role: worker
name: load-sctp-module-worker
spec:
config:
ignition:
version: 2.2.0
storage:
files:
- contents:
source: data:,
verification: {}
filesystem: root
mode: 420
path: /etc/modprobe.d/sctp-blacklist.conf
- contents:
source: data:text/plain;charset=utf-8,sctp
filesystem: root
mode: 420
path: /etc/modules-load.d/sctp-load.conf08-set-rcu-normal-master.yaml
# Automatically generated by extra-manifests-builder
# Do not make changes directly.
apiVersion: machineconfiguration.openshift.io/v1
kind: MachineConfig
metadata:
labels:
machineconfiguration.openshift.io/role: master
name: 08-set-rcu-normal-master
spec:
config:
ignition:
version: 3.2.0
storage:
files:
- contents:
source: data:text/plain;charset=utf-8;base64,IyEvYmluL2Jhc2gKIwojIERpc2FibGUgcmN1X2V4cGVkaXRlZCBhZnRlciBub2RlIGhhcyBmaW5pc2hlZCBib290aW5nCiMKIyBUaGUgZGVmYXVsdHMgYmVsb3cgY2FuIGJlIG92ZXJyaWRkZW4gdmlhIGVudmlyb25tZW50IHZhcmlhYmxlcwojCgojIERlZmF1bHQgd2FpdCB0aW1lIGlzIDYwMHMgPSAxMG06Ck1BWElNVU1fV0FJVF9USU1FPSR7TUFYSU1VTV9XQUlUX1RJTUU6LTYwMH0KCiMgRGVmYXVsdCBzdGVhZHktc3RhdGUgdGhyZXNob2xkID0gMiUKIyBBbGxvd2VkIHZhbHVlczoKIyAgNCAgLSBhYnNvbHV0ZSBwb2QgY291bnQgKCsvLSkKIyAgNCUgLSBwZXJjZW50IGNoYW5nZSAoKy8tKQojICAtMSAtIGRpc2FibGUgdGhlIHN0ZWFkeS1zdGF0ZSBjaGVjawpTVEVBRFlfU1RBVEVfVEhSRVNIT0xEPSR7U1RFQURZX1NUQVRFX1RIUkVTSE9MRDotMiV9CgojIERlZmF1bHQgc3RlYWR5LXN0YXRlIHdpbmRvdyA9IDYwcwojIElmIHRoZSBydW5uaW5nIHBvZCBjb3VudCBzdGF5cyB3aXRoaW4gdGhlIGdpdmVuIHRocmVzaG9sZCBmb3IgdGhpcyB0aW1lCiMgcGVyaW9kLCByZXR1cm4gQ1BVIHV0aWxpemF0aW9uIHRvIG5vcm1hbCBiZWZvcmUgdGhlIG1heGltdW0gd2FpdCB0aW1lIGhhcwojIGV4cGlyZXMKU1RFQURZX1NUQVRFX1dJTkRPVz0ke1NURUFEWV9TVEFURV9XSU5ET1c6LTYwfQoKIyBEZWZhdWx0IHN0ZWFkeS1zdGF0ZSBhbGxvd3MgYW55IHBvZCBjb3VudCB0byBiZSAic3RlYWR5IHN0YXRlIgojIEluY3JlYXNpbmcgdGhpcyB3aWxsIHNraXAgYW55IHN0ZWFkeS1zdGF0ZSBjaGVja3MgdW50aWwgdGhlIGNvdW50IHJpc2VzIGFib3ZlCiMgdGhpcyBudW1iZXIgdG8gYXZvaWQgZmFsc2UgcG9zaXRpdmVzIGlmIHRoZXJlIGFyZSBzb21lIHBlcmlvZHMgd2hlcmUgdGhlCiMgY291bnQgZG9lc24ndCBpbmNyZWFzZSBidXQgd2Uga25vdyB3ZSBjYW4ndCBiZSBhdCBzdGVhZHktc3RhdGUgeWV0LgpTVEVBRFlfU1RBVEVfTUlOSU1VTT0ke1NURUFEWV9TVEFURV9NSU5JTVVNOi0wfQoKIyMjIyMjIyMjIyMjIyMjIyMjIyMjIyMjIyMjIyMjIyMjIyMjIyMjIyMjIyMjIyMjIyMjIyMjIwoKd2l0aGluKCkgewogIGxvY2FsIGxhc3Q9JDEgY3VycmVudD0kMiB0aHJlc2hvbGQ9JDMKICBsb2NhbCBkZWx0YT0wIHBjaGFuZ2UKICBkZWx0YT0kKCggY3VycmVudCAtIGxhc3QgKSkKICBpZiBbWyAkY3VycmVudCAtZXEgJGxhc3QgXV07IHRoZW4KICAgIHBjaGFuZ2U9MAogIGVsaWYgW1sgJGxhc3QgLWVxIDAgXV07IHRoZW4KICAgIHBjaGFuZ2U9MTAwMDAwMAogIGVsc2UKICAgIHBjaGFuZ2U9JCgoICggIiRkZWx0YSIgKiAxMDApIC8gbGFzdCApKQogIGZpCiAgZWNobyAtbiAibGFzdDokbGFzdCBjdXJyZW50OiRjdXJyZW50IGRlbHRhOiRkZWx0YSBwY2hhbmdlOiR7cGNoYW5nZX0lOiAiCiAgbG9jYWwgYWJzb2x1dGUgbGltaXQKICBjYXNlICR0aHJlc2hvbGQgaW4KICAgIColKQogICAgICBhYnNvbHV0ZT0ke3BjaGFuZ2UjIy19ICMgYWJzb2x1dGUgdmFsdWUKICAgICAgbGltaXQ9JHt0aHJlc2hvbGQlJSV9CiAgICAgIDs7CiAgICAqKQogICAgICBhYnNvbHV0ZT0ke2RlbHRhIyMtfSAjIGFic29sdXRlIHZhbHVlCiAgICAgIGxpbWl0PSR0aHJlc2hvbGQKICAgICAgOzsKICBlc2FjCiAgaWYgW1sgJGFic29sdXRlIC1sZSAkbGltaXQgXV07IHRoZW4KICAgIGVjaG8gIndpdGhpbiAoKy8tKSR0aHJlc2hvbGQiCiAgICByZXR1cm4gMAogIGVsc2UKICAgIGVjaG8gIm91dHNpZGUgKCsvLSkkdGhyZXNob2xkIgogICAgcmV0dXJuIDEKICBmaQp9CgpzdGVhZHlzdGF0ZSgpIHsKICBsb2NhbCBsYXN0PSQxIGN1cnJlbnQ9JDIKICBpZiBbWyAkbGFzdCAtbHQgJFNURUFEWV9TVEFURV9NSU5JTVVNIF1dOyB0aGVuCiAgICBlY2hvICJsYXN0OiRsYXN0IGN1cnJlbnQ6JGN1cnJlbnQgV2FpdGluZyB0byByZWFjaCAkU1RFQURZX1NUQVRFX01JTklNVU0gYmVmb3JlIGNoZWNraW5nIGZvciBzdGVhZHktc3RhdGUiCiAgICByZXR1cm4gMQogIGZpCiAgd2l0aGluICIkbGFzdCIgIiRjdXJyZW50IiAiJFNURUFEWV9TVEFURV9USFJFU0hPTEQiCn0KCndhaXRGb3JSZWFkeSgpIHsKICBsb2dnZXIgIlJlY292ZXJ5OiBXYWl0aW5nICR7TUFYSU1VTV9XQUlUX1RJTUV9cyBmb3IgdGhlIGluaXRpYWxpemF0aW9uIHRvIGNvbXBsZXRlIgogIGxvY2FsIHQ9MCBzPTEwCiAgbG9jYWwgbGFzdENjb3VudD0wIGNjb3VudD0wIHN0ZWFkeVN0YXRlVGltZT0wCiAgd2hpbGUgW1sgJHQgLWx0ICRNQVhJTVVNX1dBSVRfVElNRSBdXTsgZG8KICAgIHNsZWVwICRzCiAgICAoKHQgKz0gcykpCiAgICAjIERldGVjdCBzdGVhZHktc3RhdGUgcG9kIGNvdW50CiAgICBjY291bnQ9JChjcmljdGwgcHMgMj4vZGV2L251bGwgfCB3YyAtbCkKICAgIGlmIFtbICRjY291bnQgLWd0IDAgXV0gJiYgc3RlYWR5c3RhdGUgIiRsYXN0Q2NvdW50IiAiJGNjb3VudCI7IHRoZW4KICAgICAgKChzdGVhZHlTdGF0ZVRpbWUgKz0gcykpCiAgICAgIGVjaG8gIlN0ZWFkeS1zdGF0ZSBmb3IgJHtzdGVhZHlTdGF0ZVRpbWV9cy8ke1NURUFEWV9TVEFURV9XSU5ET1d9cyIKICAgICAgaWYgW1sgJHN0ZWFkeVN0YXRlVGltZSAtZ2UgJFNURUFEWV9TVEFURV9XSU5ET1cgXV07IHRoZW4KICAgICAgICBsb2dnZXIgIlJlY292ZXJ5OiBTdGVhZHktc3RhdGUgKCsvLSAkU1RFQURZX1NUQVRFX1RIUkVTSE9MRCkgZm9yICR7U1RFQURZX1NUQVRFX1dJTkRPV31zOiBEb25lIgogICAgICAgIHJldHVybiAwCiAgICAgIGZpCiAgICBlbHNlCiAgICAgIGlmIFtbICRzdGVhZHlTdGF0ZVRpbWUgLWd0IDAgXV07IHRoZW4KICAgICAgICBlY2hvICJSZXNldHRpbmcgc3RlYWR5LXN0YXRlIHRpbWVyIgogICAgICAgIHN0ZWFkeVN0YXRlVGltZT0wCiAgICAgIGZpCiAgICBmaQogICAgbGFzdENjb3VudD0kY2NvdW50CiAgZG9uZQogIGxvZ2dlciAiUmVjb3Zlcnk6IFJlY292ZXJ5IENvbXBsZXRlIFRpbWVvdXQiCn0KCnNldFJjdU5vcm1hbCgpIHsKICBlY2hvICJTZXR0aW5nIHJjdV9ub3JtYWwgdG8gMSIKICBlY2hvIDEgPiAvc3lzL2tlcm5lbC9yY3Vfbm9ybWFsCn0KCm1haW4oKSB7CiAgd2FpdEZvclJlYWR5CiAgZWNobyAiV2FpdGluZyBmb3Igc3RlYWR5IHN0YXRlIHRvb2s6ICQoYXdrICd7cHJpbnQgaW50KCQxLzM2MDApImgiLCBpbnQoKCQxJTM2MDApLzYwKSJtIiwgaW50KCQxJTYwKSJzIn0nIC9wcm9jL3VwdGltZSkiCiAgc2V0UmN1Tm9ybWFsCn0KCmlmIFtbICIke0JBU0hfU09VUkNFWzBdfSIgPSAiJHswfSIgXV07IHRoZW4KICBtYWluICIke0B9IgogIGV4aXQgJD8KZmkK
mode: 493
path: /usr/local/bin/set-rcu-normal.sh
systemd:
units:
- contents: |
[Unit]
Description=Disable rcu_expedited after node has finished booting by setting rcu_normal to 1
[Service]
Type=simple
ExecStart=/usr/local/bin/set-rcu-normal.sh
# Maximum wait time is 600s = 10m:
Environment=MAXIMUM_WAIT_TIME=600
# Steady-state threshold = 2%
# Allowed values:
# 4 - absolute pod count (+/-)
# 4% - percent change (+/-)
# -1 - disable the steady-state check
# Note: '%' must be escaped as '%%' in systemd unit files
Environment=STEADY_STATE_THRESHOLD=2%%
# Steady-state window = 120s
# If the running pod count stays within the given threshold for this time
# period, return CPU utilization to normal before the maximum wait time has
# expires
Environment=STEADY_STATE_WINDOW=120
# Steady-state minimum = 40
# Increasing this will skip any steady-state checks until the count rises above
# this number to avoid false positives if there are some periods where the
# count doesn't increase but we know we can't be at steady-state yet.
Environment=STEADY_STATE_MINIMUM=40
[Install]
WantedBy=multi-user.target
enabled: true
name: set-rcu-normal.service08-set-rcu-normal-worker.yaml
# Automatically generated by extra-manifests-builder
# Do not make changes directly.
apiVersion: machineconfiguration.openshift.io/v1
kind: MachineConfig
metadata:
labels:
machineconfiguration.openshift.io/role: worker
name: 08-set-rcu-normal-worker
spec:
config:
ignition:
version: 3.2.0
storage:
files:
- contents:
source: data:text/plain;charset=utf-8;base64,IyEvYmluL2Jhc2gKIwojIERpc2FibGUgcmN1X2V4cGVkaXRlZCBhZnRlciBub2RlIGhhcyBmaW5pc2hlZCBib290aW5nCiMKIyBUaGUgZGVmYXVsdHMgYmVsb3cgY2FuIGJlIG92ZXJyaWRkZW4gdmlhIGVudmlyb25tZW50IHZhcmlhYmxlcwojCgojIERlZmF1bHQgd2FpdCB0aW1lIGlzIDYwMHMgPSAxMG06Ck1BWElNVU1fV0FJVF9USU1FPSR7TUFYSU1VTV9XQUlUX1RJTUU6LTYwMH0KCiMgRGVmYXVsdCBzdGVhZHktc3RhdGUgdGhyZXNob2xkID0gMiUKIyBBbGxvd2VkIHZhbHVlczoKIyAgNCAgLSBhYnNvbHV0ZSBwb2QgY291bnQgKCsvLSkKIyAgNCUgLSBwZXJjZW50IGNoYW5nZSAoKy8tKQojICAtMSAtIGRpc2FibGUgdGhlIHN0ZWFkeS1zdGF0ZSBjaGVjawpTVEVBRFlfU1RBVEVfVEhSRVNIT0xEPSR7U1RFQURZX1NUQVRFX1RIUkVTSE9MRDotMiV9CgojIERlZmF1bHQgc3RlYWR5LXN0YXRlIHdpbmRvdyA9IDYwcwojIElmIHRoZSBydW5uaW5nIHBvZCBjb3VudCBzdGF5cyB3aXRoaW4gdGhlIGdpdmVuIHRocmVzaG9sZCBmb3IgdGhpcyB0aW1lCiMgcGVyaW9kLCByZXR1cm4gQ1BVIHV0aWxpemF0aW9uIHRvIG5vcm1hbCBiZWZvcmUgdGhlIG1heGltdW0gd2FpdCB0aW1lIGhhcwojIGV4cGlyZXMKU1RFQURZX1NUQVRFX1dJTkRPVz0ke1NURUFEWV9TVEFURV9XSU5ET1c6LTYwfQoKIyBEZWZhdWx0IHN0ZWFkeS1zdGF0ZSBhbGxvd3MgYW55IHBvZCBjb3VudCB0byBiZSAic3RlYWR5IHN0YXRlIgojIEluY3JlYXNpbmcgdGhpcyB3aWxsIHNraXAgYW55IHN0ZWFkeS1zdGF0ZSBjaGVja3MgdW50aWwgdGhlIGNvdW50IHJpc2VzIGFib3ZlCiMgdGhpcyBudW1iZXIgdG8gYXZvaWQgZmFsc2UgcG9zaXRpdmVzIGlmIHRoZXJlIGFyZSBzb21lIHBlcmlvZHMgd2hlcmUgdGhlCiMgY291bnQgZG9lc24ndCBpbmNyZWFzZSBidXQgd2Uga25vdyB3ZSBjYW4ndCBiZSBhdCBzdGVhZHktc3RhdGUgeWV0LgpTVEVBRFlfU1RBVEVfTUlOSU1VTT0ke1NURUFEWV9TVEFURV9NSU5JTVVNOi0wfQoKIyMjIyMjIyMjIyMjIyMjIyMjIyMjIyMjIyMjIyMjIyMjIyMjIyMjIyMjIyMjIyMjIyMjIyMjIwoKd2l0aGluKCkgewogIGxvY2FsIGxhc3Q9JDEgY3VycmVudD0kMiB0aHJlc2hvbGQ9JDMKICBsb2NhbCBkZWx0YT0wIHBjaGFuZ2UKICBkZWx0YT0kKCggY3VycmVudCAtIGxhc3QgKSkKICBpZiBbWyAkY3VycmVudCAtZXEgJGxhc3QgXV07IHRoZW4KICAgIHBjaGFuZ2U9MAogIGVsaWYgW1sgJGxhc3QgLWVxIDAgXV07IHRoZW4KICAgIHBjaGFuZ2U9MTAwMDAwMAogIGVsc2UKICAgIHBjaGFuZ2U9JCgoICggIiRkZWx0YSIgKiAxMDApIC8gbGFzdCApKQogIGZpCiAgZWNobyAtbiAibGFzdDokbGFzdCBjdXJyZW50OiRjdXJyZW50IGRlbHRhOiRkZWx0YSBwY2hhbmdlOiR7cGNoYW5nZX0lOiAiCiAgbG9jYWwgYWJzb2x1dGUgbGltaXQKICBjYXNlICR0aHJlc2hvbGQgaW4KICAgIColKQogICAgICBhYnNvbHV0ZT0ke3BjaGFuZ2UjIy19ICMgYWJzb2x1dGUgdmFsdWUKICAgICAgbGltaXQ9JHt0aHJlc2hvbGQlJSV9CiAgICAgIDs7CiAgICAqKQogICAgICBhYnNvbHV0ZT0ke2RlbHRhIyMtfSAjIGFic29sdXRlIHZhbHVlCiAgICAgIGxpbWl0PSR0aHJlc2hvbGQKICAgICAgOzsKICBlc2FjCiAgaWYgW1sgJGFic29sdXRlIC1sZSAkbGltaXQgXV07IHRoZW4KICAgIGVjaG8gIndpdGhpbiAoKy8tKSR0aHJlc2hvbGQiCiAgICByZXR1cm4gMAogIGVsc2UKICAgIGVjaG8gIm91dHNpZGUgKCsvLSkkdGhyZXNob2xkIgogICAgcmV0dXJuIDEKICBmaQp9CgpzdGVhZHlzdGF0ZSgpIHsKICBsb2NhbCBsYXN0PSQxIGN1cnJlbnQ9JDIKICBpZiBbWyAkbGFzdCAtbHQgJFNURUFEWV9TVEFURV9NSU5JTVVNIF1dOyB0aGVuCiAgICBlY2hvICJsYXN0OiRsYXN0IGN1cnJlbnQ6JGN1cnJlbnQgV2FpdGluZyB0byByZWFjaCAkU1RFQURZX1NUQVRFX01JTklNVU0gYmVmb3JlIGNoZWNraW5nIGZvciBzdGVhZHktc3RhdGUiCiAgICByZXR1cm4gMQogIGZpCiAgd2l0aGluICIkbGFzdCIgIiRjdXJyZW50IiAiJFNURUFEWV9TVEFURV9USFJFU0hPTEQiCn0KCndhaXRGb3JSZWFkeSgpIHsKICBsb2dnZXIgIlJlY292ZXJ5OiBXYWl0aW5nICR7TUFYSU1VTV9XQUlUX1RJTUV9cyBmb3IgdGhlIGluaXRpYWxpemF0aW9uIHRvIGNvbXBsZXRlIgogIGxvY2FsIHQ9MCBzPTEwCiAgbG9jYWwgbGFzdENjb3VudD0wIGNjb3VudD0wIHN0ZWFkeVN0YXRlVGltZT0wCiAgd2hpbGUgW1sgJHQgLWx0ICRNQVhJTVVNX1dBSVRfVElNRSBdXTsgZG8KICAgIHNsZWVwICRzCiAgICAoKHQgKz0gcykpCiAgICAjIERldGVjdCBzdGVhZHktc3RhdGUgcG9kIGNvdW50CiAgICBjY291bnQ9JChjcmljdGwgcHMgMj4vZGV2L251bGwgfCB3YyAtbCkKICAgIGlmIFtbICRjY291bnQgLWd0IDAgXV0gJiYgc3RlYWR5c3RhdGUgIiRsYXN0Q2NvdW50IiAiJGNjb3VudCI7IHRoZW4KICAgICAgKChzdGVhZHlTdGF0ZVRpbWUgKz0gcykpCiAgICAgIGVjaG8gIlN0ZWFkeS1zdGF0ZSBmb3IgJHtzdGVhZHlTdGF0ZVRpbWV9cy8ke1NURUFEWV9TVEFURV9XSU5ET1d9cyIKICAgICAgaWYgW1sgJHN0ZWFkeVN0YXRlVGltZSAtZ2UgJFNURUFEWV9TVEFURV9XSU5ET1cgXV07IHRoZW4KICAgICAgICBsb2dnZXIgIlJlY292ZXJ5OiBTdGVhZHktc3RhdGUgKCsvLSAkU1RFQURZX1NUQVRFX1RIUkVTSE9MRCkgZm9yICR7U1RFQURZX1NUQVRFX1dJTkRPV31zOiBEb25lIgogICAgICAgIHJldHVybiAwCiAgICAgIGZpCiAgICBlbHNlCiAgICAgIGlmIFtbICRzdGVhZHlTdGF0ZVRpbWUgLWd0IDAgXV07IHRoZW4KICAgICAgICBlY2hvICJSZXNldHRpbmcgc3RlYWR5LXN0YXRlIHRpbWVyIgogICAgICAgIHN0ZWFkeVN0YXRlVGltZT0wCiAgICAgIGZpCiAgICBmaQogICAgbGFzdENjb3VudD0kY2NvdW50CiAgZG9uZQogIGxvZ2dlciAiUmVjb3Zlcnk6IFJlY292ZXJ5IENvbXBsZXRlIFRpbWVvdXQiCn0KCnNldFJjdU5vcm1hbCgpIHsKICBlY2hvICJTZXR0aW5nIHJjdV9ub3JtYWwgdG8gMSIKICBlY2hvIDEgPiAvc3lzL2tlcm5lbC9yY3Vfbm9ybWFsCn0KCm1haW4oKSB7CiAgd2FpdEZvclJlYWR5CiAgZWNobyAiV2FpdGluZyBmb3Igc3RlYWR5IHN0YXRlIHRvb2s6ICQoYXdrICd7cHJpbnQgaW50KCQxLzM2MDApImgiLCBpbnQoKCQxJTM2MDApLzYwKSJtIiwgaW50KCQxJTYwKSJzIn0nIC9wcm9jL3VwdGltZSkiCiAgc2V0UmN1Tm9ybWFsCn0KCmlmIFtbICIke0JBU0hfU09VUkNFWzBdfSIgPSAiJHswfSIgXV07IHRoZW4KICBtYWluICIke0B9IgogIGV4aXQgJD8KZmkK
mode: 493
path: /usr/local/bin/set-rcu-normal.sh
systemd:
units:
- contents: |
[Unit]
Description=Disable rcu_expedited after node has finished booting by setting rcu_normal to 1
[Service]
Type=simple
ExecStart=/usr/local/bin/set-rcu-normal.sh
# Maximum wait time is 600s = 10m:
Environment=MAXIMUM_WAIT_TIME=600
# Steady-state threshold = 2%
# Allowed values:
# 4 - absolute pod count (+/-)
# 4% - percent change (+/-)
# -1 - disable the steady-state check
# Note: '%' must be escaped as '%%' in systemd unit files
Environment=STEADY_STATE_THRESHOLD=2%%
# Steady-state window = 120s
# If the running pod count stays within the given threshold for this time
# period, return CPU utilization to normal before the maximum wait time has
# expires
Environment=STEADY_STATE_WINDOW=120
# Steady-state minimum = 40
# Increasing this will skip any steady-state checks until the count rises above
# this number to avoid false positives if there are some periods where the
# count doesn't increase but we know we can't be at steady-state yet.
Environment=STEADY_STATE_MINIMUM=40
[Install]
WantedBy=multi-user.target
enabled: true
name: set-rcu-normal.service3.2.5. Telco RAN DU reference configuration software specifications
The following information describes the telco RAN DU reference design specification (RDS) validated software versions.
3.2.5.1. Telco RAN DU 4.16 validated software components
The Red Hat telco RAN DU 4.16 solution has been validated using the following Red Hat software products for OpenShift Container Platform managed clusters and hub clusters.
| Component | Software version |
|---|---|
| Managed cluster version | 4.16 |
| Cluster Logging Operator | 6.0 |
| Local Storage Operator | 4.16 |
| PTP Operator | 4.16 |
| SRIOV Operator | 4.16 |
| Node Tuning Operator | 4.16 |
| Logging Operator | 4.16 |
| SRIOV-FEC Operator | 2.9 |
| Component | Software version |
|---|---|
| Hub cluster version | 4.16 |
| GitOps ZTP plugin | 4.16 |
| Red Hat Advanced Cluster Management (RHACM) | 2.10, 2.11 |
| Red Hat OpenShift GitOps | 1.16 |
| Topology Aware Lifecycle Manager (TALM) | 4.16 |
3.3. Telco core reference design specification
3.3.1. Telco core 4.16 reference design overview
The telco core reference design specification (RDS) configures a OpenShift Container Platform cluster running on commodity hardware to host telco core workloads.
3.3.2. Telco core 4.16 use model overview
The Telco core reference design specification (RDS) describes a platform that supports large-scale telco applications including control plane functions such as signaling and aggregation. It also includes some centralized data plane functions, for example, user plane functions (UPF). These functions generally require scalability, complex networking support, resilient software-defined storage, and support performance requirements that are less stringent and constrained than far-edge deployments like RAN.
Telco core use model architecture

The networking prerequisites for telco core functions are diverse and encompass an array of networking attributes and performance benchmarks. IPv6 is mandatory, with dual-stack configurations being prevalent. Certain functions demand maximum throughput and transaction rates, necessitating user plane networking support such as DPDK. Other functions adhere to conventional cloud-native patterns and can use solutions such as OVN-K, kernel networking, and load balancing.
Telco core clusters are configured as standard three control plane clusters with worker nodes configured with the stock non real-time (RT) kernel. To support workloads with varying networking and performance requirements, worker nodes are segmented using MachineConfigPool CRs. For example, this is done to separate non-user data plane nodes from high-throughput nodes. To support the required telco operational features, the clusters have a standard set of Operator Lifecycle Manager (OLM) Day 2 Operators installed.
3.3.2.1. Common baseline model
The following configurations and use model description are applicable to all telco core use cases.
- Cluster
The cluster conforms to these requirements:
- High-availability (3+ supervisor nodes) control plane
- Non-schedulable supervisor nodes
-
Multiple
MachineConfigPoolresources
- Storage
- Core use cases require persistent storage as provided by external OpenShift Data Foundation. For more information, see the "Storage" subsection in "Reference core design components".
- Networking
Telco core clusters networking conforms to these requirements:
- Dual stack IPv4/IPv6
- Fully disconnected: Clusters do not have access to public networking at any point in their lifecycle.
- Multiple networks: Segmented networking provides isolation between OAM, signaling, and storage traffic.
- Cluster network type: OVN-Kubernetes is required for IPv6 support.
Core clusters have multiple layers of networking supported by underlying RHCOS, SR-IOV Operator, Load Balancer, and other components detailed in the following "Networking" section. At a high level these layers include:
Cluster networking: The cluster network configuration is defined and applied through the installation configuration. Updates to the configuration can be done at day-2 through the NMState Operator. Initial configuration can be used to establish:
- Host interface configuration
- Active/Active Bonding (Link Aggregation Control Protocol (LACP))
Secondary or additional networks: OpenShift CNI is configured through the Network
additionalNetworksor NetworkAttachmentDefinition CRs.- MACVLAN
- Application Workload: User plane networking is running in cloud-native network functions (CNFs).
- Service Mesh
- Use of Service Mesh by telco CNFs is very common. It is expected that all core clusters will include a Service Mesh implementation. Service Mesh implementation and configuration is outside the scope of this specification.
3.3.2.1.1. Engineering Considerations common use model
The following engineering considerations are relevant for the common use model.
- Worker nodes
- Intel 3rd Generation Xeon (IceLake) CPUs or better when supported by OpenShift Container Platform, or CPUs with the silicon security bug (Spectre and similar) mitigations turned off. Skylake and older CPUs can experience 40% transaction performance drops when Spectre and similar mitigations are enabled.
- AMD EPYC Zen 4 CPUs (Genoa, Bergamo) or AMD EPYC Zen 5 CPUs (Turin) when supported by OpenShift Container Platform.
- Intel Sierra Forest CPUs when supported by OpenShift Container Platform.
-
IRQ Balancing is enabled on worker nodes. The
PerformanceProfilesetsgloballyDisableIrqLoadBalancing: false. Guaranteed QoS Pods are annotated to ensure isolation as described in "CPU partitioning and performance tuning" subsection in "Reference core design components" section.
- All nodes
- Hyper-Threading is enabled on all nodes
-
CPU architecture is
x86_64only - Nodes are running the stock (non-RT) kernel
- Nodes are not configured for workload partitioning
The balance of node configuration between power management and maximum performance varies between MachineConfigPools in the cluster. This configuration is consistent for all nodes within a MachineConfigPool.
- CPU partitioning
-
CPU partitioning is configured using the PerformanceProfile and applied on a per
MachineConfigPoolbasis. See the "CPU partitioning and performance tuning" subsection in "Reference core design components".
3.3.2.1.2. Application workloads
Application workloads running on core clusters might include a mix of high-performance networking CNFs and traditional best-effort or burstable pod workloads.
Guaranteed QoS scheduling is available to pods that require exclusive or dedicated use of CPUs due to performance or security requirements. Typically pods hosting high-performance and low-latency-sensitive Cloud Native Functions (CNFs) utilizing user plane networking with DPDK necessitate the exclusive utilization of entire CPUs. This is accomplished through node tuning and guaranteed Quality of Service (QoS) scheduling. For pods that require exclusive use of CPUs, be aware of the potential implications of hyperthreaded systems and configure them to request multiples of 2 CPUs when the entire core (2 hyperthreads) must be allocated to the pod.
Pods running network functions that do not require the high throughput and low latency networking are typically scheduled with best-effort or burstable QoS and do not require dedicated or isolated CPU cores.
- Description of limits
- CNF applications should conform to the latest version of the Red Hat Best Practices for Kubernetes guide.
For a mix of best-effort and burstable QoS pods.
-
Guaranteed QoS pods might be used but require correct configuration of reserved and isolated CPUs in the
PerformanceProfile. - Guaranteed QoS Pods must include annotations for fully isolating CPUs.
- Best effort and burstable pods are not guaranteed exclusive use of a CPU. Workloads might be preempted by other workloads, operating system daemons, or kernel tasks.
-
Guaranteed QoS pods might be used but require correct configuration of reserved and isolated CPUs in the
Exec probes should be avoided unless there is no viable alternative.
- Do not use exec probes if a CNF is using CPU pinning.
-
Other probe implementations, for example
httpGet/tcpSocket, should be used.
NoteStartup probes require minimal resources during steady-state operation. The limitation on exec probes applies primarily to liveness and readiness probes.
- Signaling workload
- Signaling workloads typically use SCTP, REST, gRPC, or similar TCP or UDP protocols.
- The transactions per second (TPS) is in the order of hundreds of thousands using secondary CNI (multus) configured as MACVLAN or SR-IOV.
- Signaling workloads run in pods with either guaranteed or burstable QoS.
3.3.3. Telco core reference design components
The following sections describe the various OpenShift Container Platform components and configurations that you use to configure and deploy clusters to run telco core workloads.
3.3.3.1. CPU partitioning and performance tuning
- New in this release
- In this release, OpenShift Container Platform deployments use Control Groups version 2 (cgroup v2) by default. As a consequence, performance profiles in a cluster use cgroups v2 for the underlying resource management layer.
- Description
-
CPU partitioning allows for the separation of sensitive workloads from generic purposes, auxiliary processes, interrupts, and driver work queues to achieve improved performance and latency. The CPUs allocated to those auxiliary processes are referred to as
reservedin the following sections. In hyperthreaded systems, a CPU is one hyperthread. - Limits and requirements
The operating system needs a certain amount of CPU to perform all the support tasks including kernel networking.
- A system with just user plane networking applications (DPDK) needs at least one Core (2 hyperthreads when enabled) reserved for the operating system and the infrastructure components.
- A system with Hyper-Threading enabled must always put all core sibling threads to the same pool of CPUs.
- The set of reserved and isolated cores must include all CPU cores.
- Core 0 of each NUMA node must be included in the reserved CPU set.
Isolated cores might be impacted by interrupts. The following annotations must be attached to the pod if guaranteed QoS pods require full use of the CPU:
cpu-load-balancing.crio.io: "disable" cpu-quota.crio.io: "disable" irq-load-balancing.crio.io: "disable"When per-pod power management is enabled with
PerformanceProfile.workloadHints.perPodPowerManagementthe following annotations must also be attached to the pod if guaranteed QoS pods require full use of the CPU:cpu-c-states.crio.io: "disable" cpu-freq-governor.crio.io: "performance"
- Engineering considerations
-
The minimum reserved capacity (
systemReserved) required can be found by following the guidance in "Which amount of CPU and memory are recommended to reserve for the system in OpenShift 4 nodes?" - The actual required reserved CPU capacity depends on the cluster configuration and workload attributes.
- This reserved CPU value must be rounded up to a full core (2 hyper-thread) alignment.
- Changes to the CPU partitioning will drain and reboot the nodes in the MCP.
- The reserved CPUs reduce the pod density, as the reserved CPUs are removed from the allocatable capacity of the OpenShift node.
- The real-time workload hint should be enabled if the workload is real-time capable.
- Hardware without Interrupt Request (IRQ) affinity support will impact isolated CPUs. To ensure that pods with guaranteed CPU QoS have full use of allocated CPU, all hardware in the server must support IRQ affinity.
-
OVS dynamically manages its
cpusetconfiguration to adapt to network traffic needs. You do not need to reserve additional CPUs for handling high network throughput on the primary CNI. - If workloads running on the cluster require cgroups v1, you can configure nodes to use cgroups v1. You can make this configuration as part of initial cluster deployment. For more information, see Enabling Linux cgroup v1 during installation in the Additional resources section.
-
The minimum reserved capacity (
3.3.3.2. Service Mesh
- Description
- Telco core CNFs typically require a service mesh implementation. The specific features and performance required are dependent on the application. The selection of service mesh implementation and configuration is outside the scope of this documentation. The impact of service mesh on cluster resource utilization and performance, including additional latency introduced into pod networking, must be accounted for in the overall solution engineering.
3.3.3.3. Networking
OpenShift Container Platform networking is an ecosystem of features, plugins, and advanced networking capabilities that extend Kubernetes networking with the advanced networking-related features that your cluster needs to manage its network traffic for one or multiple hybrid clusters.
3.3.3.3.1. Cluster Network Operator
- New in this release
- No reference design updates in this release
- Description
The Cluster Network Operator (CNO) deploys and manages the cluster network components including the default OVN-Kubernetes network plugin during cluster installation. The CNO allows for configuring primary interface MTU settings, OVN gateway configurations to use node routing tables for pod egress, and additional secondary networks such as MACVLAN.
In support of network traffic separation, multiple network interfaces are configured through the CNO. Traffic steering to these interfaces is configured through static routes applied by using the NMState Operator. To ensure that pod traffic is properly routed, OVN-K is configured with the
routingViaHostoption enabled. This setting uses the kernel routing table and the applied static routes rather than OVN for pod egress traffic.The Whereabouts CNI plugin is used to provide dynamic IPv4 and IPv6 addressing for additional pod network interfaces without the use of a DHCP server.
- Limits and requirements
- OVN-Kubernetes is required for IPv6 support.
- Large MTU cluster support requires connected network equipment to be set to the same or larger value.
-
MACVLAN and IPVLAN cannot co-locate on the same main interface due to their reliance on the same underlying kernel mechanism, specifically the
rx_handler. This handler allows a third-party module to process incoming packets before the host processes them, and only one such handler can be registered per network interface. Since both MACVLAN and IPVLAN need to register their ownrx_handlerto function, they conflict and cannot coexist on the same interface. See ipvlan/ipvlan_main.c#L82 and net/macvlan.c#L1260 for details. Alternative NIC configurations include splitting the shared NIC into multiple NICs or using a single dual-port NIC.
ImportantSplitting the shared NIC into multiple NICs or using a single dual-port NIC has not been validated with the telco core reference design.
- Single-stack IP cluster not validated.
- Engineering considerations
-
Pod egress traffic is handled by kernel routing table with the
routingViaHostoption. Appropriate static routes must be configured in the host.
-
Pod egress traffic is handled by kernel routing table with the
3.3.3.3.2. Load balancer
- New in this release
-
In OpenShift Container Platform 4.17,
frr-k8sis now the default and fully supported Border Gateway Protocol (BGP) backend. The deprecatedfrrBGP mode is still available. You should upgrade clusters to use thefrr-k8sbackend.
-
In OpenShift Container Platform 4.17,
- Description
MetalLB is a load-balancer implementation that uses standard routing protocols for bare-metal clusters. It enables a Kubernetes service to get an external IP address which is also added to the host network for the cluster.
NoteSome use cases might require features not available in MetalLB, for example stateful load balancing. Where necessary, use an external third party load balancer. Selection and configuration of an external load balancer is outside the scope of this document. When you use an external third party load balancer, ensure that it meets all performance and resource utilization requirements.
- Limits and requirements
- Stateful load balancing is not supported by MetalLB. An alternate load balancer implementation must be used if this is a requirement for workload CNFs.
- The networking infrastructure must ensure that the external IP address is routable from clients to the host network for the cluster.
- Engineering considerations
- MetalLB is used in BGP mode only for core use case models.
-
For core use models, MetalLB is supported with only when you set
routingViaHost=truein theovnKubernetesConfig.gatewayConfigspecification of the OVN-Kubernetes network plugin. - BGP configuration in MetalLB varies depending on the requirements of the network and peers.
- Address pools can be configured as needed, allowing variation in addresses, aggregation length, auto assignment, and other relevant parameters.
-
MetalLB uses BGP for announcing routes only. Only the
transmitIntervalandminimumTtlparameters are relevant in this mode. Other parameters in the BFD profile should remain close to the default settings. Shorter values might lead to errors and impact performance.
3.3.3.3.3. SR-IOV
- New in this release
-
With this release, you can use the SR-IOV Network Operator to configure QinQ (802.1ad and 802.1q) tagging. QinQ tagging provides efficient traffic management by enabling the use of both inner and outer VLAN tags. Outer VLAN tagging is hardware accelerated, leading to faster network performance. The update extends beyond the SR-IOV Network Operator itself. You can now configure QinQ on externally managed VFs by setting the outer VLAN tag using
nmstate. QinQ support varies across different NICs. For a comprehensive list of known limitations for specific NIC models, see the official documentation. - With this release, you can configure the SR-IOV Network Operator to drain nodes in parallel during network policy updates, dramatically accelerating the setup process. This translates to significant time savings, especially for large cluster deployments that previously took hours or even days to complete.
-
With this release, you can use the SR-IOV Network Operator to configure QinQ (802.1ad and 802.1q) tagging. QinQ tagging provides efficient traffic management by enabling the use of both inner and outer VLAN tags. Outer VLAN tagging is hardware accelerated, leading to faster network performance. The update extends beyond the SR-IOV Network Operator itself. You can now configure QinQ on externally managed VFs by setting the outer VLAN tag using
- Description
- SR-IOV enables physical network interfaces (PFs) to be divided into multiple virtual functions (VFs). VFs can then be assigned to multiple pods to achieve higher throughput performance while keeping the pods isolated. The SR-IOV Network Operator provisions and manages SR-IOV CNI, network device plugin, and other components of the SR-IOV stack.
- Limits and requirements
- The network interface controllers supported are listed in Supported devices
- SR-IOV and IOMMU enablement in BIOS: The SR-IOV Network Operator automatically enables IOMMU on the kernel command line.
- SR-IOV VFs do not receive link state updates from PF. If link down detection is needed, it must be done at the protocol level.
-
MultiNetworkPolicyCRs can be applied tonetdevicenetworks only. This is because the implementation uses theiptablestool, which cannot managevfiointerfaces.
- Engineering considerations
-
SR-IOV interfaces in
vfiomode are typically used to enable additional secondary networks for applications that require high throughput or low latency. -
If you exclude the
SriovOperatorConfigCR from your deployment, the CR will not be created automatically.
-
SR-IOV interfaces in
3.3.3.3.4. NMState Operator
- New in this release
- No reference design updates in this release
- Description
- The NMState Operator provides a Kubernetes API for performing network configurations across the cluster’s nodes. It enables network interface configurations, static IPs and DNS, VLANs, trunks, bonding, static routes, MTU, and enabling promiscuous mode on the secondary interfaces. The cluster nodes periodically report on the state of each node’s network interfaces to the API server.
- Limits and requirements
- Not applicable
- Engineering considerations
-
The initial networking configuration is applied using
NMStateConfigcontent in the installation CRs. The NMState Operator is used only when needed for network updates. -
When SR-IOV virtual functions are used for host networking, the NMState Operator using
NodeNetworkConfigurationPolicyis used to configure those VF interfaces, for example, VLANs and the MTU.
-
The initial networking configuration is applied using
3.3.3.4. Logging
- New in this release
- Cluster Logging Operator 6.0 is new in this release. Update your existing implementation to adapt to the new version of the API. You must remove the old Operator artifacts by using policies. For more information, see Additional resources.
- Description
- The Cluster Logging Operator enables collection and shipping of logs off the node for remote archival and analysis. The reference configuration ships audit and infrastructure logs to a remote archive by using Kafka.
- Limits and requirements
- Not applicable
- Engineering considerations
- The impact of cluster CPU use is based on the number or size of logs generated and the amount of log filtering configured.
- The reference configuration does not include shipping of application logs. Inclusion of application logs in the configuration requires evaluation of the application logging rate and sufficient additional CPU resources allocated to the reserved set.
3.3.3.5. Power Management
- New in this release
- No reference design updates in this release
- Description
- The Performance Profile can be used to configure a cluster in a high power, low power, or mixed mode. The choice of power mode depends on the characteristics of the workloads running on the cluster, particularly how sensitive they are to latency. Configure the maximum latency for a low-latency pod by using the per-pod power management C-states feature.
For more information, see Configuring power saving for nodes.
- Limits and requirements
- Power configuration relies on appropriate BIOS configuration, for example, enabling C-states and P-states. Configuration varies between hardware vendors.
- Engineering considerations
-
Latency: To ensure that latency-sensitive workloads meet their requirements, you will need either a high-power configuration or a per-pod power management configuration. Per-pod power management is only available for
GuaranteedQoS Pods with dedicated pinned CPUs.
-
Latency: To ensure that latency-sensitive workloads meet their requirements, you will need either a high-power configuration or a per-pod power management configuration. Per-pod power management is only available for
3.3.3.6. Storage
- Overview
Cloud native storage services can be provided by multiple solutions including OpenShift Data Foundation from Red Hat or third parties.
OpenShift Data Foundation is a Ceph based software-defined storage solution for containers. It provides block storage, file system storage, and on-premises object storage, which can be dynamically provisioned for both persistent and non-persistent data requirements. Telco core applications require persistent storage.
NoteAll storage data may not be encrypted in flight. To reduce risk, isolate the storage network from other cluster networks. The storage network must not be reachable, or routable, from other cluster networks. Only nodes directly attached to the storage network should be allowed to gain access to it.
3.3.3.6.1. OpenShift Data Foundation
- New in this release
- No reference design updates in this release
- Description
- Red Hat OpenShift Data Foundation is a software-defined storage service for containers. For Telco core clusters, storage support is provided by OpenShift Data Foundation storage services running externally to the application workload cluster. OpenShift Data Foundation supports separation of storage traffic using secondary CNI networks.
- Limits and requirements
- In an IPv4/IPv6 dual-stack networking environment, OpenShift Data Foundation uses IPv4 addressing. For more information, see Support OpenShift dual stack with OpenShift Data Foundation using IPv4.
- Engineering considerations
- OpenShift Data Foundation network traffic should be isolated from other traffic on a dedicated network, for example, by using VLAN isolation.
3.3.3.6.2. Other Storage
Other storage solutions can be used to provide persistent storage for core clusters. The configuration and integration of these solutions is outside the scope of the telco core RDS. Integration of the storage solution into the core cluster must include correct sizing and performance analysis to ensure the storage meets overall performance and resource utilization requirements.
3.3.3.7. Monitoring
- New in this release
- No reference design updates in this release
- Description
The Cluster Monitoring Operator (CMO) is included by default on all OpenShift clusters and provides monitoring (metrics, dashboards, and alerting) for the platform components and optionally user projects as well.
Configuration of the monitoring operator allows for customization, including:
- Default retention period
- Custom alert rules
The default handling of pod CPU and memory metrics is based on upstream Kubernetes
cAdvisorand makes a tradeoff that prefers handling of stale data over metric accuracy. This leads to spiky data that will create false triggers of alerts over user-specified thresholds. OpenShift supports an opt-in dedicated service monitor feature creating an additional set of pod CPU and memory metrics that do not suffer from the spiky behavior. For additional information, see this solution guide.In addition to default configuration, the following metrics are expected to be configured for telco core clusters:
- Pod CPU and memory metrics and alerts for user workloads
- Limits and requirements
- Monitoring configuration must enable the dedicated service monitor feature for accurate representation of pod metrics
- Engineering considerations
- The Prometheus retention period is specified by the user. The value used is a tradeoff between operational requirements for maintaining historical data on the cluster against CPU and storage resources. Longer retention periods increase the need for storage and require additional CPU to manage the indexing of data.
3.3.3.8. Scheduling
- New in this release
- No reference design updates in this release
- Description
- The scheduler is a cluster-wide component responsible for selecting the right node for a given workload. It is a core part of the platform and does not require any specific configuration in the common deployment scenarios. However, there are few specific use cases described in the following section. NUMA-aware scheduling can be enabled through the NUMA Resources Operator. For more information, see Scheduling NUMA-aware workloads.
- Limits and requirements
The default scheduler does not understand the NUMA locality of workloads. It only knows about the sum of all free resources on a worker node. This might cause workloads to be rejected when scheduled to a node with Topology manager policy set to
single-numa-nodeorrestricted.- For example, consider a pod requesting 6 CPUs and being scheduled to an empty node that has 4 CPUs per NUMA node. The total allocatable capacity of the node is 8 CPUs and the scheduler will place the pod there. The node local admission will fail, however, as there are only 4 CPUs available in each of the NUMA nodes.
-
All clusters with multi-NUMA nodes are required to use the NUMA Resources Operator. The
machineConfigPoolSelectorof the NUMA Resources Operator must select all nodes where NUMA aligned scheduling is needed.
- All machine config pools must have consistent hardware configuration for example all nodes are expected to have the same NUMA zone count.
- Engineering considerations
- Pods might require annotations for correct scheduling and isolation. For more information on annotations, see CPU partitioning and performance tuning.
-
You can configure SR-IOV virtual function NUMA affinity to be ignored during scheduling by using the
excludeTopologyfield inSriovNetworkNodePolicyCR.
3.3.3.9. Installation
- New in this release
- No reference design updates in this release
- Description
Telco core clusters can be installed using the Agent Based Installer (ABI). This method allows users to install OpenShift Container Platform on bare metal servers without requiring additional servers or VMs for managing the installation. The ABI installer can be run on any system for example a laptop to generate an ISO installation image. This ISO is used as the installation media for the cluster supervisor nodes. Progress can be monitored using the ABI tool from any system with network connectivity to the supervisor node’s API interfaces.
- Installation from declarative CRs
- Does not require additional servers to support installation
- Supports install in disconnected environment
- Limits and requirements
- Disconnected installation requires a reachable registry with all required content mirrored.
- Engineering considerations
- Networking configuration should be applied as NMState configuration during installation in preference to day-2 configuration by using the NMState Operator.
3.3.3.10. Security
- New in this release
- No reference design updates in this release
- Description
Telco operators are security conscious and require clusters to be hardened against multiple attack vectors. Within OpenShift Container Platform, there is no single component or feature responsible for securing a cluster. This section provides details of security-oriented features and configuration for the use models covered in this specification.
- SecurityContextConstraints: All workload pods should be run with restricted-v2 or restricted SCC.
-
Seccomp: All pods should be run with the
RuntimeDefault(or stronger) seccomp profile. - Rootless DPDK pods: Many user-plane networking (DPDK) CNFs require pods to run with root privileges. With this feature, a conformant DPDK pod can be run without requiring root privileges. Rootless DPDK pods create a tap device in a rootless pod that injects traffic from a DPDK application to the kernel.
- Storage: The storage network should be isolated and non-routable to other cluster networks. See the "Storage" section for additional details.
- Limits and requirements
Rootless DPDK pods requires the following additional configuration steps:
-
Configure the TAP plugin with the
container_tSELinux context. -
Enable the
container_use_devicesSELinux boolean on the hosts.
-
Configure the TAP plugin with the
- Engineering considerations
-
For rootless DPDK pod support, the SELinux boolean
container_use_devicesmust be enabled on the host for the TAP device to be created. This introduces a security risk that is acceptable for short to mid-term use. Other solutions will be explored.
-
For rootless DPDK pod support, the SELinux boolean
3.3.3.11. Scalability
- New in this release
- No reference design updates in this release
- Description
Clusters will scale to the sizing listed in the limits and requirements section.
Scaling of workloads is described in the use model section.
- Limits and requirements
- Cluster scales to at least 120 nodes
- Engineering considerations
- Not applicable
3.3.3.12. Additional configuration
3.3.3.12.1. Disconnected environment
- Description
Telco core clusters are expected to be installed in networks without direct access to the internet. All container images needed to install, configure, and operator the cluster must be available in a disconnected registry. This includes OpenShift Container Platform images, day-2 Operator Lifecycle Manager (OLM) Operator images, and application workload images. The use of a disconnected environment provides multiple benefits, for example:
- Limiting access to the cluster for security
- Curated content: The registry is populated based on curated and approved updates for the clusters
- Limits and requirements
- A unique name is required for all custom CatalogSources. Do not reuse the default catalog names.
- A valid time source must be configured as part of cluster installation.
- Engineering considerations
- Not applicable
3.3.3.12.2. Kernel
- New in this release
- No reference design updates in this release
- Description
The user can install the following kernel modules by using
MachineConfigto provide extended kernel functionality to CNFs:- sctp
- ip_gre
- ip6_tables
- ip6t_REJECT
- ip6table_filter
- ip6table_mangle
- iptable_filter
- iptable_mangle
- iptable_nat
- xt_multiport
- xt_owner
- xt_REDIRECT
- xt_statistic
- xt_TCPMSS
- Limits and requirements
- Use of functionality available through these kernel modules must be analyzed by the user to determine the impact on CPU load, system performance, and ability to sustain KPI.
NoteOut of tree drivers are not supported.
- Engineering considerations
- Not applicable
3.3.4. Telco core 4.16 reference configuration CRs
Use the following custom resources (CRs) to configure and deploy OpenShift Container Platform clusters with the telco core profile. Use the CRs to form the common baseline used in all the specific use models unless otherwise indicated.
3.3.4.1. Extracting the telco core reference design configuration CRs
You can extract the complete set of custom resources (CRs) for the telco core profile from the telco-core-rds-rhel9 container image. The container image has both the required CRs, and the optional CRs, for the telco core profile.
Prerequisites
-
You have installed
podman.
Procedure
Extract the content from the
telco-core-rds-rhel9container image by running the following commands:$ mkdir -p ./out$ podman run -it registry.redhat.io/openshift4/openshift-telco-core-rds-rhel9:v4.16 | base64 -d | tar xv -C out
Verification
The
outdirectory has the following folder structure. You can view the telco core CRs in theout/telco-core-rds/directory.Example output
out/ └── telco-core-rds ├── configuration │ └── reference-crs │ ├── optional │ │ ├── logging │ │ ├── networking │ │ │ └── multus │ │ │ └── tap_cni │ │ ├── other │ │ └── tuning │ └── required │ ├── networking │ │ ├── metallb │ │ ├── multinetworkpolicy │ │ └── sriov │ ├── other │ ├── performance │ ├── scheduling │ └── storage │ └── odf-external └── install
3.3.4.2. Resource Tuning reference CRs
| Component | Reference CR | Optional | New in this release |
|---|---|---|---|
| System reserved capacity | Yes | No |
3.3.4.3. Storage reference CRs
| Component | Reference CR | Optional | New in this release |
|---|---|---|---|
| External ODF configuration | No | No | |
| External ODF configuration | No | No | |
| External ODF configuration | No | No | |
| External ODF configuration | No | No | |
| External ODF configuration | No | No |
3.3.4.4. Networking reference CRs
| Component | Reference CR | Optional | New in this release |
|---|---|---|---|
| Baseline | No | No | |
| Baseline | Yes | Yes | |
| Load balancer | No | No | |
| Load balancer | No | No | |
| Load balancer | No | No | |
| Load balancer | No | No | |
| Load balancer | Yes | Yes | |
| Load balancer | No | No | |
| Load balancer | Yes | No | |
| Load balancer | Yes | No | |
| Load balancer | No | No | |
| Multus - Tap CNI for rootless DPDK pod | No | No | |
| NMState Operator | No | Yes | |
| NMState Operator | No | Yes | |
| NMState Operator | No | Yes | |
| NMState Operator | No | Yes | |
| SR-IOV Network Operator | Yes | No | |
| SR-IOV Network Operator | No | No | |
| SR-IOV Network Operator | No | No | |
| SR-IOV Network Operator | No | No | |
| SR-IOV Network Operator | No | No | |
| SR-IOV Network Operator | No | No |
3.3.4.5. Scheduling reference CRs
| Component | Reference CR | Optional | New in this release |
|---|---|---|---|
| NUMA-aware scheduler | No | No | |
| NUMA-aware scheduler | No | No | |
| NUMA-aware scheduler | No | No | |
| NUMA-aware scheduler | No | No | |
| NUMA-aware scheduler | No | No | |
| NUMA-aware scheduler | No | Yes |
3.3.4.6. Other reference CRs
| Component | Reference CR | Optional | New in this release |
|---|---|---|---|
| Additional kernel modules | Yes | No | |
| Additional kernel modules | Yes | No | |
| Additional kernel modules | Yes | No | |
| Cluster logging | No | No | |
| Cluster logging | No | No | |
| Cluster logging | No | No | |
| Cluster logging | No | No | |
| Cluster logging | No | No | |
| Disconnected configuration | No | No | |
| Disconnected configuration | No | No | |
| Disconnected configuration | No | No | |
| Monitoring and observability | Yes | No | |
| Power management | No | No |
3.3.4.7. YAML reference
3.3.4.7.1. Resource Tuning reference YAML
control-plane-system-reserved.yaml
# optional
# count: 1
apiVersion: machineconfiguration.openshift.io/v1
kind: KubeletConfig
metadata:
name: autosizing-master
spec:
autoSizingReserved: true
machineConfigPoolSelector:
matchLabels:
pools.operator.machineconfiguration.openshift.io/master: ""3.3.4.7.2. Storage reference YAML
01-rook-ceph-external-cluster-details.secret.yaml
# required
# count: 1
---
apiVersion: v1
kind: Secret
metadata:
name: rook-ceph-external-cluster-details
namespace: openshift-storage
type: Opaque
data:
# encoded content has been made generic
external_cluster_details: eyJuYW1lIjoicm9vay1jZXBoLW1vbi1lbmRwb2ludHMiLCJraW5kIjoiQ29uZmlnTWFwIiwiZGF0YSI6eyJkYXRhIjoiY2VwaHVzYTE9MS4yLjMuNDo2Nzg5IiwibWF4TW9uSWQiOiIwIiwibWFwcGluZyI6Int9In19LHsibmFtZSI6InJvb2stY2VwaC1tb24iLCJraW5kIjoiU2VjcmV0IiwiZGF0YSI6eyJhZG1pbi1zZWNyZXQiOiJhZG1pbi1zZWNyZXQiLCJmc2lkIjoiMTExMTExMTEtMTExMS0xMTExLTExMTEtMTExMTExMTExMTExIiwibW9uLXNlY3JldCI6Im1vbi1zZWNyZXQifX0seyJuYW1lIjoicm9vay1jZXBoLW9wZXJhdG9yLWNyZWRzIiwia2luZCI6IlNlY3JldCIsImRhdGEiOnsidXNlcklEIjoiY2xpZW50LmhlYWx0aGNoZWNrZXIiLCJ1c2VyS2V5IjoiYzJWamNtVjAifX0seyJuYW1lIjoibW9uaXRvcmluZy1lbmRwb2ludCIsImtpbmQiOiJDZXBoQ2x1c3RlciIsImRhdGEiOnsiTW9uaXRvcmluZ0VuZHBvaW50IjoiMS4yLjMuNCwxLjIuMy4zLDEuMi4zLjIiLCJNb25pdG9yaW5nUG9ydCI6IjkyODMifX0seyJuYW1lIjoiY2VwaC1yYmQiLCJraW5kIjoiU3RvcmFnZUNsYXNzIiwiZGF0YSI6eyJwb29sIjoib2RmX3Bvb2wifX0seyJuYW1lIjoicm9vay1jc2ktcmJkLW5vZGUiLCJraW5kIjoiU2VjcmV0IiwiZGF0YSI6eyJ1c2VySUQiOiJjc2ktcmJkLW5vZGUiLCJ1c2VyS2V5IjoiIn19LHsibmFtZSI6InJvb2stY3NpLXJiZC1wcm92aXNpb25lciIsImtpbmQiOiJTZWNyZXQiLCJkYXRhIjp7InVzZXJJRCI6ImNzaS1yYmQtcHJvdmlzaW9uZXIiLCJ1c2VyS2V5IjoiYzJWamNtVjAifX0seyJuYW1lIjoicm9vay1jc2ktY2VwaGZzLXByb3Zpc2lvbmVyIiwia2luZCI6IlNlY3JldCIsImRhdGEiOnsiYWRtaW5JRCI6ImNzaS1jZXBoZnMtcHJvdmlzaW9uZXIiLCJhZG1pbktleSI6IiJ9fSx7Im5hbWUiOiJyb29rLWNzaS1jZXBoZnMtbm9kZSIsImtpbmQiOiJTZWNyZXQiLCJkYXRhIjp7ImFkbWluSUQiOiJjc2ktY2VwaGZzLW5vZGUiLCJhZG1pbktleSI6ImMyVmpjbVYwIn19LHsibmFtZSI6ImNlcGhmcyIsImtpbmQiOiJTdG9yYWdlQ2xhc3MiLCJkYXRhIjp7ImZzTmFtZSI6ImNlcGhmcyIsInBvb2wiOiJtYW5pbGFfZGF0YSJ9fQ==02-ocs-external-storagecluster.yaml
# required
# count: 1
---
apiVersion: ocs.openshift.io/v1
kind: StorageCluster
metadata:
name: ocs-external-storagecluster
namespace: openshift-storage
spec:
externalStorage:
enable: true
labelSelector: {}
status:
phase: ReadyodfNS.yaml
# required: yes
# count: 1
---
apiVersion: v1
kind: Namespace
metadata:
name: openshift-storage
annotations:
workload.openshift.io/allowed: management
labels:
openshift.io/cluster-monitoring: "true"odfOperGroup.yaml
# required: yes
# count: 1
---
apiVersion: operators.coreos.com/v1
kind: OperatorGroup
metadata:
name: openshift-storage-operatorgroup
namespace: openshift-storage
spec:
targetNamespaces:
- openshift-storageodfSubscription.yaml
# required: yes
# count: 1
---
apiVersion: operators.coreos.com/v1alpha1
kind: Subscription
metadata:
name: odf-operator
namespace: openshift-storage
spec:
channel: "stable-4.14"
name: odf-operator
source: redhat-operators-disconnected
sourceNamespace: openshift-marketplace
installPlanApproval: Automatic
status:
state: AtLatestKnown3.3.4.7.3. Networking reference YAML
Network.yaml
# required
# count: 1
apiVersion: operator.openshift.io/v1
kind: Network
metadata:
name: cluster
spec:
defaultNetwork:
ovnKubernetesConfig:
gatewayConfig:
routingViaHost: true
# additional networks are optional and may alternatively be specified using NetworkAttachmentDefinition CRs
additionalNetworks: [$additionalNetworks]
# eg
#- name: add-net-1
# namespace: app-ns-1
# rawCNIConfig: '{ "cniVersion": "0.3.1", "name": "add-net-1", "plugins": [{"type": "macvlan", "master": "bond1", "ipam": {}}] }'
# type: Raw
#- name: add-net-2
# namespace: app-ns-1
# rawCNIConfig: '{ "cniVersion": "0.4.0", "name": "add-net-2", "plugins": [ {"type": "macvlan", "master": "bond1", "mode": "private" },{ "type": "tuning", "name": "tuning-arp" }] }'
# type: Raw
# Enable to use MultiNetworkPolicy CRs
useMultiNetworkPolicy: truenetworkAttachmentDefinition.yaml
# optional
# copies: 0-N
apiVersion: "k8s.cni.cncf.io/v1"
kind: NetworkAttachmentDefinition
metadata:
name: $name
namespace: $ns
spec:
nodeSelector:
kubernetes.io/hostname: $nodeName
config: $config
#eg
#config: '{
# "cniVersion": "0.3.1",
# "name": "external-169",
# "type": "vlan",
# "master": "ens8f0",
# "mode": "bridge",
# "vlanid": 169,
# "ipam": {
# "type": "static",
# }
#}'addr-pool.yaml
# required
# count: 1-N
apiVersion: metallb.io/v1beta1
kind: IPAddressPool
metadata:
name: $name # eg addresspool3
namespace: metallb-system
annotations:
metallb.universe.tf/address-pool: $name # eg addresspool3
spec:
##############
# Expected variation in this configuration
addresses: [$pools]
#- 3.3.3.0/24
autoAssign: true
##############bfd-profile.yaml
# required
# count: 1-N
apiVersion: metallb.io/v1beta1
kind: BFDProfile
metadata:
name: bfdprofile
namespace: metallb-system
spec:
################
# These values may vary. Recommended values are included as default
receiveInterval: 150 # default 300ms
transmitInterval: 150 # default 300ms
#echoInterval: 300 # default 50ms
detectMultiplier: 10 # default 3
echoMode: true
passiveMode: true
minimumTtl: 5 # default 254
#
################bgp-advr.yaml
# required
# count: 1-N
apiVersion: metallb.io/v1beta1
kind: BGPAdvertisement
metadata:
name: $name # eg bgpadvertisement-1
namespace: metallb-system
spec:
ipAddressPools: [$pool]
# eg:
# - addresspool3
peers: [$peers]
# eg:
# - peer-one
#
communities: [$communities]
# Note correlation with address pool, or Community
# eg:
# - bgpcommunity
# - 65535:65282
aggregationLength: 32
aggregationLengthV6: 128
localPref: 100bgp-peer.yaml
# required
# count: 1-N
apiVersion: metallb.io/v1beta2
kind: BGPPeer
metadata:
name: $name
namespace: metallb-system
spec:
peerAddress: $ip # eg 192.168.1.2
peerASN: $peerasn # eg 64501
myASN: $myasn # eg 64500
routerID: $id # eg 10.10.10.10
bfdProfile: bfdprofile
passwordSecret: {}community.yaml
---
apiVersion: metallb.io/v1beta1
kind: Community
metadata:
name: bgpcommunity
namespace: metallb-system
spec:
communities: [$comm]metallb.yaml
# required
# count: 1
apiVersion: metallb.io/v1beta1
kind: MetalLB
metadata:
name: metallb
namespace: metallb-system
spec:
nodeSelector:
node-role.kubernetes.io/worker: ""metallbNS.yaml
# required: yes
# count: 1
---
apiVersion: v1
kind: Namespace
metadata:
name: metallb-system
annotations:
workload.openshift.io/allowed: management
labels:
openshift.io/cluster-monitoring: "true"metallbOperGroup.yaml
# required: yes
# count: 1
---
apiVersion: operators.coreos.com/v1
kind: OperatorGroup
metadata:
name: metallb-operator
namespace: metallb-systemmetallbSubscription.yaml
# required: yes
# count: 1
---
apiVersion: operators.coreos.com/v1alpha1
kind: Subscription
metadata:
name: metallb-operator-sub
namespace: metallb-system
spec:
channel: stable
name: metallb-operator
source: redhat-operators-disconnected
sourceNamespace: openshift-marketplace
installPlanApproval: Automatic
status:
state: AtLatestKnownmc_rootless_pods_selinux.yaml
apiVersion: machineconfiguration.openshift.io/v1
kind: MachineConfig
metadata:
labels:
machineconfiguration.openshift.io/role: worker
name: 99-worker-setsebool
spec:
config:
ignition:
version: 3.2.0
systemd:
units:
- contents: |
[Unit]
Description=Set SELinux boolean for tap cni plugin
Before=kubelet.service
[Service]
Type=oneshot
ExecStart=/sbin/setsebool container_use_devices=on
RemainAfterExit=true
[Install]
WantedBy=multi-user.target graphical.target
enabled: true
name: setsebool.serviceNMState.yaml
apiVersion: nmstate.io/v1
kind: NMState
metadata:
name: nmstate
spec: {}NMStateNS.yaml
apiVersion: v1
kind: Namespace
metadata:
name: openshift-nmstate
annotations:
workload.openshift.io/allowed: managementNMStateOperGroup.yaml
apiVersion: operators.coreos.com/v1
kind: OperatorGroup
metadata:
name: openshift-nmstate
namespace: openshift-nmstate
spec:
targetNamespaces:
- openshift-nmstateNMStateSubscription.yaml
apiVersion: operators.coreos.com/v1alpha1
kind: Subscription
metadata:
name: kubernetes-nmstate-operator
namespace: openshift-nmstate
spec:
channel: "stable"
name: kubernetes-nmstate-operator
source: redhat-operators-disconnected
sourceNamespace: openshift-marketplace
installPlanApproval: Automatic
status:
state: AtLatestKnownsriovNetwork.yaml
# optional (though expected for all)
# count: 0-N
apiVersion: sriovnetwork.openshift.io/v1
kind: SriovNetwork
metadata:
name: $name # eg sriov-network-abcd
namespace: openshift-sriov-network-operator
spec:
capabilities: "$capabilities" # eg '{"mac": true, "ips": true}'
ipam: "$ipam" # eg '{ "type": "host-local", "subnet": "10.3.38.0/24" }'
networkNamespace: $nns # eg cni-test
resourceName: $resource # eg resourceTestsriovNetworkNodePolicy.yaml
# optional (though expected in all deployments)
# count: 0-N
apiVersion: sriovnetwork.openshift.io/v1
kind: SriovNetworkNodePolicy
metadata:
name: $name
namespace: openshift-sriov-network-operator
spec: {} # $spec
# eg
#deviceType: netdevice
#nicSelector:
# deviceID: "1593"
# pfNames:
# - ens8f0np0#0-9
# rootDevices:
# - 0000:d8:00.0
# vendor: "8086"
#nodeSelector:
# kubernetes.io/hostname: host.sample.lab
#numVfs: 20
#priority: 99
#excludeTopology: true
#resourceName: resourceNameABCDSriovOperatorConfig.yaml
# required
# count: 1
---
apiVersion: sriovnetwork.openshift.io/v1
kind: SriovOperatorConfig
metadata:
name: default
namespace: openshift-sriov-network-operator
spec:
configDaemonNodeSelector:
node-role.kubernetes.io/worker: ""
enableInjector: true
enableOperatorWebhook: true
disableDrain: false
logLevel: 2SriovSubscription.yaml
# required: yes
# count: 1
apiVersion: operators.coreos.com/v1alpha1
kind: Subscription
metadata:
name: sriov-network-operator-subscription
namespace: openshift-sriov-network-operator
spec:
channel: "stable"
name: sriov-network-operator
source: redhat-operators-disconnected
sourceNamespace: openshift-marketplace
installPlanApproval: Automatic
status:
state: AtLatestKnownSriovSubscriptionNS.yaml
# required: yes
# count: 1
apiVersion: v1
kind: Namespace
metadata:
name: openshift-sriov-network-operator
annotations:
workload.openshift.io/allowed: managementSriovSubscriptionOperGroup.yaml
# required: yes
# count: 1
apiVersion: operators.coreos.com/v1
kind: OperatorGroup
metadata:
name: sriov-network-operators
namespace: openshift-sriov-network-operator
spec:
targetNamespaces:
- openshift-sriov-network-operator3.3.4.7.4. Scheduling reference YAML
nrop.yaml
# Optional
# count: 1
apiVersion: nodetopology.openshift.io/v1
kind: NUMAResourcesOperator
metadata:
name: numaresourcesoperator
spec:
nodeGroups:
- config:
# Periodic is the default setting
infoRefreshMode: Periodic
machineConfigPoolSelector:
matchLabels:
# This label must match the pool(s) you want to run NUMA-aligned workloads
pools.operator.machineconfiguration.openshift.io/worker: ""NROPSubscription.yaml
# required
# count: 1
apiVersion: operators.coreos.com/v1alpha1
kind: Subscription
metadata:
name: numaresources-operator
namespace: openshift-numaresources
spec:
channel: "4.14"
name: numaresources-operator
source: redhat-operators-disconnected
sourceNamespace: openshift-marketplaceNROPSubscriptionNS.yaml
# required: yes
# count: 1
apiVersion: v1
kind: Namespace
metadata:
name: openshift-numaresources
annotations:
workload.openshift.io/allowed: managementNROPSubscriptionOperGroup.yaml
# required: yes
# count: 1
apiVersion: operators.coreos.com/v1
kind: OperatorGroup
metadata:
name: numaresources-operator
namespace: openshift-numaresources
spec:
targetNamespaces:
- openshift-numaresourcessched.yaml
# Optional
# count: 1
apiVersion: nodetopology.openshift.io/v1
kind: NUMAResourcesScheduler
metadata:
name: numaresourcesscheduler
spec:
#cacheResyncPeriod: "0"
# Image spec should be the latest for the release
imageSpec: "registry.redhat.io/openshift4/noderesourcetopology-scheduler-rhel9:v4.14.0"
#logLevel: "Trace"
schedulerName: topo-aware-schedulerScheduler.yaml
apiVersion: config.openshift.io/v1
kind: Scheduler
metadata:
name: cluster
spec:
# non-schedulable control plane is the default. This ensures
# compliance.
mastersSchedulable: false
policy:
name: ""3.3.4.7.5. Other reference YAML
control-plane-load-kernel-modules.yaml
# optional
# count: 1
apiVersion: machineconfiguration.openshift.io/v1
kind: MachineConfig
metadata:
labels:
machineconfiguration.openshift.io/role: master
name: 40-load-kernel-modules-control-plane
spec:
config:
# Release info found in https://github.com/coreos/butane/releases
ignition:
version: 3.2.0
storage:
files:
- contents:
source: data:,
mode: 420
overwrite: true
path: /etc/modprobe.d/kernel-blacklist.conf
- contents:
source: data:text/plain;charset=utf-8;base64,aXBfZ3JlCmlwNl90YWJsZXMKaXA2dF9SRUpFQ1QKaXA2dGFibGVfZmlsdGVyCmlwNnRhYmxlX21hbmdsZQppcHRhYmxlX2ZpbHRlcgppcHRhYmxlX21hbmdsZQppcHRhYmxlX25hdAp4dF9tdWx0aXBvcnQKeHRfb3duZXIKeHRfUkVESVJFQ1QKeHRfc3RhdGlzdGljCnh0X1RDUE1TUwo=
mode: 420
overwrite: true
path: /etc/modules-load.d/kernel-load.confsctp_module_mc.yaml
# optional
# count: 1
apiVersion: machineconfiguration.openshift.io/v1
kind: MachineConfig
metadata:
labels:
machineconfiguration.openshift.io/role: worker
name: load-sctp-module
spec:
config:
ignition:
version: 2.2.0
storage:
files:
- contents:
source: data:,
verification: {}
filesystem: root
mode: 420
path: /etc/modprobe.d/sctp-blacklist.conf
- contents:
source: data:text/plain;charset=utf-8;base64,c2N0cA==
filesystem: root
mode: 420
path: /etc/modules-load.d/sctp-load.confworker-load-kernel-modules.yaml
# optional
# count: 1
apiVersion: machineconfiguration.openshift.io/v1
kind: MachineConfig
metadata:
labels:
machineconfiguration.openshift.io/role: worker
name: 40-load-kernel-modules-worker
spec:
config:
# Release info found in https://github.com/coreos/butane/releases
ignition:
version: 3.2.0
storage:
files:
- contents:
source: data:,
mode: 420
overwrite: true
path: /etc/modprobe.d/kernel-blacklist.conf
- contents:
source: data:text/plain;charset=utf-8;base64,aXBfZ3JlCmlwNl90YWJsZXMKaXA2dF9SRUpFQ1QKaXA2dGFibGVfZmlsdGVyCmlwNnRhYmxlX21hbmdsZQppcHRhYmxlX2ZpbHRlcgppcHRhYmxlX21hbmdsZQppcHRhYmxlX25hdAp4dF9tdWx0aXBvcnQKeHRfb3duZXIKeHRfUkVESVJFQ1QKeHRfc3RhdGlzdGljCnh0X1RDUE1TUwo=
mode: 420
overwrite: true
path: /etc/modules-load.d/kernel-load.confClusterLogForwarder.yaml
# required
# count: 1
apiVersion: logging.openshift.io/v1
kind: ClusterLogForwarder
metadata:
name: instance
namespace: openshift-logging
spec:
outputs:
- type: "kafka"
name: kafka-open
url: tcp://10.11.12.13:9092/test
pipelines:
- inputRefs:
- infrastructure
#- application
- audit
labels:
label1: test1
label2: test2
label3: test3
label4: test4
label5: test5
name: all-to-default
outputRefs:
- kafka-openClusterLogging.yaml
# required
# count: 1
apiVersion: logging.openshift.io/v1
kind: ClusterLogging
metadata:
name: instance
namespace: openshift-logging
spec:
collection:
type: vector
managementState: ManagedClusterLogNS.yaml
---
apiVersion: v1
kind: Namespace
metadata:
name: openshift-logging
annotations:
workload.openshift.io/allowed: managementClusterLogOperGroup.yaml
---
apiVersion: operators.coreos.com/v1
kind: OperatorGroup
metadata:
name: cluster-logging
namespace: openshift-logging
spec:
targetNamespaces:
- openshift-loggingClusterLogSubscription.yaml
apiVersion: operators.coreos.com/v1alpha1
kind: Subscription
metadata:
name: cluster-logging
namespace: openshift-logging
spec:
channel: "stable"
name: cluster-logging
source: redhat-operators-disconnected
sourceNamespace: openshift-marketplace
installPlanApproval: Automatic
status:
state: AtLatestKnowncatalog-source.yaml
# required
# count: 1..N
apiVersion: operators.coreos.com/v1alpha1
kind: CatalogSource
metadata:
name: redhat-operators-disconnected
namespace: openshift-marketplace
spec:
displayName: Red Hat Disconnected Operators Catalog
image: $imageUrl
publisher: Red Hat
sourceType: grpc
# updateStrategy:
# registryPoll:
# interval: 1h
status:
connectionState:
lastObservedState: READYicsp.yaml
# required
# count: 1
apiVersion: operator.openshift.io/v1alpha1
kind: ImageContentSourcePolicy
metadata:
name: disconnected-internal-icsp
spec:
repositoryDigestMirrors: []
# - $mirrorsoperator-hub.yaml
# required
# count: 1
apiVersion: config.openshift.io/v1
kind: OperatorHub
metadata:
name: cluster
spec:
disableAllDefaultSources: truemonitoring-config-cm.yaml
# optional
# count: 1
---
apiVersion: v1
kind: ConfigMap
metadata:
name: cluster-monitoring-config
namespace: openshift-monitoring
data:
config.yaml: |
prometheusK8s:
retention: 15d
volumeClaimTemplate:
spec:
storageClassName: ocs-external-storagecluster-ceph-rbd
resources:
requests:
storage: 100Gi
alertmanagerMain:
volumeClaimTemplate:
spec:
storageClassName: ocs-external-storagecluster-ceph-rbd
resources:
requests:
storage: 20GiPerformanceProfile.yaml
# required
# count: 1
apiVersion: performance.openshift.io/v2
kind: PerformanceProfile
metadata:
name: $name
annotations:
# Some pods want the kernel stack to ignore IPv6 router Advertisement.
kubeletconfig.experimental: |
{"allowedUnsafeSysctls":["net.ipv6.conf.all.accept_ra"]}
spec:
cpu:
# node0 CPUs: 0-17,36-53
# node1 CPUs: 18-34,54-71
# siblings: (0,36), (1,37)...
# we want to reserve the first Core of each NUMA socket
#
# no CPU left behind! all-cpus == isolated + reserved
isolated: $isolated # eg 1-17,19-35,37-53,55-71
reserved: $reserved # eg 0,18,36,54
# Guaranteed QoS pods will disable IRQ balancing for cores allocated to the pod.
# default value of globallyDisableIrqLoadBalancing is false
globallyDisableIrqLoadBalancing: false
hugepages:
defaultHugepagesSize: 1G
pages:
# 32GB per numa node
- count: $count # eg 64
size: 1G
machineConfigPoolSelector:
# For SNO: machineconfiguration.openshift.io/role: 'master'
pools.operator.machineconfiguration.openshift.io/worker: ''
nodeSelector:
# For SNO: node-role.kubernetes.io/master: ""
node-role.kubernetes.io/worker: ""
workloadHints:
realTime: false
highPowerConsumption: false
perPodPowerManagement: true
realTimeKernel:
enabled: false
numa:
# All guaranteed QoS containers get resources from a single NUMA node
topologyPolicy: "single-numa-node"
net:
userLevelNetworking: false3.3.5. Telco core reference configuration software specifications
The following information describes the telco core reference design specification (RDS) validated software versions.
3.3.5.1. Software stack
The following software versions were used for validating the telco core reference design specification:
| Component | Software version |
|---|---|
| Cluster Logging Operator | 6.0 |
| OpenShift Data Foundation | 4.16 |
| SR-IOV Operator | 4.16 |
| MetalLB | 4.16 |
| NMState Operator | 4.16 |
| NUMA-aware scheduler | 4.16 |
Chapter 4. Planning your environment according to object maximums
To ensure your cluster meets performance and scalability requirements, plan your environment according to tested object maximums. By reviewing these limits, you can design a OpenShift Container Platform deployment that operates reliably within supported boundaries.
The example guidelines are based on the largest possible cluster. For smaller clusters, the maximums are lower. There are many factors that influence the stated thresholds, including the etcd version or storage data format. In most cases, exceeding these numbers results in lower overall performance but might not cause your cluster to fail.
Clusters that experience rapid change, such as those with many starting and stopping pods, can have a lower practical maximum size than documented.
4.1. OpenShift Container Platform tested cluster maximums for major releases
To ensure your deployment remains supported, plan your cluster configuration by using tested cluster maximums. OpenShift Container Platform validates these specific limits for major releases rather than theoretical absolute cluster maximums, ensuring stability for your environment.
Red Hat does not provide direct guidance on sizing your OpenShift Container Platform cluster. This is because determining whether your cluster is within the supported bounds of OpenShift Container Platform requires careful consideration of all the multidimensional factors that limit the cluster scale.
OpenShift Container Platform supports tested cluster maximums rather than absolute cluster maximums. Not every combination of OpenShift Container Platform version, control plane workload, and network plugin are tested, so the following table does not represent an absolute expectation of scale for all deployments. Scaling to a maximum on all dimensions simultaneously might not be possible. The table contains tested maximums for specific workloads and deployments, and serves as a scale guide as to what can be expected with similar deployments.
| Maximum type | 4.x tested maximum | Notes |
|---|---|---|
| Number of nodes | 2,000 | Pause pods were deployed to stress the control plane components of OpenShift Container Platform at 2000 node scale. The ability to scale to similar numbers will vary depending upon specific deployment and workload parameters. |
| Number of pods | 150,000 | The pod count displayed here is the number of test pods. The actual number of pods depends on the application’s memory, CPU, and storage requirements. |
| Number of pods per node | 2,500 |
This was tested on a cluster with 31 servers: 3 control planes, 2 infrastructure nodes, and 26 compute nodes. If you need 2,500 user pods, you need both a |
| Number of namespaces | 10,000 | When there are a large number of active projects, etcd might suffer from poor performance if the keyspace grows excessively large and exceeds the space quota. Periodic maintenance of etcd, including defragmentation, is highly recommended to free etcd storage. |
| Number of builds | 10,000 (Default pod RAM 512 Mi) - Source-to-Image (S2I) build strategy | - |
| Number of pods per namespace | 25,000 | There are several control loops in the system that must iterate over all objects in a given namespace as a reaction to some changes in state. Having a large number of objects of a given type in a single namespace can make those loops expensive and slow down processing given state changes. The limit assumes that the system has enough CPU, memory, and disk to satisfy the application requirements. |
| Number of routes and back ends per Ingress Controller | 2,000 per router | - |
| Number of secrets | 80,000 | - |
| Number of config maps | 90,000 | - |
| Number of services | 10,000 |
Each service port and each service back-end has a corresponding entry in |
| Number of services per namespace | 5,000 | - |
| Number of back-ends per service | 5,000 | - |
| Number of deployments per namespace | 2,000 | - |
| Number of build configs | 12,000 | - |
| Number of custom resource definitions (CRD) | 1,024 |
Tested on a cluster with 29 servers: 3 control planes, 2 infrastructure nodes, and 24 compute nodes. The cluster had 500 namespaces. OpenShift Container Platform has a limit of 1,024 total custom resource definitions (CRD), including those installed by OpenShift Container Platform, products integrating with OpenShift Container Platform, and user-created CRDs. If there are more than 1,024 CRDs created, then there is a possibility that |
- Example scenario
As an example, 500 compute nodes (m5.2xl) were tested, and are supported, by using OpenShift Container Platform 4.16, the OVN-Kubernetes network plugin, and the following workload objects:
- 200 namespaces, in addition to the defaults
- 60 pods per node; 30 server and 30 client pods (30k total)
- 57 image streams/ns (11.4k total)
- 15 services/ns backed by the server pods (3k total)
- 15 routes/ns backed by the previous services (3k total)
- 20 secrets/ns (4k total)
- 10 config maps/ns (2k total)
- 6 network policies/ns, including deny-all, allow-from ingress and intra-namespace rules
- 57 builds/ns
The following factors are known to affect cluster workload scaling, positively or negatively, and should be factored into the scale numbers when planning a deployment. For additional information and guidance, contact your sales representative or Red Hat support.
- Number of pods per node
- Number of containers per pod
- Type of probes used (for example, liveness/readiness, exec/http)
- Number of network policies
- Number of projects, or namespaces
- Number of image streams per project
- Number of builds per project
- Number of services/endpoints and type
- Number of routes
- Number of shards
- Number of secrets
- Number of config maps
Rate of API calls, or the cluster “churn”, which is an estimation of how quickly things change in the cluster configuration.
-
Prometheus query for pod creation requests per second over 5 minute windows:
sum(irate(apiserver_request_count{resource="pods",verb="POST"}[5m])) -
Prometheus query for all API requests per second over 5 minute windows:
sum(irate(apiserver_request_count{}[5m]))
-
Prometheus query for pod creation requests per second over 5 minute windows:
- Cluster node resource consumption of CPU
- Cluster node resource consumption of memory
4.2. OpenShift Container Platform environment and configuration on which the cluster maximums are tested
To validate your deployment limits, review the environment and configuration details for the cloud platforms on which OpenShift Container Platform cluster maximums are tested. This reference ensures your infrastructure aligns with the specific scenarios used to validate scalability limits.
4.2.1. AWS cloud platform cluster maximums
| Node | Flavor | vCPU | RAM (GiB) | Disk type | Disk size (GiB) or IOS | Count | Region |
|---|---|---|---|---|---|---|---|
| Control plane/etcd | r5.4xlarge | 16 | 128 | gp3 | 220 | 3 | us-west-2 |
| Infra | m5.12xlarge | 48 | 192 | gp3 | 100 | 3 | us-west-2 |
| Workload | m5.4xlarge | 16 | 64 | gp3 | 500 | 1 | us-west-2 |
| Compute | m5.2xlarge | 8 | 32 | gp3 | 100 | 3/25/250/500 | us-west-2 |
where:
- Control plane/etcd
- Control plane/etcd nodes use gp3 disks with a baseline performance of 3000 IOPS and 125 MiB per second because etcd is latency sensitive. The gp3 volumes do not use burst performance.
- Infra
- Infra nodes are used to host Monitoring, Ingress, and Registry components to ensure they have enough resources to run at large scale.
- Workload
The workload node is dedicated to run performance and scalability workload generators.
Using a larger disk size of 500 GiB ensures that there is enough space to store the large amounts of data that is collected during the performance and scalability test run.
- Compute
- The cluster is scaled in iterations of 3, 25, 250, and 500 compute nodes. Performance and scalability tests are executed at the specified node counts.
4.2.2. IBM Power platform cluster maximums
| Node | vCPU | RAM (GiB) | Disk type | Disk size (GiB) or IOS | Count |
|---|---|---|---|---|---|
| Control plane/etcd | 16 | 32 | io1 | 120 / 10 IOPS per GiB | 3 |
| Infra | 16 | 64 | gp2 | 120 | 2 |
| Workload | 16 | 256 | gp2 | 120 | 1 |
| Compute | 16 | 64 | gp2 | 120 | 2 to 100 |
where:
- Control plane/etcd
- io1 disks with 120 / 10 IOPS per GiB are used for control plane/etcd nodes as etcd is I/O intensive and latency sensitive.
- Infra
- Infra nodes are used to host Monitoring, Ingress, and Registry components to ensure they have enough resources to run at large scale.
- Workload
- Workload node is dedicated to run performance and scalability workload generators.
- Workload.120
- Larger disk size is used so that there is enough space to store the large amounts of data that is collected during the performance and scalability test run.
- Compute.2 to 100
- Cluster is scaled in iterations.
4.2.3. IBM Z platform cluster maximums
| Node | vCPU | RAM (GiB) | Disk type | Disk size (GiB) or IOS | Count |
|---|---|---|---|---|---|
| Control plane/etcd | 8 | 32 | ds8k | 300 / LCU 1 | 3 |
| Compute | 8 | 32 | ds8k | 150 / LCU 2 | 4 nodes (scaled to 100/250/500 pods per node) |
where:
- Control plane/etcd
- Nodes are distributed between two logical control units (LCUs) to optimize disk I/O load of the control plane/etcd nodes as etcd is I/O intensive and latency sensitive. Etcd I/O demand should not interfere with other workloads. Four compute nodes are used for the tests running several iterations with 100/250/500 pods at the same time. First, idling pods were used to evaluate if pods can be instanced. Next, a network and CPU demanding client/server workload were used to evaluate the stability of the system under stress. Client and server pods were pairwise deployed and each pair was spread over two compute nodes.
- Compute
- No separate workload node was used. The workload simulates a microservice workload between two compute nodes.
- vCPU
- Physical number of processors used is six Integrated Facilities for Linux (IFLs).
- RAM (GiB)
- Total physical memory used is 512 GiB.
4.3. How to plan your environment according to tested cluster maximums
To ensure your infrastructure meets operational requirements, plan your OpenShift Container Platform environment according to tested cluster maximums. Designing your cluster within these validated limits ensures that you can maintain stability and ensures your deployment remains supported
Oversubscribing the physical resources on a node affects resource guarantees the Kubernetes scheduler makes during pod placement. Learn what measures you can take to avoid memory swapping.
Some of the tested maximums are stretched only in a single dimension. They will vary when many objects are running on the cluster.
The numbers noted in this documentation are based on Red Hat’s test methodology, setup, configuration, and tunings. These numbers can vary based on your own individual setup and environments.
While planning your environment, determine how many pods are expected to fit per node by using the following formula:
required pods per cluster / pods per node = total number of nodes neededThe default maximum number of pods per node is 250. However, the number of pods that fit on a node is dependent on the application itself. Consider the application’s memory, CPU, and storage requirements, as described in "How to plan your environment according to application requirements".
- Example scenario
If you want to scope your cluster for 2200 pods per cluster, you would need at least five nodes, assuming that there are 500 maximum pods per node. The following formula shows the calculation:
2200 / 500 = 4.4If you increase the number of nodes to 20, then the pod distribution changes to 110 pods per node. The following formula shows the calculation:
2200 / 20 = 110Where:
required pods per cluster / total number of nodes = expected pods per nodeOpenShift Container Platform includes several system pods, such as OVN-Kubernetes, DNS, Operators, and others, which run across every compute node by default. Therefore, the result of the above formula can vary.
4.4. How to plan your environment according to application requirements
To ensure your infrastructure handles workload demands efficiently, plan your environment according to application requirements. By planning in this way, you can determine the necessary compute, storage, and networking resources to maintain performance and stability.
Consider an example application environment:
| Pod type | Pod quantity | Max memory | CPU cores | Persistent storage |
|---|---|---|---|---|
| apache | 100 | 500 MB | 0.5 | 1 GB |
| node.js | 200 | 1 GB | 1 | 1 GB |
| postgresql | 100 | 1 GB | 2 | 10 GB |
| JBoss EAP | 100 | 1 GB | 1 | 1 GB |
Extrapolated requirements: 550 CPU cores, 450GB RAM, and 1.4TB storage.
Instance size for nodes can be modulated up or down, depending on your preference. Nodes are often resource overcommitted. In this deployment scenario, you can choose to run additional smaller nodes or fewer larger nodes to provide the same amount of resources. Factors such as operational agility and cost-per-instance should be considered.
| Node type | Quantity | CPUs | RAM (GB) |
|---|---|---|---|
| Nodes (option 1) | 100 | 4 | 16 |
| Nodes (option 2) | 50 | 8 | 32 |
| Nodes (option 3) | 25 | 16 | 64 |
Some applications lend themselves well to overcommitted environments, and some do not. Most Java applications and applications that use huge pages are examples of applications that would not allow for overcommitment. That memory can not be used for other applications. In the example above, the environment would be roughly 30 percent overcommitted, a common ratio.
The application pods can access a service either by using environment variables or DNS. If using environment variables, for each active service the variables are injected by the kubelet when a pod is run on a node. A cluster-aware DNS server watches the Kubernetes API for new services and creates a set of DNS records for each one.
If DNS is enabled throughout your cluster, then all pods should automatically be able to resolve services by their DNS name. Service discovery using DNS can be used in case you must go beyond 5000 services. When using environment variables for service discovery, the argument list exceeds the allowed length after 5000 services in a namespace, then the pods and deployments will start failing. Disable the service links in the deployment’s service specification file to overcome this:
apiVersion: template.openshift.io/v1
kind: Template
metadata:
name: deployment-config-template
creationTimestamp:
annotations:
description: This template will create a deploymentConfig with 1 replica, 4 env vars and a service.
tags: ''
objects:
- apiVersion: apps.openshift.io/v1
kind: DeploymentConfig
metadata:
name: deploymentconfig${IDENTIFIER}
spec:
template:
metadata:
labels:
name: replicationcontroller${IDENTIFIER}
spec:
enableServiceLinks: false
containers:
- name: pause${IDENTIFIER}
image: "${IMAGE}"
ports:
- containerPort: 8080
protocol: TCP
env:
- name: ENVVAR1_${IDENTIFIER}
value: "${ENV_VALUE}"
- name: ENVVAR2_${IDENTIFIER}
value: "${ENV_VALUE}"
- name: ENVVAR3_${IDENTIFIER}
value: "${ENV_VALUE}"
- name: ENVVAR4_${IDENTIFIER}
value: "${ENV_VALUE}"
resources: {}
imagePullPolicy: IfNotPresent
capabilities: {}
securityContext:
capabilities: {}
privileged: false
restartPolicy: Always
serviceAccount: ''
replicas: 1
selector:
name: replicationcontroller${IDENTIFIER}
triggers:
- type: ConfigChange
strategy:
type: Rolling
- apiVersion: v1
kind: Service
metadata:
name: service${IDENTIFIER}
spec:
selector:
name: replicationcontroller${IDENTIFIER}
ports:
- name: serviceport${IDENTIFIER}
protocol: TCP
port: 80
targetPort: 8080
clusterIP: ''
type: ClusterIP
sessionAffinity: None
status:
loadBalancer: {}
parameters:
- name: IDENTIFIER
description: Number to append to the name of resources
value: '1'
required: true
- name: IMAGE
description: Image to use for deploymentConfig
value: gcr.io/google-containers/pause-amd64:3.0
required: false
- name: ENV_VALUE
description: Value to use for environment variables
generate: expression
from: "[A-Za-z0-9]{255}"
required: false
labels:
template: deployment-config-template
The number of application pods that can run in a namespace is dependent on the number of services and the length of the service name when the environment variables are used for service discovery. ARG_MAX on the system defines the maximum argument length for a new process and the variable is set to 2097152 bytes (2 MiB) by default. The Kubelet injects environment variables in to each pod scheduled to run in the namespace including the following variables:
-
<SERVICE_NAME>_SERVICE_HOST=<IP> -
<SERVICE_NAME>_SERVICE_PORT=<PORT> -
<SERVICE_NAME>_PORT=tcp://<IP>:<PORT> -
<SERVICE_NAME>_PORT_<PORT>_TCP=tcp://<IP>:<PORT> -
<SERVICE_NAME>_PORT_<PORT>_TCP_PROTO=tcp -
<SERVICE_NAME>_PORT_<PORT>_TCP_PORT=<PORT> -
<SERVICE_NAME>_PORT_<PORT>_TCP_ADDR=<ADDR>
The pods in the namespace will start to fail if the argument length exceeds the allowed value and the number of characters in a service name impacts it. For example, in a namespace with 5000 services, the limit on the service name is 33 characters, which enables you to run 5000 pods in the namespace.
Chapter 5. Using quotas and limit ranges
As a cluster administrator, you can use quotas and limit ranges to set constraints. These constraints limit the number of objects or the amount of compute resources that are used in your project.
By using quotes and limits, you can better manage and allocate resources across all projects. You can also ensure that no projects use more resources than is appropriate for the cluster size.
A resource quota, defined by a ResourceQuota object, provides constraints that limit aggregate resource consumption per project. The quota can limit the quantity of objects that can be created in a project by type. Additinally, the quota can limit the total amount of compute resources and storage that might be consumed by resources in that project.
Quotas are set by cluster administrators and are scoped to a given project. OpenShift Container Platform project owners can change quotas for their project, but not limit ranges. OpenShift Container Platform users cannot modify quotas or limit ranges.
5.1. Resources managed by quota
To limit aggregate resource consumption per project, define a ResourceQuota object. By using this object, you can restrict the number of created objects by type. You can also restrict the total amount of compute resources and storage consumed within the project.
The following tables describe the set of compute resources and object types that a quota might manage.
A pod is in a terminal state if status.phase is Failed or Succeeded.
| Resource Name | Description |
|---|---|
|
|
The sum of CPU requests across all pods in a non-terminal state cannot exceed this value. |
|
|
The sum of memory requests across all pods in a non-terminal state cannot exceed this value. |
|
|
The sum of local ephemeral storage requests across all pods in a non-terminal state cannot exceed this value. |
|
|
The sum of CPU requests across all pods in a non-terminal state cannot exceed this value. |
|
|
The sum of memory requests across all pods in a non-terminal state cannot exceed this value. |
|
|
The sum of ephemeral storage requests across all pods in a non-terminal state cannot exceed this value. |
|
| The sum of CPU limits across all pods in a non-terminal state cannot exceed this value. |
|
| The sum of memory limits across all pods in a non-terminal state cannot exceed this value. |
|
| The sum of ephemeral storage limits across all pods in a non-terminal state cannot exceed this value. This resource is available only if you enabled the ephemeral storage technology preview. This feature is disabled by default. |
| Resource Name | Description |
|---|---|
|
| The sum of storage requests across all persistent volume claims in any state cannot exceed this value. |
|
| The total number of persistent volume claims that can exist in the project. |
|
| The sum of storage requests across all persistent volume claims in any state that have a matching storage class, cannot exceed this value. |
|
| The total number of persistent volume claims with a matching storage class that can exist in the project. |
| Resource Name | Description |
|---|---|
|
| The total number of pods in a non-terminal state that can exist in the project. |
|
| The total number of replication controllers that can exist in the project. |
|
| The total number of resource quotas that can exist in the project. |
|
| The total number of services that can exist in the project. |
|
| The total number of secrets that can exist in the project. |
|
|
The total number of |
|
| The total number of persistent volume claims that can exist in the project. |
|
| The total number of image streams that can exist in the project. |
You can configure an object count quota for these standard namespaced resource types using the count/<resource>.<group> syntax.
$ oc create quota <name> --hard=count/<resource>.<group>=<quota>where:
<resource>- Specifies the name of the resource.
<group>-
Specifies the API group, if applicable. You can use the
kubectl api-resourcescommand for a list of resources and their associated API groups.
5.2. Setting resource quota for extended resources
To manage the consumption of extended resources, such as nvidia.com/gpu, define a resource quota by using the requests prefix. Since overcommitment is prohibited for these resources, you must explicitly specify both requests and limits to ensure valid configuration.
Procedure
To determine how many GPUs are available on a node in your cluster, use the following command:
$ oc describe node ip-172-31-27-209.us-west-2.compute.internal | egrep 'Capacity|Allocatable|gpu'Example output
openshift.com/gpu-accelerator=true Capacity: nvidia.com/gpu: 2 Allocatable: nvidia.com/gpu: 2 nvidia.com/gpu: 0 0In this example, 2 GPUs are available.
Use this command to set a quota in the namespace
nvidia. In this example, the quota is1:$ cat gpu-quota.yamlExample output
apiVersion: v1 kind: ResourceQuota metadata: name: gpu-quota namespace: nvidia spec: hard: requests.nvidia.com/gpu: 1Create the quota with the following command:
$ oc create -f gpu-quota.yamlExample output
resourcequota/gpu-quota createdVerify that the namespace has the correct quota set using the following command:
$ oc describe quota gpu-quota -n nvidiaExample output
Name: gpu-quota Namespace: nvidia Resource Used Hard -------- ---- ---- requests.nvidia.com/gpu 0 1Run a pod that asks for a single GPU with the following command:
$ oc create pod gpu-pod.yamlExample output
apiVersion: v1 kind: Pod metadata: generateName: gpu-pod-s46h7 namespace: nvidia spec: restartPolicy: OnFailure containers: - name: rhel7-gpu-pod image: rhel7 env: - name: NVIDIA_VISIBLE_DEVICES value: all - name: NVIDIA_DRIVER_CAPABILITIES value: "compute,utility" - name: NVIDIA_REQUIRE_CUDA value: "cuda>=5.0" command: ["sleep"] args: ["infinity"] resources: limits: nvidia.com/gpu: 1Verify that the pod is running with the following command:
$ oc get podsExample output
NAME READY STATUS RESTARTS AGE gpu-pod-s46h7 1/1 Running 0 1mVerify that the quota
Usedcounter is correct by running the following command:$ oc describe quota gpu-quota -n nvidiaExample output
Name: gpu-quota Namespace: nvidia Resource Used Hard -------- ---- ---- requests.nvidia.com/gpu 1 1Using the following command, attempt to create a second GPU pod in the
nvidianamespace. This is technically available on the node because it has 2 GPUs:$ oc create -f gpu-pod.yamlExample output
Error from server (Forbidden): error when creating "gpu-pod.yaml": pods "gpu-pod-f7z2w" is forbidden: exceeded quota: gpu-quota, requested: requests.nvidia.com/gpu=1, used: requests.nvidia.com/gpu=1, limited: requests.nvidia.com/gpu=1You receive this
Forbiddenerror message because you have a quota of 1 GPU and the pod tried to allocate a second GPU, which exceeds the allowed quota.
5.3. Quota scopes
To restrict the set of resources that a quota applies to, add associated scopes. This configuration limits usage measurement to the intersection of the enumerated scopes, ensuring that specifying a resource outside the allowed set results in a validation error.
| Scope | Description |
|---|---|
|
|
Match pods where |
|
|
Match pods where |
|
|
Match pods that have best effort quality of service for either |
|
|
Match pods that do not have best effort quality of service for |
A BestEffort scope restricts a quota to limiting the following resources:
- pods
A Terminating, NotTerminating, and NotBestEffort scope restricts a quota to tracking the following resources:
-
pods -
memory -
requests.memory -
limits.memory -
cpu -
requests.cpu -
limits.cpu -
ephemeral-storage -
requests.ephemeral-storage -
limits.ephemeral-storage
Ephemeral storage requests and limits apply only if you enabled the ephemeral storage technology preview. This feature is disabled by default.
5.5. Admin quota usage
To ensure projects remain within defined constraints, monitor admin quota usage. By tracking the aggregate consumption of compute resources and storage, you can identify when ResourceQuota limits are reached or approached.
- Quota enforcement
After a resource quota for a project is first created, the project restricts the ability to create any new resources that can violate a quota constraint until the quota has calculated updated usage statistics.
After a quota is created and usage statistics are updated, the project accepts the creation of new content. When you create or modify resources, your quota usage is incremented immediately upon the request to create or modify the resource.
When you delete a resource, your quota use is decremented during the next full recalculation of quota statistics for the project.
A configurable amount of time determines how long the quota takes to reduce quota usage statistics to their current observed system value.
If project modifications exceed a quota usage limit, the server denies the action and returns an appropriate error message to the user. The error message explains the quota constraint violated and what their currently observed usage statistics are in the system.
- Requests compared to limits
When allocating compute resources by quota, each container can specify a request and a limit value each for CPU, memory, and ephemeral storage. Quotas can restrict any of these values.
If the quota has a value specified for
requests.cpuorrequests.memory, then the quota requires that every incoming container makes an explicit request for those resources. If the quota has a value specified forlimits.cpuorlimits.memory, the quota requires that every incoming container specify an explicit limit for those resources.
5.5.1. Sample resource quota definitions
To properly structure your quota configurations, reference these sample ResourceQuota definitions. These YAML examples demonstrate how to specify hard limits for compute resources, storage, and object counts to ensure your project complies with cluster policies.
Example core-object-counts.yaml
apiVersion: v1
kind: ResourceQuota
metadata:
name: core-object-counts
spec:
hard:
configmaps: "10"
persistentvolumeclaims: "4"
replicationcontrollers: "20"
secrets: "10"
services: "10"
# ...where:
configmaps-
Specifies the total number of
ConfigMapobjects that can exist in the project. persistentvolumeclaims- Specifies the total number of persistent volume claims (PVCs) that can exist in the project.
replicationcontrollers- Specifies the total number of replication controllers that can exist in the project.
secrets- Specifies the total number of secrets that can exist in the project.
services- Specifies the total number of services that can exist in the project.
Example openshift-object-counts.yaml
apiVersion: v1
kind: ResourceQuota
metadata:
name: openshift-object-counts
spec:
hard:
openshift.io/imagestreams: "10"
# ...where:
openshift.io/imagestreams- Specifies the total number of image streams that can exist in the project.
Example compute-resources.yaml
apiVersion: v1
kind: ResourceQuota
metadata:
name: compute-resources
spec:
hard:
pods: "4"
requests.cpu: "1"
requests.memory: 1Gi
requests.ephemeral-storage: 2Gi
limits.cpu: "2"
limits.memory: 2Gi
limits.ephemeral-storage: 4Gi
# ...where:
pods- Specifies the total number of pods in a non-terminal state that can exist in the project.
requests.cpu- Specifies that across all pods in a non-terminal state, the sum of CPU requests cannot exceed 1 core.
requests.memory- Specifies that across all pods in a non-terminal state, the sum of memory requests cannot exceed 1 Gi.
requests.ephemeral-storage- Specifies that across all pods in a non-terminal state, the sum of ephemeral storage requests cannot exceed 2 Gi.
limits.cpu- Specifies that across all pods in a non-terminal state, the sum of CPU limits cannot exceed 2 cores.
limits.memory- Specifies that across all pods in a non-terminal state, the sum of memory limits cannot exceed 2 Gi.
limits.ephemeral-storage- Specifies that across all pods in a non-terminal state, the sum of ephemeral storage limits cannot exceed 4 Gi.
Example besteffort.yaml
apiVersion: v1
kind: ResourceQuota
metadata:
name: besteffort
spec:
hard:
pods: "1"
scopes:
- BestEffort
# ...where:
pods-
Specifies the total number of pods in a non-terminal state with
BestEffortquality of service that can exist in the project. scopes-
Specifies a restriction on the quota to only match pods that have
BestEffortquality of service for either memory or CPU.
Example compute-resources-long-running.yaml
apiVersion: v1
kind: ResourceQuota
metadata:
name: compute-resources-long-running
spec:
hard:
pods: "4"
limits.cpu: "4"
limits.memory: "2Gi"
limits.ephemeral-storage: "4Gi"
scopes:
- NotTerminating
# ...where:
pods- Specifies the total number of pods in a non-terminal state.
limits.cpu- Specifies that across all pods in a non-terminal state, the sum of CPU limits cannot exceed this value.
limits.memory- Specifies that across all pods in a non-terminal state, the sum of memory limits cannot exceed this value.
limits.ephemeral-storage- Specifies that across all pods in a non-terminal state, the sum of ephemeral storage limits cannot exceed this value.
scopes-
Specifies a restriction on the quota that only matches pods where
spec.activeDeadlineSecondsis set tonil. Build pods fall underNotTerminatingunless theRestartNeverpolicy is applied.
Example compute-resources-time-bound.yaml
apiVersion: v1
kind: ResourceQuota
metadata:
name: compute-resources-time-bound
spec:
hard:
pods: "2"
limits.cpu: "1"
limits.memory: "1Gi"
limits.ephemeral-storage: "1Gi"
scopes:
- Terminating
# ...where:
pods- Specifies the total number of pods in a non-terminal state.
limits.cpu- Specifies that across all pods in a non-terminal state, the sum of CPU limits cannot exceed this value.
limits.memory- Specifies that across all pods in a non-terminal state, the sum of memory limits cannot exceed this value.
limits.ephemeral-storage- Specifies that across all pods in a non-terminal state, the sum of ephemeral storage limits cannot exceed this value.
scopes-
Specifies a restriction on the quota that only matches pods where
spec.activeDeadlineSeconds>=0. For example, this quota would charge for build pods, but not long running pods such as a web server or database.
Example storage-consumption.yaml
apiVersion: v1
kind: ResourceQuota
metadata:
name: storage-consumption
spec:
hard:
persistentvolumeclaims: "10"
requests.storage: "50Gi"
gold.storageclass.storage.k8s.io/requests.storage: "10Gi"
silver.storageclass.storage.k8s.io/requests.storage: "20Gi"
silver.storageclass.storage.k8s.io/persistentvolumeclaims: "5"
bronze.storageclass.storage.k8s.io/requests.storage: "0"
bronze.storageclass.storage.k8s.io/persistentvolumeclaims: "0"
# ...where:
persistentvolumeclaims- Specifies the total number of PVCs in a project.
requests.storage- Specifies that across all PVCs in a project, the sum of storage requested cannot exceed this value.
gold.storageclass.storage.k8s.io/requests.storage- Specifies that across all PVCs in a project, the sum of storage requested in the gold storage class cannot exceed this value.
silver.storageclass.storage.k8s.io/requests.storage- Specifies that across all PVCs in a project, the sum of storage requested in the silver storage class cannot exceed this value.
silver.storageclass.storage.k8s.io/persistentvolumeclaims- Specifies that across PVCs in a project, the total number of claims in the silver storage class cannot exceed this value.
bronze.storageclass.storage.k8s.io/requests.storage-
Specifies that across all PVCs in a project, the sum of storage requested in the bronze storage class cannot exceed this value. When this is set to
0, the bronze storage class cannot request storage. bronze.storageclass.storage.k8s.io/persistentvolumeclaims-
Specifies that across all PVCs in a project, the sum of storage requested in the bronze storage class cannot exceed this value. When this is set to
0, the bronze storage class cannot create claims.
5.5.2. Creating a quota
To create a quota, define a ResourceQuota object in a file and apply the file to a project. By doing this task, you can restrict aggregate resource consumption and object counts within the project to ensure the project complies with cluster policies.
Procedure
To apply resource constraints to a specific project, create a
ResourceQuotaobject by using the OpenShift CLI (oc). Run the followingoc createcommand with your definition file to enforce the limits on aggregate resource consumption and object counts specified for that namespace:$ oc create -f <resource_quota_definition> [-n <project_name>]Example command to create a ResourceQuota object
$ oc create -f core-object-counts.yaml -n demoproject
5.5.3. Creating object count quotas
To manage the consumption of standard namespaced resource types, create an object count quota. By creating an object count quota within a OpenShift Container Platform project, you can set defined limits on the number of objects, such as BuildConfig and DeploymentConfig objects.
When you use a resource quota, OpenShift Container Platform charges an object against the quota if the object exists in server storage. These quotas protect against exhaustion of storage resources.
Procedure
To configure an object count quota for a resource, run the following command:
$ oc create quota <name> --hard=count/<resource>.<group>=<quota>,count/<resource>.<group>=<quota>Example showing object count quota
$ oc create quota test --hard=count/deployments.extensions=2,count/replicasets.extensions=4,count/pods=3,count/secrets=4 resourcequota "test" createdTo inspect the detailed status of the object count quota, use the following
oc describecommand:$ oc describe quota testExample output
Name: test Namespace: quota Resource Used Hard -------- ---- ---- count/deployments.extensions 0 2 count/pods 0 3 count/replicasets.extensions 0 4 count/secrets 0 4This example limits the listed resources to the hard limit in each project in the cluster.
5.5.4. Viewing a quota
To monitor usage statistics against defined hard limits, navigate to the Quota page in the web console. Alternatively, you can use the CLI to view detailed quota information for the project.
Procedure
Get the list of quotas defined in the project by entering the following command:
Example command with a project called demoproject
$ oc get quota -n demoprojectExample output
NAME AGE besteffort 11m compute-resources 2m core-object-counts 29mDescribe the target quota by entering the following command:
Example command for the core-object-counts quota
$ oc describe quota core-object-counts -n demoprojectExample output
Name: core-object-counts Namespace: demoproject Resource Used Hard -------- ---- ---- configmaps 3 10 persistentvolumeclaims 0 4 replicationcontrollers 3 20 secrets 9 10 services 2 10
5.5.5. Configuring quota synchronization period
To control the synchronization time frame when resources are deleted, configure the resource-quota-sync-period setting. This parameter in the /etc/origin/master/master-config.yaml file determines how frequently the system updates usage statistics to reflect deleted resources.
Before quota usage is restored, you might encounter problems when attempting to reuse the resources.
Adjusting the regeneration time can be helpful for creating resources and determining resource usage when automation is used.
The resource-quota-sync-period setting balances system performance. Reducing the sync period can result in a heavy load on the controller.
Procedure
To specify the time required for resources to regenerate and become available again, edit the
resource-quota-sync-periodsetting. With this configuration, you can set the synchronization interval in seconds.Example of the
resource-quota-sync-periodsettingkubernetesMasterConfig: apiLevels: - v1beta3 - v1 apiServerArguments: null controllerArguments: resource-quota-sync-period: - "10s" # ...Restart the controller services to apply them to your cluster by entering the following commands:
$ master-restart api$ master-restart controllers
5.5.6. Setting a quota to consume a resource
To restrict the amount of a resource that a user can consume, set a quota. By doing this task, you can prevent unbounded usage of resources, such as storage classes, ensuring that project consumption remains within defined limits.
If a quota does not manage a resource, a user has no restriction on the amount of that resource that can be consumed. For example, if there is no quota on storage related to the gold storage class, the amount of gold storage a project can create is unbounded.
For high-cost compute or storage resources, administrators can require an explicit quota be granted to consume a resource. For example, if a project was not explicitly given quota for storage related to the gold storage class, users of that project would not be able to create any storage of that type.
The example in the procedure shows how the quota system intercepts every operation that creates or updates a PersistentVolumeClaim resource. The quota system checks what resources controlled by quota would be consumed. If there is no covering quota for those resources in the project, the request is denied. In this example, if a user creates a PersistentVolumeClaim resource that uses storage associated with the gold storage class and there is no matching quota in the project, the request is denied.
Procedure
Add the following stanza to the
master-config.yamlfile. This stanza requires explicit quota to consume a particular resource.admissionConfig: pluginConfig: ResourceQuota: configuration: apiVersion: resourcequota.admission.k8s.io/v1alpha1 kind: Configuration limitedResources: - resource: persistentvolumeclaims matchContains: - gold.storageclass.storage.k8s.io/requests.storage # ...where:
configuration.resource- Specifies the group or resource whose consumption is limited by default.
configuration.matchContains- Specifies the name of the resource tracked by quota associated with the group or resource to limit by default.
5.7. Limit ranges in a LimitRange object
To define compute resource constraints at the object level, create a LimitRange object. By creating this object, you can specify the exact amount of resources that an individual pod, container, image, or persistent volume claim can consume.
All requests to create and modify resources are evaluated against each LimitRange object in the project. If the resource violates any of the enumerated constraints, the resource is rejected. If the resource does not set an explicit value, and if the constraint supports a default value, the default value is applied to the resource.
For CPU and memory limits, if you specify a maximum value but do not specify a minimum limit, the resource can consume more CPU and memory resources than the maximum value.
Core limit range object definition
apiVersion: "v1"
kind: "LimitRange"
metadata:
name: "core-resource-limits"
spec:
limits:
- type: "Pod"
max:
cpu: "2"
memory: "1Gi"
min:
cpu: "200m"
memory: "6Mi"
- type: "Container"
max:
cpu: "2"
memory: "1Gi"
min:
cpu: "100m"
memory: "4Mi"
default:
cpu: "300m"
memory: "200Mi"
defaultRequest:
cpu: "200m"
memory: "100Mi"
maxLimitRequestRatio:
cpu: "10"
# ...where:
metadata.name- Specifies the name of the limit range object.
max.cpu- Specifies the maximum amount of CPU that a pod can request on a node across all containers.
max.memory- Specifies the maximum amount of memory that a pod can request on a node across all containers.
min.cpu-
Specifies the minimum amount of CPU that a pod can request on a node across all containers. If you do not set a
minvalue or you setminto0, the result is no limit and the pod can consume more than themaxCPU value. min.memory-
Specifies the minimum amount of memory that a pod can request on a node across all containers. If you do not set a
minvalue or you setminto0, the result is no limit and the pod can consume more than themaxmemory value. max.cpu- Specifies the maximum amount of CPU that a single container in a pod can request.
max.memory- Specifies the maximum amount of memory that a single container in a pod can request.
min.cpu-
Specifies the minimum amount of CPU that a single container in a pod can request. If you do not set a
minvalue or you setminto0, the result is no limit and the pod can consume more than themaxCPU value. max.memory-
Specifies the minimum amount of memory that a single container in a pod can request. If you do not set a
minvalue or you setminto0, the result is no limit and the pod can consume more than themaxmemory value. default.cpu- Specifies the default CPU limit for a container if you do not specify a limit in the pod specification.
default.memory- Specifies the default memory limit for a container if you do not specify a limit in the pod specification.
defaultRequest.cpu- Specifies the default CPU request for a container if you do not specify a request in the pod specification.
defaultRequest.memory- Specifies the default memory request for a container if you do not specify a request in the pod specification.
maxLimitRequestRatio.cpu- Specifies the maximum limit-to-request ratio for a container.
OpenShift Container Platform Limit range object definition
apiVersion: "v1"
kind: "LimitRange"
metadata:
name: "openshift-resource-limits"
spec:
limits:
- type: openshift.io/Image
max:
storage: 1Gi
- type: openshift.io/ImageStream
max:
openshift.io/image-tags: 20
openshift.io/images: 30
- type: "Pod"
max:
cpu: "2"
memory: "1Gi"
ephemeral-storage: "1Gi"
min:
cpu: "1"
memory: "1Gi"
# ...where:
limits.max.storage- Specifies the maximum size of an image that can be pushed to an internal registry.
limits.max.openshift.io/image-tags-
Specifies the maximum number of unique references counted from tag definitions in the
imagestream.spec.tagsresource. limits.max.openshift.io/images-
Specifies the maximum number of unique image identities, or digests, recorded in the
imagestream.status.tagsresource. type.max.cpu- Specifies the maximum amount of CPU that a pod can request on a node across all containers.
type.max.memory- Specifies the maximum amount of memory that a pod can request on a node across all containers.
type.max.ephemeral-storage- Specifies the maximum amount of ephemeral storage that a pod can request on a node across all containers.
min.cpu- Specifies the minimum amount of CPU that a pod can request on a node across all containers. See the Supported Constraints table for important information.
min.memory-
Specifies the minimum amount of memory that a pod can request on a node across all containers. If you do not set a
minvalue or you setminto0, the result is no limit and the pod can consume more than themaxmemory value.
You can specify both core and OpenShift Container Platform resources in one limit range object.
5.7.1. Container limits
After you create the LimitRange object, you can specify the exact amount of resources that a container can consume.
The following list shows resources that a container can consume:
- CPU
- Memory
The following table shows the supported constraints for a container. If specified, the constraints must hold true for each container.
| Constraint | Behavior |
|---|---|
|
|
If the configuration defines a |
|
|
If the configuration defines a |
|
|
If the limit range defines a
For example, if a container has |
The following list shows default resources that a container can consume:
-
Default[<resource>]: Defaultscontainer.resources.limit[<resource>]to specified value if none. -
Default Requests[<resource>]: Defaultscontainer.resources.requests[<resource>]to specified value if none.
5.7.2. Pod limits
After you create the LimitRange object, you can specify the exact amount of resources that a pod can consume.
A pod can consume the following resources:
- CPU
- Memory
The following table shows the supported constraints for a pod. Across all pods, the following behavior must hold true:
| Constraint | Enforced behavior |
|---|---|
|
|
|
|
|
|
|
|
|
5.7.3. Image limits
After you create the LimitRange object, you can specify the exact amount of resources that an image can consume.
An image can consume the following resources:
- Storage
-
openshift.io/Image
The following table shows the supported constraints for an image. If specified, the constraints must hold true for each image.
| Constraint | Behavior |
|---|---|
|
|
|
To prevent blobs that exceed the limit from being uploaded to the registry, you must configure the registry to enforce quota. The REGISTRY_MIDDLEWARE_REPOSITORY_OPENSHIFT_ENFORCEQUOTA environment variable must be set to true. By default, the environment variable is set to true for new deployments.
5.7.4. Image stream limits
After you create the LimitRange object, you can specify the exact amount of resources that an image stream can consume.
An image stream can consume the following resources:
-
openshift.io/image-tags -
openshift.io/images -
openshift.io/ImageStream
The openshift.io/image-tags limit bounds unique references derived from tag definitions in the imagestream.spec.tags resource. A reference can be an ImageStreamTag, an ImageStreamImage, or a DockerImage. You can use the oc tag and oc import-image commands to create tags. Internal and external references are not distinguished, and each unique reference in the spec is counted once. Updates that would exceed the limit are rejected, including updates from pushes to the internal registry that add or change tag definitions.
The openshift.io/images limit bounds unique image identities recorded in imagestream.status.tags. The name is equivalent to the digest for the image. It limits how many distinct images the stream can reference in status, including from registry pushes. Internal and external references are not distinguished.
Do not read openshift.io/image-tags and openshift.io/images as "tag names versus images per tag." The first limit is computed from the ImageStream spec.tags resource. The second is computed from the imagestream.status.tags resource. Both limits can cause image stream updates to fail when a push or other operation would exceed them.
The following table shows the supported constraints for an image stream. If specified, the constraints must hold true for each image stream.
| Constraint | Behavior |
|---|---|
|
|
|
|
|
|
5.7.5. PersistentVolumeClaim limits
After you create the LimitRange object, you can specify the exact amount of resources that a PersistentVolumeClaim resource can consume.
A PersistentVolumeClaim resource can consume storage resources.
The following table shows the supported constraints for a persistent volume claim. If specified, the constraints must hold true for each persistent volume claim.
| Constraint | Enforced behavior |
|---|---|
|
| Min[<resource>] <= claim.spec.resources.requests[<resource>] (required) |
|
| claim.spec.resources.requests[<resource>] (required) <= Max[<resource>] |
Limit range object definition example
{
"apiVersion": "v1",
"kind": "LimitRange",
"metadata": {
"name": "pvcs"
},
"spec": {
"limits": [{
"type": "PersistentVolumeClaim",
"min": {
"storage": "2Gi"
},
"max": {
"storage": "50Gi"
}
}
]
}
}where:
metadata.name- Specifies the name of the limit range object.
limits.min.storage- Specifies the minimum amount of storage that can be requested in a persistent volume claim.
limits.max.storage- Specifies the maximum amount of storage that can be requested in a persistent volume claim.
5.9. Limit range operations
You can create, view, and delete limit ranges in a project.
You can view any limit ranges that are defined in a project by navigating in the web console to the Quota page for the project. You can also use the CLI to view limit range details.
Procedure
To create the object, enter the following command:
$ oc create -f <limit_range_file> -n <project>To view the list of limit range objects that exist in a project, enter the following command:
Example command with a project called
demoproject$ oc get limits -n demoprojectExample output
NAME AGE resource-limits 6dTo describe a limit range, enter the following command:
Example command with a limit range called
resource-limits$ oc describe limits resource-limits -n demoprojectExample output
Name: resource-limits Namespace: demoproject Type Resource Min Max Default Request Default Limit Max Limit/Request Ratio ---- -------- --- --- --------------- ------------- ----------------------- Pod cpu 200m 2 - - - Pod memory 6Mi 1Gi - - - Container cpu 100m 2 200m 300m 10 Container memory 4Mi 1Gi 100Mi 200Mi - openshift.io/Image storage - 1Gi - - - openshift.io/ImageStream openshift.io/image - 12 - - - openshift.io/ImageStream openshift.io/image-tags - 10 - - -To delete a limit range, enter the following command:
$ oc delete limits <limit_name>
Chapter 6. Host practices for IBM Z and IBM LinuxONE environments
To optimize performance on mainframe infrastructure, apply host practices, so that you can configure IBM Z and IBM® LinuxONE environments to ensure your s390x architecture meets specific operational requirements
The s390x architecture is unique in many aspects. Some host practice recommendations might not apply to other platforms.
Unless stated otherwise, the host practices apply to both z/VM and Red Hat Enterprise Linux (RHEL) KVM installations on IBM Z® and IBM® LinuxONE.
6.1. Managing CPU overcommitment
To optimize infrastructure sizing in a highly virtualized IBM Z environment, manage CPU overcommitment. By adopting this strategy, you can allocate more resources to virtual machines than are physically available at the hypervisor level. This capability requires that you plan carefully for specific workload dependencies.
Depending on your setup, consider the following best practices regarding CPU overcommitment:
- Avoid over-allocating physical cores, Integrated Facilities for Linux (IFLs), at the Logical Partition (LPAR) level (PR/SM hypervisor). If your system has 4 physical IFLs, do not configure multiple LPARs with 4 logical IFLs each.
- Check and understand LPAR shares and weights.
- An excessive number of virtual CPUs can adversely affect performance. Do not define more virtual processors to a guest than logical processors are defined to the LPAR.
- Configure the number of virtual processors per guest for peak workload.
- Start small and monitor the workload. If required, increase the vCPU number incrementally.
- Not all workloads are suitable for high overcommitment ratios. If the workload is CPU intensive, you might experience performance problems with high overcommitment ratios. Workloads that are more I/O intensive can keep consistent performance even with high overcommitment ratios.
6.2. Disable Transparent Huge Pages
To prevent the operating system from automatically managing memory segments, disable Transparent Huge Pages (THP).
Transparent Huge Pages (THP) tries to automate most aspects of creating, managing, and using huge pages. Since THP automatically manages the huge pages, THP does not always handle optimally for all types of workloads. THP can lead to performance regressions, since many applications handle huge pages on their own.
6.3. Boosting networking performance with RFS
To boost networking performance, activate Receive Flow Steering (RFS) by using the Machine Config Operator (MCO). This configuration improves packet processing efficiency by directing network traffic to specific CPUs.
RFS extends Receive Packet Steering (RPS) by further reducing network latency. RFS is technically based on RPS, and improves the efficiency of packet processing by increasing the CPU cache hit rate. RFS achieves this, while considering queue length, by determining the most convenient CPU for computation so that cache hits are more likely to occur within the CPU. This means that the CPU cache is invalidated less and requires fewer cycles to rebuild the cache, which reduces packet processing run time.
Procedure
Copy the following MCO sample profile into a YAML file. For example,
enable-rfs.yaml:apiVersion: machineconfiguration.openshift.io/v1 kind: MachineConfig metadata: labels: machineconfiguration.openshift.io/role: worker name: 50-enable-rfs spec: config: ignition: version: 2.2.0 storage: files: - contents: source: data:text/plain;charset=US-ASCII,%23%20turn%20on%20Receive%20Flow%20Steering%20%28RFS%29%20for%20all%20network%20interfaces%0ASUBSYSTEM%3D%3D%22net%22%2C%20ACTION%3D%3D%22add%22%2C%20RUN%7Bprogram%7D%2B%3D%22/bin/bash%20-c%20%27for%20x%20in%20/sys/%24DEVPATH/queues/rx-%2A%3B%20do%20echo%208192%20%3E%20%24x/rps_flow_cnt%3B%20%20done%27%22%0A filesystem: root mode: 0644 path: /etc/udev/rules.d/70-persistent-net.rules - contents: source: data:text/plain;charset=US-ASCII,%23%20define%20sock%20flow%20enbtried%20for%20%20Receive%20Flow%20Steering%20%28RFS%29%0Anet.core.rps_sock_flow_entries%3D8192%0A filesystem: root mode: 0644 path: /etc/sysctl.d/95-enable-rps.confCreate the MCO profile by entering the following command:
$ oc create -f enable-rfs.yamlVerify that an entry named
50-enable-rfsis listed by entering the following command:$ oc get mcTo deactivate the MCO profile, enter the following command:
$ oc delete mc 50-enable-rfs
6.4. Choose your networking setup
To optimize performance for specific workloads and traffic patterns, select a networking setup based on your chosen hypervisor. This configuration ensures the networking stack meets the operational requirements of OpenShift Container Platform clusters on IBM Z infrastructure.
The networking stack is one of the most important components for a Kubernetes-based product like OpenShift Container Platform.
Depending on your setup, consider these best practices:
- Consider all options regarding networking devices to optimize your traffic pattern. Explore the advantages of OSA-Express, RoCE Express, HiperSockets, z/VM VSwitch, Linux Bridge (KVM), and others to decide which option leads to the greatest benefit for your setup.
- Always use the latest available NIC version. For example, OSA Express 7S 10 GbE shows great improvement compared to OSA Express 6S 10 GbE with transactional workload types, although both are 10 GbE adapters.
- Each virtual switch adds an additional layer of latency.
- The load balancer plays an important role for network communication outside the cluster. Consider using a production-grade hardware load balancer if this is critical for your application.
- OpenShift Container Platform SDN introduces flows and rules, which impact the networking performance. Make sure to consider pod affinities and placements, to benefit from the locality of services where communication is critical.
- Balance the trade-off between performance and functionality.
6.5. Ensure high disk performance with HyperPAV on z/VM
To improve I/O performance for Direct Access Storage Devices (DASD) disks in z/VM environments, configure HyperPAV alias devices. To increase throughput for both control plane nodes and compute nodes, add YAML configurations with full-pack minidisks to the Machine Config Operator (MCO) profiles for IBM Z clusters.
DASD and Extended Count Key Data (ECKD) devices are commonly used disk types in IBM Z® environments. In a typical OpenShift Container Platform setup in z/VM environments, DASD disks are commonly used to support the local storage for the nodes. You can set up HyperPAV alias devices to provide more throughput and overall better I/O performance for the DASD disks that support the z/VM guests.
Using HyperPAV for the local storage devices leads to a significant performance benefit. However, be aware of the trade-off between throughput and CPU costs.
Procedure
Copy the following MCO sample profile into a YAML file for the control plane node. For example,
05-master-kernelarg-hpav.yaml:$ cat 05-master-kernelarg-hpav.yaml apiVersion: machineconfiguration.openshift.io/v1 kind: MachineConfig metadata: labels: machineconfiguration.openshift.io/role: master name: 05-master-kernelarg-hpav spec: config: ignition: version: 3.1.0 kernelArguments: - rd.dasd=800-805 # ...Copy the following MCO sample profile into a YAML file for the compute node. For example,
05-worker-kernelarg-hpav.yaml:$ cat 05-worker-kernelarg-hpav.yaml apiVersion: machineconfiguration.openshift.io/v1 kind: MachineConfig metadata: labels: machineconfiguration.openshift.io/role: worker name: 05-worker-kernelarg-hpav spec: config: ignition: version: 3.1.0 kernelArguments: - rd.dasd=800-805 # ...NoteYou must modify the
rd.dasdarguments to fit the device IDs.Create the MCO profiles by entering the following commands:
$ oc create -f 05-master-kernelarg-hpav.yaml$ oc create -f 05-worker-kernelarg-hpav.yamlTo deactivate the MCO profiles, enter the following commands:
$ oc delete -f 05-master-kernelarg-hpav.yaml$ oc delete -f 05-worker-kernelarg-hpav.yaml
6.6. RHEL KVM on IBM Z host recommendations
To optimize Kernel-based Virtual Machine (KVM) performance on IBM Z, apply host recommendations. Because optimal settings depend strongly on specific workloads and available resources, finding the best balance for your RHEL environment often requires experimentation to avoid adverse effects.
The following sections introduces some best practices when using OpenShift Container Platform with RHEL KVM on IBM Z® and IBM® LinuxONE environments.
6.6.1. Use I/O threads for your virtual block devices
To make virtual block devices use I/O threads, you must configure one or more I/O threads for the virtual server and each virtual block device to use one of these I/O threads.
The following example specifies <iothreads>3</iothreads> to configure three I/O threads, with consecutive decimal thread IDs 1, 2, and 3. The iothread="2" parameter specifies the driver element of the disk device to use the I/O thread with ID 2.
Sample I/O thread specification
...
<domain>
<iothreads>3</iothreads>
...
<devices>
...
<disk type="block" device="disk">
<driver ... iothread="2"/>
</disk>
...
</devices>
...
</domain>where:
iothreads- Specifies the number of I/O threads.
disk- Specifies the driver element of the disk device.
Threads can increase the performance of I/O operations for disk devices, but they also use memory and CPU resources. You can configure multiple devices to use the same thread. The best mapping of threads to devices depends on the available resources and the workload.
Start with a small number of I/O threads. Often, a single I/O thread for all disk devices is sufficient. Do not configure more threads than the number of virtual CPUs, and do not configure idle threads.
You can use the virsh iothreadadd command to add I/O threads with specific thread IDs to a running virtual server.
6.6.2. Avoid virtual SCSI devices
Configure virtual SCSI devices only if you need to address the device through SCSI-specific interfaces. Configure disk space as virtual block devices rather than virtual SCSI devices, regardless of the backing on the host.
However, you might need SCSI-specific interfaces for:
- A logical unit number (LUN) for a SCSI-attached tape drive on the host.
- A DVD ISO file on the host file system that is mounted on a virtual DVD drive.
6.6.3. Configure guest caching for disk
To ensure that the guest manages caching instead of the host, configure your disk devices. This setting shifts caching responsibility to the guest operating system, preventing the host from caching disk operations.
Ensure that the driver element of the disk device includes the cache="none" and io="native" parameters.
Example configuration
<disk type="block" device="disk">
<driver name="qemu" type="raw" cache="none" io="native" iothread="1"/>
...
</disk>6.6.4. Excluding the memory balloon device
Unless you need a dynamic memory size, do not define a memory balloon device and ensure that libvirt does not create one for you. Include the memballoon parameter as a child of the devices element in your domain configuration file.
Procedure
To disable the memory balloon driver, add the following configuration setting to your domain configuration file:
<memballoon model="none"/>
6.6.5. Tuning the CPU migration algorithm of the host scheduler
To optimize task distribution and reduce latency, tune the CPU migration algorithm of the host scheduler. With this configuration, you can adjust how the kernel balances processes across available CPUs, ensuring efficient resource usage for your specific workloads.
Do not change the scheduler settings unless you are an expert who understands the implications. Do not apply changes to production systems without testing them and confirming that they have the intended effect.
The kernel.sched_migration_cost_ns parameter specifies a time interval in nanoseconds. After the last execution of a task, the CPU cache is considered to have useful content until this interval expires. Increasing this interval results in fewer task migrations. The default value is 500000 ns.
If the CPU idle time is higher than expected when there are runnable processes, try reducing this interval. If tasks bounce between CPUs or nodes too often, try increasing it.
Procedure
To dynamically set the interval to
60000ns, enter the following command:# sysctl kernel.sched_migration_cost_ns=60000To persistently change the value to
60000ns, add the following entry to/etc/sysctl.conf:kernel.sched_migration_cost_ns=60000
6.6.6. Disabling the cpuset cgroup controller
To allow the kernel scheduler to freely distribute processes across all available resources, disable the cpuset cgroup controller. This configuration prevents the system from enforcing processor affinity constraints, ensuring that tasks can use any available CPU or memory node.
This setting applies only to KVM hosts with cgroups version 1. To enable CPU hotplug on the host, disable the cgroup controller.
Procedure
-
Open
/etc/libvirt/qemu.confwith an editor of your choice. -
Go to the
cgroup_controllersline. - Duplicate the entire line and remove the leading number sign (#) from the copy.
Remove the
cpusetentry, as follows:cgroup_controllers = [ "cpu", "devices", "memory", "blkio", "cpuacct" ]For the new setting to take effect, you must restart the libvirtd daemon:
- Stop all virtual machines.
Run the following command:
# systemctl restart libvirtdRestart the virtual machines.
This setting persists across host reboots.
6.6.7. Tuning the polling period for idle virtual CPUs
When a virtual CPU becomes idle, KVM polls for wakeup conditions for the virtual CPU before allocating the host resource. You can specify the time interval, during which polling takes place in sysfs at /sys/module/kvm/parameters/halt_poll_ns.
During the specified time, polling reduces the wakeup latency for the virtual CPU at the expense of resource usage. Depending on the workload, a longer or shorter time for polling can be beneficial. The time interval is specified in nanoseconds. The default is 50000 ns.
Procedure
To optimize for low CPU consumption, enter a small value or write
0to disable polling:# echo 0 > /sys/module/kvm/parameters/halt_poll_nsTo optimize for low latency, for example for transactional workloads, enter a large value:
# echo 80000 > /sys/module/kvm/parameters/halt_poll_ns
Chapter 7. Using the Node Tuning Operator
Learn about the Node Tuning Operator and how you can use it to manage node-level tuning by orchestrating the tuned daemon.
7.1. About the Node Tuning Operator
The Node Tuning Operator helps you manage node-level tuning by orchestrating the TuneD daemon and achieves low latency performance by using the Performance Profile controller. The majority of high-performance applications require some level of kernel tuning. The Node Tuning Operator provides a unified management interface to users of node-level sysctls and more flexibility to add custom tuning specified by user needs.
The Operator manages the containerized TuneD daemon for OpenShift Container Platform as a Kubernetes daemon set. It ensures the custom tuning specification is passed to all containerized TuneD daemons running in the cluster in the format that the daemons understand. The daemons run on all nodes in the cluster, one per node.
Node-level settings applied by the containerized TuneD daemon are rolled back on an event that triggers a profile change or when the containerized TuneD daemon is terminated gracefully by receiving and handling a termination signal.
The Node Tuning Operator uses the Performance Profile controller to implement automatic tuning to achieve low latency performance for OpenShift Container Platform applications.
The cluster administrator configures a performance profile to define node-level settings such as the following:
- Updating the kernel to kernel-rt.
- Choosing CPUs for housekeeping.
- Choosing CPUs for running workloads.
The Node Tuning Operator is part of a standard OpenShift Container Platform installation in version 4.1 and later.
In earlier versions of OpenShift Container Platform, the Performance Addon Operator was used to implement automatic tuning to achieve low latency performance for OpenShift applications. In OpenShift Container Platform 4.11 and later, this functionality is part of the Node Tuning Operator.
7.2. Accessing an example Node Tuning Operator specification
Use this process to access an example Node Tuning Operator specification.
Procedure
Run the following command to access an example Node Tuning Operator specification:
oc get tuned.tuned.openshift.io/default -o yaml -n openshift-cluster-node-tuning-operator
The default CR is meant for delivering standard node-level tuning for the OpenShift Container Platform platform and it can only be modified to set the Operator Management state. Any other custom changes to the default CR will be overwritten by the Operator. For custom tuning, create your own Tuned CRs. Newly created CRs will be combined with the default CR and custom tuning applied to OpenShift Container Platform nodes based on node or pod labels and profile priorities.
While in certain situations the support for pod labels can be a convenient way of automatically delivering required tuning, this practice is discouraged and strongly advised against, especially in large-scale clusters. The default Tuned CR ships without pod label matching. If a custom profile is created with pod label matching, then the functionality will be enabled at that time. The pod label functionality will be deprecated in future versions of the Node Tuning Operator.
7.3. Default profiles set on a cluster
The following are the default profiles set on a cluster.
apiVersion: tuned.openshift.io/v1
kind: Tuned
metadata:
name: default
namespace: openshift-cluster-node-tuning-operator
spec:
profile:
- data: |
[main]
summary=Optimize systems running OpenShift (provider specific parent profile)
include=-provider-${f:exec:cat:/var/lib/ocp-tuned/provider},openshift
name: openshift
recommend:
- profile: openshift-control-plane
priority: 30
match:
- label: node-role.kubernetes.io/master
- label: node-role.kubernetes.io/infra
- profile: openshift-node
priority: 40
Starting with OpenShift Container Platform 4.9, all OpenShift TuneD profiles are shipped with the TuneD package. You can use the oc exec command to view the contents of these profiles:
$ oc exec $tuned_pod -n openshift-cluster-node-tuning-operator -- find /usr/lib/tuned/openshift{,-control-plane,-node} -name tuned.conf -exec grep -H ^ {} \;7.4. Verifying that the TuneD profiles are applied
Verify the TuneD profiles that are applied to your cluster node.
$ oc get profile.tuned.openshift.io -n openshift-cluster-node-tuning-operatorExample output
NAME TUNED APPLIED DEGRADED AGE
master-0 openshift-control-plane True False 6h33m
master-1 openshift-control-plane True False 6h33m
master-2 openshift-control-plane True False 6h33m
worker-a openshift-node True False 6h28m
worker-b openshift-node True False 6h28m-
NAME: Name of the Profile object. There is one Profile object per node and their names match. -
TUNED: Name of the desired TuneD profile to apply. -
APPLIED:Trueif the TuneD daemon applied the desired profile. (True/False/Unknown). -
DEGRADED:Trueif any errors were reported during application of the TuneD profile (True/False/Unknown). -
AGE: Time elapsed since the creation of Profile object.
The ClusterOperator/node-tuning object also contains useful information about the Operator and its node agents' health. For example, Operator misconfiguration is reported by ClusterOperator/node-tuning status messages.
To get status information about the ClusterOperator/node-tuning object, run the following command:
$ oc get co/node-tuning -n openshift-cluster-node-tuning-operatorExample output
NAME VERSION AVAILABLE PROGRESSING DEGRADED SINCE MESSAGE
node-tuning 4.16.1 True False True 60m 1/5 Profiles with bootcmdline conflict
If either the ClusterOperator/node-tuning or a profile object’s status is DEGRADED, additional information is provided in the Operator or operand logs.
7.5. Custom tuning specification
The custom resource (CR) for the Operator has two major sections. The first section, profile:, is a list of TuneD profiles and their names. The second, recommend:, defines the profile selection logic.
Multiple custom tuning specifications can co-exist as multiple CRs in the Operator’s namespace. The existence of new CRs or the deletion of old CRs is detected by the Operator. All existing custom tuning specifications are merged and appropriate objects for the containerized TuneD daemons are updated.
Management state
The Operator Management state is set by adjusting the default Tuned CR. By default, the Operator is in the Managed state and the spec.managementState field is not present in the default Tuned CR. Valid values for the Operator Management state are as follows:
- Managed: the Operator will update its operands as configuration resources are updated
- Unmanaged: the Operator will ignore changes to the configuration resources
- Removed: the Operator will remove its operands and resources the Operator provisioned
Profile data
The profile: section lists TuneD profiles and their names.
profile:
- name: tuned_profile_1
data: |
# TuneD profile specification
[main]
summary=Description of tuned_profile_1 profile
[sysctl]
net.ipv4.ip_forward=1
# ... other sysctl's or other TuneD daemon plugins supported by the containerized TuneD
# ...
- name: tuned_profile_n
data: |
# TuneD profile specification
[main]
summary=Description of tuned_profile_n profile
# tuned_profile_n profile settingsRecommended profiles
The profile: selection logic is defined by the recommend: section of the CR. The recommend: section is a list of items to recommend the profiles based on a selection criteria.
recommend:
<recommend-item-1>
# ...
<recommend-item-n>The individual items of the list:
- machineConfigLabels:
<mcLabels>
match:
<match>
priority: <priority>
profile: <tuned_profile_name>
operand:
debug: <bool>
tunedConfig:
reapply_sysctl: <bool> - 1
- Optional.
- 2
- A dictionary of key/value
MachineConfiglabels. The keys must be unique. - 3
- If omitted, profile match is assumed unless a profile with a higher priority matches first or
machineConfigLabelsis set. - 4
- An optional list.
- 5
- Profile ordering priority. Lower numbers mean higher priority (
0is the highest priority). - 6
- A TuneD profile to apply on a match. For example
tuned_profile_1. - 7
- Optional operand configuration.
- 8
- Turn debugging on or off for the TuneD daemon. Options are
truefor on orfalsefor off. The default isfalse. - 9
- Turn
reapply_sysctlfunctionality on or off for the TuneD daemon. Options aretruefor on andfalsefor off.
<match> is an optional list recursively defined as follows:
- label: <label_name>
value: <label_value>
type: <label_type>
<match>
If <match> is not omitted, all nested <match> sections must also evaluate to true. Otherwise, false is assumed and the profile with the respective <match> section will not be applied or recommended. Therefore, the nesting (child <match> sections) works as logical AND operator. Conversely, if any item of the <match> list matches, the entire <match> list evaluates to true. Therefore, the list acts as logical OR operator.
If machineConfigLabels is defined, machine config pool based matching is turned on for the given recommend: list item. <mcLabels> specifies the labels for a machine config. The machine config is created automatically to apply host settings, such as kernel boot parameters, for the profile <tuned_profile_name>. This involves finding all machine config pools with machine config selector matching <mcLabels> and setting the profile <tuned_profile_name> on all nodes that are assigned the found machine config pools. To target nodes that have both master and worker roles, you must use the master role.
The list items match and machineConfigLabels are connected by the logical OR operator. The match item is evaluated first in a short-circuit manner. Therefore, if it evaluates to true, the machineConfigLabels item is not considered.
When using machine config pool based matching, it is advised to group nodes with the same hardware configuration into the same machine config pool. Not following this practice might result in TuneD operands calculating conflicting kernel parameters for two or more nodes sharing the same machine config pool.
Example: Node or pod label based matching
- match:
- label: tuned.openshift.io/elasticsearch
match:
- label: node-role.kubernetes.io/master
- label: node-role.kubernetes.io/infra
type: pod
priority: 10
profile: openshift-control-plane-es
- match:
- label: node-role.kubernetes.io/master
- label: node-role.kubernetes.io/infra
priority: 20
profile: openshift-control-plane
- priority: 30
profile: openshift-node
The CR above is translated for the containerized TuneD daemon into its recommend.conf file based on the profile priorities. The profile with the highest priority (10) is openshift-control-plane-es and, therefore, it is considered first. The containerized TuneD daemon running on a given node looks to see if there is a pod running on the same node with the tuned.openshift.io/elasticsearch label set. If not, the entire <match> section evaluates as false. If there is such a pod with the label, in order for the <match> section to evaluate to true, the node label also needs to be node-role.kubernetes.io/master or node-role.kubernetes.io/infra.
If the labels for the profile with priority 10 matched, openshift-control-plane-es profile is applied and no other profile is considered. If the node/pod label combination did not match, the second highest priority profile (openshift-control-plane) is considered. This profile is applied if the containerized TuneD pod runs on a node with labels node-role.kubernetes.io/master or node-role.kubernetes.io/infra.
Finally, the profile openshift-node has the lowest priority of 30. It lacks the <match> section and, therefore, will always match. It acts as a profile catch-all to set openshift-node profile, if no other profile with higher priority matches on a given node.
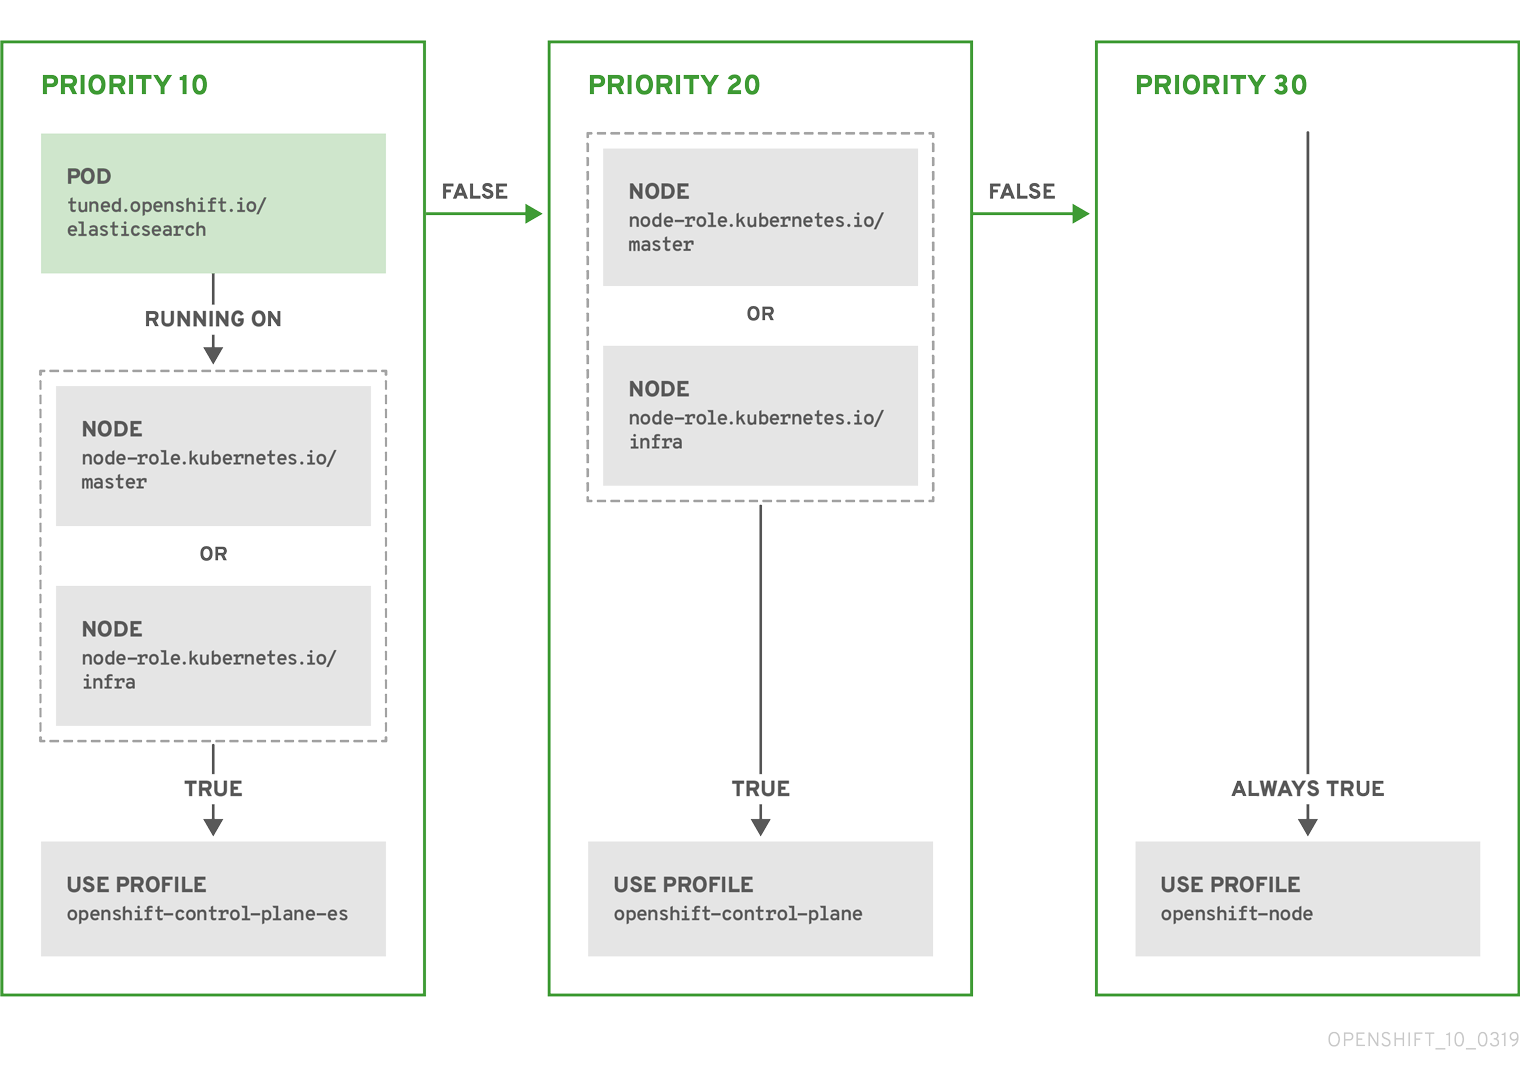
Example: Machine config pool based matching
apiVersion: tuned.openshift.io/v1
kind: Tuned
metadata:
name: openshift-node-custom
namespace: openshift-cluster-node-tuning-operator
spec:
profile:
- data: |
[main]
summary=Custom OpenShift node profile with an additional kernel parameter
include=openshift-node
[bootloader]
cmdline_openshift_node_custom=+skew_tick=1
name: openshift-node-custom
recommend:
- machineConfigLabels:
machineconfiguration.openshift.io/role: "worker-custom"
priority: 20
profile: openshift-node-customTo minimize node reboots, label the target nodes with a label the machine config pool’s node selector will match, then create the Tuned CR above and finally create the custom machine config pool itself.
Cloud provider-specific TuneD profiles
With this functionality, all Cloud provider-specific nodes can conveniently be assigned a TuneD profile specifically tailored to a given Cloud provider on a OpenShift Container Platform cluster. This can be accomplished without adding additional node labels or grouping nodes into machine config pools.
This functionality takes advantage of spec.providerID node object values in the form of <cloud-provider>://<cloud-provider-specific-id> and writes the file /var/lib/ocp-tuned/provider with the value <cloud-provider> in NTO operand containers. The content of this file is then used by TuneD to load provider-<cloud-provider> profile if such profile exists.
The openshift profile that both openshift-control-plane and openshift-node profiles inherit settings from is now updated to use this functionality through the use of conditional profile loading. Neither NTO nor TuneD currently include any Cloud provider-specific profiles. However, it is possible to create a custom profile provider-<cloud-provider> that will be applied to all Cloud provider-specific cluster nodes.
Example GCE Cloud provider profile
apiVersion: tuned.openshift.io/v1
kind: Tuned
metadata:
name: provider-gce
namespace: openshift-cluster-node-tuning-operator
spec:
profile:
- data: |
[main]
summary=GCE Cloud provider-specific profile
# Your tuning for GCE Cloud provider goes here.
name: provider-gce
Due to profile inheritance, any setting specified in the provider-<cloud-provider> profile will be overwritten by the openshift profile and its child profiles.
7.6. Custom tuning examples
Using TuneD profiles from the default CR
The following CR applies custom node-level tuning for OpenShift Container Platform nodes with label tuned.openshift.io/ingress-node-label set to any value.
Example: custom tuning using the openshift-control-plane TuneD profile
apiVersion: tuned.openshift.io/v1
kind: Tuned
metadata:
name: ingress
namespace: openshift-cluster-node-tuning-operator
spec:
profile:
- data: |
[main]
summary=A custom OpenShift ingress profile
include=openshift-control-plane
[sysctl]
net.ipv4.ip_local_port_range="1024 65535"
net.ipv4.tcp_tw_reuse=1
name: openshift-ingress
recommend:
- match:
- label: tuned.openshift.io/ingress-node-label
priority: 10
profile: openshift-ingress
Custom profile writers are strongly encouraged to include the default TuneD daemon profiles shipped within the default Tuned CR. The example above uses the default openshift-control-plane profile to accomplish this.
Using built-in TuneD profiles
Given the successful rollout of the NTO-managed daemon set, the TuneD operands all manage the same version of the TuneD daemon. To list the built-in TuneD profiles supported by the daemon, query any TuneD pod in the following way:
$ oc exec $tuned_pod -n openshift-cluster-node-tuning-operator -- find /usr/lib/tuned/ -name tuned.conf -printf '%h\n' | sed 's|^.*/||'You can use the profile names retrieved by this in your custom tuning specification.
Example: using built-in hpc-compute TuneD profile
apiVersion: tuned.openshift.io/v1
kind: Tuned
metadata:
name: openshift-node-hpc-compute
namespace: openshift-cluster-node-tuning-operator
spec:
profile:
- data: |
[main]
summary=Custom OpenShift node profile for HPC compute workloads
include=openshift-node,hpc-compute
name: openshift-node-hpc-compute
recommend:
- match:
- label: tuned.openshift.io/openshift-node-hpc-compute
priority: 20
profile: openshift-node-hpc-compute
In addition to the built-in hpc-compute profile, the example above includes the openshift-node TuneD daemon profile shipped within the default Tuned CR to use OpenShift-specific tuning for compute nodes.
Overriding host-level sysctls
Various kernel parameters can be changed at runtime by using /run/sysctl.d/, /etc/sysctl.d/, and /etc/sysctl.conf host configuration files. OpenShift Container Platform adds several host configuration files which set kernel parameters at runtime; for example, net.ipv[4-6]., fs.inotify., and vm.max_map_count. These runtime parameters provide basic functional tuning for the system prior to the kubelet and the Operator start.
The Operator does not override these settings unless the reapply_sysctl option is set to false. Setting this option to false results in TuneD not applying the settings from the host configuration files after it applies its custom profile.
Example: overriding host-level sysctls
apiVersion: tuned.openshift.io/v1
kind: Tuned
metadata:
name: openshift-no-reapply-sysctl
namespace: openshift-cluster-node-tuning-operator
spec:
profile:
- data: |
[main]
summary=Custom OpenShift profile
include=openshift-node
[sysctl]
vm.max_map_count=>524288
name: openshift-no-reapply-sysctl
recommend:
- match:
- label: tuned.openshift.io/openshift-no-reapply-sysctl
priority: 15
profile: openshift-no-reapply-sysctl
operand:
tunedConfig:
reapply_sysctl: false7.7. Supported TuneD daemon plugins
Excluding the [main] section, the following TuneD plugins are supported when using custom profiles defined in the profile: section of the Tuned CR:
- audio
- cpu
- disk
- eeepc_she
- modules
- mounts
- net
- scheduler
- scsi_host
- selinux
- sysctl
- sysfs
- usb
- video
- vm
- bootloader
There is some dynamic tuning functionality provided by some of these plugins that is not supported. The following TuneD plugins are currently not supported:
- script
- systemd
The TuneD bootloader plugin only supports Red Hat Enterprise Linux CoreOS (RHCOS) worker nodes.
Additional resources
7.8. Configuring node tuning in a hosted cluster
To set node-level tuning on the nodes in your hosted cluster, you can use the Node Tuning Operator. In hosted control planes, you can configure node tuning by creating config maps that contain Tuned objects and referencing those config maps in your node pools.
Procedure
Create a config map that contains a valid tuned manifest, and reference the manifest in a node pool. In the following example, a
Tunedmanifest defines a profile that setsvm.dirty_ratioto 55 on nodes that contain thetuned-1-node-labelnode label with any value. Save the followingConfigMapmanifest in a file namedtuned-1.yaml:apiVersion: v1 kind: ConfigMap metadata: name: tuned-1 namespace: clusters data: tuning: | apiVersion: tuned.openshift.io/v1 kind: Tuned metadata: name: tuned-1 namespace: openshift-cluster-node-tuning-operator spec: profile: - data: | [main] summary=Custom OpenShift profile include=openshift-node [sysctl] vm.dirty_ratio="55" name: tuned-1-profile recommend: - priority: 20 profile: tuned-1-profileNoteIf you do not add any labels to an entry in the
spec.recommendsection of the Tuned spec, node-pool-based matching is assumed, so the highest priority profile in thespec.recommendsection is applied to nodes in the pool. Although you can achieve more fine-grained node-label-based matching by setting a label value in the Tuned.spec.recommend.matchsection, node labels will not persist during an upgrade unless you set the.spec.management.upgradeTypevalue of the node pool toInPlace.Create the
ConfigMapobject in the management cluster:$ oc --kubeconfig="$MGMT_KUBECONFIG" create -f tuned-1.yamlReference the
ConfigMapobject in thespec.tuningConfigfield of the node pool, either by editing a node pool or creating one. In this example, assume that you have only oneNodePool, namednodepool-1, which contains 2 nodes.apiVersion: hypershift.openshift.io/v1alpha1 kind: NodePool metadata: ... name: nodepool-1 namespace: clusters ... spec: ... tuningConfig: - name: tuned-1 status: ...NoteYou can reference the same config map in multiple node pools. In hosted control planes, the Node Tuning Operator appends a hash of the node pool name and namespace to the name of the Tuned CRs to distinguish them. Outside of this case, do not create multiple TuneD profiles of the same name in different Tuned CRs for the same hosted cluster.
Verification
Now that you have created the ConfigMap object that contains a Tuned manifest and referenced it in a NodePool, the Node Tuning Operator syncs the Tuned objects into the hosted cluster. You can verify which Tuned objects are defined and which TuneD profiles are applied to each node.
List the
Tunedobjects in the hosted cluster:$ oc --kubeconfig="$HC_KUBECONFIG" get tuned.tuned.openshift.io -n openshift-cluster-node-tuning-operatorExample output
NAME AGE default 7m36s rendered 7m36s tuned-1 65sList the
Profileobjects in the hosted cluster:$ oc --kubeconfig="$HC_KUBECONFIG" get profile.tuned.openshift.io -n openshift-cluster-node-tuning-operatorExample output
NAME TUNED APPLIED DEGRADED AGE nodepool-1-worker-1 tuned-1-profile True False 7m43s nodepool-1-worker-2 tuned-1-profile True False 7m14sNoteIf no custom profiles are created, the
openshift-nodeprofile is applied by default.To confirm that the tuning was applied correctly, start a debug shell on a node and check the sysctl values:
$ oc --kubeconfig="$HC_KUBECONFIG" debug node/nodepool-1-worker-1 -- chroot /host sysctl vm.dirty_ratioExample output
vm.dirty_ratio = 55
7.9. Advanced node tuning for hosted clusters by setting kernel boot parameters
For more advanced tuning in hosted control planes, which requires setting kernel boot parameters, you can also use the Node Tuning Operator. The following example shows how you can create a node pool with huge pages reserved.
Procedure
Create a
ConfigMapobject that contains aTunedobject manifest for creating 10 huge pages that are 2 MB in size. Save thisConfigMapmanifest in a file namedtuned-hugepages.yaml:apiVersion: v1 kind: ConfigMap metadata: name: tuned-hugepages namespace: clusters data: tuning: | apiVersion: tuned.openshift.io/v1 kind: Tuned metadata: name: hugepages namespace: openshift-cluster-node-tuning-operator spec: profile: - data: | [main] summary=Boot time configuration for hugepages include=openshift-node [bootloader] cmdline_openshift_node_hugepages=hugepagesz=2M hugepages=50 name: openshift-node-hugepages recommend: - priority: 20 profile: openshift-node-hugepagesNoteThe
.spec.recommend.matchfield is intentionally left blank. In this case, thisTunedobject is applied to all nodes in the node pool where thisConfigMapobject is referenced. Group nodes with the same hardware configuration into the same node pool. Otherwise, TuneD operands can calculate conflicting kernel parameters for two or more nodes that share the same node pool.Create the
ConfigMapobject in the management cluster:$ oc --kubeconfig="<management_cluster_kubeconfig>" create -f tuned-hugepages.yaml1 - 1
- Replace
<management_cluster_kubeconfig>with the name of your management clusterkubeconfigfile.
Create a
NodePoolmanifest YAML file, customize the upgrade type of theNodePool, and reference theConfigMapobject that you created in thespec.tuningConfigsection. Create theNodePoolmanifest and save it in a file namedhugepages-nodepool.yamlby using thehcpCLI:$ hcp create nodepool aws \ --cluster-name <hosted_cluster_name> \1 --name <nodepool_name> \2 --node-count <nodepool_replicas> \3 --instance-type <instance_type> \4 --render > hugepages-nodepool.yamlNoteThe
--renderflag in thehcp createcommand does not render the secrets. To render the secrets, you must use both the--renderand the--render-sensitiveflags in thehcp createcommand.In the
hugepages-nodepool.yamlfile, set.spec.management.upgradeTypetoInPlace, and set.spec.tuningConfigto reference thetuned-hugepagesConfigMapobject that you created.apiVersion: hypershift.openshift.io/v1alpha1 kind: NodePool metadata: name: hugepages-nodepool namespace: clusters ... spec: management: ... upgradeType: InPlace ... tuningConfig: - name: tuned-hugepagesNoteTo avoid the unnecessary re-creation of nodes when you apply the new
MachineConfigobjects, set.spec.management.upgradeTypetoInPlace. If you use theReplaceupgrade type, nodes are fully deleted and new nodes can replace them when you apply the new kernel boot parameters that the TuneD operand calculated.Create the
NodePoolin the management cluster:$ oc --kubeconfig="<management_cluster_kubeconfig>" create -f hugepages-nodepool.yaml
Verification
After the nodes are available, the containerized TuneD daemon calculates the required kernel boot parameters based on the applied TuneD profile. After the nodes are ready and reboot once to apply the generated MachineConfig object, you can verify that the TuneD profile is applied and that the kernel boot parameters are set.
List the
Tunedobjects in the hosted cluster:$ oc --kubeconfig="<hosted_cluster_kubeconfig>" get tuned.tuned.openshift.io -n openshift-cluster-node-tuning-operatorExample output
NAME AGE default 123m hugepages-8dfb1fed 1m23s rendered 123mList the
Profileobjects in the hosted cluster:$ oc --kubeconfig="<hosted_cluster_kubeconfig>" get profile.tuned.openshift.io -n openshift-cluster-node-tuning-operatorExample output
NAME TUNED APPLIED DEGRADED AGE nodepool-1-worker-1 openshift-node True False 132m nodepool-1-worker-2 openshift-node True False 131m hugepages-nodepool-worker-1 openshift-node-hugepages True False 4m8s hugepages-nodepool-worker-2 openshift-node-hugepages True False 3m57sBoth of the worker nodes in the new
NodePoolhave theopenshift-node-hugepagesprofile applied.To confirm that the tuning was applied correctly, start a debug shell on a node and check
/proc/cmdline.$ oc --kubeconfig="<hosted_cluster_kubeconfig>" debug node/nodepool-1-worker-1 -- chroot /host cat /proc/cmdlineExample output
BOOT_IMAGE=(hd0,gpt3)/ostree/rhcos-... hugepagesz=2M hugepages=50
Chapter 8. Using CPU Manager and Topology Manager
CPU Manager manages groups of CPUs and constrains workloads to specific CPUs.
CPU Manager is useful for workloads that have some of these attributes:
- Require as much CPU time as possible.
- Are sensitive to processor cache misses.
- Are low-latency network applications.
- Coordinate with other processes and benefit from sharing a single processor cache.
Topology Manager collects hints from the CPU Manager, Device Manager, and other Hint Providers to align pod resources, such as CPU, SR-IOV VFs, and other device resources, for all Quality of Service (QoS) classes on the same non-uniform memory access (NUMA) node.
Topology Manager uses topology information from the collected hints to decide if a pod can be accepted or rejected on a node, based on the configured Topology Manager policy and pod resources requested.
Topology Manager is useful for workloads that use hardware accelerators to support latency-critical execution and high throughput parallel computation.
To use Topology Manager you must configure CPU Manager with the static policy.
8.1. Setting up CPU Manager
To configure CPU manager, create a KubeletConfig custom resource (CR) and apply it to the desired set of nodes.
Procedure
Label a node by running the following command:
# oc label node perf-node.example.com cpumanager=trueTo enable CPU Manager for all compute nodes, edit the CR by running the following command:
# oc edit machineconfigpool workerAdd the
custom-kubelet: cpumanager-enabledlabel tometadata.labelssection.metadata: creationTimestamp: 2020-xx-xxx generation: 3 labels: custom-kubelet: cpumanager-enabledCreate a
KubeletConfig,cpumanager-kubeletconfig.yaml, custom resource (CR). Refer to the label created in the previous step to have the correct nodes updated with the new kubelet config. See themachineConfigPoolSelectorsection:apiVersion: machineconfiguration.openshift.io/v1 kind: KubeletConfig metadata: name: cpumanager-enabled spec: machineConfigPoolSelector: matchLabels: custom-kubelet: cpumanager-enabled kubeletConfig: cpuManagerPolicy: static1 cpuManagerReconcilePeriod: 5s2 - 1
- Specify a policy:
-
none. This policy explicitly enables the existing default CPU affinity scheme, providing no affinity beyond what the scheduler does automatically. This is the default policy. -
static. This policy allows containers in guaranteed pods with integer CPU requests. It also limits access to exclusive CPUs on the node. Ifstatic, you must use a lowercases.
-
- 2
- Optional. Specify the CPU Manager reconcile frequency. The default is
5s.
Create the dynamic kubelet config by running the following command:
# oc create -f cpumanager-kubeletconfig.yamlThis adds the CPU Manager feature to the kubelet config and, if needed, the Machine Config Operator (MCO) reboots the node. To enable CPU Manager, a reboot is not needed.
Check for the merged kubelet config by running the following command:
# oc get machineconfig 99-worker-XXXXXX-XXXXX-XXXX-XXXXX-kubelet -o json | grep ownerReference -A7Example output
"ownerReferences": [ { "apiVersion": "machineconfiguration.openshift.io/v1", "kind": "KubeletConfig", "name": "cpumanager-enabled", "uid": "7ed5616d-6b72-11e9-aae1-021e1ce18878" } ]Check the compute node for the updated
kubelet.conffile by running the following command:# oc debug node/perf-node.example.com sh-4.2# cat /host/etc/kubernetes/kubelet.conf | grep cpuManagerExample output
cpuManagerPolicy: static1 cpuManagerReconcilePeriod: 5s2 Create a project by running the following command:
$ oc new-project <project_name>Create a pod that requests a core or multiple cores. Both limits and requests must have their CPU value set to a whole integer. That is the number of cores that will be dedicated to this pod:
# cat cpumanager-pod.yamlExample output
apiVersion: v1 kind: Pod metadata: generateName: cpumanager- spec: securityContext: runAsNonRoot: true seccompProfile: type: RuntimeDefault containers: - name: cpumanager image: gcr.io/google_containers/pause:3.2 resources: requests: cpu: 1 memory: "1G" limits: cpu: 1 memory: "1G" securityContext: allowPrivilegeEscalation: false capabilities: drop: [ALL] nodeSelector: cpumanager: "true"Create the pod:
# oc create -f cpumanager-pod.yaml
Verification
Verify that the pod is scheduled to the node that you labeled by running the following command:
# oc describe pod cpumanagerExample output
Name: cpumanager-6cqz7 Namespace: default Priority: 0 PriorityClassName: <none> Node: perf-node.example.com/xxx.xx.xx.xxx ... Limits: cpu: 1 memory: 1G Requests: cpu: 1 memory: 1G ... QoS Class: Guaranteed Node-Selectors: cpumanager=trueVerify that a CPU has been exclusively assigned to the pod by running the following command:
# oc describe node --selector='cpumanager=true' | grep -i cpumanager- -B2Example output
NAMESPACE NAME CPU Requests CPU Limits Memory Requests Memory Limits Age cpuman cpumanager-mlrrz 1 (28%) 1 (28%) 1G (13%) 1G (13%) 27mVerify that the
cgroupsare set up correctly. Get the process ID (PID) of thepauseprocess by running the following commands:# oc debug node/perf-node.example.comsh-4.2# systemctl status | grep -B5 pauseNoteIf the output returns multiple pause process entries, you must identify the correct pause process.
Example output
# ├─init.scope │ └─1 /usr/lib/systemd/systemd --switched-root --system --deserialize 17 └─kubepods.slice ├─kubepods-pod69c01f8e_6b74_11e9_ac0f_0a2b62178a22.slice │ ├─crio-b5437308f1a574c542bdf08563b865c0345c8f8c0b0a655612c.scope │ └─32706 /pauseVerify that pods of quality of service (QoS) tier
Guaranteedare placed within thekubepods.slicesubdirectory by running the following commands:# cd /sys/fs/cgroup/kubepods.slice/kubepods-pod69c01f8e_6b74_11e9_ac0f_0a2b62178a22.slice/crio-b5437308f1ad1a7db0574c542bdf08563b865c0345c86e9585f8c0b0a655612c.scope# for i in `ls cpuset.cpus cgroup.procs` ; do echo -n "$i "; cat $i ; doneNotePods of other QoS tiers end up in child
cgroupsof the parentkubepods.Example output
cpuset.cpus 1 tasks 32706Check the allowed CPU list for the task by running the following command:
# grep ^Cpus_allowed_list /proc/32706/statusExample output
Cpus_allowed_list: 1Verify that another pod on the system cannot run on the core allocated for the
Guaranteedpod. For example, to verify the pod in thebesteffortQoS tier, run the following commands:# cat /sys/fs/cgroup/kubepods.slice/kubepods-besteffort.slice/kubepods-besteffort-podc494a073_6b77_11e9_98c0_06bba5c387ea.slice/crio-c56982f57b75a2420947f0afc6cafe7534c5734efc34157525fa9abbf99e3849.scope/cpuset.cpus# oc describe node perf-node.example.comExample output
... Capacity: attachable-volumes-aws-ebs: 39 cpu: 2 ephemeral-storage: 124768236Ki hugepages-1Gi: 0 hugepages-2Mi: 0 memory: 8162900Ki pods: 250 Allocatable: attachable-volumes-aws-ebs: 39 cpu: 1500m ephemeral-storage: 124768236Ki hugepages-1Gi: 0 hugepages-2Mi: 0 memory: 7548500Ki pods: 250 ------- ---- ------------ ---------- --------------- ------------- --- default cpumanager-6cqz7 1 (66%) 1 (66%) 1G (12%) 1G (12%) 29m Allocated resources: (Total limits may be over 100 percent, i.e., overcommitted.) Resource Requests Limits -------- -------- ------ cpu 1440m (96%) 1 (66%)This VM has two CPU cores. The
system-reservedsetting reserves 500 millicores, meaning that half of one core is subtracted from the total capacity of the node to arrive at theNode Allocatableamount. You can see thatAllocatable CPUis 1500 millicores. This means you can run one of the CPU Manager pods since each will take one whole core. A whole core is equivalent to 1000 millicores. If you try to schedule a second pod, the system will accept the pod, but it will never be scheduled:NAME READY STATUS RESTARTS AGE cpumanager-6cqz7 1/1 Running 0 33m cpumanager-7qc2t 0/1 Pending 0 11s
8.2. Topology Manager policies
Topology Manager aligns Pod resources of all Quality of Service (QoS) classes by collecting topology hints from Hint Providers, such as CPU Manager and Device Manager, and using the collected hints to align the Pod resources.
Topology Manager supports four allocation policies, which you assign in the KubeletConfig custom resource (CR) named cpumanager-enabled:
nonepolicy- This is the default policy and does not perform any topology alignment.
best-effortpolicy-
For each container in a pod with the
best-efforttopology management policy, kubelet tries to align all the required resources on a NUMA node according to the preferred NUMA node affinity for that container. Even if the allocation is not possible due to insufficient resources, the Topology Manager still admits the pod but the allocation is shared with other NUMA nodes. restrictedpolicy-
For each container in a pod with the
restrictedtopology management policy, kubelet determines the theoretical minimum number of NUMA nodes that can fulfill the request. If the actual allocation requires more than the that number of NUMA nodes, the Topology Manager rejects the admission, placing the pod in aTerminatedstate. If the number of NUMA nodes can fulfill the request, the Topology Manager admits the pod and the pod starts running. single-numa-nodepolicy-
For each container in a pod with the
single-numa-nodetopology management policy, kubelet admits the pod if all the resources required by the pod can be allocated on the same NUMA node. If a single NUMA node affinity is not possible, the Topology Manager rejects the pod from the node. This results in a pod in aTerminatedstate with a pod admission failure.
8.3. Setting up Topology Manager
To use Topology Manager, you must configure an allocation policy in the KubeletConfig custom resource (CR) named cpumanager-enabled. This file might exist if you have set up CPU Manager. If the file does not exist, you can create the file.
Prerequisites
-
Configure the CPU Manager policy to be
static.
Procedure
To activate Topology Manager:
Configure the Topology Manager allocation policy in the custom resource.
$ oc edit KubeletConfig cpumanager-enabledapiVersion: machineconfiguration.openshift.io/v1 kind: KubeletConfig metadata: name: cpumanager-enabled spec: machineConfigPoolSelector: matchLabels: custom-kubelet: cpumanager-enabled kubeletConfig: cpuManagerPolicy: static1 cpuManagerReconcilePeriod: 5s topologyManagerPolicy: single-numa-node2
8.4. Pod interactions with Topology Manager policies
The example Pod specs illustrate pod interactions with Topology Manager.
The following pod runs in the BestEffort QoS class because no resource requests or limits are specified.
spec:
containers:
- name: nginx
image: nginx
The next pod runs in the Burstable QoS class because requests are less than limits.
spec:
containers:
- name: nginx
image: nginx
resources:
limits:
memory: "200Mi"
requests:
memory: "100Mi"
If the selected policy is anything other than none, Topology Manager would process all the pods and it enforces resource alignment only for the Guaranteed Qos Pod specification. When the Topology Manager policy is set to none, the relevant containers are pinned to any available CPU without considering NUMA affinity. This is the default behavior and it does not optimize for performance-sensitive workloads. Other values enable the use of topology awareness information from device plugins core resources, such as CPU and memory. The Topology Manager attempts to align the CPU, memory, and device allocations according to the topology of the node when the policy is set to other values than none. For more information about the available values, see Topology Manager policies.
The following example pod runs in the Guaranteed QoS class because requests are equal to limits.
spec:
containers:
- name: nginx
image: nginx
resources:
limits:
memory: "200Mi"
cpu: "2"
example.com/device: "1"
requests:
memory: "200Mi"
cpu: "2"
example.com/device: "1"Topology Manager would consider this pod. The Topology Manager would consult the Hint Providers, which are the CPU Manager, the Device Manager, and the Memory Manager, to get topology hints for the pod.
Topology Manager will use this information to store the best topology for this container. In the case of this pod, CPU Manager and Device Manager will use this stored information at the resource allocation stage.
Chapter 9. Scheduling NUMA-aware workloads
To deploy high performance workloads with optimal efficiency, use NUMA-aware scheduling. This feature aligns pods with the underlying hardware topology in your OpenShift Container Platform cluster, minimizing latency and maximizing resource utilization.
By using the NUMA Resources Operator, you can schedule high-performance workloads in the same NUMA zone. The Operator deploys a node resources exporting agent that reports on available cluster node NUMA resources, and a secondary scheduler that manages the workloads.
9.1. About NUMA
To reduce latency in multiprocessor systems, Non-Uniform Memory Access (NUMA) architecture allows CPUs to access local memory faster than remote memory. This design optimizes performance by prioritizing memory resources that are physically closer to the processor.
A CPU with multiple memory controllers can use any available memory across CPU complexes, regardless of where the memory is located. However, this increased flexibility comes at the expense of performance.
NUMA resource topology refers to the physical locations of CPUs, memory, and PCI devices relative to each other in a NUMA zone. In a NUMA architecture, a NUMA zone is a group of CPUs that has its own processors and memory. Colocated resources are said to be in the same NUMA zone, and CPUs in a zone have faster access to the same local memory than CPUs outside of that zone.
A CPU processing a workload using memory that is outside its NUMA zone is slower than a workload processed in a single NUMA zone. For I/O-constrained workloads, the network interface on a distant NUMA zone slows down how quickly information can reach the application.
Applications can achieve better performance by containing data and processing within the same NUMA zone. For high-performance workloads and applications, such as telecommunications workloads, the cluster must process pod workloads in a single NUMA zone so that the workload can operate to specification.
9.2. About NUMA-aware scheduling
To process latency-sensitive or high-performance workloads efficiently, use NUMA-aware scheduling. This feature aligns cluster compute resources, such as CPUs, memory, and devices, in the same NUMA zone, optimizing resource efficiency and improving pod density per compute node.
By integrating the performance profile of the Node Tuning Operator with NUMA-aware scheduling, you can further configure CPU affinity to optimize performance for latency-sensitive workloads.
The default OpenShift Container Platform pod scheduler scheduling logic considers the available resources of the entire compute node, not individual NUMA zones. If the most restrictive resource alignment is requested in the kubelet topology manager, error conditions can occur when admitting the pod to a node.
Conversely, if the most restrictive resource alignment is not requested, the pod can be admitted to the node without proper resource alignment, leading to worse or unpredictable performance. For example, runaway pod creation with Topology Affinity Error statuses can occur when the pod scheduler makes suboptimal scheduling decisions for guaranteed pod workloads without knowing if the pod’s requested resources are available. Scheduling mismatch decisions can cause indefinite pod startup delays. Also, depending on the cluster state and resource allocation, poor pod scheduling decisions can cause extra load on the cluster because of failed startup attempts.
The NUMA Resources Operator deploys a custom NUMA resources secondary scheduler and other resources to mitigate against the shortcomings of the default OpenShift Container Platform pod scheduler. The following diagram provides a high-level overview of NUMA-aware pod scheduling.
Figure 9.1. NUMA-aware scheduling overview
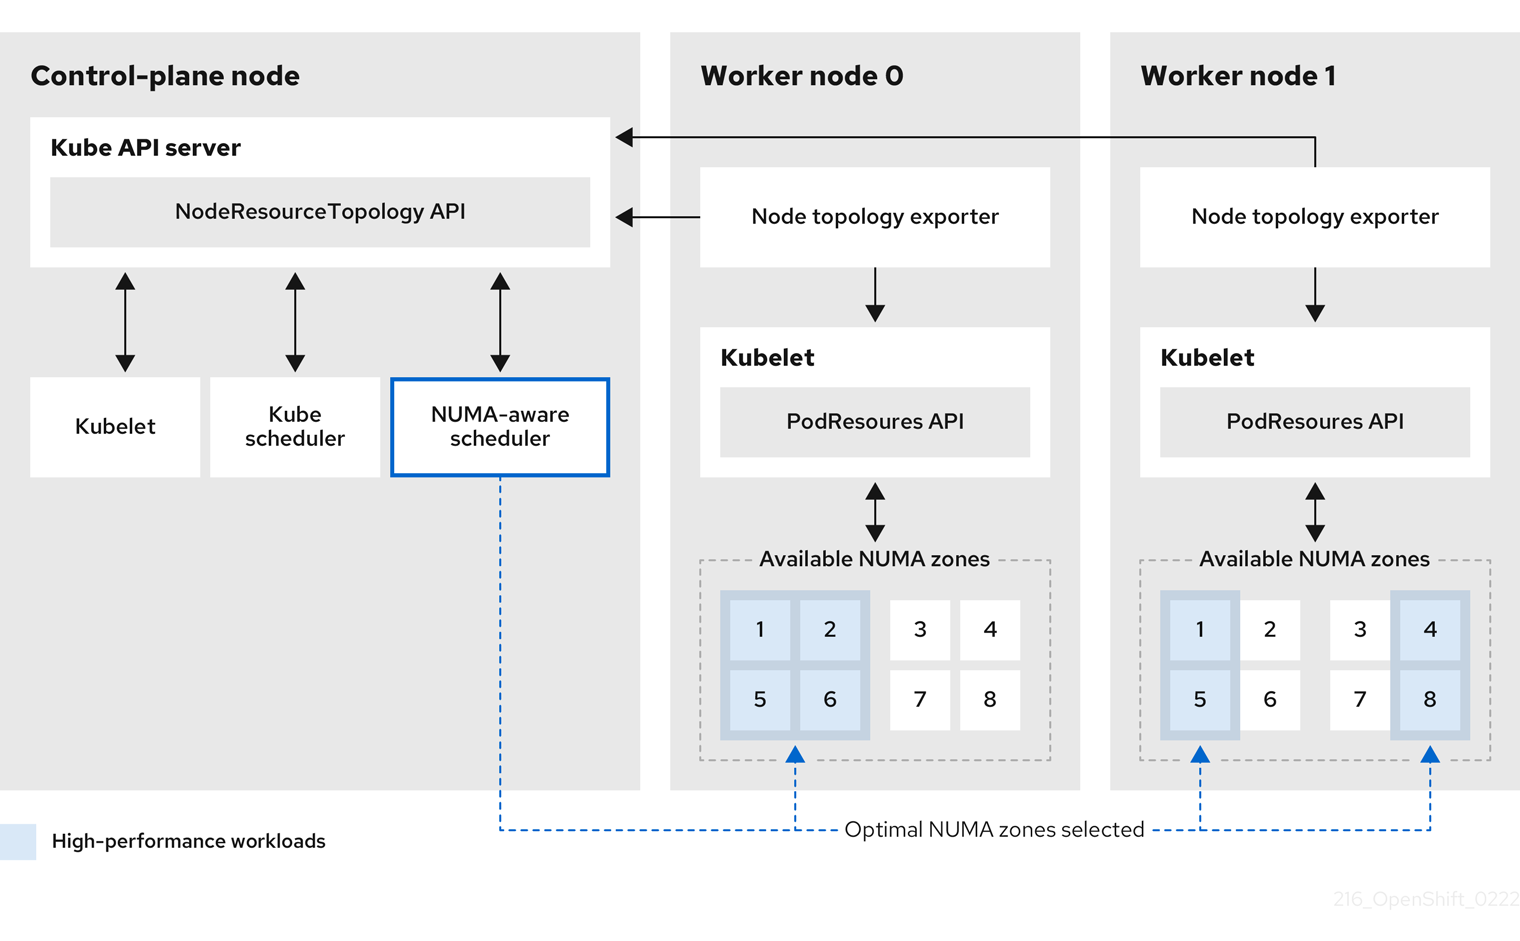
- NodeResourceTopology API
-
The
NodeResourceTopologyAPI describes the available NUMA zone resources in each compute node. - NUMA-aware scheduler
-
The NUMA-aware secondary scheduler receives information about the available NUMA zones from the
NodeResourceTopologyAPI and schedules high-performance workloads on a node where it can be optimally processed. - Node topology exporter
-
The node topology exporter exposes the available NUMA zone resources for each compute node to the
NodeResourceTopologyAPI. The node topology exporter daemon tracks the resource allocation from the kubelet by using thePodResourcesAPI. - PodResources API
-
The
PodResourcesAPI is local to each node and exposes the resource topology and available resources to the kubelet.
The List endpoint of the PodResources API exposes exclusive CPUs allocated to a particular container. The API does not expose CPUs that belong to a shared pool.
The GetAllocatableResources endpoint exposes allocatable resources available on a node.
9.3. NUMA resource scheduling strategies
To optimize the placement of high-performance workloads, the secondary scheduler uses NUMA-aware scoring strategies to select the most suitable compute nodes. This process assigns workloads based on resource availability while allowing local node managers to handle final resource pinning.
When scheduling high-performance workloads, the secondary scheduler determines which compute node is best suited for the task based on its internal NUMA resource distribution. While the scheduler uses NUMA-level data to score and select a compute node, the actual resource pinning within that node is managed by the local Topology Manager and CPU Manager.
- The scheduler first selects a suitable compute node based on cluster-wide criteria. For example taints, labels, or resource availability.
- After a compute node is selected, the scheduler evaluates its NUMA nodes and applies a scoring strategy to decide which NUMA node will handle the workload.
- After a workload is scheduled, the selected NUMA node’s resources are updated to reflect the allocation.
The default strategy applied is the LeastAllocated strategy. This assigns workloads to the NUMA node with the most available resources that is the least utilized NUMA node. The goal of this strategy is to spread workloads across NUMA nodes to reduce contention and avoid hotspots.
The following table summarizes the different strategies and their outcomes:
| Strategy | Description | Outcome |
|---|---|---|
|
| Favors compute nodes that contain NUMA zones with the most available resources. | Distributes workloads across the cluster to nodes with the highest available headroom. |
|
| Favors compute nodes where the requested resources fit into NUMA zones that are already highly utilized. | Consolidates workloads on already utilized nodes, potentially leaving other nodes idle. |
|
| Favors compute nodes with the most balanced CPU and memory usage across NUMA zones. | Prevents skewed usage patterns where one resource type, such as CPU, is exhausted while another, such as memory, remains idle. |
9.3.1. LeastAllocated strategy example
The LeastAllocated is the default strategy. This strategy assigns workloads to the NUMA node with the most available resources, minimizing resource contention and spreading workloads across NUMA nodes. This reduces hotspots and ensures sufficient headroom for high-priority tasks. Assume a compute node has two NUMA nodes, and the workload requires 4 vCPUs and 8 GB of memory:
| NUMA node | Total CPUs | Used CPUs | Total memory (GB) | Used memory (GB) | Available resources |
|---|---|---|---|---|---|
| NUMA 1 | 16 | 12 | 64 | 56 | 4 CPUs, 8 GB memory |
| NUMA 2 | 16 | 6 | 64 | 24 | 10 CPUs, 40 GB memory |
Because NUMA 2 has more available resources compared to NUMA 1, the workload is assigned to NUMA 2.
9.3.2. MostAllocated strategy example
The MostAllocated strategy consolidates workloads by assigning them to the NUMA node with the least available resources, which is the most utilized NUMA node. This approach helps free other NUMA nodes for energy efficiency or critical workloads requiring full isolation. This example uses the "Example initial NUMA nodes state" values listed in the LeastAllocated section.
The workload again requires 4 vCPUs and 8 GB memory. NUMA 1 has fewer available resources compared to NUMA 2, so the scheduler assigns the workload to NUMA 1, further utilizing its resources while leaving NUMA 2 idle or minimally loaded.
9.3.3. BalancedAllocation strategy example
The BalancedAllocation strategy assigns workloads to the NUMA node with the most balanced resource utilization across CPU and memory. The goal is to prevent imbalanced usage, such as high CPU utilization with underutilized memory. Assume a compute node has the following NUMA node states:
| NUMA node | CPU usage | Memory usage | BalancedAllocation score |
|---|---|---|---|
| NUMA 1 | 60% | 55% | High (more balanced) |
| NUMA 2 | 80% | 20% | Low (less balanced) |
NUMA 1 has a more balanced CPU and memory utilization compared to NUMA 2 and therefore, with the BalancedAllocation strategy in place, the workload is assigned to NUMA 1.
9.4. Installing the NUMA Resources Operator
NUMA Resources Operator deploys resources that allow you to schedule NUMA-aware workloads and deployments. You can install the NUMA Resources Operator using the OpenShift Container Platform CLI or the web console.
9.4.1. Installing the NUMA Resources Operator using the CLI
To enable NUMA-aware scheduling for high-performance workloads, install the NUMA Resources Operator by using the OpenShift CLI (oc). As a cluster administrator, you can deploy the Operator efficiently without using the web console.
Prerequisites
-
Installed the OpenShift CLI (
oc). -
Logged in as a user with
cluster-adminprivileges.
Procedure
Create a namespace for the NUMA Resources Operator:
Save the following YAML in the
nro-namespace.yamlfile:apiVersion: v1 kind: Namespace metadata: name: openshift-numaresources # ...Create the
NamespaceCR by running the following command:$ oc create -f nro-namespace.yaml
Create the Operator group for the NUMA Resources Operator:
Save the following YAML in the
nro-operatorgroup.yamlfile:apiVersion: operators.coreos.com/v1 kind: OperatorGroup metadata: name: numaresources-operator namespace: openshift-numaresources spec: targetNamespaces: - openshift-numaresources # ...Create the
OperatorGroupCR by running the following command:$ oc create -f nro-operatorgroup.yaml
Create the subscription for the NUMA Resources Operator:
Save the following YAML in the
nro-sub.yamlfile:apiVersion: operators.coreos.com/v1alpha1 kind: Subscription metadata: name: numaresources-operator namespace: openshift-numaresources spec: channel: "4.16" name: numaresources-operator source: redhat-operators sourceNamespace: openshift-marketplace # ...Create the
SubscriptionCR by running the following command:$ oc create -f nro-sub.yaml
Verification
Verify that the installation succeeded by inspecting the CSV resource in the
openshift-numaresourcesnamespace. Run the following command:$ oc get csv -n openshift-numaresourcesExample output
NAME DISPLAY VERSION REPLACES PHASE numaresources-operator.v4.16.2 numaresources-operator 4.16.2 Succeeded
9.4.2. Installing the NUMA Resources Operator using the web console
To enable NUMA-aware scheduling for high-performance workloads, install the NUMA Resources Operator by using the web console. As a cluster administrator, you can deploy the Operator through the graphical interface.
Procedure
Create a namespace for the NUMA Resources Operator:
- In the OpenShift Container Platform web console, click Administration → Namespaces.
-
Click Create Namespace, enter
openshift-numaresourcesin the Name field, and then click Create.
Install the NUMA Resources Operator:
- In the OpenShift Container Platform web console, click Operators → OperatorHub.
- Choose numaresources-operator from the list of available Operators, and then click Install.
-
In the Installed Namespaces field, select the
openshift-numaresourcesnamespace, and then click Install.
Optional: Verify that the NUMA Resources Operator installed successfully:
- Switch to the Operators → Installed Operators page.
Ensure that NUMA Resources Operator is listed in the
openshift-numaresourcesnamespace with a Status of InstallSucceeded.NoteDuring installation an Operator might display a Failed status. If the installation later succeeds with an InstallSucceeded message, you can ignore the Failed message.
If the Operator does not appear as installed, to troubleshoot further:
- Go to the Operators → Installed Operators page and inspect the Operator Subscriptions and Install Plans tabs for any failure or errors under Status.
-
Go to the Workloads → Pods page and check the logs for pods in the
defaultproject.
9.5. Scheduling NUMA-aware workloads
To process latency-sensitive and high-performance workloads efficiently, configure your OpenShift Container Platform cluster for NUMA-aware scheduling. This process aligns pods with specific NUMA zones to minimize network delays and maximize compute resource utilization.
Clusters running latency-sensitive workloads typically feature performance profiles that help to minimize workload latency and optimize performance. The NUMA-aware scheduler deploys workloads based on available node NUMA resources and with respect to any performance profile settings applied to the node. The combination of NUMA-aware deployments, and the performance profile of the workload, ensures that workloads are scheduled in a way that maximizes performance.
For the NUMA Resources Operator to be fully operational, you must deploy the NUMAResourcesOperator custom resource and the NUMA-aware secondary pod scheduler.
9.5.1. Creating the NUMAResourcesOperator custom resource
After you have installed the NUMA Resources Operator, you can create the NUMAResourcesOperator custom resource (CR). This CR instructs the NUMA Resources Operator to install all the cluster infrastructure that is needed to support the NUMA-aware scheduler, including daemon sets and APIs.
Prerequisites
-
Installed the OpenShift CLI (
oc). -
Logged in as a user with
cluster-adminprivileges. - Installed the NUMA Resources Operator.
Procedure
Create the
NUMAResourcesOperatorcustom resource:Save the following minimal required YAML file example as
nrop.yaml:apiVersion: nodetopology.openshift.io/v1 kind: NUMAResourcesOperator metadata: name: numaresourcesoperator spec: nodeGroups: - machineConfigPoolSelector: matchLabels: pools.operator.machineconfiguration.openshift.io/worker: "" # ...-
pools.operator.machineconfiguration.openshift.io/worker: Specifies a value that must match theMachineConfigPoolresource that you want to configure the NUMA Resources Operator on. For example, you might have created aMachineConfigPoolresource namedworker-cnfthat designates a set of nodes expected to run telecommunications workloads. EachNodeGroupmust match exactly oneMachineConfigPool. Configurations whereNodeGroupmatches more than oneMachineConfigPoolare not supported.
-
Create the
NUMAResourcesOperatorCR by running the following command:$ oc create -f nrop.yamlNoteCreating the
NUMAResourcesOperatortriggers a reboot on the corresponding machine config pool and therefore the affected node.
Optional: To enable NUMA-aware scheduling for multiple machine config pools (MCPs), define a separate
NodeGroupfor each pool. For example, define threeNodeGroupsforworker-cnf,worker-ht, andworker-other, in theNUMAResourcesOperatorCR as shown in the following example:Example YAML definition for a
NUMAResourcesOperatorCR with multipleNodeGroupsapiVersion: nodetopology.openshift.io/v1 kind: NUMAResourcesOperator metadata: name: numaresourcesoperator spec: logLevel: Normal nodeGroups: - machineConfigPoolSelector: matchLabels: machineconfiguration.openshift.io/role: worker-ht - machineConfigPoolSelector: matchLabels: machineconfiguration.openshift.io/role: worker-cnf - machineConfigPoolSelector: matchLabels: machineconfiguration.openshift.io/role: worker-other # ...
Verification
Verify that the NUMA Resources Operator deployed successfully by running the following command:
$ oc get numaresourcesoperators.nodetopology.openshift.ioExample output
NAME AGE numaresourcesoperator 27sAfter a few minutes, run the following command to verify that the required resources deployed successfully:
$ oc get all -n openshift-numaresourcesExample output
NAME READY STATUS RESTARTS AGE pod/numaresources-controller-manager-7d9d84c58d-qk2mr 1/1 Running 0 12m pod/numaresourcesoperator-worker-7d96r 2/2 Running 0 97s pod/numaresourcesoperator-worker-crsht 2/2 Running 0 97s pod/numaresourcesoperator-worker-jp9mw 2/2 Running 0 97s
9.5.2. Deploying the NUMA-aware secondary pod scheduler
To optimize the placement of high-performance workloads, deploy the NUMA-aware secondary pod scheduler. This component aligns pods with specific NUMA zones to ensure efficient resource utilization in your cluster.
Procedure
Create the
NUMAResourcesSchedulercustom resource that deploys the NUMA-aware custom pod scheduler:Save the following minimal required YAML in the
nro-scheduler.yamlfile:apiVersion: nodetopology.openshift.io/v1 kind: NUMAResourcesScheduler metadata: name: numaresourcesscheduler spec: imageSpec: "registry.redhat.io/openshift4/noderesourcetopology-scheduler-rhel9:v4.16" # ...-
spec.imageSpec: In a disconnected environment, make sure to configure the resolution of this image by either:
-
-
Create an
ImageTagMirrorSetcustom resource (CR). For more information, see "Configuring image registry repository mirroring" in the "Additional resources" section. - Set the URL to the disconnected registry.
Create the
NUMAResourcesSchedulerCR by running the following command:$ oc create -f nro-scheduler.yaml
After a few seconds, run the following command to confirm the successful deployment of the required resources:
$ oc get all -n openshift-numaresourcesExample output
NAME READY STATUS RESTARTS AGE pod/numaresources-controller-manager-7d9d84c58d-qk2mr 1/1 Running 0 12m pod/numaresourcesoperator-worker-7d96r 2/2 Running 0 97s pod/numaresourcesoperator-worker-crsht 2/2 Running 0 97s pod/numaresourcesoperator-worker-jp9mw 2/2 Running 0 97s pod/secondary-scheduler-847cb74f84-9whlm 1/1 Running 0 10m NAME DESIRED CURRENT READY UP-TO-DATE AVAILABLE NODE SELECTOR AGE daemonset.apps/numaresourcesoperator-worker 3 3 3 3 3 node-role.kubernetes.io/worker= 98s NAME READY UP-TO-DATE AVAILABLE AGE deployment.apps/numaresources-controller-manager 1/1 1 1 12m deployment.apps/secondary-scheduler 1/1 1 1 10m NAME DESIRED CURRENT READY AGE replicaset.apps/numaresources-controller-manager-7d9d84c58d 1 1 1 12m replicaset.apps/secondary-scheduler-847cb74f84 1 1 1 10m
Additional resources
9.5.3. Configuring a single NUMA node policy
To enable the NUMA Resources Operator, configure a single NUMA node policy on your cluster. You can implement this policy by creating a performance profile or by configuring a KubeletConfig custom resource (CR).
The preferred way to configure a single NUMA node policy is to apply a performance profile. You can use the Performance Profile Creator (PPC) tool to create the performance profile. If a performance profile is created on the cluster, the PPC tool automatically creates other tuning components like KubeletConfig and the tuned profile.
For more information about creating a performance profile, see "About the Performance Profile Creator" in the "Additional resources" section.
9.5.4. Sample performance profile
Reference an example YAML to understand how to use the performance profile creator (PPC) tool to create a performance profile.
apiVersion: performance.openshift.io/v2
kind: PerformanceProfile
metadata:
name: performance
spec:
cpu:
isolated: "3"
reserved: 0-2
machineConfigPoolSelector:
pools.operator.machineconfiguration.openshift.io/worker: ""
nodeSelector:
node-role.kubernetes.io/worker: ""
numa:
topologyPolicy: single-numa-node
realTimeKernel:
enabled: true
workloadHints:
highPowerConsumption: true
perPodPowerManagement: false
realTime: true-
spec.pools.operator.machineconfiguration.openshift.io/worker:: Specifies the value that must match theMachineConfigPoolvalue that you want to configure the NUMA Resources Operator on. For example, you might create aMachineConfigPoolobject namedworker-cnfthat designates a set of nodes that run telecommunications workloads. The value forMachineConfigPoolmust match themachineConfigPoolSelectorvalue in theNUMAResourcesOperatorCR that you configure later in "Creating the NUMAResourcesOperator custom resource". -
spec.numa.topologyPolicy:: Specifies that thetopologyPolicyfield is set tosingle-numa-nodeby setting thetopology-manager-policyargument tosingle-numa-nodewhen you run the PPC tool.
For hosted control plane clusters, the machineConfigPoolSelector does not have any functional effect. Node association is instead determined by the specified NodePool object.
9.5.5. Creating a KubeletConfig CR
To configure a single NUMA node policy, create and apply a KubeletConfig custom resource (CR). While applying a performance profile is recommended, you can use the alternative method to manually manage the configuration on your cluster.
Procedure
Create the
KubeletConfigcustom resource (CR) that configures the pod admittance policy for the machine profile:Save the following YAML in the
nro-kubeletconfig.yamlfile:apiVersion: machineconfiguration.openshift.io/v1 kind: KubeletConfig metadata: name: worker-tuning spec: machineConfigPoolSelector: matchLabels: pools.operator.machineconfiguration.openshift.io/worker: "" kubeletConfig: cpuManagerPolicy: "static" cpuManagerReconcilePeriod: "5s" reservedSystemCPUs: "0,1" memoryManagerPolicy: "Static" evictionHard: memory.available: "100Mi" kubeReserved: memory: "512Mi" reservedMemory: - numaNode: 0 limits: memory: "1124Mi" systemReserved: memory: "512Mi" topologyManagerPolicy: "single-numa-node"where:
spec.machineConfigPoolSelector.matchLabels.pools.operator.machineconfiguration.openshift.io/worker-
Specifies that this label matches the
machineConfigPoolSelectorsetting in theNUMAResourcesOperatorCR that you configure later in "Creating the NUMAResourcesOperator custom resource". spec.kubeletConfig.cpuManagerPolicy-
Specifies the
staticvalue. You must use a lowercases. spec.kubeletConfig.reservedSystemCPUs- Adjust the field based on the CPU on your nodes.
spec.kubeletConfig.memoryManagerPolicy-
Specifies
Static. You must use an uppercaseS. spec.kubeletConfig.topologyManagerPolicySpecifies the value as
single-numa-node.NoteFor hosted control plane clusters, the
machineConfigPoolSelectorsetting does not have any functional effect. Node association is instead determined by the specifiedNodePoolobject. To apply aKubeletConfigfor hosted control plane clusters, you must create aConfigMapthat contains the configuration, and then reference thatConfigMapwithin thespec.configfield of aNodePool.
Create the
KubeletConfigCR by running the following command:$ oc create -f nro-kubeletconfig.yamlNoteApplying performance profile or
KubeletConfigautomatically triggers rebooting of the nodes. If no reboot is triggered, you can troubleshoot the issue by looking at the labels inKubeletConfigthat address the node group.
9.5.6. Scheduling workloads with the NUMA-aware scheduler
To schedule workloads with the NUMA-aware scheduler, use deployment CRs that specify the minimum required resources. This ensures your cluster processes the workloads efficiently.
Before you schedule workloads with the NUMA-aware scheduler, ensure that you previouslu installed the topo-aware-scheduler, you applied the NUMAResourcesOperator and NUMAResourcesScheduler CRs, and that your cluster has a matching performance profile or kubeletconfig.
The example in the procedure uses NUMA-aware scheduling for a sample workload.
Prerequisites
-
Installed the OpenShift CLI (
oc). -
Logged in as a user with
cluster-adminprivileges.
Procedure
Get the name of the NUMA-aware scheduler that is deployed in the cluster by running the following command:
$ oc get numaresourcesschedulers.nodetopology.openshift.io numaresourcesscheduler -o json | jq '.status.schedulerName'Example output
"topo-aware-scheduler"Create a
DeploymentCR that uses scheduler namedtopo-aware-scheduler, for example:Save the following YAML in the
nro-deployment.yamlfile:apiVersion: apps/v1 kind: Deployment metadata: name: numa-deployment-1 namespace: openshift-numaresources spec: replicas: 1 selector: matchLabels: app: test template: metadata: labels: app: test spec: schedulerName: topo-aware-scheduler containers: - name: ctnr image: quay.io/openshifttest/hello-openshift:openshift imagePullPolicy: IfNotPresent resources: limits: memory: "100Mi" cpu: "10" requests: memory: "100Mi" cpu: "10" - name: ctnr2 image: registry.access.redhat.com/rhel:latest imagePullPolicy: IfNotPresent command: ["/bin/sh", "-c"] args: [ "while true; do sleep 1h; done;" ] resources: limits: memory: "100Mi" cpu: "8" requests: memory: "100Mi" cpu: "8"spec.schedulerName: Specifies the scheduler name that must match the name of the NUMA-aware scheduler that is deployed in your cluster, such astopo-aware-scheduler.Create the
DeploymentCR by running the following command:$ oc create -f nro-deployment.yaml
Verification
Verify that the deployment was successful:
$ oc get pods -n openshift-numaresourcesExample output
NAME READY STATUS RESTARTS AGE numa-deployment-1-6c4f5bdb84-wgn6g 2/2 Running 0 5m2s numaresources-controller-manager-7d9d84c58d-4v65j 1/1 Running 0 18m numaresourcesoperator-worker-7d96r 2/2 Running 4 43m numaresourcesoperator-worker-crsht 2/2 Running 2 43m numaresourcesoperator-worker-jp9mw 2/2 Running 2 43m secondary-scheduler-847cb74f84-fpncj 1/1 Running 0 18mVerify that the
topo-aware-scheduleris scheduling the deployed pod by running the following command:$ oc describe pod numa-deployment-1-6c4f5bdb84-wgn6g -n openshift-numaresourcesExample output
Events: Type Reason Age From Message ---- ------ ---- ---- ------- Normal Scheduled 4m45s topo-aware-scheduler Successfully assigned openshift-numaresources/numa-deployment-1-6c4f5bdb84-wgn6g to worker-1NoteDeployments that request more resources than is available for scheduling will fail with a
MinimumReplicasUnavailableerror. The deployment succeeds when the required resources become available. Pods remain in thePendingstate until the required resources are available.Verify that the expected allocated resources are listed for the node.
Identify the node that is running the deployment pod by running the following command:
$ oc get pods -n openshift-numaresources -o wideExample output
NAME READY STATUS RESTARTS AGE IP NODE NOMINATED NODE READINESS GATES numa-deployment-1-6c4f5bdb84-wgn6g 0/2 Running 0 82m 10.128.2.50 worker-1 <none> <none>Run the following command with the name of that node that is running the deployment pod.
$ oc describe noderesourcetopologies.topology.node.k8s.io worker-1Example output
... Zones: Costs: Name: node-0 Value: 10 Name: node-1 Value: 21 Name: node-0 Resources: Allocatable: 39 Available: 21 Capacity: 40 Name: cpu Allocatable: 6442450944 Available: 6442450944 Capacity: 6442450944 Name: hugepages-1Gi Allocatable: 134217728 Available: 134217728 Capacity: 134217728 Name: hugepages-2Mi Allocatable: 262415904768 Available: 262206189568 Capacity: 270146007040 Name: memory Type: NodeResources.Available: Specifies theAvailablecapacity that is reduced because of the resources that have been allocated to the guaranteed pod. Resources consumed by guaranteed pods are subtracted from the available node resources listed undernoderesourcetopologies.topology.node.k8s.io.
Resource allocations for pods with a
Best-effortorBurstablequality of service (qosClass) are not reflected in the NUMA node resources undernoderesourcetopologies.topology.node.k8s.io. If a pod’s consumed resources are not reflected in the node resource calculation, verify that the pod hasqosClassofGuaranteedand the CPU request is an integer value, not a decimal value. You can verify the that the pod has aqosClassofGuaranteedby running the following command:$ oc get pod numa-deployment-1-6c4f5bdb84-wgn6g -n openshift-numaresources -o jsonpath="{ .status.qosClass }"Example output
Guaranteed
9.6. Configuring polling operations for NUMA resources updates
As an optional task, you can improve scheduling behavior and troubleshoot suboptimal scheduling decisions by configuring the spec.nodeGroups specification in the NUMAResourcesOperator custom resource (CR). This configuration fine-tunes how daemons poll for available NUMA resources, providing advanced control over your polling operations.
The configuration options are listed as follows:
-
infoRefreshMode: Determines the trigger condition for polling the kubelet. The NUMA Resources Operator reports the resulting information to the API server. -
infoRefreshPeriod: Determines the duration between polling updates. -
podsFingerprinting: Determines if point-in-time information for the current set of pods running on a node is exposed in polling updates.
The default value for podsFingerprinting is EnabledExclusiveResources. To optimize scheduler performance, set podsFingerprinting to either EnabledExclusiveResources or Enabled. Additionally, configure the cacheResyncPeriod in the NUMAResourcesScheduler custom resource (CR) to a value greater than 0. The cacheResyncPeriod specification helps to report more exact resource availability by monitoring pending resources on nodes.
Prerequisites
-
Installed the OpenShift CLI (
oc). -
Logged in as a user with
cluster-adminprivileges. - Installed the NUMA Resources Operator.
Procedure
Configure the
spec.nodeGroupsspecification in yourNUMAResourcesOperatorCR:apiVersion: nodetopology.openshift.io/v1 kind: NUMAResourcesOperator metadata: name: numaresourcesoperator spec: nodeGroups: - config: infoRefreshMode: Periodic infoRefreshPeriod: 10s podsFingerprinting: Enabled name: worker # ...-
spec.nodeGroups.config.infoRefreshMode:: Valid values arePeriodic,Events,PeriodicAndEvents. UsePeriodicto poll the kubelet at intervals that you define ininfoRefreshPeriod. UseEventsto poll the kubelet at every pod lifecycle event. UsePeriodicAndEventsto enable both methods. -
spec.nodeGroups.config.infoRefreshPeriod:: Specifies the polling interval forPeriodicorPeriodicAndEventsrefresh modes. The field is ignored if the refresh mode isEvents. -
spec.nodeGroups.config.podsFingerprinting:: Valid values areEnabled,Disabled, andEnabledExclusiveResources. Setting toEnabledorEnabledExclusiveResourcesis a requirement for thecacheResyncPeriodspecification in theNUMAResourcesScheduler.
-
Verification
After you deploy the NUMA Resources Operator, verify that the node group configurations were applied by running the following command:
$ oc get numaresop numaresourcesoperator -o json | jq '.status'Example output
... "config": { "infoRefreshMode": "Periodic", "infoRefreshPeriod": "10s", "podsFingerprinting": "Enabled" }, "name": "worker" ...
9.7. Troubleshooting NUMA-aware scheduling
To resolve common problems with NUMA-aware pod scheduling, troubleshoot your cluster configuration. Identifying and fixing these issues ensures that your pods are optimally aligned with underlying hardware for high-performance workloads.
Prerequisites
-
Installed the OpenShift CLI (
oc). - Logged in as a user with cluster-admin privileges.
- Installed the NUMA Resources Operator and deploy the NUMA-aware secondary scheduler.
Procedure
Verify that the
noderesourcetopologiesCRD is deployed in the cluster by running the following command:$ oc get crd | grep noderesourcetopologiesExample output
NAME CREATED AT noderesourcetopologies.topology.node.k8s.io 2022-01-18T08:28:06ZCheck that the NUMA-aware scheduler name matches the name specified in your NUMA-aware workloads by running the following command:
$ oc get numaresourcesschedulers.nodetopology.openshift.io numaresourcesscheduler -o json | jq '.status.schedulerName'Example output
topo-aware-schedulerVerify that NUMA-aware schedulable nodes have the
noderesourcetopologiesCR applied to them. Run the following command:$ oc get noderesourcetopologies.topology.node.k8s.ioExample output
NAME AGE compute-0.example.com 17h compute-1.example.com 17hNoteThe number of nodes should equal the number of worker nodes that are configured by the machine config pool (
mcp) worker definition.Verify the NUMA zone granularity for all schedulable nodes by running the following command:
$ oc get noderesourcetopologies.topology.node.k8s.io -o yamlExample output
apiVersion: v1 items: - apiVersion: topology.node.k8s.io/v1 kind: NodeResourceTopology metadata: annotations: k8stopoawareschedwg/rte-update: periodic creationTimestamp: "2022-06-16T08:55:38Z" generation: 63760 name: worker-0 resourceVersion: "8450223" uid: 8b77be46-08c0-4074-927b-d49361471590 topologyPolicies: - SingleNUMANodeContainerLevel zones: - costs: - name: node-0 value: 10 - name: node-1 value: 21 name: node-0 resources: - allocatable: "38" available: "38" capacity: "40" name: cpu - allocatable: "134217728" available: "134217728" capacity: "134217728" name: hugepages-2Mi - allocatable: "262352048128" available: "262352048128" capacity: "270107316224" name: memory - allocatable: "6442450944" available: "6442450944" capacity: "6442450944" name: hugepages-1Gi type: Node - costs: - name: node-0 value: 21 - name: node-1 value: 10 name: node-1 resources: - allocatable: "268435456" available: "268435456" capacity: "268435456" name: hugepages-2Mi - allocatable: "269231067136" available: "269231067136" capacity: "270573244416" name: memory - allocatable: "40" available: "40" capacity: "40" name: cpu - allocatable: "1073741824" available: "1073741824" capacity: "1073741824" name: hugepages-1Gi type: Node - apiVersion: topology.node.k8s.io/v1 kind: NodeResourceTopology metadata: annotations: k8stopoawareschedwg/rte-update: periodic creationTimestamp: "2022-06-16T08:55:37Z" generation: 62061 name: worker-1 resourceVersion: "8450129" uid: e8659390-6f8d-4e67-9a51-1ea34bba1cc3 topologyPolicies: - SingleNUMANodeContainerLevel zones: - costs: - name: node-0 value: 10 - name: node-1 value: 21 name: node-0 resources: - allocatable: "38" available: "38" capacity: "40" name: cpu - allocatable: "6442450944" available: "6442450944" capacity: "6442450944" name: hugepages-1Gi - allocatable: "134217728" available: "134217728" capacity: "134217728" name: hugepages-2Mi - allocatable: "262391033856" available: "262391033856" capacity: "270146301952" name: memory type: Node - costs: - name: node-0 value: 21 - name: node-1 value: 10 name: node-1 resources: - allocatable: "40" available: "40" capacity: "40" name: cpu - allocatable: "1073741824" available: "1073741824" capacity: "1073741824" name: hugepages-1Gi - allocatable: "268435456" available: "268435456" capacity: "268435456" name: hugepages-2Mi - allocatable: "269192085504" available: "269192085504" capacity: "270534262784" name: memory type: Node kind: List metadata: resourceVersion: "" selfLink: "" # ...-
zones: Each stanza underzonesdescribes the resources for a single NUMA zone. -
costs.resources: Specifies the current state of the NUMA zone resources. Check that resources listed underitems.zones.resources.availablecorrespond to the exclusive NUMA zone resources allocated to each guaranteed pod.
-
9.7.1. Reporting more exact resource availability
To report more exact resource availability and minimize Topology Affinity Errors, enable the cacheResyncPeriod specification for the NUMA Resources Operator. This configuration monitors pending resources on nodes and synchronizes them in the scheduler cache, though lower intervals increase network load.
The lower the interval, the greater the network load. The cacheResyncPeriod specification is disabled by default.
Prerequisites
-
Installed the OpenShift CLI (
oc). -
You are logged in as a user with
cluster-adminprivileges.
Procedure
Delete the currently running
NUMAResourcesSchedulerresource:Get the active
NUMAResourcesSchedulerby running the following command:$ oc get NUMAResourcesSchedulerExample output
NAME AGE numaresourcesscheduler 92mDelete the secondary scheduler resource by running the following command:
$ oc delete NUMAResourcesScheduler numaresourcesschedulerExample output
numaresourcesscheduler.nodetopology.openshift.io "numaresourcesscheduler" deleted
Save the following YAML in the file
nro-scheduler-cacheresync.yaml. This example changes the log level toDebug:apiVersion: nodetopology.openshift.io/v1 kind: NUMAResourcesScheduler metadata: name: numaresourcesscheduler spec: imageSpec: "registry.redhat.io/openshift4/noderesourcetopology-scheduler-container-rhel8:v4.16" cacheResyncPeriod: "5s"-
spec.cacheResyncPeriod: Enter an interval value in seconds for synchronization of the scheduler cache. A value of5sis typical for most implementations.
-
Create the updated
NUMAResourcesSchedulerresource by running the following command:$ oc create -f nro-scheduler-cacheresync.yamlExample output
numaresourcesscheduler.nodetopology.openshift.io/numaresourcesscheduler created
Verification
Check that the NUMA-aware scheduler was successfully deployed:
Run the following command to check that the CRD is created successfully:
$ oc get crd | grep numaresourcesschedulersExample output
NAME CREATED AT numaresourcesschedulers.nodetopology.openshift.io 2022-02-25T11:57:03ZCheck that the new custom scheduler is available by running the following command:
$ oc get numaresourcesschedulers.nodetopology.openshift.ioExample output
NAME AGE numaresourcesscheduler 3h26m
Check that the logs for the scheduler show the increased log level:
Get the list of pods running in the
openshift-numaresourcesnamespace by running the following command:$ oc get pods -n openshift-numaresourcesExample output
NAME READY STATUS RESTARTS AGE numaresources-controller-manager-d87d79587-76mrm 1/1 Running 0 46h numaresourcesoperator-worker-5wm2k 2/2 Running 0 45h numaresourcesoperator-worker-pb75c 2/2 Running 0 45h secondary-scheduler-7976c4d466-qm4sc 1/1 Running 0 21mGet the logs for the secondary scheduler pod by running the following command:
$ oc logs secondary-scheduler-7976c4d466-qm4sc -n openshift-numaresourcesExample output
... I0223 11:04:55.614788 1 reflector.go:535] k8s.io/client-go/informers/factory.go:134: Watch close - *v1.Namespace total 11 items received I0223 11:04:56.609114 1 reflector.go:535] k8s.io/client-go/informers/factory.go:134: Watch close - *v1.ReplicationController total 10 items received I0223 11:05:22.626818 1 reflector.go:535] k8s.io/client-go/informers/factory.go:134: Watch close - *v1.StorageClass total 7 items received I0223 11:05:31.610356 1 reflector.go:535] k8s.io/client-go/informers/factory.go:134: Watch close - *v1.PodDisruptionBudget total 7 items received I0223 11:05:31.713032 1 eventhandlers.go:186] "Add event for scheduled pod" pod="openshift-marketplace/certified-operators-thtvq" I0223 11:05:53.461016 1 eventhandlers.go:244] "Delete event for scheduled pod" pod="openshift-marketplace/certified-operators-thtvq"
9.7.2. Changing where high-performance workloads run
To optimize the processing of high-performance workloads, change the default placement behavior of the NUMA-aware secondary scheduler. With this configuration, you can assign workloads to a specific NUMA node within a compute node instead of relying on default resource availability.
If you want to change where the workloads run, you can add the scoringStrategy setting to the NUMAResourcesScheduler custom resource and set its value to either MostAllocated or BalancedAllocation.
Prerequisites
-
Installed the OpenShift CLI (
oc). -
Logged in as a user with
cluster-adminprivileges.
Procedure
Delete the currently running
NUMAResourcesSchedulerresource by using the following steps:Get the active
NUMAResourcesSchedulerby running the following command:$ oc get NUMAResourcesSchedulerExample output
NAME AGE numaresourcesscheduler 92mDelete the secondary scheduler resource by running the following command:
$ oc delete NUMAResourcesScheduler numaresourcesschedulerExample output
numaresourcesscheduler.nodetopology.openshift.io "numaresourcesscheduler" deleted
Save the following YAML in the file
nro-scheduler-mostallocated.yaml. This example changes thescoringStrategytoMostAllocated:apiVersion: nodetopology.openshift.io/v1 kind: NUMAResourcesScheduler metadata: name: numaresourcesscheduler spec: imageSpec: "registry.redhat.io/openshift4/noderesourcetopology-scheduler-container-rhel8:v{product-version}" scoringStrategy: type: "MostAllocated" # ...spec.imageSpec.scoringStrategy: If thescoringStrategyconfiguration is omitted, the default ofLeastAllocatedapplies.Create the updated
NUMAResourcesSchedulerresource by running the following command:$ oc create -f nro-scheduler-mostallocated.yamlExample output
numaresourcesscheduler.nodetopology.openshift.io/numaresourcesscheduler created
Verification
Check that the NUMA-aware scheduler was successfully deployed by using the following steps:
Run the following command to check that the custom resource definition (CRD) is created successfully:
$ oc get crd | grep numaresourcesschedulersExample output
NAME CREATED AT numaresourcesschedulers.nodetopology.openshift.io 2022-02-25T11:57:03ZCheck that the new custom scheduler is available by running the following command:
$ oc get numaresourcesschedulers.nodetopology.openshift.ioExample output
NAME AGE numaresourcesscheduler 3h26m
Verify that the
ScoringStrategyhas been applied correctly by running the following command to check the relevantConfigMapresource for the scheduler:$ oc get -n openshift-numaresources cm topo-aware-scheduler-config -o yaml | grep scoring -A 1Example output
scoringStrategy: type: MostAllocated
9.7.3. Checking the NUMA-aware scheduler logs
To troubleshoot problems with the NUMA-aware scheduler, review the scheduler logs. If necessary, increase the log level in the NUMAResourcesScheduler custom resource (CR) to capture more detailed diagnostic data.
Acceptable values are Normal, Debug, and Trace, with Trace being the most verbose option.
To change the log level of the secondary scheduler, delete the running scheduler resource and re-deploy it with the changed log level. The scheduler is unavailable for scheduling new workloads during this downtime.
Prerequisites
-
Installed the OpenShift CLI (
oc). -
You are logged in as a user with
cluster-adminprivileges.
Procedure
Delete the currently running
NUMAResourcesSchedulerresource:Get the active
NUMAResourcesSchedulerby running the following command:$ oc get NUMAResourcesSchedulerExample output
NAME AGE numaresourcesscheduler 90mDelete the secondary scheduler resource by running the following command:
$ oc delete NUMAResourcesScheduler numaresourcesschedulerExample output
numaresourcesscheduler.nodetopology.openshift.io "numaresourcesscheduler" deleted
Save the following YAML in the file
nro-scheduler-debug.yaml. This example changes the log level toDebug:apiVersion: nodetopology.openshift.io/v1 kind: NUMAResourcesScheduler metadata: name: numaresourcesscheduler spec: imageSpec: "registry.redhat.io/openshift4/noderesourcetopology-scheduler-container-rhel8:v4.16" logLevel: Debug # ...Create the updated
DebugloggingNUMAResourcesSchedulerresource by running the following command:$ oc create -f nro-scheduler-debug.yamlExample output
numaresourcesscheduler.nodetopology.openshift.io/numaresourcesscheduler created
Verification
Check that the NUMA-aware scheduler was successfully deployed:
Run the following command to check that the CRD is created successfully:
$ oc get crd | grep numaresourcesschedulersExample output
NAME CREATED AT numaresourcesschedulers.nodetopology.openshift.io 2022-02-25T11:57:03ZCheck that the new custom scheduler is available by running the following command:
$ oc get numaresourcesschedulers.nodetopology.openshift.ioExample output
NAME AGE numaresourcesscheduler 3h26m
Check that the logs for the scheduler shows the increased log level:
Get the list of pods running in the
openshift-numaresourcesnamespace by running the following command:$ oc get pods -n openshift-numaresourcesExample output
NAME READY STATUS RESTARTS AGE numaresources-controller-manager-d87d79587-76mrm 1/1 Running 0 46h numaresourcesoperator-worker-5wm2k 2/2 Running 0 45h numaresourcesoperator-worker-pb75c 2/2 Running 0 45h secondary-scheduler-7976c4d466-qm4sc 1/1 Running 0 21mGet the logs for the secondary scheduler pod by running the following command:
$ oc logs secondary-scheduler-7976c4d466-qm4sc -n openshift-numaresourcesExample output
... I0223 11:04:55.614788 1 reflector.go:535] k8s.io/client-go/informers/factory.go:134: Watch close - *v1.Namespace total 11 items received I0223 11:04:56.609114 1 reflector.go:535] k8s.io/client-go/informers/factory.go:134: Watch close - *v1.ReplicationController total 10 items received I0223 11:05:22.626818 1 reflector.go:535] k8s.io/client-go/informers/factory.go:134: Watch close - *v1.StorageClass total 7 items received I0223 11:05:31.610356 1 reflector.go:535] k8s.io/client-go/informers/factory.go:134: Watch close - *v1.PodDisruptionBudget total 7 items received I0223 11:05:31.713032 1 eventhandlers.go:186] "Add event for scheduled pod" pod="openshift-marketplace/certified-operators-thtvq" I0223 11:05:53.461016 1 eventhandlers.go:244] "Delete event for scheduled pod" pod="openshift-marketplace/certified-operators-thtvq"
9.7.4. Troubleshooting the resource topology exporter
To resolve unexpected results in noderesourcetopologies objects, inspect the resource-topology-exporter logs. Reviewing this diagnostic data helps you identify and fix configuration issues within your cluster.
Ensure that the NUMA resource topology exporter instances in the cluster are named for nodes they refer to. For example, a compute node with the name worker should have a corresponding noderesourcetopologies object called worker.
Prerequisites
-
Install the OpenShift CLI (
oc). -
Log in as a user with
cluster-adminprivileges.
Procedure
Get the daemonsets managed by the NUMA Resources Operator. Each daemonset has a corresponding
nodeGroupin theNUMAResourcesOperatorCR. Run the following command:$ oc get numaresourcesoperators.nodetopology.openshift.io numaresourcesoperator -o jsonpath="{.status.daemonsets[0]}"Example output
{"name":"numaresourcesoperator-worker","namespace":"openshift-numaresources"}Get the label for the daemonset of interest using the value for
namefrom the previous step:$ oc get ds -n openshift-numaresources numaresourcesoperator-worker -o jsonpath="{.spec.selector.matchLabels}"Example output
{"name":"resource-topology"}Get the pods using the
resource-topologylabel by running the following command:$ oc get pods -n openshift-numaresources -l name=resource-topology -o wideExample output
NAME READY STATUS RESTARTS AGE IP NODE numaresourcesoperator-worker-5wm2k 2/2 Running 0 2d1h 10.135.0.64 compute-0.example.com numaresourcesoperator-worker-pb75c 2/2 Running 0 2d1h 10.132.2.33 compute-1.example.comExamine the logs of the
resource-topology-exportercontainer running on the worker pod that corresponds to the node you are troubleshooting. Run the following command:$ oc logs -n openshift-numaresources -c resource-topology-exporter numaresourcesoperator-worker-pb75cExample output
I0221 13:38:18.334140 1 main.go:206] using sysinfo: reservedCpus: 0,1 reservedMemory: "0": 1178599424 I0221 13:38:18.334370 1 main.go:67] === System information === I0221 13:38:18.334381 1 sysinfo.go:231] cpus: reserved "0-1" I0221 13:38:18.334493 1 sysinfo.go:237] cpus: online "0-103" I0221 13:38:18.546750 1 main.go:72] cpus: allocatable "2-103" hugepages-1Gi: numa cell 0 -> 6 numa cell 1 -> 1 hugepages-2Mi: numa cell 0 -> 64 numa cell 1 -> 128 memory: numa cell 0 -> 45758Mi numa cell 1 -> 48372Mi
9.7.5. Correcting a missing resource topology exporter config map
To correct a missing config map for the resource topology exporter (RTE), resolve misconfigured settings in your cluster. Fixing this issue ensures the NUMA Resources Operator functions properly when the logs of the RTE daemon set pods indicate missing configurations.
The following example log message indicates a missing configuration:
Info: couldn't find configuration in "/etc/resource-topology-exporter/config.yaml"
The previous log message indicates that the kubeletconfig with the required configuration was not properly applied in the cluster, resulting in a missing RTE configmap. For example, the following cluster is missing a numaresourcesoperator-worker configmap custom resource (CR):
$ oc get configmapExample output:
NAME DATA AGE
0e2a6bd3.openshift-kni.io 0 6d21h
kube-root-ca.crt 1 6d21h
openshift-service-ca.crt 1 6d21h
topo-aware-scheduler-config 1 6d18h
In a correctly configured cluster, oc get configmap also returns a numaresourcesoperator-worker configmap CR.
Prerequisites
-
Installed the OpenShift CLI (
oc). - Logged in as a user with cluster-admin privileges.
- Installed the NUMA Resources Operator and deploy the NUMA-aware secondary scheduler.
Procedure
Compare the values for
spec.machineConfigPoolSelector.matchLabelsinkubeletconfigandmetadata.labelsin theMachineConfigPool(mcp) worker CR using the following commands:Check the
kubeletconfiglabels by running the following command:$ oc get kubeletconfig -o yamlExample output
machineConfigPoolSelector: matchLabels: cnf-worker-tuning: enabledCheck the
mcplabels by running the following command:$ oc get mcp worker -o yamlExample output
labels: machineconfiguration.openshift.io/mco-built-in: "" pools.operator.machineconfiguration.openshift.io/worker: ""The
cnf-worker-tuning: enabledlabel is not present in theMachineConfigPoolobject.
Edit the
MachineConfigPoolCR to include the missing label, for example:$ oc edit mcp worker -o yamlExample output
labels: machineconfiguration.openshift.io/mco-built-in: "" pools.operator.machineconfiguration.openshift.io/worker: "" cnf-worker-tuning: enabled- Apply the label changes and wait for the cluster to apply the updated configuration.
Verification
Check that the missing
numaresourcesoperator-workerconfigmapCR is applied:$ oc get configmapExample output
NAME DATA AGE 0e2a6bd3.openshift-kni.io 0 6d21h kube-root-ca.crt 1 6d21h numaresourcesoperator-worker 1 5m openshift-service-ca.crt 1 6d21h topo-aware-scheduler-config 1 6d18h
9.7.6. Collecting NUMA Resources Operator data
You can use the oc adm must-gather CLI command to collect information about your cluster, including features and objects associated with the NUMA Resources Operator.
Prerequisites
-
You have access to the cluster as a user with the
cluster-adminrole. -
You have installed the OpenShift CLI (
oc).
Procedure
To collect NUMA Resources Operator data with
must-gather, you must specify the NUMA Resources Operatormust-gatherimage.$ oc adm must-gather --image=registry.redhat.io/openshift4/numaresources-must-gather-rhel9:v4.16
Chapter 10. Scalability and performance optimization
10.1. Optimizing storage
Optimizing storage helps to minimize storage use across all resources. By optimizing storage, administrators help ensure that existing storage resources are working in an efficient manner.
10.1.1. Available persistent storage options
To optimize your OpenShift Container Platform environment, review the available persistent storage options. By understanding these choices, you can select the appropriate storage configuration to meet your specific workload requirements.
| Storage type | Description | Examples |
|---|---|---|
| Block |
| AWS EBS and VMware vSphere support dynamic persistent volume (PV) provisioning natively in OpenShift Container Platform. |
| File |
| RHEL NFS, NetApp NFS, and Vendor NFS. |
| Object |
| AWS S3. |
-
File: NetApp NFS supports dynamic PV provisioning when using the Trident plugin.
10.1.2. Recommended configurable storage technology
To select the optimal storage solution for your OpenShift Container Platform cluster application, review the recommended and configurable storage technologies. By reviewing this summary, you can identify the supported options that best meet your specific workload requirements.
| Storage type | Block | File | Object |
|---|---|---|---|
| ROX | Yes | Yes | Yes |
| RWX | No | Yes | Yes |
| Registry | Configurable | Configurable | Recommended |
| Scaled registry | Not configurable | Configurable | Recommended |
| Metrics | Recommended | Configurable | Not configurable |
| Elasticsearch Logging | Recommended | Configurable | Not supported |
| Loki Logging | Not configurable | Not configurable | Recommended |
| Apps | Recommended | Recommended | Not configurable |
where:
ROX-
Specifies
ReadOnlyManyaccess mode. ROX.Yes- Specifies that this access mode
RWX-
Specifies
ReadWriteManyaccess mode. Metrics- Specifies Prometheus as the underlying technology used for metrics.
Metrics.Configurable-
For metrics, using file storage with the
ReadWriteMany(RWX) access mode is unreliable. If you use file storage, do not configure the RWX access mode on any persistent volume claims (PVCs) that are configured for use with metrics. Elasticsearch Logging.Configurable- For logging, review the recommended storage solution in Configuring persistent storage for the log store section. Using NFS storage as a persistent volume or through NAS, such as Gluster, can corrupt the data. Therefore, NFS is not supported for Elasticsearch storage and LokiStack log store in OpenShift Container Platform Logging. You must use one persistent volume type per log store.
Apps.Not configurable- Specifies that object storage is not consumed through PVs or PVCs of OpenShift Container Platform. Apps must integrate with the object storage REST API.
A scaled registry is an OpenShift image registry where two or more pod replicas are running.
10.1.2.1. Specific application storage recommendations
To select the optimal storage solution for your OpenShift Container Platform cluster application, review the recommended and configurable storage technologies. By understanding these recommendations, you can identify the supported options that best meet your specific workload requirements.
Testing shows issues with using the NFS server on Red Hat Enterprise Linux (RHEL) as a storage backend for core services. This includes the OpenShift Container Registry and Quay, Prometheus for monitoring storage, and Elasticsearch for logging storage. Therefore, using RHEL NFS to back PVs used by core services is not recommended.
Other NFS implementations in the marketplace might not have these issues. Contact the individual NFS implementation vendor for more information on any testing that was possibly completed against these OpenShift Container Platform core components.
- Registry
In a non-scaled/high-availability (HA) OpenShift image registry cluster deployment:
- The storage technology does not have to support RWX access mode.
- The storage technology must ensure read-after-write consistency.
- The preferred storage technology is object storage followed by block storage.
- File storage is not recommended for OpenShift image registry cluster deployment with production workloads.
- Scaled registry
In a scaled/HA OpenShift image registry cluster deployment:
- The storage technology must support RWX access mode.
- The storage technology must ensure read-after-write consistency.
- The preferred storage technology is object storage.
- Red Hat OpenShift Data Foundation, Amazon Simple Storage Service (Amazon S3), Google Cloud Storage (GCS), Microsoft Azure Blob Storage, and OpenStack Swift are supported.
- Object storage should be S3 or Swift compliant.
- For non-cloud platforms, such as vSphere and bare-metal installations, the only configurable technology is file storage.
- Block storage is not configurable.
- The use of Network File System (NFS) storage with OpenShift Container Platform is supported. However, the use of NFS storage with a scaled registry can cause known issues. For more information, see the "Is NFS supported for OpenShift cluster internal components in Production?" Red Hat Knowledgebase solution.
- Metrics
In an OpenShift Container Platform hosted metrics cluster deployment:
- The preferred storage technology is block storage.
- Object storage is not configurable.
It is not recommended to use file storage for a hosted metrics cluster deployment with production workloads.
- Logging
In an OpenShift Container Platform hosted logging cluster deployment:
Loki Operator:
- The preferred storage technology is S3 compatible Object storage.
- Block storage is not configurable.
OpenShift Elasticsearch Operator:
- The preferred storage technology is block storage.
- Object storage is not supported.
As of logging version 5.4.3 the OpenShift Elasticsearch Operator is deprecated and is planned to be removed in a future release. Red Hat will provide bug fixes and support for this feature during the current release lifecycle, but this feature will no longer receive enhancements and will be removed. As an alternative to using the OpenShift Elasticsearch Operator to manage the default log storage, you can use the Loki Operator.
- Applications
Application use cases vary from application to application, as described in the following examples:
- Storage technologies that support dynamic PV provisioning have low mount time latencies, and are not tied to nodes to support a healthy cluster.
- Application developers are responsible for knowing and understanding the storage requirements for their application, and how it works with the provided storage to ensure that issues do not occur when an application scales or interacts with the storage layer.
- Other specific application storage recommendations
Red Hat does not recommend using RAID configurations on Write intensive workloads, such as etcd. If you are running etcd with a RAID configuration, you might be at risk of encountering performance issues with your workloads.
- Red Hat OpenStack Platform (RHOSP) Cinder: RHOSP Cinder tends to be adept at ROX access mode use cases.
- Databases: Databases (RDBMSs, NoSQL DBs, etc.) tend to perform best with dedicated block storage.
- The etcd database must have enough storage and adequate performance capacity to enable a large cluster. Information about monitoring and benchmarking tools to establish ample storage and a high-performance environment is described in Recommended etcd practices.
10.1.4. Data storage management
To effectively manage data storage in OpenShift Container Platform, review the main directories where components write data. By viewing this reference, you can identify the specific paths used by system components, so that you can plan for capacity requirements and perform necessary maintenance.
The following table summarizes the main directories that OpenShift Container Platform components write data to.
| Directory | Notes | Sizing | Expected growth |
|---|---|---|---|
| /var/lib/etcd | Used for etcd storage when storing the database. | Less than 20 GB. Database can grow up to 8 GB. | Will grow slowly with the environment. Only storing metadata. Additional 20-25 GB for every additional 8 GB of memory. |
| /var/lib/containers | This is the mount point for the CRI-O runtime. Storage used for active container runtimes, including pods, and storage of local images. Not used for registry storage. | 50 GB for a node with 16 GB memory. Note that this sizing should not be used to determine minimum cluster requirements. Additional 20-25 GB for every additional 8 GB of memory. | Growth is limited by capacity for running containers. |
| /var/lib/kubelet | Ephemeral volume storage for pods. This includes anything external that is mounted into a container at runtime. Includes environment variables, kube secrets, and data volumes not backed by persistent volumes. | Varies | Minimal if pods requiring storage are using persistent volumes. If using ephemeral storage, this can grow quickly. |
| /var/log | Log files for all components. | 10 to 30 GB. | Log files can grow quickly; size can be managed by growing disks or by using log rotate. |
10.1.5. Optimizing storage performance for Microsoft Azure
To ensure optimal cluster performance on Microsoft Azure, configure faster storage for OpenShift Container Platform and Kubernetes. Prioritize high-performance disks for etcd on the control plane nodes, as these components are sensitive to disk latency.
For production Azure clusters and clusters with intensive workloads, the virtual machine operating system disk for control plane machines should be able to sustain a tested and recommended minimum throughput of 5000 IOPS / 200 MBps. This throughput can be provided by having a minimum of 1 TiB Premium SSD (P30). In Azure and Azure Stack Hub, disk performance is directly dependent on SSD disk sizes. To achieve the throughput supported by a Standard_D8s_v3 virtual machine, or other similar machine types, and the target of 5000 IOPS, at least a P30 disk is required.
Host caching must be set to ReadOnly for low latency and high IOPS and throughput when reading data. Reading data from the cache, which is present either in the VM memory or in the local SSD disk, is much faster than reading from the disk, which is in the blob storage.
10.2. Optimizing routing
To optimize performance, scale or configure the OpenShift Container Platform HAProxy router. By doing this task, you can ensure efficient traffic management and accommodate specific workload requirements.
10.2.1. Baseline Ingress Controller (router) performance
To establish a performance baseline, review the role of the OpenShift Container Platform Ingress Controller. As the router for your cluster, this component serves as the entry point for ingress traffic, directing requests to applications and services configured by using routes and ingresses.
When evaluating a single HAProxy router performance in terms of HTTP requests handled per second, the performance varies depending on many factors. In particular:
- HTTP keep-alive/close mode
- Route type
- TLS session resumption client support
- Number of concurrent connections per target route
- Number of target routes
- Back end server page size
- Underlying infrastructure (network/SDN solution, CPU, and so on)
While performance in your specific environment will vary, Red Hat lab tests on a public cloud instance of size 4 vCPU/16GB RAM. A single HAProxy router handling 100 routes terminated by backends serving 1kB static pages is able to handle the following number of transactions per second.
In HTTP keep-alive mode scenarios:
| Encryption | LoadBalancerService | HostNetwork |
|---|---|---|
| none | 21515 | 29622 |
| edge | 16743 | 22913 |
| passthrough | 36786 | 53295 |
| re-encrypt | 21583 | 25198 |
In HTTP close (no keep-alive) scenarios:
| Encryption | LoadBalancerService | HostNetwork |
|---|---|---|
| none | 5719 | 8273 |
| edge | 2729 | 4069 |
| passthrough | 4121 | 5344 |
| re-encrypt | 2320 | 2941 |
The default Ingress Controller configuration was used with the spec.tuningOptions.threadCount field set to 4. Two different endpoint publishing strategies were tested: Load Balancer Service and Host Network. TLS session resumption was used for encrypted routes. With HTTP keep-alive, a single HAProxy router is capable of saturating a 1 Gbit NIC at page sizes as small as 8 kB.
When running on bare metal with modern processors, you can expect roughly twice the performance of the public cloud instance above. This overhead is introduced by the virtualization layer in place on public clouds and holds mostly true for private cloud-based virtualization as well. The following table is a guide to how many applications to use behind the router:
| Number of applications | Application type |
|---|---|
| 5-10 | static file/web server or caching proxy |
| 100-1000 | applications generating dynamic content |
In general, HAProxy can support routes for up to 1000 applications, depending on the technology in use. Ingress Controller performance might be limited by the capabilities and performance of the applications behind it, such as language or static versus dynamic content.
Ingress, or router, sharding should be used to serve more routes towards applications and help horizontally scale the routing tier.
10.2.3. Configuring Ingress Controller liveness, readiness, and startup probes
To ensure accurate health monitoring for your router deployments, configure the timeout values for liveness, readiness, and startup probes. By doing this task, you can adjust the default settings used by the OpenShift Container Platform Ingress Controller to better suit your environment.
The liveness and readiness probes of the router use the default timeout value of 1 second, which is too brief when networking or runtime performance is severely degraded. Probe timeouts can cause unwanted router restarts that interrupt application connections. The ability to set larger timeout values can reduce the risk of unnecessary and unwanted restarts.
You can update the timeoutSeconds value on the livenessProbe, readinessProbe, and startupProbe parameters of the router container.
| Parameter | Description |
|---|---|
|
|
The |
|
|
The |
|
|
The |
The timeout configuration option is an advanced tuning technique that can be used to work around issues. However, these issues should eventually be diagnosed and possibly a support case or Jira issue opened for any issues that cause probes to time out.
The following example demonstrates how you can directly patch the default router deployment to set a 5-second timeout for the liveness and readiness probes:
$ oc -n openshift-ingress patch deploy/router-default --type=strategic --patch='{"spec":{"template":{"spec":{"containers":[{"name":"router","livenessProbe":{"timeoutSeconds":5},"readinessProbe":{"timeoutSeconds":5}}]}}}}'Verification
$ oc -n openshift-ingress describe deploy/router-default | grep -e Liveness: -e Readiness:
Liveness: http-get http://:1936/healthz delay=0s timeout=5s period=10s #success=1 #failure=3
Readiness: http-get http://:1936/healthz/ready delay=0s timeout=5s period=10s #success=1 #failure=310.2.4. Configuring HAProxy reload interval
To optimize router performance, configure the HAProxy reload interval. The OpenShift Container Platform router reloads HAProxy to apply changes to routes or endpoints, generating a new process to handle connections for each update.
HAProxy keeps the old process running to handle existing connections until those connections are all closed. When old processes have long-lived connections, these processes can accumulate and consume resources.
The default minimum HAProxy reload interval is 5 seconds. You can configure an Ingress Controller using its spec.tuningOptions.reloadInterval field to set a longer minimum reload interval.
Setting a large value for the minimum HAProxy reload interval can cause latency in observing updates to routes and their endpoints. To lessen the risk, avoid setting a value larger than the tolerable latency for updates.
Procedure
Change the minimum HAProxy reload interval of the default Ingress Controller to 15 seconds by running the following command:
$ oc -n openshift-ingress-operator patch ingresscontrollers/default --type=merge --patch='{"spec":{"tuningOptions":{"reloadInterval":"15s"}}}'
10.3. Optimizing networking
To tunnel traffic between nodes, use Generic Network Virtualization Encapsulation (Geneve). You can tune the performance of this network by using network interface controller (NIC) offloads.
The OpenShift SDN uses OpenvSwitch, virtual extensible LAN (VXLAN) tunnels, OpenFlow rules, and iptables. This network can be tuned by using jumbo frames, multi-queue, and ethtool settings.
OVN-Kubernetes uses Generic Network Virtualization Encapsulation (Geneve) instead of VXLAN as the tunnel protocol. This network can be tuned by using network interface controller (NIC) offloads.
Cloud, virtual, and bare-metal environments running OpenShift Container Platform can use a high percentage of the capabilities of a network interface card (NIC) with minimal tuning. Production clusters using OVN-Kubernetes with Geneve tunneling can handle high-throughput traffic effectively and scale up (for example, utilizing 100 Gbps NICs) and scale out (for example, adding more NICs) without requiring special configuration.
In some high-performance scenarios where maximum efficiency is critical, targeted performance tuning can help optimize CPU usage, reduce overhead, and ensure that you are making full use of the NIC’s capabilities.
For environments where maximum throughput and CPU efficiency are critical, you can further optimize performance with the following strategies:
-
Validate network performance by using tools such as
iPerf3andk8s-netperf. By using these tools, you can benchmark throughput, latency, and packets-per-second (PPS) across pod and node interfaces. - Evaluate OVN-Kubernetes User Defined Networking (UDN) routing techniques, such as border gateway protocol (BGP).
- Use Geneve-offload capable network adapters. Geneve-offload moves the packet checksum calculation and associated CPU overhead off of the system CPU and onto dedicated hardware on the network adapter. This frees up CPU cycles for use by pods and applications, so that users can use the full bandwidth of their network infrastructure.
10.3.2. Optimizing the MTU for your network
To optimize network performance, configure the Maximum Transmission Unit (MTU) settings. By understanding the relationship between the network interface controller (NIC) MTU and the cluster network MTU, you can ensure efficient data transmission and prevent packet fragmentation.
The NIC MTU is configured at the time of OpenShift Container Platform installation, and you can also change the MTU of a cluster as a postinstallation task. For more information, see "Changing cluster network MTU".
For a cluster that uses the OVN-Kubernetes plugin, the MTU must be at least 100 bytes less than the maximum supported value of the NIC of your network. If you are optimizing for throughput, choose the largest possible value, such as 8900. If you are optimizing for lowest latency, choose a lower value.
If your cluster uses the OVN-Kubernetes plugin and the network uses a NIC to send and receive unfragmented jumbo frame packets over the network, you must specify 9000 bytes as the MTU value for the NIC so that pods do not fail.
The OpenShift SDN network plugin overlay MTU must be less than the NIC MTU by 50 bytes at a minimum. This accounts for the SDN overlay header. So, on a normal ethernet network, this should be set to 1450. On a jumbo frame ethernet network, this should be set to 8950. These values should be set automatically by the Cluster Network Operator based on the NIC’s configured MTU. Therefore, cluster administrators do not typically update these values. Amazon Web Services (AWS) and bare-metal environments support jumbo frame ethernet networks. This setting will help throughput, especially with transmission control protocol (TCP).
OpenShift SDN CNI is deprecated as of OpenShift Container Platform 4.14. As of OpenShift Container Platform 4.15, the network plugin is not an option for new installations. In a subsequent future release, the OpenShift SDN network plugin is planned to be removed and no longer supported. Red Hat will provide bug fixes and support for this feature until it is removed, but this feature will no longer receive enhancements. As an alternative to OpenShift SDN CNI, you can use OVN Kubernetes CNI instead. For more information, see OpenShift SDN CNI removal.
For OVN and Geneve, the MTU must be less than the NIC MTU by 100 bytes at a minimum.
This 50 byte overlay header is relevant to the OpenShift SDN network plugin. Other SDN solutions might require the value to be more or less.
10.3.3. Recommended practices for installing large-scale clusters
To support large clusters or scale to higher node counts, configure the cluster network cidr in your install-config.yaml file before installation. Setting this address range correctly ensures your cluster has sufficient capacity for the required number of nodes.
Example install-config.yaml file with a network configuration for a cluster with a large node count
apiVersion: v1
metadata:
name: cluster-name
# ...
networking:
clusterNetwork:
- cidr: 10.128.0.0/14
hostPrefix: 23
machineNetwork:
- cidr: 10.0.0.0/16
networkType: OVNKubernetes
serviceNetwork:
- 172.30.0.0/16
# ...-
The default cluster network
cidr10.128.0.0/14cannot be used if the cluster size is more than 500 nodes. Thecidrmust be set to10.128.0.0/12or10.128.0.0/10to support larger node counts beyond 500 nodes.
10.3.4. Impact of IPsec
To account for performance overhead, review the impact of enabling IPsec. Encrypting and decrypting traffic on node hosts consumes CPU power, which affects both throughput and CPU usage regardless of the specific IP security system.
IPSec encrypts traffic at the IP payload level, before it hits the NIC, protecting fields that would otherwise be used for NIC offloading. This means that some NIC acceleration features might not be usable when IPSec is enabled. This situation leads to decreased throughput and increased CPU usage.
10.4. Optimizing CPU usage with mount namespace encapsulation
You can optimize CPU usage in OpenShift Container Platform clusters by using mount namespace encapsulation to provide a private namespace for kubelet and CRI-O processes. This reduces the cluster CPU resources used by systemd with no difference in functionality.
Mount namespace encapsulation is a Technology Preview feature only. Technology Preview features are not supported with Red Hat production service level agreements (SLAs) and might not be functionally complete. Red Hat does not recommend using them in production. These features provide early access to upcoming product features, enabling customers to test functionality and provide feedback during the development process.
For more information about the support scope of Red Hat Technology Preview features, see Technology Preview Features Support Scope.
10.4.1. Encapsulating mount namespaces
To prevent the host operating system from constantly scanning mount points, review the process of encapsulation. This mechanism moves Kubernetes mount namespaces to an alternative location, ensuring that processes in different namespaces remain isolated and cannot view each other’s files.
The host operating system uses systemd to constantly scan all mount namespaces: both the standard Linux mounts and the numerous mounts that Kubernetes uses to operate. The current implementation of kubelet and CRI-O both use the top-level namespace for all container runtime and kubelet mount points. However, encapsulating these container-specific mount points in a private namespace reduces systemd overhead with no difference in functionality. Using a separate mount namespace for both CRI-O and kubelet can encapsulate container-specific mounts from any systemd or other host operating system interaction.
This ability to potentially achieve major CPU optimization is now available to all OpenShift Container Platform administrators. Encapsulation can also improve security by storing Kubernetes-specific mount points in a location safe from inspection by unprivileged users.
The following diagrams illustrate a Kubernetes installation before and after encapsulation. Both scenarios show example containers which have mount propagation settings of bidirectional, host-to-container, and none.
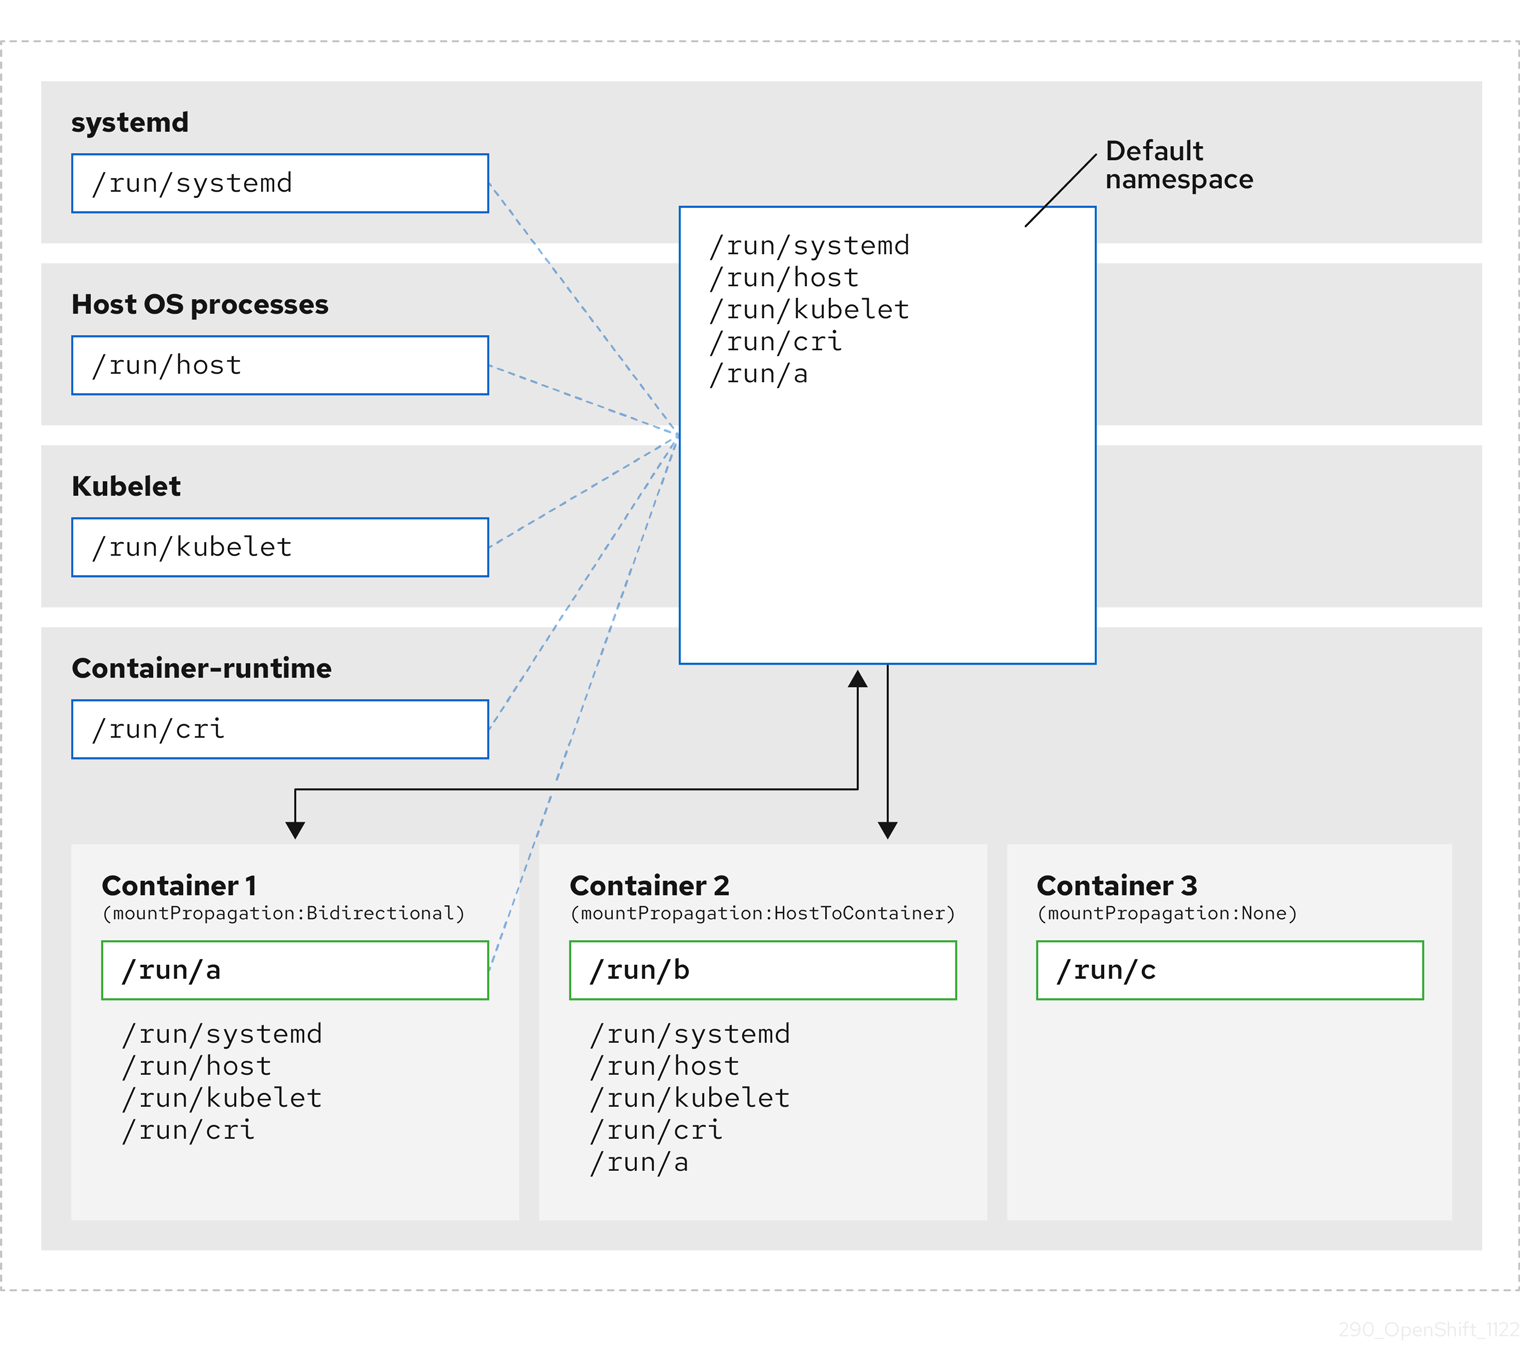
The diagram shows systemd, host operating system processes, kubelet, and the container runtime sharing a single mount namespace.
- systemd, host operating system processes, kubelet, and the container runtime each have access to and visibility of all mount points.
-
Container 1, configured with bidirectional mount propagation, can access systemd and host mounts, kubelet and CRI-O mounts. A mount originating in Container 1, such as
/run/ais visible to systemd, host operating system processes, kubelet, container runtime, and other containers with host-to-container or bidirectional mount propagation configured (as in Container 2). -
Container 2, configured with host-to-container mount propagation, can access systemd and host mounts, kubelet and CRI-O mounts. A mount originating in Container 2, such as
/run/b, is not visible to any other context. -
Container 3, configured with no mount propagation, has no visibility of external mount points. A mount originating in Container 3, such as
/run/c, is not visible to any other context.
The following diagram illustrates the system state after encapsulation.
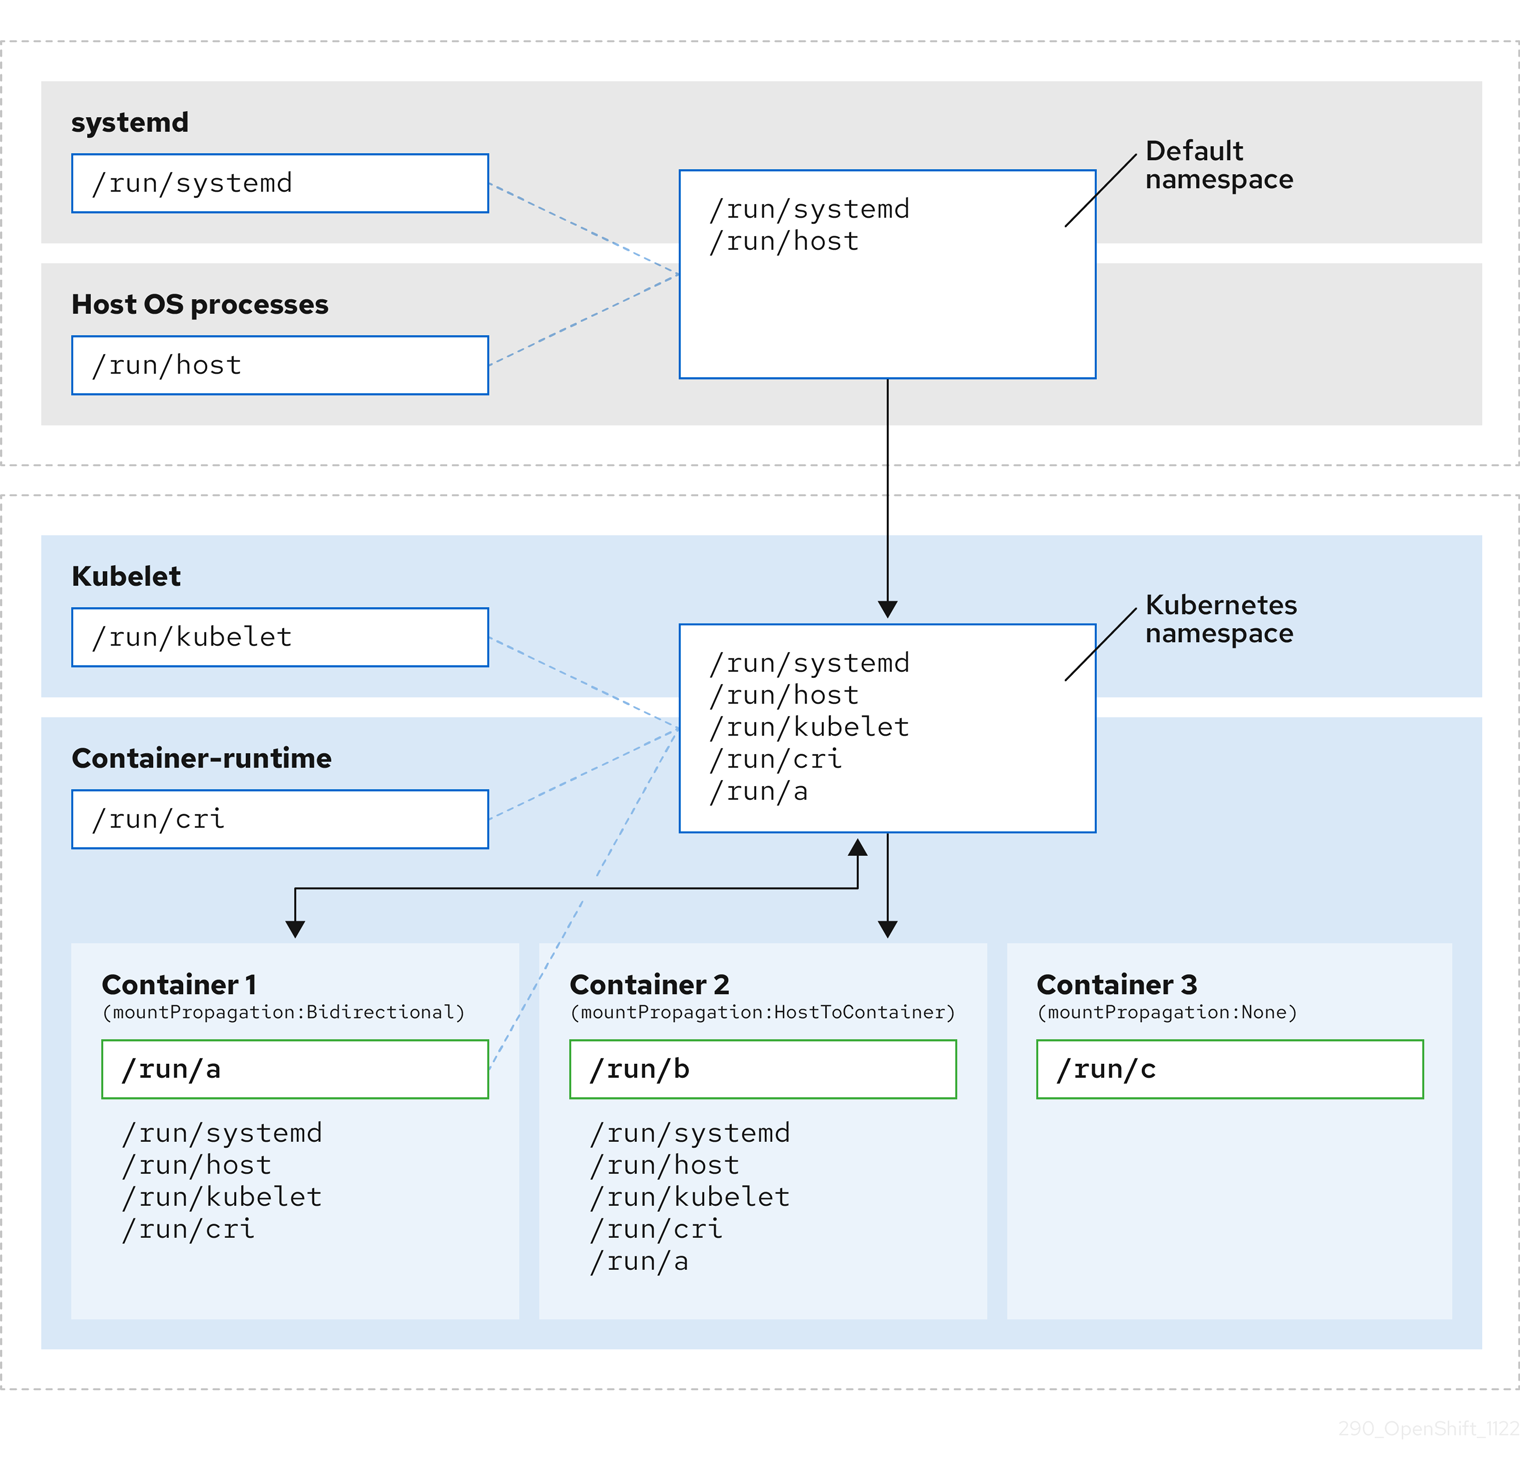
- The main systemd process is no longer devoted to unnecessary scanning of Kubernetes-specific mount points. It only monitors systemd-specific and host mount points.
- The host operating system processes can access only the systemd and host mount points.
- Using a separate mount namespace for both CRI-O and kubelet completely separates all container-specific mounts away from any systemd or other host operating system interaction whatsoever.
-
The behavior of Container 1 is unchanged, except a mount it creates such as
/run/ais no longer visible to systemd or host operating system processes. It is still visible to kubelet, CRI-O, and other containers with host-to-container or bidirectional mount propagation configured (like Container 2). - The behavior of Container 2 and Container 3 is unchanged.
10.4.2. Configuring mount namespace encapsulation
To run your cluster with less resource overhead, configure mount namespace encapsulation. This setting optimizes performance by moving mount namespaces to an alternative location, preventing the host operating system from constantly scanning them.
Mount namespace encapsulation is a Technology Preview feature and the feature is disabled by default. To use the feature, you must enable the feature manually.
Prerequisites
-
You have installed the OpenShift CLI (
oc). -
You have logged in as a user with
cluster-adminprivileges.
Procedure
Create a file called
mount_namespace_config.yamlwith the following YAML:apiVersion: machineconfiguration.openshift.io/v1 kind: MachineConfig metadata: labels: machineconfiguration.openshift.io/role: master name: 99-kubens-master spec: config: ignition: version: 3.2.0 systemd: units: - enabled: true name: kubens.service --- apiVersion: machineconfiguration.openshift.io/v1 kind: MachineConfig metadata: labels: machineconfiguration.openshift.io/role: worker name: 99-kubens-worker spec: config: ignition: version: 3.2.0 systemd: units: - enabled: true name: kubens.serviceApply the mount namespace
MachineConfigCR by running the following command:$ oc apply -f mount_namespace_config.yamlExample output
machineconfig.machineconfiguration.openshift.io/99-kubens-master created machineconfig.machineconfiguration.openshift.io/99-kubens-worker createdThe
MachineConfigCR can take up to thirty minutes to finish being applied in the cluster. You can check the status of theMachineConfigCR by running the following command:$ oc get mcpExample output
NAME CONFIG UPDATED UPDATING DEGRADED MACHINECOUNT READYMACHINECOUNT UPDATEDMACHINECOUNT DEGRADEDMACHINECOUNT AGE master rendered-master-03d4bc4befb0f4ed3566a2c8f7636751 False True False 3 0 0 0 45m worker rendered-worker-10577f6ab0117ed1825f8af2ac687ddf False True False 3 1 1Wait for the
MachineConfigCR to be applied successfully across all control plane and worker nodes after running the following command:$ oc wait --for=condition=Updated mcp --all --timeout=30mExample output
machineconfigpool.machineconfiguration.openshift.io/master condition met machineconfigpool.machineconfiguration.openshift.io/worker condition met
Verification
Open a debug shell to the cluster host:
$ oc debug node/<node_name>Open a
chrootsession:sh-4.4# chroot /hostCheck the systemd mount namespace:
sh-4.4# readlink /proc/1/ns/mntExample output
mnt:[4026531953]Check kubelet mount namespace:
sh-4.4# readlink /proc/$(pgrep kubelet)/ns/mntExample output
mnt:[4026531840]Check the CRI-O mount namespace:
sh-4.4# readlink /proc/$(pgrep crio)/ns/mntExample output
mnt:[4026531840]These commands return the mount namespaces associated with systemd, kubelet, and the container runtime. In OpenShift Container Platform, the container runtime is CRI-O.
Encapsulation is in effect if systemd is in a different mount namespace from kubelet and CRI-O as in the previous output example. Encapsulation is not in effect if all three processes are in the same mount namespace.
10.4.3. Inspecting encapsulated namespaces
You can inspect Kubernetes-specific mount points in the cluster host operating system for debugging or auditing purposes by using the kubensenter script that is available in Red Hat Enterprise Linux CoreOS (RHCOS).
SSH shell sessions to the cluster host are in the default namespace. To inspect Kubernetes-specific mount points in an SSH shell prompt, you need to run the kubensenter script as root. The kubensenter script is aware of the state of the mount encapsulation, and the script is safe to run even if encapsulation is not enabled.
oc debug remote shell sessions start inside the Kubernetes namespace by default. You do not need to run kubensenter to inspect mount points when you use oc debug.
If the encapsulation feature is not enabled, the kubensenter findmnt and findmnt commands return the same output, regardless of whether they are run in an oc debug session or in an SSH shell prompt.
Prerequisites
-
You have installed the OpenShift CLI (
oc). -
You have logged in as a user with
cluster-adminprivileges. - You have configured SSH access to the cluster host.
Procedure
Open a remote SSH shell to the cluster host. For example:
$ ssh core@<node_name>Run commands using the provided
kubensenterscript as the root user. To run a single command inside the Kubernetes namespace, provide the command and any arguments to thekubensenterscript. For example, to run thefindmntcommand inside the Kubernetes namespace, run the following command:[core@control-plane-1 ~]$ sudo kubensenter findmntExample output
kubensenter: Autodetect: kubens.service namespace found at /run/kubens/mnt TARGET SOURCE FSTYPE OPTIONS / /dev/sda4[/ostree/deploy/rhcos/deploy/32074f0e8e5ec453e56f5a8a7bc9347eaa4172349ceab9c22b709d9d71a3f4b0.0] | xfs rw,relatime,seclabel,attr2,inode64,logbufs=8,logbsize=32k,prjquota shm tmpfs ...To start a new interactive shell inside the Kubernetes namespace, run the
kubensenterscript without any arguments:[core@control-plane-1 ~]$ sudo kubensenterExample output
kubensenter: Autodetect: kubens.service namespace found at /run/kubens/mnt
10.4.4. Running additional services in the encapsulated namespace
To enable monitoring tools to view mount points created by kubelet, CRI-O, or containers, use the kubensenter script provided with OpenShift Container Platform. By using this tool, you can execute commands inside the Kubernetes mount point, ensuring existing tools can run within the encapsulated namespace.
The kubensenter script is aware of the state of the mount encapsulation feature status, and is safe to run even if encapsulation is not enabled. In that case the script executes the provided command in the default mount namespace.
For example, if a systemd service needs to run inside the new Kubernetes mount namespace, edit the service file and use the ExecStart= command line with kubensenter.
[Unit]
Description=Example service
[Service]
ExecStart=/usr/bin/kubensenter /path/to/original/command arg1 arg2Chapter 11. Managing bare-metal hosts
You can configure bare-metal hosts directly within OpenShift Container Platform. To provision and manage nodes in a bare-metal cluster, use Machine and MachineSet custom resources (CRs).
11.1. About bare metal hosts and nodes
To provision a Red Hat Enterprise Linux CoreOS (RHCOS) bare-metal host as a node in your cluster, first create a MachineSet custom resource (CR) object that corresponds to bare-metal host hardware.
Bare-metal host compute machine sets describe infrastructure components specific to your configuration. You apply specific Kubernetes labels to these compute machine sets and then update the infrastructure components to run on only those machines.
When you scale up the relevant MachineSet CR that contains a metal3.io/autoscale-to-hosts annotation, Machine CRs are created automatically. OpenShift Container Platform uses Machine CRs to provision the bare-metal node that corresponds to the host as specified in the MachineSet CR.
11.2. Maintaining bare metal hosts
To ensure your cluster inventory accurately reflects your physical infrastructure, maintain the details of the bare-metal host configurations by using the OpenShift Container Platform web console.
Procedure
From the web console, comlete the following steps:
- Navigate to Compute → Bare Metal Hosts.
- Select a task from the Actions drop-down menu.
- Manage items such as baseboard management controller (BMC) details, boot MAC address for the host, enable power management, and so on. You can also review the details of the network interfaces and drives for the host.
- Move a bare-metal host into maintenance mode. When you move a host into maintenance mode, the scheduler moves all managed workloads off the corresponding bare-metal node. No new workloads are scheduled while in maintenance mode.
Deprovision a bare-metal host in the web console. Deprovisioning a host does the following actions:
-
Annotates the bare-metal host CR with
cluster.k8s.io/delete-machine: true. Scales down the related compute machine set.
NotePowering off the host without first moving the daemon set and unmanaged static pods to another node can cause service disruption and loss of data.
-
Annotates the bare-metal host CR with
11.2.1. Adding a bare metal host to the cluster using the web console
To integrate physical hardware into your cluster, you can add bare-metal hosts by using the web console. By adding these hosts, you can provision and manage these nodes directly through the web console.
Prerequisites
- Install an RHCOS cluster on bare metal.
-
Log in as a user with
cluster-adminprivileges.
Procedure
- In the web console, navigate to Compute → Bare Metal Hosts.
- Select Add Host → New with Dialog.
- Specify a unique name for the new bare metal host.
- Set the Boot MAC address.
- Set the Baseboard Management Console (BMC) Address.
- Enter the user credentials for the host’s baseboard management controller (BMC).
- Select to power on the host after creation, and select Create.
Scale up the number of replicas to match the number of available bare metal hosts. Navigate to Compute → MachineSets, and increase the number of machine replicas in the cluster by selecting Edit Machine count from the Actions drop-down menu.
NoteYou can also manage the number of bare-metal nodes by using the
oc scalecommand and the appropriate bare-metal compute machine set.
11.2.2. Adding a bare-metal host to the cluster using YAML in the web console
You can add bare-metal hosts to the cluster in the web console by using a YAML file that describes the bare-metal host.
Prerequisites
- Install a RHCOS compute machine on bare-metal infrastructure for use in the cluster.
-
Log in as a user with
cluster-adminprivileges. -
Create a
SecretCR for the bare-metal host.
Procedure
- In the web console, navigate to Compute → Bare Metal Hosts.
- Select Add Host → New from YAML.
Copy and paste the below YAML, modifying the relevant fields with the details of your host:
apiVersion: metal3.io/v1alpha1 kind: BareMetalHost metadata: name: <bare_metal_host_name> spec: online: true bmc: address: <bmc_address> credentialsName: <secret_credentials_name> disableCertificateVerification: True bootMACAddress: <host_boot_mac_address> # ...where:
spec.bmc.credentialsName-
Specifies a reference to a valid
SecretCR. The Bare Metal Operator cannot manage the bare-metal host without a validSecretreferenced in thecredentialsName. For more information about secrets and how to create them, see "Understanding secrets". spec.bmc.disableCertificateVerification-
Specifies whether to require TLS host validation between the cluster and the baseboard management controller (BMC). When this field is set to
true, TLS host validation is disabled.
- Select Create to save the YAML and create the new bare-metal host.
Scale up the number of replicas to match the number of available bare-metal hosts. Navigate to Compute → MachineSets, and increase the number of machines in the cluster by selecting Edit Machine count from the Actions drop-down menu.
NoteYou can also manage the number of bare-metal nodes by using the
oc scalecommand and the appropriate bare-metal compute machine set.
11.2.3. Automatically scaling machines to the number of available bare-metal hosts
To automatically create the number of Machine objects that matches the number of available BareMetalHost objects, add a metal3.io/autoscale-to-hosts annotation to the MachineSet object.
Prerequisites
-
Install RHCOS bare-metal compute machines for use in the cluster, and create corresponding
BareMetalHostobjects. -
Install the OpenShift CLI (
oc). -
Log in as a user with
cluster-adminprivileges.
Procedure
To configure automatic scaling for a compute machine set, annotate the compute machine set by running the following command:
$ oc annotate machineset <machineset> -n openshift-machine-api 'metal3.io/autoscale-to-hosts=<any_value>'-
<machineset>: Specifies the name of the compute machine set that you want to configure for automatic scaling. -
<any_value>Specifies is a value, such astrueor"".
-
Wait for the new scaled machines to start.
NoteThe
BareMetalHostobject continues to be counted against theMachineSetthat theMachineobject was created from when the following conditions are met:-
You use a
BareMetalHostobject to create a machine in the cluster. -
You subsequently change labels or selectors on the
BareMetalHost.
-
You use a
11.2.4. Removing bare-metal hosts from the provisioner node
In certain circumstances, you might want to temporarily remove bare-metal hosts from the provisioner node. For example, to prevent the management of the number of Machine objects that matches the number of available BareMetalHost objects, add a baremetalhost.metal3.io/detached annotation to the MachineSet object.
Consider an example during provisioning when a bare-metal host reboot is triggered by using the OpenShift Container Platform administration console or as a result of a Machine Config Pool update. In this case, OpenShift Container Platform logs into the integrated Dell Remote Access Controller (iDRAC) and issues a delete of the job queue.
This annotation has an effect for only BareMetalHost objects that are in either Provisioned, ExternallyProvisioned, or Ready/Available states.
Prerequisites
-
Install RHCOS bare-metal compute machines for use in the cluster and create corresponding
BareMetalHostobjects. -
Install the OpenShift CLI (
oc). -
Log in as a user with
cluster-adminprivileges.
Procedure
To configure automatic scaling for a compute machine set, annotate the compute machine set by running the following command:
$ oc annotate machineset <machineset> -n openshift-machine-api 'baremetalhost.metal3.io/detached'Wait for the new machines to start.
NoteWhen you use a
BareMetalHostobject to create a machine in the cluster and labels or selectors are subsequently changed on theBareMetalHost, theBareMetalHostobject continues to be counted against theMachineSetthat theMachineobject was created from.In the provisioning use case, remove the annotation after the reboot is complete by using the following command:
$ oc annotate machineset <machineset> -n openshift-machine-api 'baremetalhost.metal3.io/detached-'
11.2.5. Powering off bare-metal hosts by using the web console
You can power off bare-metal cluster hosts in the web console. Before you power off a host, mark the node as unschedulable and drain all pods and workloads from the node.
Prerequisites
- You have installed a RHCOS compute machine on bare-metal infrastructure for use in the cluster.
-
You have logged in as a user with
cluster-adminprivileges. -
You have configured the host to be managed and have added Baseboard Management Console credentials for the cluster host. You can add BMC credentials by applying a
Secretcustom resource (CR) in the cluster or by logging in to the web console and configuring the bare-metal host to be managed.
Procedure
- Navigate to Nodes and select the node that you want to power off. Expand the Actions menu and select Mark as unschedulable.
- Manually delete or relocate running pods on the node by adjusting the pod deployments or scaling down workloads on the node to zero. Wait for the drain process to complete.
- Navigate to Compute → Bare Metal Hosts.
- Expand the Options menu for the bare-metal host that you want to power off, and select Power Off.
- Select Immediate power off.
11.2.6. Powering off bare-metal hosts by using the CLI
You can power off bare-metal cluster hosts by applying a patch in the cluster by using the OpenShift CLI (oc). Before you power off a host, mark the node as unschedulable and drain all pods and workloads from the node.
Prerequisites
- You have installed a RHCOS compute machine on bare-metal infrastructure for use in the cluster.
-
You have logged in as a user with
cluster-adminprivileges. -
You have configured the host to be managed and have added Baseboard Management Console credentials for the cluster host. You can add BMC credentials by applying a
Secretcustom resource (CR) in the cluster or by logging in to the web console and configuring the bare-metal host to be managed.
Procedure
Get the name of the managed bare-metal host by entering the following command:
$ oc get baremetalhosts -n openshift-machine-api -o jsonpath='{range .items[*]}{.metadata.name}{"\t"}{.status.provisioning.state}{"\n"}{end}'Example output
master-0.example.com managed master-1.example.com managed master-2.example.com managed worker-0.example.com managed worker-1.example.com managed worker-2.example.com managedMark the node as unschedulable by entering the following command:
$ oc adm cordon <bare_metal_host>-
<bare_metal_host>: Specifies the name of the host that you want to shut down. For example,worker-2.example.com.
-
Drain all pods on the node by entering the following command:
$ oc adm drain <bare_metal_host> --force=truePods that are backed by replication controllers are rescheduled to other available nodes in the cluster.
Safely power off the bare-metal host by entering the following command:
$ oc patch <bare_metal_host> --type json -p '[{"op": "replace", "path": "/spec/online", "value": false}]'After you power on the host, make the node schedulable for workloads by entering the following command:
$ oc adm uncordon <bare_metal_host>
Chapter 12. Monitoring bare-metal events with the Bare Metal Event Relay
Bare Metal Event Relay is a Technology Preview feature only. Technology Preview features are not supported with Red Hat production service level agreements (SLAs) and might not be functionally complete. Red Hat does not recommend using them in production. These features provide early access to upcoming product features, enabling customers to test functionality and provide feedback during the development process.
For more information about the support scope of Red Hat Technology Preview features, see Technology Preview Features Support Scope.
12.1. About bare-metal events
The Bare Metal Event Relay Operator is deprecated. The ability to monitor bare-metal hosts by using the Bare Metal Event Relay Operator will be removed in a future OpenShift Container Platform release.
Use the Bare Metal Event Relay to subscribe applications that run in your OpenShift Container Platform cluster to events that are generated on the underlying bare-metal host. The Redfish service publishes events on a node and transmits them on an advanced message queue to subscribed applications.
Bare-metal events are based on the open Redfish standard that is developed under the guidance of the Distributed Management Task Force (DMTF). Redfish provides a secure industry-standard protocol with a REST API. The protocol is used for the management of distributed, converged or software-defined resources and infrastructure.
Hardware-related events published through Redfish includes:
- Breaches of temperature limits
- Server status
- Fan status
Begin using bare-metal events by deploying the Bare Metal Event Relay Operator and subscribing your application to the service. The Bare Metal Event Relay Operator installs and manages the lifecycle of the Redfish bare-metal event service.
The Bare Metal Event Relay works only with Redfish-capable devices on single-node clusters provisioned on bare-metal infrastructure.
12.2. How bare-metal events work
The Bare Metal Event Relay enables applications running on bare-metal clusters to respond quickly to Redfish hardware changes and failures such as breaches of temperature thresholds, fan failure, disk loss, power outages, and memory failure. These hardware events are delivered using an HTTP transport or AMQP mechanism. The latency of the messaging service is between 10 to 20 milliseconds.
The Bare Metal Event Relay provides a publish-subscribe service for the hardware events. Applications can use a REST API to subscribe to the events. The Bare Metal Event Relay supports hardware that complies with Redfish OpenAPI v1.8 or later.
12.2.1. Bare Metal Event Relay data flow
The following figure illustrates an example bare-metal events data flow:
Figure 12.1. Bare Metal Event Relay data flow
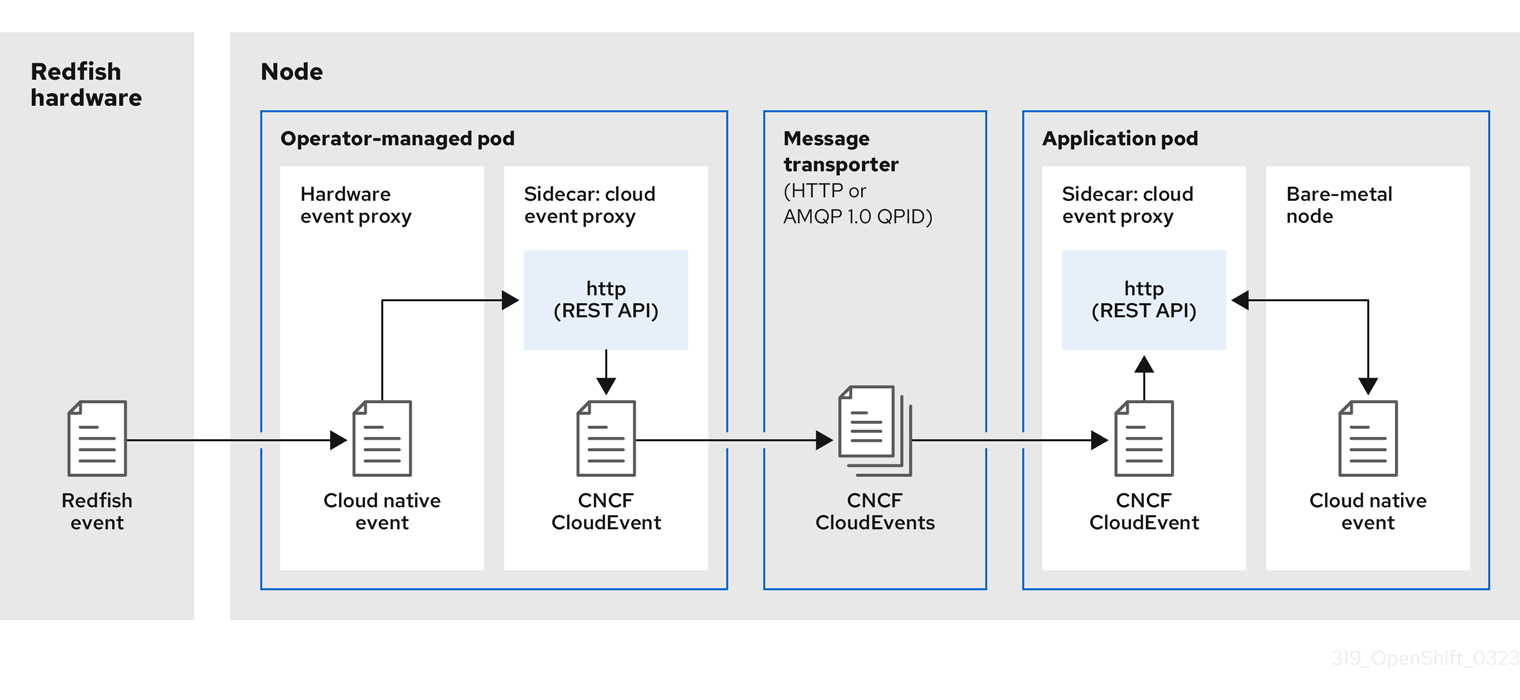
12.2.1.1. Operator-managed pod
The Operator uses custom resources to manage the pod containing the Bare Metal Event Relay and its components using the HardwareEvent CR.
12.2.1.2. Bare Metal Event Relay
At startup, the Bare Metal Event Relay queries the Redfish API and downloads all the message registries, including custom registries. The Bare Metal Event Relay then begins to receive subscribed events from the Redfish hardware.
The Bare Metal Event Relay enables applications running on bare-metal clusters to respond quickly to Redfish hardware changes and failures such as breaches of temperature thresholds, fan failure, disk loss, power outages, and memory failure. The events are reported using the HardwareEvent CR.
12.2.1.3. Cloud native event
Cloud native events (CNE) is a REST API specification for defining the format of event data.
12.2.1.4. CNCF CloudEvents
CloudEvents is a vendor-neutral specification developed by the Cloud Native Computing Foundation (CNCF) for defining the format of event data.
12.2.1.5. HTTP transport or AMQP dispatch router
The HTTP transport or AMQP dispatch router is responsible for the message delivery service between publisher and subscriber.
HTTP transport is the default transport for PTP and bare-metal events. Use HTTP transport instead of AMQP for PTP and bare-metal events where possible. AMQ Interconnect is EOL from 30 June 2024. Extended life cycle support (ELS) for AMQ Interconnect ends 29 November 2029. For more information see, Red Hat AMQ Interconnect support status.
12.2.1.6. Cloud event proxy sidecar
The cloud event proxy sidecar container image is based on the O-RAN API specification and provides a publish-subscribe event framework for hardware events.
12.2.2. Redfish message parsing service
In addition to handling Redfish events, the Bare Metal Event Relay provides message parsing for events without a Message property. The proxy downloads all the Redfish message registries including vendor specific registries from the hardware when it starts. If an event does not contain a Message property, the proxy uses the Redfish message registries to construct the Message and Resolution properties and add them to the event before passing the event to the cloud events framework. This service allows Redfish events to have smaller message size and lower transmission latency.
12.2.3. Installing the Bare Metal Event Relay using the CLI
As a cluster administrator, you can install the Bare Metal Event Relay Operator by using the CLI.
Prerequisites
- A cluster that is installed on bare-metal hardware with nodes that have a RedFish-enabled Baseboard Management Controller (BMC).
-
Install the OpenShift CLI (
oc). -
Log in as a user with
cluster-adminprivileges.
Procedure
Create a namespace for the Bare Metal Event Relay.
Save the following YAML in the
bare-metal-events-namespace.yamlfile:apiVersion: v1 kind: Namespace metadata: name: openshift-bare-metal-events labels: name: openshift-bare-metal-events openshift.io/cluster-monitoring: "true"Create the
NamespaceCR:$ oc create -f bare-metal-events-namespace.yaml
Create an Operator group for the Bare Metal Event Relay Operator.
Save the following YAML in the
bare-metal-events-operatorgroup.yamlfile:apiVersion: operators.coreos.com/v1 kind: OperatorGroup metadata: name: bare-metal-event-relay-group namespace: openshift-bare-metal-events spec: targetNamespaces: - openshift-bare-metal-eventsCreate the
OperatorGroupCR:$ oc create -f bare-metal-events-operatorgroup.yaml
Subscribe to the Bare Metal Event Relay.
Save the following YAML in the
bare-metal-events-sub.yamlfile:apiVersion: operators.coreos.com/v1alpha1 kind: Subscription metadata: name: bare-metal-event-relay-subscription namespace: openshift-bare-metal-events spec: channel: "stable" name: bare-metal-event-relay source: redhat-operators sourceNamespace: openshift-marketplaceCreate the
SubscriptionCR:$ oc create -f bare-metal-events-sub.yaml
Verification
To verify that the Bare Metal Event Relay Operator is installed, run the following command:
$ oc get csv -n openshift-bare-metal-events -o custom-columns=Name:.metadata.name,Phase:.status.phase12.2.4. Installing the Bare Metal Event Relay using the web console
As a cluster administrator, you can install the Bare Metal Event Relay Operator using the web console.
Prerequisites
- A cluster that is installed on bare-metal hardware with nodes that have a RedFish-enabled Baseboard Management Controller (BMC).
-
Log in as a user with
cluster-adminprivileges.
Procedure
Install the Bare Metal Event Relay using the OpenShift Container Platform web console:
- In the OpenShift Container Platform web console, click Operators → OperatorHub.
- Choose Bare Metal Event Relay from the list of available Operators, and then click Install.
- On the Install Operator page, select or create a Namespace, select openshift-bare-metal-events, and then click Install.
Verification
Optional: You can verify that the Operator installed successfully by performing the following check:
- Switch to the Operators → Installed Operators page.
Ensure that Bare Metal Event Relay is listed in the project with a Status of InstallSucceeded.
NoteDuring installation an Operator might display a Failed status. If the installation later succeeds with an InstallSucceeded message, you can ignore the Failed message.
If the Operator does not appear as installed, to troubleshoot further:
- Go to the Operators → Installed Operators page and inspect the Operator Subscriptions and Install Plans tabs for any failure or errors under Status.
- Go to the Workloads → Pods page and check the logs for pods in the project namespace.
12.3. Installing the AMQ messaging bus
To pass Redfish bare-metal event notifications between publisher and subscriber on a node, you can install and configure an AMQ messaging bus to run locally on the node. You do this by installing the AMQ Interconnect Operator for use in the cluster.
HTTP transport is the default transport for PTP and bare-metal events. Use HTTP transport instead of AMQP for PTP and bare-metal events where possible. AMQ Interconnect is EOL from 30 June 2024. Extended life cycle support (ELS) for AMQ Interconnect ends 29 November 2029. For more information see, Red Hat AMQ Interconnect support status.
Prerequisites
-
Install the OpenShift Container Platform CLI (
oc). -
Log in as a user with
cluster-adminprivileges.
Procedure
-
Install the AMQ Interconnect Operator to its own
amq-interconnectnamespace. See Installing the AMQ Interconnect Operator.
Verification
Verify that the AMQ Interconnect Operator is available and the required pods are running:
$ oc get pods -n amq-interconnectExample output
NAME READY STATUS RESTARTS AGE amq-interconnect-645db76c76-k8ghs 1/1 Running 0 23h interconnect-operator-5cb5fc7cc-4v7qm 1/1 Running 0 23hVerify that the required
bare-metal-event-relaybare-metal event producer pod is running in theopenshift-bare-metal-eventsnamespace:$ oc get pods -n openshift-bare-metal-eventsExample output
NAME READY STATUS RESTARTS AGE hw-event-proxy-operator-controller-manager-74d5649b7c-dzgtl 2/2 Running 0 25s
12.4. Subscribing to Redfish BMC bare-metal events for a cluster node
You can subscribe to Redfish BMC events generated on a node in your cluster by creating a BMCEventSubscription custom resource (CR) for the node, creating a HardwareEvent CR for the event, and creating a Secret CR for the BMC.
12.4.1. Subscribing to bare-metal events
You can configure the baseboard management controller (BMC) to send bare-metal events to subscribed applications running in an OpenShift Container Platform cluster. Example Redfish bare-metal events include an increase in device temperature, or removal of a device. You subscribe applications to bare-metal events using a REST API.
You can only create a BMCEventSubscription custom resource (CR) for physical hardware that supports Redfish and has a vendor interface set to redfish or idrac-redfish.
Use the BMCEventSubscription CR to subscribe to predefined Redfish events. The Redfish standard does not provide an option to create specific alerts and thresholds. For example, to receive an alert event when an enclosure’s temperature exceeds 40° Celsius, you must manually configure the event according to the vendor’s recommendations.
Perform the following procedure to subscribe to bare-metal events for the node using a BMCEventSubscription CR.
Prerequisites
-
Install the OpenShift CLI (
oc). -
Log in as a user with
cluster-adminprivileges. - Get the user name and password for the BMC.
Deploy a bare-metal node with a Redfish-enabled Baseboard Management Controller (BMC) in your cluster, and enable Redfish events on the BMC.
NoteEnabling Redfish events on specific hardware is outside the scope of this information. For more information about enabling Redfish events for your specific hardware, consult the BMC manufacturer documentation.
Procedure
Confirm that the node hardware has the Redfish
EventServiceenabled by running the followingcurlcommand:$ curl https://<bmc_ip_address>/redfish/v1/EventService --insecure -H 'Content-Type: application/json' -u "<bmc_username>:<password>"where:
- bmc_ip_address
- is the IP address of the BMC where the Redfish events are generated.
Example output
{ "@odata.context": "/redfish/v1/$metadata#EventService.EventService", "@odata.id": "/redfish/v1/EventService", "@odata.type": "#EventService.v1_0_2.EventService", "Actions": { "#EventService.SubmitTestEvent": { "EventType@Redfish.AllowableValues": ["StatusChange", "ResourceUpdated", "ResourceAdded", "ResourceRemoved", "Alert"], "target": "/redfish/v1/EventService/Actions/EventService.SubmitTestEvent" } }, "DeliveryRetryAttempts": 3, "DeliveryRetryIntervalSeconds": 30, "Description": "Event Service represents the properties for the service", "EventTypesForSubscription": ["StatusChange", "ResourceUpdated", "ResourceAdded", "ResourceRemoved", "Alert"], "EventTypesForSubscription@odata.count": 5, "Id": "EventService", "Name": "Event Service", "ServiceEnabled": true, "Status": { "Health": "OK", "HealthRollup": "OK", "State": "Enabled" }, "Subscriptions": { "@odata.id": "/redfish/v1/EventService/Subscriptions" } }Get the Bare Metal Event Relay service route for the cluster by running the following command:
$ oc get route -n openshift-bare-metal-eventsExample output
NAME HOST/PORT PATH SERVICES PORT TERMINATION WILDCARD hw-event-proxy hw-event-proxy-openshift-bare-metal-events.apps.compute-1.example.com hw-event-proxy-service 9087 edge NoneCreate a
BMCEventSubscriptionresource to subscribe to the Redfish events:Save the following YAML in the
bmc_sub.yamlfile:apiVersion: metal3.io/v1alpha1 kind: BMCEventSubscription metadata: name: sub-01 namespace: openshift-machine-api spec: hostName: <hostname>1 destination: <proxy_service_url>2 context: ''- 1
- Specifies the name or UUID of the worker node where the Redfish events are generated.
- 2
- Specifies the bare-metal event proxy service, for example,
https://hw-event-proxy-openshift-bare-metal-events.apps.compute-1.example.com/webhook.
Create the
BMCEventSubscriptionCR:$ oc create -f bmc_sub.yaml
Optional: To delete the BMC event subscription, run the following command:
$ oc delete -f bmc_sub.yamlOptional: To manually create a Redfish event subscription without creating a
BMCEventSubscriptionCR, run the followingcurlcommand, specifying the BMC username and password.$ curl -i -k -X POST -H "Content-Type: application/json" -d '{"Destination": "https://<proxy_service_url>", "Protocol" : "Redfish", "EventTypes": ["Alert"], "Context": "root"}' -u <bmc_username>:<password> 'https://<bmc_ip_address>/redfish/v1/EventService/Subscriptions' –vwhere:
- proxy_service_url
-
is the bare-metal event proxy service, for example,
https://hw-event-proxy-openshift-bare-metal-events.apps.compute-1.example.com/webhook.
- bmc_ip_address
- is the IP address of the BMC where the Redfish events are generated.
Example output
HTTP/1.1 201 Created Server: AMI MegaRAC Redfish Service Location: /redfish/v1/EventService/Subscriptions/1 Allow: GET, POST Access-Control-Allow-Origin: * Access-Control-Expose-Headers: X-Auth-Token Access-Control-Allow-Headers: X-Auth-Token Access-Control-Allow-Credentials: true Cache-Control: no-cache, must-revalidate Link: <http://redfish.dmtf.org/schemas/v1/EventDestination.v1_6_0.json>; rel=describedby Link: <http://redfish.dmtf.org/schemas/v1/EventDestination.v1_6_0.json> Link: </redfish/v1/EventService/Subscriptions>; path= ETag: "1651135676" Content-Type: application/json; charset=UTF-8 OData-Version: 4.0 Content-Length: 614 Date: Thu, 28 Apr 2022 08:47:57 GMT
12.4.2. Querying Redfish bare-metal event subscriptions with curl
Some hardware vendors limit the amount of Redfish hardware event subscriptions. You can query the number of Redfish event subscriptions by using curl.
Prerequisites
- Get the user name and password for the BMC.
- Deploy a bare-metal node with a Redfish-enabled Baseboard Management Controller (BMC) in your cluster, and enable Redfish hardware events on the BMC.
Procedure
Check the current subscriptions for the BMC by running the following
curlcommand:$ curl --globoff -H "Content-Type: application/json" -k -X GET --user <bmc_username>:<password> https://<bmc_ip_address>/redfish/v1/EventService/Subscriptionswhere:
- bmc_ip_address
- is the IP address of the BMC where the Redfish events are generated.
Example output
% Total % Received % Xferd Average Speed Time Time Time Current Dload Upload Total Spent Left Speed 100 435 100 435 0 0 399 0 0:00:01 0:00:01 --:--:-- 399 { "@odata.context": "/redfish/v1/$metadata#EventDestinationCollection.EventDestinationCollection", "@odata.etag": "" 1651137375 "", "@odata.id": "/redfish/v1/EventService/Subscriptions", "@odata.type": "#EventDestinationCollection.EventDestinationCollection", "Description": "Collection for Event Subscriptions", "Members": [ { "@odata.id": "/redfish/v1/EventService/Subscriptions/1" }], "Members@odata.count": 1, "Name": "Event Subscriptions Collection" }In this example, a single subscription is configured:
/redfish/v1/EventService/Subscriptions/1.Optional: To remove the
/redfish/v1/EventService/Subscriptions/1subscription withcurl, run the following command, specifying the BMC username and password:$ curl --globoff -L -w "%{http_code} %{url_effective}\n" -k -u <bmc_username>:<password >-H "Content-Type: application/json" -d '{}' -X DELETE https://<bmc_ip_address>/redfish/v1/EventService/Subscriptions/1where:
- bmc_ip_address
- is the IP address of the BMC where the Redfish events are generated.
12.4.3. Creating the bare-metal event and Secret CRs
To start using bare-metal events, create the HardwareEvent custom resource (CR) for the host where the Redfish hardware is present. Hardware events and faults are reported in the hw-event-proxy logs.
Prerequisites
-
You have installed the OpenShift Container Platform CLI (
oc). -
You have logged in as a user with
cluster-adminprivileges. - You have installed the Bare Metal Event Relay.
-
You have created a
BMCEventSubscriptionCR for the BMC Redfish hardware.
Procedure
Create the
HardwareEventcustom resource (CR):NoteMultiple
HardwareEventresources are not permitted.Save the following YAML in the
hw-event.yamlfile:apiVersion: "event.redhat-cne.org/v1alpha1" kind: "HardwareEvent" metadata: name: "hardware-event" spec: nodeSelector: node-role.kubernetes.io/hw-event: ""1 logLevel: "debug"2 msgParserTimeout: "10"3 - 1
- Required. Use the
nodeSelectorfield to target nodes with the specified label, for example,node-role.kubernetes.io/hw-event: "".NoteIn OpenShift Container Platform 4.13 or later, you do not need to set the
spec.transportHostfield in theHardwareEventresource when you use HTTP transport for bare-metal events. SettransportHostonly when you use AMQP transport for bare-metal events. - 2
- Optional. The default value is
debug. Sets the log level inhw-event-proxylogs. The following log levels are available:fatal,error,warning,info,debug,trace. - 3
- Optional. Sets the timeout value in milliseconds for the Message Parser. If a message parsing request is not responded to within the timeout duration, the original hardware event message is passed to the cloud native event framework. The default value is 10.
Apply the
HardwareEventCR in the cluster:$ oc create -f hardware-event.yaml
Create a BMC username and password
SecretCR that enables the hardware events proxy to access the Redfish message registry for the bare-metal host.Save the following YAML in the
hw-event-bmc-secret.yamlfile:apiVersion: v1 kind: Secret metadata: name: redfish-basic-auth type: Opaque stringData:1 username: <bmc_username> password: <bmc_password> # BMC host DNS or IP address hostaddr: <bmc_host_ip_address>- 1
- Enter plain text values for the various items under
stringData.
Create the
SecretCR:$ oc create -f hw-event-bmc-secret.yaml
12.5. Subscribing applications to bare-metal events REST API reference
Use the bare-metal events REST API to subscribe an application to the bare-metal events that are generated on the parent node.
Subscribe applications to Redfish events by using the resource address /cluster/node/<node_name>/redfish/event, where <node_name> is the cluster node running the application.
Deploy your cloud-event-consumer application container and cloud-event-proxy sidecar container in a separate application pod. The cloud-event-consumer application subscribes to the cloud-event-proxy container in the application pod.
Use the following API endpoints to subscribe the cloud-event-consumer application to Redfish events posted by the cloud-event-proxy container at http://localhost:8089/api/ocloudNotifications/v1/ in the application pod:
/api/ocloudNotifications/v1/subscriptions-
POST: Creates a new subscription -
GET: Retrieves a list of subscriptions
-
/api/ocloudNotifications/v1/subscriptions/<subscription_id>-
PUT: Creates a new status ping request for the specified subscription ID
-
/api/ocloudNotifications/v1/health-
GET: Returns the health status ofocloudNotificationsAPI
-
9089 is the default port for the cloud-event-consumer container deployed in the application pod. You can configure a different port for your application as required.
api/ocloudNotifications/v1/subscriptions
HTTP method
GET api/ocloudNotifications/v1/subscriptions
Description
Returns a list of subscriptions. If subscriptions exist, a 200 OK status code is returned along with the list of subscriptions.
Example API response
[
{
"id": "ca11ab76-86f9-428c-8d3a-666c24e34d32",
"endpointUri": "http://localhost:9089/api/ocloudNotifications/v1/dummy",
"uriLocation": "http://localhost:8089/api/ocloudNotifications/v1/subscriptions/ca11ab76-86f9-428c-8d3a-666c24e34d32",
"resource": "/cluster/node/openshift-worker-0.openshift.example.com/redfish/event"
}
]HTTP method
POST api/ocloudNotifications/v1/subscriptions
Description
Creates a new subscription. If a subscription is successfully created, or if it already exists, a 201 Created status code is returned.
| Parameter | Type |
|---|---|
| subscription | data |
Example payload
{
"uriLocation": "http://localhost:8089/api/ocloudNotifications/v1/subscriptions",
"resource": "/cluster/node/openshift-worker-0.openshift.example.com/redfish/event"
}api/ocloudNotifications/v1/subscriptions/<subscription_id>
HTTP method
GET api/ocloudNotifications/v1/subscriptions/<subscription_id>
Description
Returns details for the subscription with ID <subscription_id>
| Parameter | Type |
|---|---|
|
| string |
Example API response
{
"id":"ca11ab76-86f9-428c-8d3a-666c24e34d32",
"endpointUri":"http://localhost:9089/api/ocloudNotifications/v1/dummy",
"uriLocation":"http://localhost:8089/api/ocloudNotifications/v1/subscriptions/ca11ab76-86f9-428c-8d3a-666c24e34d32",
"resource":"/cluster/node/openshift-worker-0.openshift.example.com/redfish/event"
}api/ocloudNotifications/v1/health/
HTTP method
GET api/ocloudNotifications/v1/health/
Description
Returns the health status for the ocloudNotifications REST API.
Example API response
OK12.6. Migrating consumer applications to use HTTP transport for PTP or bare-metal events
If you have previously deployed PTP or bare-metal events consumer applications, you need to update the applications to use HTTP message transport.
Prerequisites
-
You have installed the OpenShift CLI (
oc). -
You have logged in as a user with
cluster-adminprivileges. - You have updated the PTP Operator or Bare Metal Event Relay to version 4.13+ which uses HTTP transport by default.
Procedure
Update your events consumer application to use HTTP transport. Set the
http-event-publishersvariable for the cloud event sidecar deployment.For example, in a cluster with PTP events configured, the following YAML snippet illustrates a cloud event sidecar deployment:
containers: - name: cloud-event-sidecar image: cloud-event-sidecar args: - "--metrics-addr=127.0.0.1:9091" - "--store-path=/store" - "--transport-host=consumer-events-subscription-service.cloud-events.svc.cluster.local:9043" - "--http-event-publishers=ptp-event-publisher-service-NODE_NAME.openshift-ptp.svc.cluster.local:9043"1 - "--api-port=8089"- 1
- The PTP Operator automatically resolves
NODE_NAMEto the host that is generating the PTP events. For example,compute-1.example.com.
In a cluster with bare-metal events configured, set the
http-event-publishersfield tohw-event-publisher-service.openshift-bare-metal-events.svc.cluster.local:9043in the cloud event sidecar deployment CR.Deploy the
consumer-events-subscription-serviceservice alongside the events consumer application. For example:apiVersion: v1 kind: Service metadata: annotations: prometheus.io/scrape: "true" service.alpha.openshift.io/serving-cert-secret-name: sidecar-consumer-secret name: consumer-events-subscription-service namespace: cloud-events labels: app: consumer-service spec: ports: - name: sub-port port: 9043 selector: app: consumer clusterIP: None sessionAffinity: None type: ClusterIP
Chapter 13. Optimizing memory management for workloads by using huge pages
To optimize memory management for specific workloads, configure huge pages. By using these Linux-based system page sizes, you can maintain manual control over memory allocation and override automatic system behaviors.
13.1. What huge pages do
To optimize memory mapping efficiency, understand the function of huge pages. Unlike standard 4Ki blocks, huge pages are larger memory segments that reduce the tracking load on the translation lookaside buffer (TLB) hardware cache.
Memory is managed in blocks known as pages. On most systems, a page is 4Ki; 1Mi of memory is equal to 256 pages; 1Gi of memory is 256,000 pages, and so on. CPUs have a built-in memory management unit that manages a list of these pages in hardware. The translation lookaside buffer (TLB) is a small hardware cache of virtual-to-physical page mappings. If the virtual address passed in a hardware instruction can be found in the TLB, the mapping can be determined quickly. If not, a TLB miss occurs, and the system falls back to slower, software-based address translation, resulting in performance issues. Since the size of the TLB is fixed, the only way to reduce the chance of a TLB miss is to increase the page size.
A huge page is a memory page that is larger than 4Ki. On x86_64 architectures, there are two common huge page sizes: 2Mi and 1Gi. Sizes vary on other architectures. To use huge pages, code must be written so that applications are aware of them. Transparent huge pages (THP) attempt to automate the management of huge pages without application knowledge, but they have limitations. In particular, they are limited to 2Mi page sizes. THP can lead to performance degradation on nodes with high memory utilization or fragmentation because of defragmenting efforts of THP, which can lock memory pages. For this reason, some applications might be designed to or recommend usage of pre-allocated huge pages instead of THP.
In OpenShift Container Platform, applications in a pod can allocate and consume pre-allocated huge pages.
13.2. How huge pages are consumed by apps
To enable applications to consume huge pages, nodes must pre-allocate these memory segments to report capacity. Because a node can only pre-allocate huge pages for a single size, you must align this configuration with your specific workload requirements.
Huge pages can be consumed through container-level resource requirements by using the resource name hugepages-<size>, where size is the most compact binary notation by using integer values supported on a particular node. For example, if a node supports 2048 KiB page sizes, the node exposes a schedulable resource hugepages-2Mi. Unlike CPU or memory, huge pages do not support over-commitment.
apiVersion: v1
kind: Pod
metadata:
generateName: hugepages-volume-
spec:
containers:
- securityContext:
privileged: true
image: rhel7:latest
command:
- sleep
- inf
name: example
volumeMounts:
- mountPath: /dev/hugepages
name: hugepage
resources:
limits:
hugepages-2Mi: 100Mi
memory: "1Gi"
cpu: "1"
volumes:
- name: hugepage
emptyDir:
medium: HugePagesspec.containers.resources.limits.hugepages-2Mi: Specifies the amount of memory forhugepagesas the exact amount to be allocated.ImportantDo not specify this value as the amount of memory for
hugepagesmultiplied by the size of the page. For example, given a huge page size of 2 MB, if you want to use 100 MB of huge-page-backed RAM for your application, then you would allocate 50 huge pages. OpenShift Container Platform handles the math for you. As in the above example, you can specify100MBdirectly.
13.2.1. Allocating huge pages of a specific size
Some platforms support multiple huge page sizes. To allocate huge pages of a specific size, precede the huge pages boot command parameters with a huge page size selection parameter hugepagesz=<size>. The <size> value must be specified in bytes with an optional scale suffix [kKmMgG]. The default huge page size can be defined with the default_hugepagesz=<size> boot parameter.
13.2.2. Huge page requirements
- Huge page requests must equal the limits. This is the default if limits are specified, but requests are not.
- Huge pages are isolated at a pod scope. Container isolation is planned in a future iteration.
-
EmptyDirvolumes backed by huge pages must not consume more huge page memory than the pod request. -
Applications that consume huge pages via
shmget()withSHM_HUGETLBmust run with a supplemental group that matches proc/sys/vm/hugetlb_shm_group.
13.3. Consuming huge pages resources using the Downward API
To inject information about the huge pages resources consumed by a container, use the Downward API. This configuration enables applications to retrieve and use their own memory usage data directly.
You can inject the resource allocation as environment variables, a volume plugin, or both. Applications that you develop and run in the container can determine the resources that are available by reading the environment variables or files in the specified volumes.
Procedure
Create a
hugepages-volume-pod.yamlfile that is similar to the following example:apiVersion: v1 kind: Pod metadata: generateName: hugepages-volume- labels: app: hugepages-example spec: containers: - securityContext: capabilities: add: [ "IPC_LOCK" ] image: rhel7:latest command: - sleep - inf name: example volumeMounts: - mountPath: /dev/hugepages name: hugepage - mountPath: /etc/podinfo name: podinfo resources: limits: hugepages-1Gi: 2Gi memory: "1Gi" cpu: "1" requests: hugepages-1Gi: 2Gi env: - name: REQUESTS_HUGEPAGES_1GI valueFrom: resourceFieldRef: containerName: example resource: requests.hugepages-1Gi volumes: - name: hugepage emptyDir: medium: HugePages - name: podinfo downwardAPI: items: - path: "hugepages_1G_request" resourceFieldRef: containerName: example resource: requests.hugepages-1Gi divisor: 1Giwhere:
spec.containers.securityContext.env.name-
Specifies what resource to read and use from
requests.hugepages-1Giand expose the value as theREQUESTS_HUGEPAGES_1GIenvironment variable. spec.volumes.name.items.path-
Specifies what resource to read and use from
requests.hugepages-1Giand expose the value as the file/etc/podinfo/hugepages_1G_request.
Create the pod from the
hugepages-volume-pod.yamlfile by entering the following command:$ oc create -f hugepages-volume-pod.yaml
Verification
Check the value of the
REQUESTS_HUGEPAGES_1GIenvironment variable:$ oc exec -it $(oc get pods -l app=hugepages-example -o jsonpath='{.items[0].metadata.name}') \ -- env | grep REQUESTS_HUGEPAGES_1GIExample output
REQUESTS_HUGEPAGES_1GI=2147483648Check the value of the
/etc/podinfo/hugepages_1G_requestfile:$ oc exec -it $(oc get pods -l app=hugepages-example -o jsonpath='{.items[0].metadata.name}') \ -- cat /etc/podinfo/hugepages_1G_requestExample output
2
13.4. Configuring huge pages at boot time
To ensure nodes in your OpenShift Container Platform cluster pre-allocate memory for specific workloads, reserve huge pages at boot time. This configuration sets aside memory resources during system startup, offering a distinct alternative to run-time allocation.
There are two ways of reserving huge pages: at boot time and at run time. Reserving at boot time increases the possibility of success because the memory has not yet been significantly fragmented. The Node Tuning Operator currently supports boot-time allocation of huge pages on specific nodes.
The TuneD boot-loader plugin only supports Red Hat Enterprise Linux CoreOS (RHCOS) compute nodes.
Procedure
Label all nodes that need the same huge pages setting by a label by entering the following command:
$ oc label node <node_using_hugepages> node-role.kubernetes.io/worker-hp=Create a file with the following content and name it
hugepages-tuned-boottime.yaml:apiVersion: tuned.openshift.io/v1 kind: Tuned metadata: name: hugepages namespace: openshift-cluster-node-tuning-operator spec: profile: - data: | [main] summary=Boot time configuration for hugepages include=openshift-node [bootloader] cmdline_openshift_node_hugepages=hugepagesz=2M hugepages=50 name: openshift-node-hugepages recommend: - machineConfigLabels: machineconfiguration.openshift.io/role: "worker-hp" priority: 30 profile: openshift-node-hugepages # ...where:
metadata.name-
Specifies the
nameof the Tuned resource tohugepages. spec.profile-
Specifies the
profilesection to allocate huge pages. spec.profile.data- Specifies the order of parameters. The order is important as some platforms support huge pages of various sizes.
spec.recommend.machineConfigLabels- Specifies the enablement of a machine config pool based matching.
Create the Tuned
hugepagesobject by entering the following command:$ oc create -f hugepages-tuned-boottime.yamlCreate a file with the following content and name it
hugepages-mcp.yaml:apiVersion: machineconfiguration.openshift.io/v1 kind: MachineConfigPool metadata: name: worker-hp labels: worker-hp: "" spec: machineConfigSelector: matchExpressions: - {key: machineconfiguration.openshift.io/role, operator: In, values: [worker,worker-hp]} nodeSelector: matchLabels: node-role.kubernetes.io/worker-hp: ""Create the machine config pool by entering the following command:
$ oc create -f hugepages-mcp.yaml
Verification
To check that enough non-fragmented memory exists and that all the nodes in the
worker-hpmachine config pool now have 50 2Mi huge pages allocated, enter the following command:$ oc get node <node_using_hugepages> -o jsonpath="{.status.allocatable.hugepages-2Mi}" 100Mi
13.5. Disabling transparent huge pages
If your application can handle huge pages on its own, you can disable transparent huge pages (THP) to optimally handle huge pages for all types of workloads and avoid the performance regressions that THP can cause.
Disabling THP prevents them from attempting to automate most aspects of creating, managing, and using huge pages. You can disable THP by using the Node Tuning Operator (NTO).
Procedure
Create a file with the following content and name it
thp-disable-tuned.yaml:apiVersion: tuned.openshift.io/v1 kind: Tuned metadata: name: thp-workers-profile namespace: openshift-cluster-node-tuning-operator spec: profile: - data: | [main] summary=Custom tuned profile for OpenShift to turn off THP on worker nodes include=openshift-node [vm] transparent_hugepages=never name: openshift-thp-never-worker recommend: - match: - label: node-role.kubernetes.io/worker priority: 25 profile: openshift-thp-never-worker # ...Create the Tuned object by entering the following command:
$ oc create -f thp-disable-tuned.yamlCheck the list of active profiles by entering the following command::
$ oc get profile -n openshift-cluster-node-tuning-operator
Verification
Log in to one of the nodes and do a regular THP check to verify if the nodes applied the profile successfully:
$ cat /sys/kernel/mm/transparent_hugepage/enabledExample output
always madvise [never]
Chapter 14. Understanding low latency tuning for cluster nodes
To meet 5G network performance requirements, review the principles of low latency tuning for cluster nodes. By using this configuration, you can reduce congestion and maintain the lowest possible latency for edge computing applications.
Maintaining a network architecture with the lowest possible latency is key for meeting the network performance requirements of 5G. Compared to 4G technology, with an average latency of 50 ms, 5G is targeted to reach latency of 1 ms or less. This reduction in latency boosts wireless throughput by a factor of 10.
14.1. About low latency
To support Telco applications that require zero packet loss, tune your environment for low latency. This configuration mitigates network performance degradation, ensuring that your system meets strict reliability requirements.
Tuning for zero packet loss helps mitigate the inherent issues that degrade network performance. For more information, see "Tuning for Zero Packet Loss in Red Hat OpenStack Platform (RHOSP)".
The Edge computing initiative also comes in to play for reducing latency rates. Think of it as being on the edge of the cloud and closer to the user. This greatly reduces the distance between the user and distant data centers, resulting in reduced application response times and performance latency.
Administrators must be able to manage their many Edge sites and local services in a centralized way so that all of the deployments can run at the lowest possible management cost. They also need an easy way to deploy and configure certain nodes of their cluster for real-time low latency and high-performance purposes. Low latency nodes are useful for applications such as Cloud-native Network Functions (CNF) and Data Plane Development Kit (DPDK).
OpenShift Container Platform currently provides mechanisms to tune software on an OpenShift Container Platform cluster for real-time running and low latency (around <20 microseconds reaction time). This includes tuning the kernel and OpenShift Container Platform set values, installing a kernel, and reconfiguring the machine. But this method requires setting up four different Operators and performing many configurations that, when done manually, is complex and could be prone to mistakes.
OpenShift Container Platform uses the Node Tuning Operator to implement automatic tuning to achieve low latency performance for OpenShift Container Platform applications. The cluster administrator uses this performance profile configuration that makes it easier to make these changes in a more reliable way. The administrator can specify whether to update the kernel to kernel-rt, reserve CPUs for cluster and operating system housekeeping duties, including pod infra containers, and isolate CPUs for application containers to run the workloads.
OpenShift Container Platform also supports workload hints for the Node Tuning Operator that can tune the PerformanceProfile to meet the demands of different industry environments. Workload hints are available for highPowerConsumption (very low latency at the cost of increased power consumption) and realTime (priority given to optimum latency). A combination of true/false settings for these hints can be used to deal with application-specific workload profiles and requirements.
Workload hints simplify the fine-tuning of performance to industry sector settings. Instead of a “one size fits all” approach, workload hints can cater to usage patterns such as placing priority on:
- Low latency
- Real-time capability
- Efficient use of power
Ideally, all of the previously listed items are prioritized. Some of these items come at the expense of others however. The Node Tuning Operator is now aware of the workload expectations and better able to meet the demands of the workload. The cluster admin can now specify into which use case that workload falls. The Node Tuning Operator uses the PerformanceProfile to fine tune the performance settings for the workload.
The environment in which an application is operating influences its behavior. For a typical data center with no strict latency requirements, only minimal default tuning is needed that enables CPU partitioning for some high performance workload pods. For data centers and workloads where latency is a higher priority, measures are still taken to optimize power consumption. The most complicated cases are clusters close to latency-sensitive equipment such as manufacturing machinery and software-defined radios. This last class of deployment is often referred to as Far edge. For Far edge deployments, ultra-low latency is the ultimate priority, and is achieved at the expense of power management.
14.2. About Hyper-Threading for low latency and real-time applications
To improve system throughput for parallel workloads, you can use Hyper-Threading to enable a physical CPU core to function as two logical cores, executing independent threads simultaneously. The default OpenShift Container Platform configuration expects Hyper-Threading to be enabled.
For telecommunications applications, design your application infrastructure to minimize latency as much as possible. Hyper-Threading can slow performance times and negatively affect throughput for compute-intensive workloads that require low latency. Disabling Hyper-Threading ensures predictable performance and can decrease processing times for these workloads.
Hyper-Threading implementation and configuration differs depending on the hardware you are running OpenShift Container Platform on. Consult the relevant host hardware tuning information for more details of the Hyper-Threading implementation specific to that hardware. Disabling Hyper-Threading can increase the cost per core of the cluster.
Chapter 15. Tuning nodes for low latency with the performance profile
Tune nodes for low latency by using the cluster performance profile. You can restrict CPUs for infra and application containers, configure huge pages, Hyper-Threading, and configure CPU partitions for latency-sensitive processes.
15.1. Creating a performance profile
You can create a cluster performance profile by using the Performance Profile Creator (PPC) tool. The PPC is a function of the Node Tuning Operator.
The PPC combines information about your cluster with user-supplied configurations to generate a performance profile that is appropriate to your hardware, topology and use-case.
Performance profiles are applicable only to bare-metal environments where the cluster has direct access to the underlying hardware resources. You can configure performances profiles for both single-node OpenShift and multi-node clusters.
The following is a high-level workflow for creating and applying a performance profile in your cluster:
-
Create a machine config pool (MCP) for nodes that you want to target with performance configurations. In single-node OpenShift clusters, you must use the
masterMCP because there is only one node in the cluster. -
Gather information about your cluster using the
must-gathercommand. Use the PPC tool to create a performance profile by using either of the following methods:
- Run the PPC tool by using Podman as described in Running the Performance Profile Creator using Podman. .
- Run the PPC tool by using a wrapper script as described in Running the Performance Profile Creator wrapper script..
- Configure the performance profile for your use case and apply the performance profile to your cluster.
15.1.1. About the Performance Profile Creator
The Performance Profile Creator (PPC) is a command-line tool and is delivered with the Node Tuning Operator. You can use the PPC CLI to create a performance profile for your cluster.
Initially, you can use the PPC tool to process the must-gather data to display key performance configurations for your cluster, including the following information:
- NUMA cell partitioning with the allocated CPU IDs
- Hyper-Threading node configuration
You can use this information to help you configure the performance profile.
Specify performance configuration arguments to the PPC tool to generate a proposed performance profile that is appropriate for your hardware, topology, and use-case.
You can run the PPC by using one of the following methods:
- Run the PPC by using Podman
- Run the PPC by using the wrapper script
Using the wrapper script abstracts some of the more granular Podman tasks into an executable script. For example, the wrapper script handles tasks such as pulling and running the required container image, mounting directories into the container, and providing parameters directly to the container through Podman. Both methods achieve the same result.
15.1.2. Creating a machine config pool to target nodes for performance tuning
For multi-node clusters, you can define a machine config pool (MCP) to identify the target nodes that you want to configure with a performance profile.
In single-node OpenShift clusters, you must use the master MCP because there is only one node in the cluster. You do not need to create a separate MCP for single-node OpenShift clusters.
Prerequisites
-
You have
cluster-adminrole access. -
You installed the OpenShift CLI (
oc).
Procedure
Label the target nodes for configuration by running the following command:
$ oc label node <node_name> node-role.kubernetes.io/worker-cnf=""-
<node_name>: Specifies the name of your node. This example applies theworker-cnflabel.
-
Create a
MachineConfigPoolresource containing the target nodes:Create a YAML file that defines the
MachineConfigPoolresource:Example
mcp-worker-cnf.yamlfileapiVersion: machineconfiguration.openshift.io/v1 kind: MachineConfigPool metadata: name: worker-cnf labels: machineconfiguration.openshift.io/role: worker-cnf spec: machineConfigSelector: matchExpressions: - { key: machineconfiguration.openshift.io/role, operator: In, values: [worker, worker-cnf], } paused: false nodeSelector: matchLabels: node-role.kubernetes.io/worker-cnf: ""where:
metadata.name-
Specifies a name for the
MachineConfigPoolresource. machineconfiguration.openshift.io/role- Specifes a unique label for the machine config pool.
node-role.kubernetes.io/worker-cnf- Specifies the nodes with the target label that you defined.
Apply the
MachineConfigPoolresource by running the following command:$ oc apply -f mcp-worker-cnf.yamlExample output
machineconfigpool.machineconfiguration.openshift.io/worker-cnf created
Verification
Check the machine config pools in your cluster by running the following command:
$ oc get mcpExample output
NAME CONFIG UPDATED UPDATING DEGRADED MACHINECOUNT READYMACHINECOUNT UPDATEDMACHINECOUNT DEGRADEDMACHINECOUNT AGE master rendered-master-58433c7c3c1b4ed5ffef95234d451490 True False False 3 3 3 0 6h46m worker rendered-worker-168f52b168f151e4f853259729b6azc4 True False False 2 2 2 0 6h46m worker-cnf rendered-worker-cnf-168f52b168f151e4f853259729b6azc4 True False False 1 1 1 0 73s
15.1.3. Gathering data about your cluster for the PPC
The Performance Profile Creator (PPC) tool requires must-gather data. As a cluster administrator, run the must-gather command to capture information about your cluster.
Prerequisites
-
Access to the cluster as a user with the
cluster-adminrole. -
You installed the OpenShift CLI (
oc). - You identified a target MCP that you want to configure with a performance profile.
Procedure
-
Navigate to the directory where you want to store the
must-gatherdata. Collect cluster information by running the following command:
$ oc adm must-gatherThe command creates a folder with the
must-gatherdata in your local directory with a naming format similar to the following:must-gather.local.1971646453781853027.Optional: Create a compressed file from the
must-gatherdirectory:$ tar cvaf must-gather.tar.gz <must_gather_folder><must_gather_folder>: Specifies the name of themust-gatherdata folder.NoteCompressed output is required if you are running the Performance Profile Creator wrapper script.
15.1.4. Running the Performance Profile Creator using Podman
As a cluster administrator, you can use Podman with the Performance Profile Creator (PPC) to create a performance profile.
For more information about the PPC arguments, see the section "Performance Profile Creator arguments".
The PPC uses the must-gather data from your cluster to create the performance profile. If you make any changes to your cluster, such as relabeling a node targeted for performance configuration, you must re-create the must-gather data before running PPC again.
Prerequisites
-
Access to the cluster as a user with the
cluster-adminrole. - A cluster installed on bare-metal hardware.
-
You installed
podmanand the OpenShift CLI (oc). - Access to the Node Tuning Operator image.
- You identified a machine config pool containing target nodes for configuration.
-
You have access to the
must-gatherdata for your cluster.
Procedure
Check the machine config pool by running the following command:
$ oc get mcpExample output
NAME CONFIG UPDATED UPDATING DEGRADED MACHINECOUNT READYMACHINECOUNT UPDATEDMACHINECOUNT DEGRADEDMACHINECOUNT AGE master rendered-master-58433c8c3c0b4ed5feef95434d455490 True False False 3 3 3 0 8h worker rendered-worker-668f56a164f151e4a853229729b6adc4 True False False 2 2 2 0 8h worker-cnf rendered-worker-cnf-668f56a164f151e4a853229729b6adc4 True False False 1 1 1 0 79mUse Podman to authenticate to
registry.redhat.ioby running the following command:$ podman login registry.redhat.ioUsername: <user_name> Password: <password>Optional: Display help for the PPC tool by running the following command:
$ podman run --rm --entrypoint performance-profile-creator registry.redhat.io/openshift4/ose-cluster-node-tuning-rhel9-operator:v4.16 -hExample output
A tool that automates creation of Performance Profiles Usage: performance-profile-creator [flags] Flags: --disable-ht Disable Hyperthreading --enable-hardware-tuning Enable setting maximum cpu frequencies -h, --help help for performance-profile-creator --info string Show cluster information; requires --must-gather-dir-path, ignore the other arguments. [Valid values: log, json] (default "log") --mcp-name string MCP name corresponding to the target machines (required) --must-gather-dir-path string Must gather directory path (default "must-gather") --offlined-cpu-count int Number of offlined CPUs --per-pod-power-management Enable Per Pod Power Management --power-consumption-mode string The power consumption mode. [Valid values: default, low-latency, ultra-low-latency] (default "default") --profile-name string Name of the performance profile to be created (default "performance") --reserved-cpu-count int Number of reserved CPUs (required) --rt-kernel Enable Real Time Kernel (required) --split-reserved-cpus-across-numa Split the Reserved CPUs across NUMA nodes --topology-manager-policy string Kubelet Topology Manager Policy of the performance profile to be created. [Valid values: single-numa-node, best-effort, restricted] (default "restricted") --user-level-networking Run with User level Networking(DPDK) enabledTo display information about the cluster, run the PPC tool with the
logargument by running the following command:$ podman run --entrypoint performance-profile-creator -v <path_to_must_gather>:/must-gather:z registry.redhat.io/openshift4/ose-cluster-node-tuning-rhel9-operator:v4.16 --info log --must-gather-dir-path /must-gather-
--entrypoint performance-profile-creatordefines the performance profile creator as a new entry point topodman. -v <path_to_must_gather>specifies the path to either of the following components:-
The directory containing the
must-gatherdata. -
An existing directory containing the
must-gatherdecompressed .tar file.
-
The directory containing the
--info logspecifies a value for the output format.Example output
level=info msg="Cluster info:" level=info msg="MCP 'master' nodes:" level=info msg=--- level=info msg="MCP 'worker' nodes:" level=info msg="Node: host.example.com (NUMA cells: 1, HT: true)" level=info msg="NUMA cell 0 : [0 1 2 3]" level=info msg="CPU(s): 4" level=info msg="Node: host1.example.com (NUMA cells: 1, HT: true)" level=info msg="NUMA cell 0 : [0 1 2 3]" level=info msg="CPU(s): 4" level=info msg=--- level=info msg="MCP 'worker-cnf' nodes:" level=info msg="Node: host2.example.com (NUMA cells: 1, HT: true)" level=info msg="NUMA cell 0 : [0 1 2 3]" level=info msg="CPU(s): 4" level=info msg=---
-
Create a performance profile by running the following command. The example uses sample PPC arguments and values:
$ podman run --entrypoint performance-profile-creator -v <path_to_must_gather>:/must-gather:z registry.redhat.io/openshift4/ose-cluster-node-tuning-rhel9-operator:v4.16 --mcp-name=worker-cnf --reserved-cpu-count=1 --rt-kernel=true --split-reserved-cpus-across-numa=false --must-gather-dir-path /must-gather --power-consumption-mode=ultra-low-latency --offlined-cpu-count=1 > my-performance-profile.yaml-v <path_to_must_gather>specifies the path to either of the following components:-
The directory containing the
must-gatherdata. -
The directory containing the
must-gatherdecompressed .tar file.
-
The directory containing the
-
--mcp-name=worker-cnfspecifies theworker-cnfmachine config pool. -
--reserved-cpu-count=1specifies one reserved CPU. -
--rt-kernel=trueenables the real-time kernel. -
--split-reserved-cpus-across-numa=falsedisables reserved CPUs splitting across NUMA nodes. -
--power-consumption-mode=ultra-low-latencyspecifies minimal latency at the cost of increased power consumption. --offlined-cpu-count=1specifies one offlined CPU.NoteThe
mcp-nameargument in this example is set toworker-cnfbased on the output of the commandoc get mcp. For single-node OpenShift use--mcp-name=master.Example output
level=info msg="Nodes targeted by worker-cnf MCP are: [worker-2]" level=info msg="NUMA cell(s): 1" level=info msg="NUMA cell 0 : [0 1 2 3]" level=info msg="CPU(s): 4" level=info msg="1 reserved CPUs allocated: 0 " level=info msg="2 isolated CPUs allocated: 2-3" level=info msg="Additional Kernel Args based on configuration: []"
Review the created YAML file by running the following command:
$ cat my-performance-profile.yamlExample output
--- apiVersion: performance.openshift.io/v2 kind: PerformanceProfile metadata: name: performance spec: cpu: isolated: 2-3 offlined: "1" reserved: "0" machineConfigPoolSelector: machineconfiguration.openshift.io/role: worker-cnf nodeSelector: node-role.kubernetes.io/worker-cnf: "" numa: topologyPolicy: restricted realTimeKernel: enabled: true workloadHints: highPowerConsumption: true perPodPowerManagement: false realTime: trueApply the generated profile:
$ oc apply -f my-performance-profile.yamlExample output
performanceprofile.performance.openshift.io/performance created
15.1.5. Running the Performance Profile Creator wrapper script
The wrapper script simplifies the process of creating a performance profile with the Performance Profile Creator (PPC) tool. The script handles tasks such as pulling and running the required container image, mounting directories into the container, and providing parameters directly to the container through Podman.
For more information about the Performance Profile Creator arguments, see the section "Performance Profile Creator arguments".
The PPC uses the must-gather data from your cluster to create the performance profile. If you make any changes to your cluster, such as relabeling a node targeted for performance configuration, you must re-create the must-gather data before running PPC again.
Prerequisites
-
Access to the cluster as a user with the
cluster-adminrole. - A cluster installed on bare-metal hardware.
-
You installed
podmanand the OpenShift CLI (oc). - Access to the Node Tuning Operator image.
- You identified a machine config pool containing target nodes for configuration.
-
Access to the
must-gathertarball.
Procedure
Create a file on your local machine named, for example,
run-perf-profile-creator.sh:$ vi run-perf-profile-creator.shPaste the following code into the file:
#!/bin/bash readonly CONTAINER_RUNTIME=${CONTAINER_RUNTIME:-podman} readonly CURRENT_SCRIPT=$(basename "$0") readonly CMD="${CONTAINER_RUNTIME} run --entrypoint performance-profile-creator" readonly IMG_EXISTS_CMD="${CONTAINER_RUNTIME} image exists" readonly IMG_PULL_CMD="${CONTAINER_RUNTIME} image pull" readonly MUST_GATHER_VOL="/must-gather" NTO_IMG="registry.redhat.io/openshift4/ose-cluster-node-tuning-rhel9-operator:v4.16" MG_TARBALL="" DATA_DIR="" usage() { print "Wrapper usage:" print " ${CURRENT_SCRIPT} [-h] [-p image][-t path] -- [performance-profile-creator flags]" print "" print "Options:" print " -h help for ${CURRENT_SCRIPT}" print " -p Node Tuning Operator image" print " -t path to a must-gather tarball" ${IMG_EXISTS_CMD} "${NTO_IMG}" && ${CMD} "${NTO_IMG}" -h } function cleanup { [ -d "${DATA_DIR}" ] && rm -rf "${DATA_DIR}" } trap cleanup EXIT exit_error() { print "error: $*" usage exit 1 } print() { echo "$*" >&2 } check_requirements() { ${IMG_EXISTS_CMD} "${NTO_IMG}" || ${IMG_PULL_CMD} "${NTO_IMG}" || \ exit_error "Node Tuning Operator image not found" [ -n "${MG_TARBALL}" ] || exit_error "Must-gather tarball file path is mandatory" [ -f "${MG_TARBALL}" ] || exit_error "Must-gather tarball file not found" DATA_DIR=$(mktemp -d -t "${CURRENT_SCRIPT}XXXX") || exit_error "Cannot create the data directory" tar -zxf "${MG_TARBALL}" --directory "${DATA_DIR}" || exit_error "Cannot decompress the must-gather tarball" chmod a+rx "${DATA_DIR}" return 0 } main() { while getopts ':hp:t:' OPT; do case "${OPT}" in h) usage exit 0 ;; p) NTO_IMG="${OPTARG}" ;; t) MG_TARBALL="${OPTARG}" ;; ?) exit_error "invalid argument: ${OPTARG}" ;; esac done shift $((OPTIND - 1)) check_requirements || exit 1 ${CMD} -v "${DATA_DIR}:${MUST_GATHER_VOL}:z" "${NTO_IMG}" "$@" --must-gather-dir-path "${MUST_GATHER_VOL}" echo "" 1>&2 } main "$@"Add execute permissions for everyone on this script:
$ chmod a+x run-perf-profile-creator.shUse Podman to authenticate to
registry.redhat.ioby running the following command:$ podman login registry.redhat.ioUsername: <user_name> Password: <password>Optional: Display help for the PPC tool by running the following command:
$ ./run-perf-profile-creator.sh -hWrapper usage: run-perf-profile-creator.sh [-h] [-p image][-t path] -- [performance-profile-creator flags] Options: -h help for run-perf-profile-creator.sh -p Node Tuning Operator image -t path to a must-gather tarball A tool that automates creation of Performance Profiles Usage: performance-profile-creator [flags] Flags: --disable-ht Disable Hyperthreading -h, --help help for performance-profile-creator --info string Show cluster information; requires --must-gather-dir-path, ignore the other arguments. [Valid values: log, json] (default "log") --mcp-name string MCP name corresponding to the target machines (required) --must-gather-dir-path string Must gather directory path (default "must-gather") --offlined-cpu-count int Number of offlined CPUs --per-pod-power-management Enable Per Pod Power Management --power-consumption-mode string The power consumption mode. [Valid values: default, low-latency, ultra-low-latency] (default "default") --profile-name string Name of the performance profile to be created (default "performance") --reserved-cpu-count int Number of reserved CPUs (required) --rt-kernel Enable Real Time Kernel (required) --split-reserved-cpus-across-numa Split the Reserved CPUs across NUMA nodes --topology-manager-policy string Kubelet Topology Manager Policy of the performance profile to be created. [Valid values: single-numa-node, best-effort, restricted] (default "restricted") --user-level-networking Run with User level Networking(DPDK) enabled --enable-hardware-tuning Enable setting maximum CPU frequenciesNoteYou can optionally set a path for the Node Tuning Operator image using the
-poption. If you do not set a path, the wrapper script uses the default image:registry.redhat.io/openshift4/ose-cluster-node-tuning-rhel9-operator:v4.16.To display information about the cluster, run the PPC tool with the
logargument by running the following command:$ ./run-perf-profile-creator.sh -t /<path_to_must_gather_dir>/must-gather.tar.gz -- --info=log-t /<path_to_must_gather_dir>/must-gather.tar.gz: Specifies the path to directory containing the must-gather tarball. This is a required argument for the wrapper script.Example output
level=info msg="Cluster info:" level=info msg="MCP 'master' nodes:" level=info msg=--- level=info msg="MCP 'worker' nodes:" level=info msg="Node: host.example.com (NUMA cells: 1, HT: true)" level=info msg="NUMA cell 0 : [0 1 2 3]" level=info msg="CPU(s): 4" level=info msg="Node: host1.example.com (NUMA cells: 1, HT: true)" level=info msg="NUMA cell 0 : [0 1 2 3]" level=info msg="CPU(s): 4" level=info msg=--- level=info msg="MCP 'worker-cnf' nodes:" level=info msg="Node: host2.example.com (NUMA cells: 1, HT: true)" level=info msg="NUMA cell 0 : [0 1 2 3]" level=info msg="CPU(s): 4" level=info msg=---
Create a performance profile by running the following command. The example command uses sample PPC arguments and values.
$ ./run-perf-profile-creator.sh -t /path-to-must-gather/must-gather.tar.gz -- --mcp-name=worker-cnf --reserved-cpu-count=1 --rt-kernel=true --split-reserved-cpus-across-numa=false --power-consumption-mode=ultra-low-latency --offlined-cpu-count=1 > my-performance-profile.yaml-
--mcp-name=worker-cnfspecifies theworker-cnfmachine config pool. -
--reserved-cpu-count=1specifies one reserved CPU. -
--rt-kernel=trueenables the real-time kernel. -
--split-reserved-cpus-across-numa=falsedisables reserved CPUs splitting across NUMA nodes. -
--power-consumption-mode=ultra-low-latencyspecifies minimal latency at the cost of increased power consumption. --offlined-cpu-count=1specifies one offlined CPUs.NoteThe
mcp-nameargument in this example is set toworker-cnfbased on the output of the commandoc get mcp. For single-node OpenShift use--mcp-name=master.
-
Review the created YAML file by running the following command:
$ cat my-performance-profile.yamlExample output
apiVersion: performance.openshift.io/v2 kind: PerformanceProfile metadata: name: performance spec: cpu: isolated: 2-3 offlined: "1" reserved: "0" machineConfigPoolSelector: machineconfiguration.openshift.io/role: worker-cnf nodeSelector: node-role.kubernetes.io/worker-cnf: "" numa: topologyPolicy: restricted realTimeKernel: enabled: true workloadHints: highPowerConsumption: true perPodPowerManagement: false realTime: trueApply the generated profile:
$ oc apply -f my-performance-profile.yamlExample output
performanceprofile.performance.openshift.io/performance created
15.1.6. Performance Profile Creator arguments
To customize the generation of performance profiles, review the arguments for the Performance Profile Creator. By using these command-line options, you can define specific tuning parameters, such as CPU isolation and huge pages, to meet your workload requirements.
| Argument | Description |
|---|---|
|
|
Name for MCP; for example, |
|
| The path of the must gather directory.
This argument is only required if you run the PPC tool by using Podman. If you use the PPC with the wrapper script, do not use this argument. Instead, specify the directory path to the |
|
| Number of reserved CPUs. Use a natural number greater than zero. |
|
| Enables real-time kernel.
Possible values: |
| Argument | Description |
|---|---|
|
| Disable Hyper-Threading.
Possible values:
Default: Warning
If this argument is set to |
| enable-hardware-tuning | Enable the setting of maximum CPU frequencies. To enable this feature, set the maximum frequency for applications running on isolated and reserved CPUs for both of the following fields:
This is an advanced feature. If you configure hardware tuning, the generated |
|
|
This captures cluster information. This argument also requires the Possible values:
Default: |
|
| Number of offlined CPUs. Note Use a natural number greater than zero. If not enough logical processors are offlined, then error messages are logged. The messages are: |
|
| The power consumption mode. Possible values:
Default: |
|
|
Enable per pod power management. You cannot use this argument if you configured
Possible values:
Default: |
|
| Name of the performance profile to create.
Default: |
|
| Split the reserved CPUs across NUMA nodes.
Possible values:
Default: |
|
| Kubelet Topology Manager policy of the performance profile to be created. Possible values:
Default: |
|
| Run with user level networking (DPDK) enabled.
Possible values:
Default: |
15.2. Reference performance profiles
Use the following reference performance profiles as the basis to develop your own custom profiles.
15.2.1. Performance profile template for clusters that use OVS-DPDK on OpenStack
To maximize machine performance in a cluster that uses Open vSwitch with the Data Plane Development Kit (OVS-DPDK) on Red Hat OpenStack Platform (RHOSP), you can use a performance profile.
You can use the following performance profile template to create a profile for your deployment.
Performance profile template for clusters that use OVS-DPDK
apiVersion: performance.openshift.io/v2
kind: PerformanceProfile
metadata:
name: cnf-performanceprofile
spec:
additionalKernelArgs:
- nmi_watchdog=0
- audit=0
- mce=off
- processor.max_cstate=1
- idle=poll
- intel_idle.max_cstate=0
- default_hugepagesz=1GB
- hugepagesz=1G
- intel_iommu=on
cpu:
isolated: <CPU_ISOLATED>
reserved: <CPU_RESERVED>
hugepages:
defaultHugepagesSize: 1G
pages:
- count: <HUGEPAGES_COUNT>
node: 0
size: 1G
nodeSelector:
node-role.kubernetes.io/worker: ''
globallyDisableIrqLoadBalancing: true
realTimeKernel:
enabled: false
Insert values that are appropriate for your configuration for the CPU_ISOLATED, CPU_RESERVED, and HUGEPAGES_COUNT keys.
15.2.2. Telco RAN DU reference design performance profile
You can use a pre-configured design performance profile that configures node-level performance settings for OpenShift Container Platform clusters on commodity hardware to host telco RAN DU workloads.
Telco RAN DU reference design performance profile
apiVersion: performance.openshift.io/v2
kind: PerformanceProfile
metadata:
# if you change this name make sure the 'include' line in TunedPerformancePatch.yaml
# matches this name: include=openshift-node-performance-${PerformanceProfile.metadata.name}
# Also in file 'validatorCRs/informDuValidator.yaml':
# name: 50-performance-${PerformanceProfile.metadata.name}
name: openshift-node-performance-profile
annotations:
ran.openshift.io/reference-configuration: "ran-du.redhat.com"
spec:
additionalKernelArgs:
- "rcupdate.rcu_normal_after_boot=0"
- "efi=runtime"
- "vfio_pci.enable_sriov=1"
- "vfio_pci.disable_idle_d3=1"
- "module_blacklist=irdma"
cpu:
isolated: $isolated
reserved: $reserved
hugepages:
defaultHugepagesSize: $defaultHugepagesSize
pages:
- size: $size
count: $count
node: $node
machineConfigPoolSelector:
pools.operator.machineconfiguration.openshift.io/$mcp: ""
nodeSelector:
node-role.kubernetes.io/$mcp: ''
numa:
topologyPolicy: "restricted"
# To use the standard (non-realtime) kernel, set enabled to false
realTimeKernel:
enabled: true
workloadHints:
# WorkloadHints defines the set of upper level flags for different type of workloads.
# See https://github.com/openshift/cluster-node-tuning-operator/blob/master/docs/performanceprofile/performance_profile.md#workloadhints
# for detailed descriptions of each item.
# The configuration below is set for a low latency, performance mode.
realTime: true
highPowerConsumption: false
perPodPowerManagement: false15.2.3. Telco core reference design performance profile
You can use a pre-configured design performance profile that configures node-level performance settings for OpenShift Container Platform clusters on commodity hardware to host telco core workloads.
Telco core reference design performance profile
# required
# count: 1
apiVersion: performance.openshift.io/v2
kind: PerformanceProfile
metadata:
name: $name
annotations:
# Some pods want the kernel stack to ignore IPv6 router Advertisement.
kubeletconfig.experimental: |
{"allowedUnsafeSysctls":["net.ipv6.conf.all.accept_ra"]}
spec:
cpu:
# node0 CPUs: 0-17,36-53
# node1 CPUs: 18-34,54-71
# siblings: (0,36), (1,37)...
# we want to reserve the first Core of each NUMA socket
#
# no CPU left behind! all-cpus == isolated + reserved
isolated: $isolated # eg 1-17,19-35,37-53,55-71
reserved: $reserved # eg 0,18,36,54
# Guaranteed QoS pods will disable IRQ balancing for cores allocated to the pod.
# default value of globallyDisableIrqLoadBalancing is false
globallyDisableIrqLoadBalancing: false
hugepages:
defaultHugepagesSize: 1G
pages:
# 32GB per numa node
- count: $count # eg 64
size: 1G
machineConfigPoolSelector:
# For SNO: machineconfiguration.openshift.io/role: 'master'
pools.operator.machineconfiguration.openshift.io/worker: ''
nodeSelector:
# For SNO: node-role.kubernetes.io/master: ""
node-role.kubernetes.io/worker: ""
workloadHints:
realTime: false
highPowerConsumption: false
perPodPowerManagement: true
realTimeKernel:
enabled: false
numa:
# All guaranteed QoS containers get resources from a single NUMA node
topologyPolicy: "single-numa-node"
net:
userLevelNetworking: false15.3. Supported performance profile API versions
The Node Tuning Operator supports v2, v1, and v1alpha1 for the performance profile apiVersion field. The v1 and v1alpha1 APIs are identical. The v2 API includes an optional boolean field globallyDisableIrqLoadBalancing with a default value of false.
- Upgrading the performance profile to use device interrupt processing
When you upgrade the Node Tuning Operator performance profile custom resource definition (CRD) from v1 or v1alpha1 to v2,
globallyDisableIrqLoadBalancingis set totrueon existing profiles.NotegloballyDisableIrqLoadBalancingtoggles whether IRQ load balancing will be disabled for the Isolated CPU set. When the option is set totrueit disables IRQ load balancing for the Isolated CPU set. Setting the option tofalseallows the IRQs to be balanced across all CPUs.- Upgrading Node Tuning Operator API from v1alpha1 to v1
- When upgrading Node Tuning Operator API version from v1alpha1 to v1, the v1alpha1 performance profiles are converted on-the-fly using a "None" Conversion strategy and served to the Node Tuning Operator with API version v1.
- Upgrading Node Tuning Operator API from v1alpha1 or v1 to v2
-
When upgrading from an older Node Tuning Operator API version, the existing v1 and v1alpha1 performance profiles are converted using a conversion webhook that injects the
globallyDisableIrqLoadBalancingfield with a value oftrue.
15.4. Node power consumption and realtime processing with workload hints
You can create a performance profile appropriate for the hardware and topology of an environment by using the Performance Profile Creator (PPC) tool.
The following table describes the possible values set for the power-consumption-mode flag associated with the PPC tool and the workload hint that is applied.
| Performance Profile creator setting | Hint | Environment | Description |
|---|---|---|---|
| Default |
| High throughput cluster without latency requirements | Performance achieved through CPU partitioning only. |
| Low-latency |
| Regional data-centers | Both energy savings and low-latency are desirable: compromise between power management, latency and throughput. |
| Ultra-low-latency |
| Far edge clusters, latency critical workloads | Optimized for absolute minimal latency and maximum determinism at the cost of increased power consumption. |
| Per-pod power management |
| Critical and non-critical workloads | Allows for power management per pod. |
The following configuration is commonly used in a telco RAN DU deployment:
apiVersion: performance.openshift.io/v2
kind: PerformanceProfile
metadata:
name: workload-hints
spec:
...
workloadHints:
realTime: true
highPowerConsumption: false
perPodPowerManagement: falseperPodPowerManagement- Specifies to disable some debugging and monitoring features that can affect system latency.
When the realTime workload hint flag is set to true in a performance profile, add the cpu-quota.crio.io: disable annotation to every guaranteed pod with pinned CPUs. This annotation is necessary to prevent the degradation of the process performance within the pod. If the realTime workload hint is not explicitly set, it defaults to true.
For more information how combinations of power consumption and real-time settings impact latency, see "Understanding workload hints".
15.5. Configuring power saving for nodes that run colocated high and low priority workloads
You can enable power savings for a node that has low priority workloads that are colocated with high priority workloads without impacting the latency or throughput of the high priority workloads. Power saving is possible without modifications to the workloads themselves.
The feature is supported on Intel Ice Lake and later generations of Intel CPUs. The capabilities of the processor might impact the latency and throughput of the high priority workloads.
Prerequisites
- You enabled C-states and operating system controlled P-states in the BIOS
Procedure
Generate a
PerformanceProfilewith theper-pod-power-managementargument set totrue:$ podman run --entrypoint performance-profile-creator -v \ /must-gather:/must-gather:z registry.redhat.io/openshift4/ose-cluster-node-tuning-rhel9-operator:v4.16 \ --mcp-name=worker-cnf --reserved-cpu-count=20 --rt-kernel=true \ --split-reserved-cpus-across-numa=false --topology-manager-policy=single-numa-node \ --must-gather-dir-path /must-gather --power-consumption-mode=low-latency \ --per-pod-power-management=true > my-performance-profile.yamlThe
power-consumption-modeargument must bedefaultorlow-latencywhen theper-pod-power-managementargument is set totrue.Example
PerformanceProfilewithperPodPowerManagementapiVersion: performance.openshift.io/v2 kind: PerformanceProfile metadata: name: performance spec: [.....] workloadHints: realTime: true highPowerConsumption: false perPodPowerManagement: true # ...Set the default
cpufreqgovernor as an additional kernel argument in thePerformanceProfilecustom resource (CR):apiVersion: performance.openshift.io/v2 kind: PerformanceProfile metadata: name: performance spec: ... additionalKernelArgs: - cpufreq.default_governor=schedutil # ...where:
cpufreq.default_governor=schedutil-
Specifies using the
schedutilgovernor. You can use other governors, such as theondemandorpowersavegovernors.
Set the maximum CPU frequency in the
TunedPerformancePatchCR:spec: profile: - data: | [sysfs] /sys/devices/system/cpu/intel_pstate/max_perf_pct = <x>where:
/sys/devices/system/cpu/intel_pstate/max_perf_pct-
Specifies the
max_perf_pctthat controls the maximum frequency that thecpufreqdriver is allowed to set as a percentage of the maximum supported cpu frequency. This value applies to all CPUs. You can check the maximum supported frequency in/sys/devices/system/cpu/cpu0/cpufreq/cpuinfo_max_freq. As a starting point, you can use a percentage that caps all CPUs at theAll Cores Turbofrequency. TheAll Cores Turbofrequency is the frequency that all cores will run at when the cores are all fully occupied.
15.6. CPUs for infra and application containers
Generic housekeeping and workload tasks use CPUs in a way that might impact latency-sensitive processes. By default, the container runtime uses all online CPUs to run all containers together, which can result in context switches and spikes in latency.
Partitioning the CPUs prevents noisy processes from interfering with latency-sensitive processes by separating them from each other. The following table describes how processes run on a CPU after you have tuned the node using the Node Tuning Operator:
| Process type | Details |
|---|---|
|
| Runs on any CPU except where low latency workload is running |
| Infrastructure pods | Runs on any CPU except where low latency workload is running |
| Interrupts | Redirects to reserved CPUs (optional in OpenShift Container Platform 4.7 and later) |
| Kernel processes | Pins to reserved CPUs |
| Latency-sensitive workload pods | Pins to a specific set of exclusive CPUs from the isolated pool |
| OS processes/systemd services | Pins to reserved CPUs |
The allocatable capacity of cores on a node for pods of all QoS process types, Burstable, BestEffort, or Guaranteed, is equal to the capacity of the isolated pool. The capacity of the reserved pool is removed from the node’s total core capacity for use by the cluster and operating system housekeeping duties.
- Example 1
-
A node features a capacity of 100 cores. Using a performance profile, the cluster administrator allocates 50 cores to the isolated pool and 50 cores to the reserved pool. The cluster administrator assigns 25 cores to QoS
Guaranteedpods and 25 cores forBestEffortorBurstablepods. This matches the capacity of the isolated pool. - Example 2
-
A node features a capacity of 100 cores. Using a performance profile, the cluster administrator allocates 50 cores to the isolated pool and 50 cores to the reserved pool. The cluster administrator assigns 50 cores to QoS
Guaranteedpods and one core forBestEffortorBurstablepods. This exceeds the capacity of the isolated pool by one core. Pod scheduling fails because of insufficient CPU capacity.
The exact partitioning pattern to use depends on many factors like hardware, workload characteristics and the expected system load. Some sample use cases are as follows:
- If the latency-sensitive workload uses specific hardware, such as a network interface controller (NIC), ensure that the CPUs in the isolated pool are as close as possible to this hardware. At a minimum, you should place the workload in the same Non-Uniform Memory Access (NUMA) node.
- The reserved pool is used for handling all interrupts. When depending on system networking, allocate a sufficiently-sized reserve pool to handle all the incoming packet interrupts. In 4.16 and later versions, workloads can optionally be labeled as sensitive.
The decision regarding which specific CPUs should be used for reserved and isolated partitions requires detailed analysis and measurements. Factors like NUMA affinity of devices and memory play a role. The selection also depends on the workload architecture and the specific use case.
The reserved and isolated CPU pools must not overlap and together must span all available cores in the worker node.
To ensure that housekeeping tasks and workloads do not interfere with each other, specify two groups of CPUs in the spec section of the performance profile.
-
isolated- Specifies the CPUs for the application container workloads. These CPUs have the lowest latency. Processes in this group have no interruptions and can, for example, reach much higher DPDK zero packet loss bandwidth. -
reserved- Specifies the CPUs for the cluster and operating system housekeeping duties. Threads in thereservedgroup are often busy. Do not run latency-sensitive applications in thereservedgroup. Latency-sensitive applications run in theisolatedgroup.
15.7. Restricting CPUs for infra and application containers
To ensure optimal cluster stability and performance, restrict CPUs for infrastructure and application containers. This configuration isolates workloads to specific CPU sets, preventing resource contention between critical system components and user applications.
Procedure
Create a performance profile appropriate for the environment’s hardware and topology. The following example adds the
reservedandisolatedparameters with the CPUs you want reserved and isolated for the infra and application containers:apiVersion: performance.openshift.io/v2 kind: PerformanceProfile metadata: name: infra-cpus spec: cpu: reserved: "0-4,9" isolated: "5-8" nodeSelector: node-role.kubernetes.io/worker: "" # ...where:
spec.cpu.reserved- Specifies which CPUs are for infra containers to perform cluster and operating system housekeeping duties.
spec.cpu.isolated- Specifies which CPUs are for application containers to run workloads.
spec.nodeSelector- Specifies a node selector to apply the performance profile to specific nodes. Optional parameter.
15.8. Configuring Hyper-Threading for a cluster
To configure Hyper-Threading for an OpenShift Container Platform cluster, set the CPU threads in the performance profile to the same cores that are configured for the reserved or isolated CPU pools.
If you configure a performance profile, and subsequently change the Hyper-Threading configuration for the host, ensure that you update the CPU isolated and reserved fields in the PerformanceProfile YAML to match the new configuration.
Disabling a previously enabled host Hyper-Threading configuration can cause the CPU core IDs listed in the PerformanceProfile YAML to be incorrect. This incorrect configuration can cause the node to become unavailable because the listed CPUs can no longer be found.
Prerequisites
-
Access to the cluster as a user with the
cluster-adminrole. -
Install the OpenShift CLI (
oc).
Procedure
Ascertain which threads are running on what CPUs for the host you want to configure.
You can view which threads are running on the host CPUs by logging in to the cluster and running the following command:
$ lscpu --all --extendedExample output
CPU NODE SOCKET CORE L1d:L1i:L2:L3 ONLINE MAXMHZ MINMHZ 0 0 0 0 0:0:0:0 yes 4800.0000 400.0000 1 0 0 1 1:1:1:0 yes 4800.0000 400.0000 2 0 0 2 2:2:2:0 yes 4800.0000 400.0000 3 0 0 3 3:3:3:0 yes 4800.0000 400.0000 4 0 0 0 0:0:0:0 yes 4800.0000 400.0000 5 0 0 1 1:1:1:0 yes 4800.0000 400.0000 6 0 0 2 2:2:2:0 yes 4800.0000 400.0000 7 0 0 3 3:3:3:0 yes 4800.0000 400.0000In this example, there are eight logical CPU cores running on four physical CPU cores. CPU0 and CPU4 are running on physical Core0, CPU1 and CPU5 are running on physical Core 1, and so on. Alternatively, to view the threads that are set for a particular physical CPU core (
cpu0in the example below), open a shell prompt and run the following:$ cat /sys/devices/system/cpu/cpu0/topology/thread_siblings_listExample output
0-4Apply the isolated and reserved CPUs in the
PerformanceProfileYAML. For example, you can set logical cores CPU0 and CPU4 asisolated, and logical cores CPU1 to CPU3 and CPU5 to CPU7 asreserved. When you configure reserved and isolated CPUs, the infra containers in pods use the reserved CPUs and the application containers use the isolated CPUs.... cpu: isolated: 0,4 reserved: 1-3,5-7 ...NoteThe reserved and isolated CPU pools must not overlap and together must span all available cores in the worker node.
ImportantHyper-Threading is enabled by default on most Intel processors. If you enable Hyper-Threading, all threads processed by a particular core must be isolated or processed on the same core.
When Hyper-Threading is enabled, all guaranteed pods must use multiples of the simultaneous multi-threading (SMT) level to avoid a "noisy neighbor" situation that can cause the pod to fail. See Static policy options for more information.
15.9. Disabling Hyper-Threading for low latency applications
When configuring clusters for low latency processing, consider whether you want to disable Hyper-Threading before you deploy the cluster.
To disable Hyper-Threading, perform the following steps:
Procedure
Create a performance profile that is appropriate for your hardware and topology. The following example sets
nosmtas an additional kernel argument:Example performance profile
apiVersion: performance.openshift.io/v2 kind: PerformanceProfile metadata: name: example-performanceprofile spec: additionalKernelArgs: - nmi_watchdog=0 - audit=0 - mce=off - processor.max_cstate=1 - idle=poll - intel_idle.max_cstate=0 - nosmt cpu: isolated: 2-3 reserved: 0-1 hugepages: defaultHugepagesSize: 1G pages: - count: 2 node: 0 size: 1G nodeSelector: node-role.kubernetes.io/performance: '' realTimeKernel: enabled: trueNoteWhen you configure reserved and isolated CPUs, the infra containers in pods use the reserved CPUs and the application containers use the isolated CPUs.
15.10. Managing device interrupt processing for guaranteed pod isolated CPUs
The Node Tuning Operator can manage host CPUs by dividing them into reserved CPUs for cluster and operating system housekeeping duties, including pod infra containers, and isolated CPUs for application containers to run the workloads. By completing these tasks, you can set CPUs for low-latency workloads as isolated workloads.
Device interrupts are load balanced between all isolated and reserved CPUs to avoid CPUs being overloaded, with the exception of CPUs where there is a guaranteed pod running. Guaranteed pod CPUs are prevented from processing device interrupts when the relevant annotations are set for the pod.
In the performance profile, globallyDisableIrqLoadBalancing is used to manage whether device interrupts are processed or not. For certain workloads, the reserved CPUs are not always sufficient for dealing with device interrupts, and for this reason, device interrupts are not globally disabled on the isolated CPUs. By default, Node Tuning Operator does not disable device interrupts on isolated CPUs.
15.10.1. Finding the effective IRQ affinity setting for a node
To verify actual interrupt handling, determine the effective IRQ affinity setting for a node. Some IRQ controllers do not support affinity settings and effectively run on CPU 0, even when the IRQ mask exposes all online CPUs.
The following are examples of drivers and hardware that Red Hat are aware lack support for IRQ affinity setting. The list is, by no means, exhaustive:
-
Some RAID controller drivers, such as
megaraid_sas - Many non-volatile memory express (NVMe) drivers
- Some LAN on motherboard (LOM) network controllers
-
The driver uses
managed_irqs
The reason they do not support IRQ affinity setting might be associated with factors such as the type of processor, the IRQ controller, or the circuitry connections in the motherboard.
If the effective affinity of any IRQ is set to an isolated CPU, it might be a sign of some hardware or driver not supporting IRQ affinity setting. To find the effective affinity, log in to the host and run the following command:
$ find /proc/irq -name effective_affinity -printf "%p: " -exec cat {} \;Example output
/proc/irq/0/effective_affinity: 1
/proc/irq/1/effective_affinity: 8
/proc/irq/2/effective_affinity: 0
/proc/irq/3/effective_affinity: 1
/proc/irq/4/effective_affinity: 2
/proc/irq/5/effective_affinity: 1
/proc/irq/6/effective_affinity: 1
/proc/irq/7/effective_affinity: 1
/proc/irq/8/effective_affinity: 1
/proc/irq/9/effective_affinity: 2
/proc/irq/10/effective_affinity: 1
/proc/irq/11/effective_affinity: 1
/proc/irq/12/effective_affinity: 4
/proc/irq/13/effective_affinity: 1
/proc/irq/14/effective_affinity: 1
/proc/irq/15/effective_affinity: 1
/proc/irq/24/effective_affinity: 2
/proc/irq/25/effective_affinity: 4
/proc/irq/26/effective_affinity: 2
/proc/irq/27/effective_affinity: 1
/proc/irq/28/effective_affinity: 8
/proc/irq/29/effective_affinity: 4
/proc/irq/30/effective_affinity: 4
/proc/irq/31/effective_affinity: 8
/proc/irq/32/effective_affinity: 8
/proc/irq/33/effective_affinity: 1
/proc/irq/34/effective_affinity: 2
Some drivers use managed_irqs, whose affinity is managed internally by the kernel and userspace cannot change the affinity. In some cases, these IRQs might be assigned to isolated CPUs. For more information about managed_irqs, see "Affinity of managed interrupts cannot be changed even if they target isolated CPU".
15.10.2. Configuring node interrupt affinity
To control which cores receive device interrupt requests (IRQ), configure IRQ dynamic load balancing on a cluster node. With this configuration, you can isolate interrupt handling to specific CPUs, ensuring consistent performance for latency-sensitive workloads.
Prerequisites
- For core isolation, all server hardware components must support IRQ affinity. To check if the hardware components of your server support IRQ affinity, view the server’s hardware specifications or contact your hardware provider.
Procedure
- Log in to the OpenShift Container Platform cluster as a user with cluster-admin privileges.
-
Set the performance profile
apiVersionto useperformance.openshift.io/v2. -
Remove the
globallyDisableIrqLoadBalancingfield or set it tofalse. Set the appropriate isolated and reserved CPUs. The following snippet illustrates a profile that reserves 2 CPUs. IRQ load-balancing is enabled for pods running on the
isolatedCPU set:apiVersion: performance.openshift.io/v2 kind: PerformanceProfile metadata: name: dynamic-irq-profile spec: cpu: isolated: 2-5 reserved: 0-1 ...NoteWhen you configure reserved and isolated CPUs, operating system processes, kernel processes, and systemd services run on reserved CPUs. Infrastructure pods run on any CPU except where the low latency workload is running. Low latency workload pods run on exclusive CPUs from the isolated pool. For more information, see "Restricting CPUs for infra and application containers".
15.11. Configuring huge pages
To pre-allocate huge pages on a specific node, use the Node Tuning Operator. This configuration ensures that your OpenShift Container Platform cluster reserves the necessary memory resources for workloads that require them.
OpenShift Container Platform provides a method for creating and allocating huge pages. Node Tuning Operator provides an easier method for doing this using the performance profile.
Procedure
In the
hugepages.pagessection of the performance profile, specify multiple blocks ofsize,count, and, optionally,node:Example configuration
hugepages: defaultHugepagesSize: "1G" pages: - size: "1G" count: 4 node: 0 # ...where:
hugepages.pages.nodeSpecifies the
nodethat is the NUMA node in which the huge pages are allocated. If you omitnode, the pages are evenly spread across all NUMA nodes.NoteWait for the relevant machine config pool status that indicates the update is finished.
These are the only configuration steps you need to do to allocate huge pages.
Verification
To verify the configuration, see the
/proc/meminfofile on the node:$ oc debug node/ip-10-0-141-105.ec2.internal# grep -i huge /proc/meminfoExample output
AnonHugePages: ###### ## ShmemHugePages: 0 kB HugePages_Total: 2 HugePages_Free: 2 HugePages_Rsvd: 0 HugePages_Surp: 0 Hugepagesize: #### ## Hugetlb: #### ##Use
oc describeto report the new size:$ oc describe node worker-0.ocp4poc.example.com | grep -i hugeExample output
hugepages-1g=true hugepages-###: ### hugepages-###: ###
15.11.1. Allocating multiple huge page sizes
You can request huge pages with different sizes under the same container. By doing this task, you can define more complicated pods consisting of containers with different huge page size needs.
The following example, shows you how to define sizes 1G and 2M. The Node Tuning Operator configures both sizes on the node.
Procedure
Edit the
PerformanceProfileobject to define1Gand2Msizes for the huge pages. The Node Tuning Operator configures both sizes on the node.apiVersion: performance.openshift.io/v2 kind: PerformanceProfile metadata: name: example-performance-profile #... spec: hugepages: defaultHugepagesSize: 1G pages: - count: 1024 node: 0 size: 2M - count: 4 node: 1 size: 1G # ...
15.12. Reducing NIC queues using the Node Tuning Operator
The Node Tuning Operator facilitates reducing NIC queues for enhanced performance. Adjustments are made using the performance profile, allowing customization of queues for different network devices.
15.12.1. Adjusting the NIC queues with the performance profile
To optimize network traffic handling, adjust the queue count for each network device by using the performance profile. By using this configuration, you can tune your network settings to meet specific workload requirements.
You can use a performance profile to adjust the queue count for each network device.
Supported network devices:
- Non-virtual network devices
- Network devices that support multiple queues (channels)
Unsupported network devices:
- Pure software network interfaces
- Block devices
- Intel DPDK virtual functions
Prerequisites
-
Access to the cluster as a user with the
cluster-adminrole. -
Install the OpenShift CLI (
oc).
Procedure
-
Log in to the OpenShift Container Platform cluster running the Node Tuning Operator as a user with
cluster-adminprivileges. - Create and apply a performance profile appropriate for your hardware and topology. For guidance on creating a profile, see the "Creating a performance profile" section.
Edit this created performance profile:
$ oc edit -f <your_profile_name>.yamlPopulate the
specfield with thenetobject. The object list can contain two fields:-
userLevelNetworkingis a required field specified as a boolean flag. IfuserLevelNetworkingistrue, the queue count is set to the reserved CPU count for all supported devices. The default isfalse. devicesis an optional field specifying a list of devices that will have the queues set to the reserved CPU count. If the device list is empty, the configuration applies to all network devices. The configuration is as follows:interfaceName: This field specifies the interface name, and it supports shell-style wildcards, which can be positive or negative.-
Example wildcard syntax is as follows:
<string> .* -
Negative rules are prefixed with an exclamation mark. To apply the net queue changes to all devices other than the excluded list, use
!<device>, for example,!eno1.
-
Example wildcard syntax is as follows:
-
vendorID: The network device vendor ID represented as a 16-bit hexadecimal number with a0xprefix. deviceID: The network device ID (model) represented as a 16-bit hexadecimal number with a0xprefix.NoteWhen a
deviceIDis specified, thevendorIDmust also be defined. A device that matches all of the device identifiers specified in a device entryinterfaceName,vendorID, or a pair ofvendorIDplusdeviceIDqualifies as a network device. This network device then has its net queues count set to the reserved CPU count.When two or more devices are specified, the net queues count is set to any net device that matches one of them.
-
Set the queue count to the reserved CPU count for all devices by using this example performance profile:
apiVersion: performance.openshift.io/v2 kind: PerformanceProfile metadata: name: manual spec: cpu: isolated: 3-51,55-103 reserved: 0-2,52-54 net: userLevelNetworking: true nodeSelector: node-role.kubernetes.io/worker-cnf: "" # ...Set the queue count to the reserved CPU count for all devices matching any of the defined device identifiers by using this example performance profile:
apiVersion: performance.openshift.io/v2 kind: PerformanceProfile metadata: name: manual spec: cpu: isolated: 3-51,55-103 reserved: 0-2,52-54 net: userLevelNetworking: true devices: - interfaceName: "eth0" - interfaceName: "eth1" - vendorID: "0x1af4" deviceID: "0x1000" nodeSelector: node-role.kubernetes.io/worker-cnf: "" # ...Set the queue count to the reserved CPU count for all devices starting with the interface name
ethby using this example performance profile:apiVersion: performance.openshift.io/v2 kind: PerformanceProfile metadata: name: manual spec: cpu: isolated: 3-51,55-103 reserved: 0-2,52-54 net: userLevelNetworking: true devices: - interfaceName: "eth*" nodeSelector: node-role.kubernetes.io/worker-cnf: "" # ...Set the queue count to the reserved CPU count for all devices with an interface named anything other than
eno1by using this example performance profile:apiVersion: performance.openshift.io/v2 kind: PerformanceProfile metadata: name: manual spec: cpu: isolated: 3-51,55-103 reserved: 0-2,52-54 net: userLevelNetworking: true devices: - interfaceName: "!eno1" nodeSelector: node-role.kubernetes.io/worker-cnf: "" # ...Set the queue count to the reserved CPU count for all devices that have an interface name
eth0,vendorIDof0x1af4, anddeviceIDof0x1000by using this example performance profile:apiVersion: performance.openshift.io/v2 kind: PerformanceProfile metadata: name: manual spec: cpu: isolated: 3-51,55-103 reserved: 0-2,52-54 net: userLevelNetworking: true devices: - interfaceName: "eth0" - vendorID: "0x1af4" deviceID: "0x1000" nodeSelector: node-role.kubernetes.io/worker-cnf: "" # ...Apply the updated performance profile:
$ oc apply -f <your_profile_name>.yaml
15.12.2. Verifying the queue status
To ensure that your performance profile changes are active, verify the queue status. Reviewing these examples helps you confirm that specific tuning configurations are successfully applied to your environment.
In this section, several examples illustrate different performance profiles and how to verify the changes are applied.
- Example 1
Example 1 demonstrates that the net queue count that is set to the reserved CPU count (2) for all supported devices.
The relevant section from the performance profile is:
apiVersion: performance.openshift.io/v2 metadata: name: performance spec: kind: PerformanceProfile spec: cpu: reserved: 0-1 #total = 2 isolated: 2-8 net: userLevelNetworking: true # ...The following command displays the status of the queues associated with a device:
NoteRun this command on the node where the performance profile was applied.
$ ethtool -l <device>The following command verifies the queue status before the profile is applied:
$ ethtool -l ens4Example output
Channel parameters for ens4: Pre-set maximums: RX: 0 TX: 0 Other: 0 Combined: 4 Current hardware settings: RX: 0 TX: 0 Other: 0 Combined: 4The following command verifies the queue status after the profile is applied:
$ ethtool -l ens4Example output
Channel parameters for ens4: Pre-set maximums: RX: 0 TX: 0 Other: 0 Combined: 4 Current hardware settings: RX: 0 TX: 0 Other: 0 Combined: 2-
Combined: Specifies the combined channel that shows the total count of reserved CPUs for all supported devices is 2. This matches what is configured in the performance profile.
-
- Example 2
Example 2 demonstrates that the net queue count is set to the reserved CPU count (2) for all supported network devices with a specific
vendorID.The relevant section from the performance profile is:
apiVersion: performance.openshift.io/v2 metadata: name: performance spec: kind: PerformanceProfile spec: cpu: reserved: 0-1 isolated: 2-8 net: userLevelNetworking: true devices: - vendorID = 0x1af4 # ...The following command displays the status of the queues associated with a device:
NoteRun this command on the node where the performance profile was applied.
$ ethtool -l <device>The following command verifies the queue status after the profile is applied:
$ ethtool -l ens4Example output
Channel parameters for ens4: Pre-set maximums: RX: 0 TX: 0 Other: 0 Combined: 4 Current hardware settings: RX: 0 TX: 0 Other: 0 Combined: 2-
Combined: Specifies that the total count of reserved CPUs for all supported devices withvendorID=0x1af4is 2. For example, if there is another network deviceens2withvendorID=0x1af4it will also have total net queues of 2. This matches what is configured in the performance profile.
-
- Example 3
Example 3 shows that the net queue count is set to the reserved CPU count (2) for all supported network devices that match any of the defined device identifiers. The command
udevadm infoprovides a detailed report on a device. In this example the devices are:# udevadm info -p /sys/class/net/ens4 ... E: ID_MODEL_ID=0x1000 E: ID_VENDOR_ID=0x1af4 E: INTERFACE=ens4 ...# udevadm info -p /sys/class/net/eth0 ... E: ID_MODEL_ID=0x1002 E: ID_VENDOR_ID=0x1001 E: INTERFACE=eth0 ...Set the net queues to 2 for a device with
interfaceNameequal toeth0and any devices that have avendorID=0x1af4with the following performance profile:apiVersion: performance.openshift.io/v2 metadata: name: performance spec: kind: PerformanceProfile spec: cpu: reserved: 0-1 #total = 2 isolated: 2-8 net: userLevelNetworking: true devices: - interfaceName = eth0 - vendorID = 0x1af4 # ...The following command verifies the queue status after the profile is applied:
$ ethtool -l ens4Example output
Channel parameters for ens4: Pre-set maximums: RX: 0 TX: 0 Other: 0 Combined: 4 Current hardware settings: RX: 0 TX: 0 Other: 0 Combined: 2Combined: Specifies that the total count of reserved CPUs for all supported devices withvendorID=0x1af4is set to 2.For example, if there is another network device
ens2withvendorID=0x1af4, it will also have the total net queues set to 2. Similarly, a device withinterfaceNameequal toeth0will have total net queues set to 2.
15.12.3. Logging associated with adjusting NIC queues
To verify NIC queue adjustments, review the Tuned daemon logs. These logs record messages detailing the assigned devices so that you can confirm that the system applied your configuration changes correctly.
The following messages might be recorded to the /var/log/tuned/tuned.log file:
An
INFOmessage is recorded detailing the successfully assigned devices:INFO tuned.plugins.base: instance net_test (net): assigning devices ens1, ens2, ens3A
WARNINGmessage is recorded if none of the devices can be assigned:WARNING tuned.plugins.base: instance net_test: no matching devices available
Chapter 16. Provisioning real-time and low latency workloads
To achieve low latency and consistent response times for OpenShift Container Platform applications, use the Node Tuning Operator. This Operator implements automatic tuning to optimize your cluster for high-performance computing workloads.
You use the performance profile configuration to make these changes.
You can update the kernel to kernel-rt, reserve CPUs for cluster and operating system housekeeping duties, including pod infra containers, isolate CPUs for application containers to run the workloads, and disable unused CPUs to reduce power consumption.
When writing your applications, follow the general recommendations described in RHEL for Real Time processes and threads.
16.1. Scheduling a low latency workload onto a compute node
To run low latency workloads, schedule them onto a compute node associated with a performance profile that configures real-time capabilities. This ensures that the node is tuned to meet the specific timing and performance requirements of your application.
To schedule a workload on specific nodes, use label selectors in the Pod custom resource (CR). The label selectors must match the nodes that are attached to the machine config pool that was configured for low latency by the Node Tuning Operator.
Prerequisites
-
You have installed the OpenShift CLI (
oc). -
You have logged in as a user with
cluster-adminprivileges. - You have applied a performance profile in the cluster that tunes compute nodes for low latency workloads.
Procedure
Create a
PodCR for the low latency workload and apply it in the cluster, for example:Example
Podspec configured to use real-time processingapiVersion: v1 kind: Pod metadata: name: dynamic-low-latency-pod annotations: cpu-quota.crio.io: "disable" cpu-load-balancing.crio.io: "disable" irq-load-balancing.crio.io: "disable" spec: securityContext: runAsNonRoot: true seccompProfile: type: RuntimeDefault containers: - name: dynamic-low-latency-pod image: "registry.redhat.io/openshift4/cnf-tests-rhel8:v4.16" command: ["sleep", "10h"] resources: requests: cpu: 2 memory: "200M" limits: cpu: 2 memory: "200M" securityContext: allowPrivilegeEscalation: false capabilities: drop: [ALL] nodeSelector: node-role.kubernetes.io/worker-cnf: "" runtimeClassName: performance-dynamic-low-latency-profile1 # ...where
metadata.annotations.cpu-quota.crio.io- Disables the CPU completely fair scheduler (CFS) quota at the pod run time.
metadata.annotations.cpu-load-balancing.crio.io- Disables CPU load balancing.
metadata.annotations.irq-load-balancing.crio.io- Opts the pod out of interrupt handling on the node.
spec.nodeSelector.node-role.kubernetes.io/worker-cnf-
The
nodeSelectorlabel must match the label that you specify in theNodeCR. spec.runtimeClassName-
runtimeClassNamemust match the name of the performance profile configured in the cluster.
-
Enter the pod
runtimeClassNamein the form performance-<profile_name>, where <profile_name> is thenamefrom thePerformanceProfileYAML. In the previous YAML example, thenameisperformance-dynamic-low-latency-profile. Ensure the pod is running correctly. Status should be
running, and the correctcnf-workernode should be set.$ oc get pod -o wideExpected output
NAME READY STATUS RESTARTS AGE IP NODE dynamic-low-latency-pod 1/1 Running 0 5h33m 10.131.0.10 cnf-worker.example.comGet the CPUs that the pod configured for IRQ dynamic load balancing runs on:
$ oc exec -it dynamic-low-latency-pod -- /bin/bash -c "grep Cpus_allowed_list /proc/self/status | awk '{print $2}'"Expected output
Cpus_allowed_list: 2-3
Verification
Ensure the node configuration is applied correctly.
Log in to the node to verify the configuration.
$ oc debug node/<node-name>Verify that you can use the node file system:
sh-4.4# chroot /hostExpected output
sh-4.4#Ensure the default system CPU affinity mask does not include the
dynamic-low-latency-podCPUs, for example, CPUs 2 and 3.sh-4.4# cat /proc/irq/default_smp_affinityExample output
33Ensure the system IRQs are not configured to run on the
dynamic-low-latency-podCPUs:sh-4.4# find /proc/irq/ -name smp_affinity_list -exec sh -c 'i="$1"; mask=$(cat $i); file=$(echo $i); echo $file: $mask' _ {} \;Example output
/proc/irq/0/smp_affinity_list: 0-5 /proc/irq/1/smp_affinity_list: 5 /proc/irq/2/smp_affinity_list: 0-5 /proc/irq/3/smp_affinity_list: 0-5 /proc/irq/4/smp_affinity_list: 0 /proc/irq/5/smp_affinity_list: 0-5 /proc/irq/6/smp_affinity_list: 0-5 /proc/irq/7/smp_affinity_list: 0-5 /proc/irq/8/smp_affinity_list: 4 /proc/irq/9/smp_affinity_list: 4 /proc/irq/10/smp_affinity_list: 0-5 /proc/irq/11/smp_affinity_list: 0 /proc/irq/12/smp_affinity_list: 1 /proc/irq/13/smp_affinity_list: 0-5 /proc/irq/14/smp_affinity_list: 1 /proc/irq/15/smp_affinity_list: 0 /proc/irq/24/smp_affinity_list: 1 /proc/irq/25/smp_affinity_list: 1 /proc/irq/26/smp_affinity_list: 1 /proc/irq/27/smp_affinity_list: 5 /proc/irq/28/smp_affinity_list: 1 /proc/irq/29/smp_affinity_list: 0 /proc/irq/30/smp_affinity_list: 0-5WarningWhen you tune nodes for low latency, the usage of execution probes in conjunction with applications that require guaranteed CPUs can cause latency spikes. Use other probes, such as a properly configured set of network probes, as an alternative.
16.2. Creating a pod with a guaranteed QoS class
You can create a pod with a quality of service (QoS) class of Guaranteed for high-performance workloads. Configuring a pod with a QoS class of Guaranteed ensures that the pod has priority access to the specified CPU and memory resources.
To create a pod with a QoS class of Guaranteed, you must apply the following specifications:
- Set identical values for the memory limit and memory request fields for each container in the pod.
- Set identical values for CPU limit and CPU request fields for each container in the pod.
In general, a pod with a QoS class of Guaranteed will not be evicted from a node. One exception is during resource contention caused by system daemons exceeding reserved resources. In this scenario, the kubelet might evict pods to preserve node stability, starting with the lowest priority pods.
Prerequisites
-
Access to the cluster as a user with the
cluster-adminrole. -
The OpenShift CLI (
oc).
Procedure
Create a namespace for the pod by running the following command:
$ oc create namespace qos-exampleqos-example: Specifies a
qos-exampleexample namespace.Example output
namespace/qos-example created
Create the
Podresource:Create a YAML file that defines the
Podresource:Example
qos-example.yamlfileapiVersion: v1 kind: Pod metadata: name: qos-demo namespace: qos-example spec: securityContext: runAsNonRoot: true seccompProfile: type: RuntimeDefault containers: - name: qos-demo-ctr image: quay.io/openshifttest/hello-openshift:openshift resources: limits: memory: "200Mi" cpu: "1" requests: memory: "200Mi" cpu: "1" securityContext: allowPrivilegeEscalation: false capabilities: drop: [ALL]where:
spec.containers.image-
Specifies public image, such as the
hello-openshiftimage. spec.containers.resources.limits.memory- Specifies a memory limit of 200 MB.
spec.containers.resources.limits.cpu- Specifies a CPU limit of 1 CPU.
spec.containers.resources.requests.memory- Specifies a memory request of 200 MB.
spec.containers.resources.requests.cpuSpecifies a CPU request of 1 CPU.
NoteIf you specify a memory limit for a container, but do not specify a memory request, OpenShift Container Platform automatically assigns a memory request that matches the limit. Similarly, if you specify a CPU limit for a container, but do not specify a CPU request, OpenShift Container Platform automatically assigns a CPU request that matches the limit.
Create the
Podresource by running the following command:$ oc apply -f qos-example.yaml --namespace=qos-exampleExample output
pod/qos-demo created
Verification
View the
qosClassvalue for the pod by running the following command:$ oc get pod qos-demo --namespace=qos-example --output=yaml | grep qosClassExample output
qosClass: Guaranteed
16.3. Disabling CPU load balancing in a Pod
To optimize performance, disable or enable CPU load balancing for your Pods. CRI-O implements this functionality and applies the configuration only when specific requirements are met.
Functionality to disable or enable CPU load balancing is implemented on the CRI-O level. The code under the CRI-O disables or enables CPU load balancing only when the following requirements are met.
The pod must use the
performance-<profile-name>runtime class. You can get the proper name by looking at the status of the performance profile, as shown here:apiVersion: performance.openshift.io/v2 kind: PerformanceProfile ... status: ... runtimeClass: performance-manual
The Node Tuning Operator is responsible for the creation of the high-performance runtime handler config snippet under relevant nodes and for creation of the high-performance runtime class under the cluster. It will have the same content as the default runtime handler except that it enables the CPU load balancing configuration functionality.
To disable the CPU load balancing for the pod, the Pod specification must include the following fields:
apiVersion: v1
kind: Pod
metadata:
#...
annotations:
#...
cpu-load-balancing.crio.io: "disable"
#...
#...
spec:
#...
runtimeClassName: performance-<profile_name>
#...Only disable CPU load balancing when the CPU manager static policy is enabled and for pods with guaranteed QoS that use whole CPUs. Otherwise, disabling CPU load balancing can affect the performance of other containers in the cluster.
16.4. Disabling power saving mode for high priority pods
To protect high priority workloads when using power saving configurations on a node, apply performance settings at the pod level. This ensures that the configuration applies to all cores used by the pod, maintaining performance stability.
By disabling P-states and C-states at the pod level, you can configure high priority workloads for best performance and lowest latency.
| Annotation | Possible Values | Description |
|---|---|---|
|
|
|
This annotation allows you to enable or disable C-states for each CPU. Alternatively, you can also specify a maximum latency in microseconds for the C-states. For example, enable C-states with a maximum latency of 10 microseconds with the setting |
|
|
Any supported |
Sets the |
Prerequisites
- You have configured power saving in the performance profile for the node where the high priority workload pods are scheduled.
Procedure
Add the required annotations to your high priority workload pods. The annotations override the
defaultsettings.Example high priority workload annotation
apiVersion: v1 kind: Pod metadata: #... annotations: #... cpu-c-states.crio.io: "disable" cpu-freq-governor.crio.io: "performance" #... #... spec: #... runtimeClassName: performance-<profile_name> #...- Restart the pods to apply the annotation.
16.5. Disabling CPU CFS quota
To prevent CPU throttling for latency-sensitive workloads, disable the CPU CFS quota. This configuration allows pods to use unallocated CPU resources on the node, ensuring consistent application performance.
Procedure
To eliminate CPU throttling for pinned pods, create a pod with the
cpu-quota.crio.io: "disable"annotation. This annotation disables the CPU completely fair scheduler (CFS) quota when the pod runs.Example pod specification with
cpu-quota.crio.iodisabledapiVersion: v1 kind: Pod metadata: annotations: cpu-quota.crio.io: "disable" spec: runtimeClassName: performance-<profile_name> #...NoteOnly disable CPU CFS quota when the CPU manager static policy is enabled and for pods with guaranteed QoS that use whole CPUs. For example, pods that contain CPU-pinned containers. Otherwise, disabling CPU CFS quota can affect the performance of other containers in the cluster.
16.6. Disabling interrupt processing for CPUs where pinned containers are running
To achieve low latency for workloads, some containers require that the CPUs they are pinned to do not process device interrupts. You can use the irq-load-balancing.crio.io pod annotation to control whether device interrupts are processed on CPUs where the pinned containers are running.
To disable interrupt processing for CPUs where containers belonging to individual pods are pinned, ensure that globallyDisableIrqLoadBalancing is set to false in the performance profile. In the pod specification, set the irq-load-balancing.crio.io pod annotation to disable, as demonstrated in the following example:
apiVersion: performance.openshift.io/v2
kind: Pod
metadata:
annotations:
irq-load-balancing.crio.io: "disable"
spec:
runtimeClassName: performance-<profile_name>
...Chapter 17. Debugging low latency node tuning status
Use the PerformanceProfile custom resource (CR) status fields for reporting tuning status and debugging latency issues in a cluster node.
17.1. Debugging low latency CNF tuning status
To report tuning status and debug latency degradation issues, use the status fields in the PerformanceProfile custom resource (CR). These fields describe the conditions of the reconciliation functionality of an Operator, helping you verify the state of your configuration.
A typical issue can arise when the status of machine config pools that are attached to the performance profile are in a degraded state, causing the PerformanceProfile status to degrade. In this case, the machine config pool issues a failure message.
The Node Tuning Operator contains the performanceProfile.spec.status.Conditions status field:
Status:
Conditions:
Last Heartbeat Time: 2020-06-02T10:01:24Z
Last Transition Time: 2020-06-02T10:01:24Z
Status: True
Type: Available
Last Heartbeat Time: 2020-06-02T10:01:24Z
Last Transition Time: 2020-06-02T10:01:24Z
Status: True
Type: Upgradeable
Last Heartbeat Time: 2020-06-02T10:01:24Z
Last Transition Time: 2020-06-02T10:01:24Z
Status: False
Type: Progressing
Last Heartbeat Time: 2020-06-02T10:01:24Z
Last Transition Time: 2020-06-02T10:01:24Z
Status: False
Type: Degraded
The Status field contains Conditions that specify Type values that indicate the status of the performance profile:
Available- All machine configs and Tuned profiles have been created successfully and are available for cluster components, such as NTO, MCO, Kubelet, that are responsible to process them.
Upgradeable- Indicates whether the resources maintained by the Operator are in a state that is safe to upgrade.
Progressing- Indicates that the deployment process from the performance profile has started.
DegradedIndicates an error if:
- Validation of the performance profile has failed.
- Creation of all relevant components did not complete successfully.
Each of these types contain the following fields:
Status-
The state for the specific type (
trueorfalse). Timestamp- The transaction timestamp.
Reason string- The machine readable reason.
Message string- The human readable reason describing the state and error details, if any.
17.2. Machine config pools
To apply performance profiles to specific nodes, associate them with a machine config pool (MCP). The MCP tracks the status of tuning updates, such as kernel arguments, huge pages, and real-time kernels, ensuring your cluster configurations are applied correctly.
The Performance Profile controller monitors changes in the MCP and updates the performance profile status accordingly.
The only conditions returned by the MCP to the performance profile status is when the MCP is Degraded, which leads to performanceProfile.status.condition.Degraded = true.
Procedure
Check the state of the associated machine config pool by entering the following command. The output example shows a performance profile with an associated machine config pool (
worker-cnf) that is in a degraded state.# oc get mcpExample output
NAME CONFIG UPDATED UPDATING DEGRADED MACHINECOUNT READYMACHINECOUNT UPDATEDMACHINECOUNT DEGRADEDMACHINECOUNT AGE master rendered-master-2ee57a93fa6c9181b546ca46e1571d2d True False False 3 3 3 0 2d21h worker rendered-worker-d6b2bdc07d9f5a59a6b68950acf25e5f True False False 2 2 2 0 2d21h worker-cnf rendered-worker-cnf-6c838641b8a08fff08dbd8b02fb63f7c False True True 2 1 1 1 2d20hTo check the reason for the degraded state, enter the following command, ensuring that you change the example machine config pool with your machine config pool. The
describesection of the MCP shows the reason.# oc describe mcp worker-cnfExample output
Message: Node node-worker-cnf is reporting: "prepping update: machineconfig.machineconfiguration.openshift.io \"rendered-worker-cnf-40b9996919c08e335f3ff230ce1d170\" not found" Reason: 1 nodes are reporting degraded status on syncOptional: You can also run the
oc describecommand against the performance profile to check the degraded state status. The example output shows the performance profilestatusfield marked asdegraded = true:# oc describe performanceprofiles performanceExample output
Message: Machine config pool worker-cnf Degraded Reason: 1 nodes are reporting degraded status on sync. Machine config pool worker-cnf Degraded Message: Node yquinn-q8s5v-w-b-z5lqn.c.openshift-gce-devel.internal is reporting: "prepping update: machineconfig.machineconfiguration.openshift.io \"rendered-worker-cnf-40b9996919c08e335f3ff230ce1d170\" not found". Reason: MCPDegraded Status: True Type: Degraded
17.3. About the must-gather tool
To debug issues in your cluster, use the oc adm must-gather CLI command. This tool collects the diagnostic information most likely needed for troubleshooting, ensuring that you have the necessary data for analysis.
The oc adm must-gather CLI command collects the following information from your cluster:
- Resource definitions
- Audit logs
- Service logs
You can specify one or more images when you run the command by including the --image argument. When you specify an image, the tool collects data related to that feature or product. When you run oc adm must-gather, a new pod is created on the cluster. The data is collected on that pod and saved in a new directory that starts with must-gather.local. This directory is created in your current working directory.
17.4. Collecting low latency tuning debugging data for Red Hat Support
To debug low latency setup issues when opening a support case, collect diagnostic information for Red Hat Support using the must-gather tool. This command gathers essential data, such as node tuning and NUMA topology, from your OpenShift Container Platform cluster.
For prompt support, supply diagnostic information for both OpenShift Container Platform and low latency tuning.
Use the oc adm must-gather CLI command to collect the following information about your cluster, including features and objects associated with low latency tuning:
- The Node Tuning Operator namespaces and child objects.
-
MachineConfigPooland associatedMachineConfigobjects. - The Node Tuning Operator and associated Tuned objects.
- Linux kernel command-line options.
- CPU and NUMA topology
- Basic PCI device information and NUMA locality.
Prerequisites
-
Access to the cluster as a user with the
cluster-adminrole. -
The OpenShift Container Platform OpenShift CLI (
oc) installed.
Procedure
-
Navigate to the directory where you want to store the
must-gatherdata. Collect debugging information by running the following command:
$ oc adm must-gatherExample output
[must-gather ] OUT Using must-gather plug-in image: quay.io/openshift-release When opening a support case, bugzilla, or issue please include the following summary data along with any other requested information: ClusterID: 829er0fa-1ad8-4e59-a46e-2644921b7eb6 ClusterVersion: Stable at "<cluster_version>" ClusterOperators: All healthy and stable [must-gather ] OUT namespace/openshift-must-gather-8fh4x created [must-gather ] OUT clusterrolebinding.rbac.authorization.k8s.io/must-gather-rhlgc created [must-gather-5564g] POD 2023-07-17T10:17:37.610340849Z Gathering data for ns/openshift-cluster-version... [must-gather-5564g] POD 2023-07-17T10:17:38.786591298Z Gathering data for ns/default... [must-gather-5564g] POD 2023-07-17T10:17:39.117418660Z Gathering data for ns/openshift... [must-gather-5564g] POD 2023-07-17T10:17:39.447592859Z Gathering data for ns/kube-system... [must-gather-5564g] POD 2023-07-17T10:17:39.803381143Z Gathering data for ns/openshift-etcd... ... Reprinting Cluster State: When opening a support case, bugzilla, or issue please include the following summary data along with any other requested information: ClusterID: 829er0fa-1ad8-4e59-a46e-2644921b7eb6 ClusterVersion: Stable at "<cluster_version>" ClusterOperators: All healthy and stableCreate a compressed file from the
must-gatherdirectory that was created in your working directory. For example, on a computer that uses a Linux operating system, run the following command:$ tar cvaf must-gather.tar.gz must-gather-local.5421342344627712289//must-gather-local.5421342344627712289//: Replace this value with the directory name created by themust-gathertool.NoteCreate a compressed file to attach the data to a support case or to use with the Performance Profile Creator wrapper script when you create a performance profile.
- Attach the compressed file to your support case on the Red Hat Customer Portal.
Chapter 18. Performing latency tests for platform verification
You can use the Cloud-native Network Functions (CNF) tests image to run latency tests on a CNF-enabled OpenShift Container Platform cluster, where all the components required for running CNF workloads are installed. Run the latency tests to validate node tuning for your workload.
The cnf-tests container image is available at registry.redhat.io/openshift4/cnf-tests-rhel9:v4.16.
18.1. Prerequisites for running latency tests
Your cluster must meet the following requirements before you can run the latency tests:
-
You have applied all the required CNF configurations. This includes the
PerformanceProfilecluster and other configuration according to the reference design specifications (RDS) or your specific requirements. -
You have logged in to
registry.redhat.iowith your Customer Portal credentials by using thepodman logincommand.
18.2. Measuring latency
To accurately measure system latency, use the hwlatdetect, cyclictest, and oslat tools provided in the cnf-tests image. Evaluating these metrics helps you identify and resolve performance delays in your environment.
Each tool has a specific use. Use the tools in sequence to achieve reliable test results.
- hwlatdetect
-
Measures the baseline that the bare-metal hardware can achieve. Before proceeding with the next latency test, ensure that the latency reported by
hwlatdetectmeets the required threshold because you cannot fix hardware latency spikes by operating system tuning. - cyclictest
-
Verifies the real-time kernel scheduler latency after
hwlatdetectpasses validation. Thecyclictesttool schedules a repeated timer and measures the difference between the desired and the actual trigger times. The difference can uncover basic issues with the tuning caused by interrupts or process priorities. The tool must run on a real-time kernel. - oslat
- Behaves similarly to a CPU-intensive DPDK application and measures all the interruptions and disruptions to the busy loop that simulates CPU heavy data processing.
The tests introduce the following environment variables:
| Environment variables | Description |
|---|---|
|
| Specifies the amount of time in seconds after which the test starts running. You can use the variable to allow the CPU manager reconcile loop to update the default CPU pool. The default value is 0. |
|
| Specifies the number of CPUs that the pod running the latency tests uses. If you do not set the variable, the default configuration includes all isolated CPUs. |
|
| Specifies the amount of time in seconds that the latency test must run. The default value is 300 seconds. Note
To prevent the Ginkgo 2.0 test suite from timing out before the latency tests complete, set the |
|
|
Specifies the maximum acceptable hardware latency in microseconds for the workload and operating system. If you do not set the value of |
|
|
Specifies the maximum latency in microseconds that all threads expect before waking up during the |
|
|
Specifies the maximum acceptable latency in microseconds for the |
|
| Unified variable that specifies the maximum acceptable latency in microseconds. Applicable for all available latency tools. |
Variables that are specific to a latency tool take precedence over unified variables. For example, if OSLAT_MAXIMUM_LATENCY is set to 30 microseconds and MAXIMUM_LATENCY is set to 10 microseconds, the oslat test will run with maximum acceptable latency of 30 microseconds.
18.3. Running the latency tests
Run the cluster latency tests to validate node tuning for your Cloud-native Network Functions (CNF) workload.
When executing podman commands as a non-root or non-privileged user, mounting paths can fail with permission denied errors. Depending on your local operating system and SELinux configuration, you might also experience issues running these commands from your home directory. To make the podman commands work, run the commands from a folder that is not your home/<username> directory, and append :Z to the volumes creation. For example, -v $(pwd)/:/kubeconfig:Z. This allows podman to do the proper SELinux relabeling.
The procedure runs the three individual tests hwlatdetect, cyclictest, and oslat. For details on these individual tests, see their individual sections.
Procedure
Open a shell prompt in the directory containing the
kubeconfigfile.You provide the test image with a
kubeconfigfile in current directory and its related$KUBECONFIGenvironment variable, mounted through a volume. This allows the running container to use thekubeconfigfile from inside the container.NoteIn the following command, your local
kubeconfigis mounted to kubeconfig/kubeconfig in the cnf-tests container, which allows access to the cluster.To run the latency tests, run the following command, substituting variable values as appropriate:
$ podman run -v $(pwd)/:/kubeconfig:Z -e KUBECONFIG=/kubeconfig/kubeconfig \ -e LATENCY_TEST_RUNTIME=600\ -e MAXIMUM_LATENCY=20 \ registry.redhat.io/openshift4/cnf-tests-rhel9:v4.16 /usr/bin/test-run.sh \ --ginkgo.v --ginkgo.timeout="24h"The LATENCY_TEST_RUNTIME is shown in seconds, in this case 600 seconds (10 minutes). The test runs successfully when the maximum observed latency is lower than MAXIMUM_LATENCY (20 μs).
If the results exceed the latency threshold, the test fails.
-
Optional: Append
--ginkgo.dry-runflag to run the latency tests in dry-run mode. This is useful for checking what commands the tests run. -
Optional: Append
--ginkgo.vflag to run the tests with increased verbosity. Optional: Append
--ginkgo.timeout="24h"flag to ensure the Ginkgo 2.0 test suite does not timeout before the latency tests complete.ImportantDuring testing shorter time periods, as shown, can be used to run the tests. However, for final verification and valid results, the test should run for at least 12 hours (43200 seconds).
18.3.1. Running hwlatdetect
To measure hardware latency, run the hwlatdetect tool. This diagnostic utility is available in the rt-kernel package through your Red Hat Enterprise Linux (RHEL) 9.x subscription.
When executing podman commands as a non-root or non-privileged user, mounting paths can fail with permission denied errors. Depending on your local operating system and SELinux configuration, you might also experience issues running these commands from your home directory. To make the podman commands work, run the commands from a folder that is not your home/<username> directory, and append :Z to the volumes creation. For example, -v $(pwd)/:/kubeconfig:Z. This allows podman to do the proper SELinux relabeling.
Prerequisites
- You have reviewed the prerequisites for running latency tests.
Procedure
To run the
hwlatdetecttests, run the following command, substituting variable values as appropriate:$ podman run -v $(pwd)/:/kubeconfig:Z -e KUBECONFIG=/kubeconfig/kubeconfig \ -e LATENCY_TEST_RUNTIME=600 -e MAXIMUM_LATENCY=20 \ registry.redhat.io/openshift4/cnf-tests-rhel9:v4.16 \ /usr/bin/test-run.sh --ginkgo.focus="hwlatdetect" --ginkgo.v --ginkgo.timeout="24h"The
hwlatdetecttest runs for 10 minutes (600 seconds). The test runs successfully when the maximum observed latency is lower thanMAXIMUM_LATENCY(20 μs).If the results exceed the latency threshold, the test fails.
ImportantDuring testing shorter time periods, as shown, can be used to run the tests. However, for final verification and valid results, the test should run for at least 12 hours (43200 seconds).
Example failure output
running /usr/bin/cnftests -ginkgo.v -ginkgo.focus=hwlatdetect I0908 15:25:20.023712 27 request.go:601] Waited for 1.046586367s due to client-side throttling, not priority and fairness, request: GET:https://api.hlxcl6.lab.eng.tlv2.redhat.com:6443/apis/imageregistry.operator.openshift.io/v1?timeout=32s Running Suite: CNF Features e2e integration tests ================================================= Random Seed: 1662650718 Will run 1 of 3 specs [...] • Failure [283.574 seconds] [performance] Latency Test /remote-source/app/vendor/github.com/openshift/cluster-node-tuning-operator/test/e2e/performanceprofile/functests/4_latency/latency.go:62 with the hwlatdetect image /remote-source/app/vendor/github.com/openshift/cluster-node-tuning-operator/test/e2e/performanceprofile/functests/4_latency/latency.go:228 should succeed [It] /remote-source/app/vendor/github.com/openshift/cluster-node-tuning-operator/test/e2e/performanceprofile/functests/4_latency/latency.go:236 Log file created at: 2022/09/08 15:25:27 Running on machine: hwlatdetect-b6n4n Binary: Built with gc go1.17.12 for linux/amd64 Log line format: [IWEF]mmdd hh:mm:ss.uuuuuu threadid file:line] msg I0908 15:25:27.160620 1 node.go:39] Environment information: /proc/cmdline: BOOT_IMAGE=(hd1,gpt3)/ostree/rhcos-c6491e1eedf6c1f12ef7b95e14ee720bf48359750ac900b7863c625769ef5fb9/vmlinuz-4.18.0-372.19.1.el8_6.x86_64 random.trust_cpu=on console=tty0 console=ttyS0,115200n8 ignition.platform.id=metal ostree=/ostree/boot.1/rhcos/c6491e1eedf6c1f12ef7b95e14ee720bf48359750ac900b7863c625769ef5fb9/0 ip=dhcp root=UUID=5f80c283-f6e6-4a27-9b47-a287157483b2 rw rootflags=prjquota boot=UUID=773bf59a-bafd-48fc-9a87-f62252d739d3 skew_tick=1 nohz=on rcu_nocbs=0-3 tuned.non_isolcpus=0000ffff,ffffffff,fffffff0 systemd.cpu_affinity=4,5,6,7,8,9,10,11,12,13,14,15,16,17,18,19,20,21,22,23,24,25,26,27,28,29,30,31,32,33,34,35,36,37,38,39,40,41,42,43,44,45,46,47,48,49,50,51,52,53,54,55,56,57,58,59,60,61,62,63,64,65,66,67,68,69,70,71,72,73,74,75,76,77,78,79 intel_iommu=on iommu=pt isolcpus=managed_irq,0-3 nohz_full=0-3 tsc=nowatchdog nosoftlockup nmi_watchdog=0 mce=off skew_tick=1 rcutree.kthread_prio=11 + + I0908 15:25:27.160830 1 node.go:46] Environment information: kernel version 4.18.0-372.19.1.el8_6.x86_64 I0908 15:25:27.160857 1 main.go:50] running the hwlatdetect command with arguments [/usr/bin/hwlatdetect --threshold 1 --hardlimit 1 --duration 100 --window 10000000us --width 950000us] F0908 15:27:10.603523 1 main.go:53] failed to run hwlatdetect command; out: hwlatdetect: test duration 100 seconds detector: tracer parameters: Latency threshold: 1us Sample window: 10000000us Sample width: 950000us Non-sampling period: 9050000us Output File: None Starting test test finished Max Latency: 326us Samples recorded: 5 Samples exceeding threshold: 5 ts: 1662650739.017274507, inner:6, outer:6 ts: 1662650749.257272414, inner:14, outer:326 ts: 1662650779.977272835, inner:314, outer:12 ts: 1662650800.457272384, inner:3, outer:9 ts: 1662650810.697273520, inner:3, outer:2 [...] JUnit report was created: /junit.xml/cnftests-junit.xml Summarizing 1 Failure: [Fail] [performance] Latency Test with the hwlatdetect image [It] should succeed /remote-source/app/vendor/github.com/openshift/cluster-node-tuning-operator/test/e2e/performanceprofile/functests/4_latency/latency.go:476 Ran 1 of 194 Specs in 365.797 seconds FAIL! -- 0 Passed | 1 Failed | 0 Pending | 2 Skipped --- FAIL: TestTest (366.08s) FAIL-
Latency threshold: You can configure the latency threshold by using theMAXIMUM_LATENCYor theHWLATDETECT_MAXIMUM_LATENCYenvironment variables. -
Max Latency: The maximum latency value measured during the test.
-
18.3.2. Example hwlatdetect test results
To track the impact of changes made during testing, capture the raw data from each run along with a combined set of your optimal configuration settings. Retaining these metrics provides a comprehensive history of your test results.
You can capture the following types of results:
- Rough results that are gathered after each run to create a history of impact on any changes made throughout the test.
- The combined set of the rough tests with the best results and configuration settings.
Example of good results
hwlatdetect: test duration 3600 seconds
detector: tracer
parameters:
Latency threshold: 10us
Sample window: 1000000us
Sample width: 950000us
Non-sampling period: 50000us
Output File: None
Starting test
test finished
Max Latency: Below threshold
Samples recorded: 0
The hwlatdetect tool only provides output if the sample exceeds the specified threshold.
Example of bad results
hwlatdetect: test duration 3600 seconds
detector: tracer
parameters:Latency threshold: 10usSample window: 1000000us
Sample width: 950000usNon-sampling period: 50000usOutput File: None
Starting tests:1610542421.275784439, inner:78, outer:81
ts: 1610542444.330561619, inner:27, outer:28
ts: 1610542445.332549975, inner:39, outer:38
ts: 1610542541.568546097, inner:47, outer:32
ts: 1610542590.681548531, inner:13, outer:17
ts: 1610543033.818801482, inner:29, outer:30
ts: 1610543080.938801990, inner:90, outer:76
ts: 1610543129.065549639, inner:28, outer:39
ts: 1610543474.859552115, inner:28, outer:35
ts: 1610543523.973856571, inner:52, outer:49
ts: 1610543572.089799738, inner:27, outer:30
ts: 1610543573.091550771, inner:34, outer:28
ts: 1610543574.093555202, inner:116, outer:63
The output of hwlatdetect shows that multiple samples exceed the threshold. However, the same output can indicate different results based on the following factors:
- The duration of the test
- The number of CPU cores
- The host firmware settings
Before proceeding with the next latency test, ensure that the latency reported by hwlatdetect meets the required threshold. Fixing latencies introduced by hardware might require you to contact the system vendor support.
Not all latency spikes are hardware related. Ensure that you tune the host firmware to meet your workload requirements. For more information, see "Setting firmware parameters for system tuning".
18.3.3. Running cyclictest
To measure real-time kernel scheduler latency on specified CPUs, run the cyclictest tool. Evaluating these metrics helps you identify execution delays and optimize your system for high-performance operations.
When executing podman commands as a non-root or non-privileged user, mounting paths can fail with permission denied errors. Depending on your local operating system and SELinux configuration, you might also experience issues running these commands from your home directory. To make the podman commands work, run the commands from a folder that is not your home/<username> directory, and append :Z to the volumes creation. For example, -v $(pwd)/:/kubeconfig:Z. This allows podman to do the proper SELinux relabeling.
Prerequisites
- You have reviewed the prerequisites for running latency tests.
Procedure
To perform the
cyclictest, run the following command, substituting variable values as appropriate:$ podman run -v $(pwd)/:/kubeconfig:Z -e KUBECONFIG=/kubeconfig/kubeconfig \ -e LATENCY_TEST_CPUS=10 -e LATENCY_TEST_RUNTIME=600 -e MAXIMUM_LATENCY=20 \ registry.redhat.io/openshift4/cnf-tests-rhel9:v4.16 \ /usr/bin/test-run.sh --ginkgo.focus="cyclictest" --ginkgo.v --ginkgo.timeout="24h"The command runs the
cyclictesttool for 10 minutes (600 seconds). The test runs successfully when the maximum observed latency is lower thanMAXIMUM_LATENCY(in this example, 20 μs). Latency spikes of 20 μs and above are generally not acceptable for telco RAN workloads.If the results exceed the latency threshold, the test fails.
ImportantDuring testing shorter time periods, as shown, can be used to run the tests. However, for final verification and valid results, the test should run for at least 12 hours (43200 seconds).
Example failure output
running /usr/bin/cnftests -ginkgo.v -ginkgo.focus=cyclictest I0908 13:01:59.193776 27 request.go:601] Waited for 1.046228824s due to client-side throttling, not priority and fairness, request: GET:https://api.compute-1.example.com:6443/apis/packages.operators.coreos.com/v1?timeout=32s Running Suite: CNF Features e2e integration tests ================================================= Random Seed: 1662642118 Will run 1 of 3 specs [...] Summarizing 1 Failure: [Fail] [performance] Latency Test with the cyclictest image [It] should succeed /remote-source/app/vendor/github.com/openshift/cluster-node-tuning-operator/test/e2e/performanceprofile/functests/4_latency/latency.go:220 Ran 1 of 194 Specs in 161.151 seconds FAIL! -- 0 Passed | 1 Failed | 0 Pending | 2 Skipped --- FAIL: TestTest (161.48s) FAIL
18.3.4. Example cyclictest results
To accurately interpret latency test results, evaluate the metrics against your specific workload requirements. Acceptable performance thresholds differ significantly depending on whether you are running 4G DU or 5G DU workloads.
The following example shows a spike up to 18μs that is acceptable for 4G DU workloads, but not for 5G DU workloads:
Example of good results
running cmd: cyclictest -q -D 10m -p 1 -t 16 -a 2,4,6,8,10,12,14,16,54,56,58,60,62,64,66,68 -h 30 -i 1000 -m
# Histogram
000000 000000 000000 000000 000000 000000 000000 000000 000000 000000 000000 000000 000000 000000 000000 000000 000000
000001 000000 000000 000000 000000 000000 000000 000000 000000 000000 000000 000000 000000 000000 000000 000000 000000
000002 579506 535967 418614 573648 532870 529897 489306 558076 582350 585188 583793 223781 532480 569130 472250 576043
More histogram entries ...
# Total: 000600000 000600000 000600000 000599999 000599999 000599999 000599998 000599998 000599998 000599997 000599997 000599996 000599996 000599995 000599995 000599995
# Min Latencies: 00002 00002 00002 00002 00002 00002 00002 00002 00002 00002 00002 00002 00002 00002 00002 00002
# Avg Latencies: 00002 00002 00002 00002 00002 00002 00002 00002 00002 00002 00002 00002 00002 00002 00002 00002
# Max Latencies: 00005 00005 00004 00005 00004 00004 00005 00005 00006 00005 00004 00005 00004 00004 00005 00004
# Histogram Overflows: 00000 00000 00000 00000 00000 00000 00000 00000 00000 00000 00000 00000 00000 00000 00000 00000
# Histogram Overflow at cycle number:
# Thread 0:
# Thread 1:
# Thread 2:
# Thread 3:
# Thread 4:
# Thread 5:
# Thread 6:
# Thread 7:
# Thread 8:
# Thread 9:
# Thread 10:
# Thread 11:
# Thread 12:
# Thread 13:
# Thread 14:
# Thread 15:Example of bad results
running cmd: cyclictest -q -D 10m -p 1 -t 16 -a 2,4,6,8,10,12,14,16,54,56,58,60,62,64,66,68 -h 30 -i 1000 -m
# Histogram
000000 000000 000000 000000 000000 000000 000000 000000 000000 000000 000000 000000 000000 000000 000000 000000 000000
000001 000000 000000 000000 000000 000000 000000 000000 000000 000000 000000 000000 000000 000000 000000 000000 000000
000002 564632 579686 354911 563036 492543 521983 515884 378266 592621 463547 482764 591976 590409 588145 589556 353518
More histogram entries ...
# Total: 000599999 000599999 000599999 000599997 000599997 000599998 000599998 000599997 000599997 000599996 000599995 000599996 000599995 000599995 000599995 000599993
# Min Latencies: 00002 00002 00002 00002 00002 00002 00002 00002 00002 00002 00002 00002 00002 00002 00002 00002
# Avg Latencies: 00002 00002 00002 00002 00002 00002 00002 00002 00002 00002 00002 00002 00002 00002 00002 00002
# Max Latencies: 00493 00387 00271 00619 00541 00513 00009 00389 00252 00215 00539 00498 00363 00204 00068 00520
# Histogram Overflows: 00001 00001 00001 00002 00002 00001 00000 00001 00001 00001 00002 00001 00001 00001 00001 00002
# Histogram Overflow at cycle number:
# Thread 0: 155922
# Thread 1: 110064
# Thread 2: 110064
# Thread 3: 110063 155921
# Thread 4: 110063 155921
# Thread 5: 155920
# Thread 6:
# Thread 7: 110062
# Thread 8: 110062
# Thread 9: 155919
# Thread 10: 110061 155919
# Thread 11: 155918
# Thread 12: 155918
# Thread 13: 110060
# Thread 14: 110060
# Thread 15: 110059 15591718.3.5. Running oslat
To evaluate how your cluster handles CPU-heavy data processing, run the oslat test. This diagnostic tool simulates a CPU-intensive DPDK application to measure system interruptions and performance disruptions.
When executing podman commands as a non-root or non-privileged user, mounting paths can fail with permission denied errors. Depending on your local operating system and SELinux configuration, you might also experience issues running these commands from your home directory. To make the podman commands work, run the commands from a folder that is not your home/<username> directory, and append :Z to the volumes creation. For example, -v $(pwd)/:/kubeconfig:Z. This allows podman to do the proper SELinux relabeling.
Prerequisites
- You have reviewed the prerequisites for running latency tests.
Procedure
To perform the
oslattest, run the following command, substituting variable values as appropriate:$ podman run -v $(pwd)/:/kubeconfig:Z -e KUBECONFIG=/kubeconfig/kubeconfig \ -e LATENCY_TEST_CPUS=10 -e LATENCY_TEST_RUNTIME=600 -e MAXIMUM_LATENCY=20 \ registry.redhat.io/openshift4/cnf-tests-rhel9:v4.16 \ /usr/bin/test-run.sh --ginkgo.focus="oslat" --ginkgo.v --ginkgo.timeout="24h"LATENCY_TEST_CPUSspecifies the number of CPUs to test with theoslatcommand.The command runs the
oslattool for 10 minutes (600 seconds). The test runs successfully when the maximum observed latency is lower thanMAXIMUM_LATENCY(20 μs).If the results exceed the latency threshold, the test fails.
ImportantDuring testing shorter time periods, as shown, can be used to run the tests. However, for final verification and valid results, the test should run for at least 12 hours (43200 seconds).
Example failure output
running /usr/bin/cnftests -ginkgo.v -ginkgo.focus=oslat I0908 12:51:55.999393 27 request.go:601] Waited for 1.044848101s due to client-side throttling, not priority and fairness, request: GET:https://compute-1.example.com:6443/apis/machineconfiguration.openshift.io/v1?timeout=32s Running Suite: CNF Features e2e integration tests ================================================= Random Seed: 1662641514 Will run 1 of 3 specs [...] • Failure [77.833 seconds] [performance] Latency Test /remote-source/app/vendor/github.com/openshift/cluster-node-tuning-operator/test/e2e/performanceprofile/functests/4_latency/latency.go:62 with the oslat image /remote-source/app/vendor/github.com/openshift/cluster-node-tuning-operator/test/e2e/performanceprofile/functests/4_latency/latency.go:128 should succeed [It] /remote-source/app/vendor/github.com/openshift/cluster-node-tuning-operator/test/e2e/performanceprofile/functests/4_latency/latency.go:153 The current latency 304 is bigger than the expected one 1 :1 [...] Summarizing 1 Failure: [Fail] [performance] Latency Test with the oslat image [It] should succeed /remote-source/app/vendor/github.com/openshift/cluster-node-tuning-operator/test/e2e/performanceprofile/functests/4_latency/latency.go:177 Ran 1 of 194 Specs in 161.091 seconds FAIL! -- 0 Passed | 1 Failed | 0 Pending | 2 Skipped --- FAIL: TestTest (161.42s) FAIL- 1
- In this example, the measured latency is outside the maximum allowed value.
18.4. Generating a latency test failure report
To analyze test failures and troubleshoot performance issues, generate a JUnit latency test output and test failure report. Reviewing this diagnostic data helps you pinpoint exactly where your system is experiencing delays.
Prerequisites
-
You have installed the OpenShift CLI (
oc). -
You have logged in as a user with
cluster-adminprivileges.
Procedure
Create a test failure report with information about the cluster state and resources for troubleshooting by passing the
--reportparameter with the path to where the report is dumped:$ podman run -v $(pwd)/:/kubeconfig:Z -v $(pwd)/reportdest:<report_folder_path> \ -e KUBECONFIG=/kubeconfig/kubeconfig registry.redhat.io/openshift4/cnf-tests-rhel9:v4.16 \ /usr/bin/test-run.sh --report <report_folder_path> --ginkgo.v-
<report_folder_path>: Specifies the path to the folder where the report is generated.
-
18.5. Generating a JUnit latency test report
To analyze system performance and track execution delays, generate a JUnit latency test report. Reviewing this diagnostic output helps you identify configuration issues and performance bottlenecks within your cluster.
Prerequisites
-
You have installed the OpenShift CLI (
oc). -
You have logged in as a user with
cluster-adminprivileges.
Procedure
Create a JUnit-compliant XML report by passing the
--junitparameter together with the path to where the report is dumped:NoteYou must create the
junitfolder before running this command.$ podman run -v $(pwd)/:/kubeconfig:Z -v $(pwd)/junit:/junit \ -e KUBECONFIG=/kubeconfig/kubeconfig registry.redhat.io/openshift4/cnf-tests-rhel9:v4.16 \ /usr/bin/test-run.sh --ginkgo.junit-report junit/<file_name>.xml --ginkgo.vwhere:
file_name- The name of the XML report file.
18.6. Running latency tests on a single-node OpenShift cluster
To validate node tuning and identify performance delays, run latency tests on your single-node OpenShift clusters. Evaluating these metrics ensures your environment is optimized for high-performance workloads.
When executing podman commands as a non-root or non-privileged user, mounting paths can fail with permission denied errors. To make the podman command work, append :Z to the volumes creation; for example, -v $(pwd)/:/kubeconfig:Z. This allows podman to do the proper SELinux relabeling.
Prerequisites
-
You have installed the OpenShift CLI (
oc). -
You have logged in as a user with
cluster-adminprivileges. - You have applied a cluster performance profile by using the Node Tuning Operator.
Procedure
To run the latency tests on a single-node OpenShift cluster, run the following command:
$ podman run -v $(pwd)/:/kubeconfig:Z -e KUBECONFIG=/kubeconfig/kubeconfig \ -e LATENCY_TEST_RUNTIME=<time_in_seconds> registry.redhat.io/openshift4/cnf-tests-rhel9:v4.16 \ /usr/bin/test-run.sh --ginkgo.v --ginkgo.timeout="24h"NoteThe default runtime for each test is 300 seconds. For valid latency test results, run the tests for at least 12 hours by updating the
LATENCY_TEST_RUNTIMEvariable.To run the buckets latency validation step, you must specify a maximum latency. For details on maximum latency variables, see the table in the "Measuring latency" section.
After running the test suite, all the dangling resources are cleaned up.
18.7. Running latency tests in a disconnected cluster
The CNF tests image can run tests in a disconnected cluster that is not able to reach external registries. This requires two steps:
-
Mirroring the
cnf-testsimage to the custom disconnected registry. - Instructing the tests to consume the images from the custom disconnected registry.
18.7.1. Mirroring the images to a custom registry accessible from the cluster
To make required images accessible from your cluster, mirror them to a custom registry. Performing this synchronization ensures that your deployment has the necessary container files, which is particularly useful in restricted or disconnected network environments.
A mirror executable is shipped in the image to provide the input required by oc to mirror the test image to a local registry.
Procedure
Run the following command from an intermediate machine that has access to the cluster and registry.redhat.io:
$ podman run -v $(pwd)/:/kubeconfig:Z -e KUBECONFIG=/kubeconfig/kubeconfig \ registry.redhat.io/openshift4/cnf-tests-rhel9:v4.16 \ /usr/bin/mirror -registry <disconnected_registry> | oc image mirror -f -where:
<disconnected_registry>-
Specifies the disconnected mirror registry you have configured, such as
my.local.registry:5000/.
When you have mirrored the
cnf-testsimage into the disconnected registry, you must override the original registry used to fetch the images when running the tests by a command similar to the following example:$ podman run -v $(pwd)/:/kubeconfig:Z -e KUBECONFIG=/kubeconfig/kubeconfig \ -e IMAGE_REGISTRY="<disconnected_registry>" \ -e CNF_TESTS_IMAGE="cnf-tests-rhel9:v4.16" \ -e LATENCY_TEST_RUNTIME=<time_in_seconds> \ <disconnected_registry>/cnf-tests-rhel9:v4.16 /usr/bin/test-run.sh --ginkgo.v --ginkgo.timeout="24h"
18.7.2. Configuring the tests to consume images from a custom registry
You can run the latency tests by using a custom test image and image registry using CNF_TESTS_IMAGE and IMAGE_REGISTRY variables.
Procedure
To configure the latency tests to use a custom test image and image registry, run a command similar to the following example:
$ podman run -v $(pwd)/:/kubeconfig:Z -e KUBECONFIG=/kubeconfig/kubeconfig \ -e IMAGE_REGISTRY="<custom_image_registry>" \ -e CNF_TESTS_IMAGE="<custom_cnf-tests_image>" \ -e LATENCY_TEST_RUNTIME=<time_in_seconds> \ registry.redhat.io/openshift4/cnf-tests-rhel9:v4.16 /usr/bin/test-run.sh --ginkgo.v --ginkgo.timeout="24h"where:
<custom_image_registry>-
Specifies the custom image registry, for example,
custom.registry:5000/. <custom_cnf-tests_image>-
Specifies the custom cnf-tests image, for example,
custom-cnf-tests-image:latest.
18.7.3. Mirroring images to the cluster OpenShift image registry
To make container images locally available for your deployment, mirror them to the built-in OpenShift image registry. This integrated component runs as a standard workload on your OpenShift Container Platform cluster to ensure continuous access to required files.
Procedure
Gain external access to the registry by exposing the registry with a route. You can do this task by running a command similar to the following example:
$ oc patch configs.imageregistry.operator.openshift.io/cluster --patch '{"spec":{"defaultRoute":true}}' --type=mergeFetch the registry endpoint by running a command similar to the following example:
$ REGISTRY=$(oc get route default-route -n openshift-image-registry --template='{{ .spec.host }}')Create a namespace for exposing the images by running a command similar to the following example:
$ oc create ns cnftestsMake the image stream available to all the namespaces used for tests. This is required to allow the tests namespaces to fetch the images from the
cnf-testsimage stream. Run commands similar to the following examples:$ oc policy add-role-to-user system:image-puller system:serviceaccount:cnf-features-testing:default --namespace=cnftests$ oc policy add-role-to-user system:image-puller system:serviceaccount:performance-addon-operators-testing:default --namespace=cnftestsRetrieve the docker secret name by running a command similar to the following example:
$ SECRET=$(oc -n cnftests get secret | grep builder-docker | awk {'print $1'}Retrieve the docker auth token by running a command similar to the following example:
$ TOKEN=$(oc -n cnftests get secret $SECRET -o jsonpath="{.data['\.dockercfg']}" | base64 --decode | jq '.["image-registry.openshift-image-registry.svc:5000"].auth')Create a
dockerauth.jsonfile, for example:$ echo "{\"auths\": { \"$REGISTRY\": { \"auth\": $TOKEN } }}" > dockerauth.jsonMirror the image by running a command similar to the following example:
$ podman run -v $(pwd)/:/kubeconfig:Z -e KUBECONFIG=/kubeconfig/kubeconfig \ registry.redhat.io/openshift4/cnf-tests-rhel9:v4.16 \ /usr/bin/mirror -registry $REGISTRY/cnftests | oc image mirror --insecure=true \ -a=$(pwd)/dockerauth.json -f -Run the tests by running a command similar to the following example:
$ podman run -v $(pwd)/:/kubeconfig:Z -e KUBECONFIG=/kubeconfig/kubeconfig \ -e LATENCY_TEST_RUNTIME=<time_in_seconds> \ -e IMAGE_REGISTRY=image-registry.openshift-image-registry.svc:5000/cnftests cnf-tests-local:latest /usr/bin/test-run.sh --ginkgo.v --ginkgo.timeout="24h"
18.7.4. Mirroring a different set of test images
You can optionally change the default upstream images that are mirrored for the latency tests.
Procedure
The
mirrorcommand tries to mirror the upstream images by default. This can be overridden by passing a file with the following format to the image:[ { "registry": "public.registry.io:5000", "image": "imageforcnftests:4.16" } ]Pass the file to the
mirrorcommand, for example saving it locally asimages.json. With the following command, the local path is mounted in/kubeconfiginside the container and that can be passed to the mirror command.$ podman run -v $(pwd)/:/kubeconfig:Z -e KUBECONFIG=/kubeconfig/kubeconfig \ registry.redhat.io/openshift4/cnf-tests-rhel9:v4.16 /usr/bin/mirror \ --registry "my.local.registry:5000/" --images "/kubeconfig/images.json" \ | oc image mirror -f -
18.8. Troubleshooting errors with the cnf-tests container
To troubleshoot errors when running latency tests, verify that your cluster is accessible from within the cnf-tests container. Ensuring this connectivity resolves common test execution failures.
Prerequisites
-
You have installed the OpenShift CLI (
oc). -
You have logged in as a user with
cluster-adminprivileges.
Procedure
Verify that the cluster is accessible from inside the
cnf-testscontainer by running the following command:$ podman run -v $(pwd)/:/kubeconfig:Z -e KUBECONFIG=/kubeconfig/kubeconfig \ registry.redhat.io/openshift4/cnf-tests-rhel9:v4.16 \ oc get nodesIf this command does not work, an error related to spanning across DNS, MTU size, or firewall access might be occurring.
Chapter 19. Improving cluster stability in high latency environments using worker latency profiles
To improve cluster stability in high latency environments, apply worker latency profiles. These profiles adjust Kubelet timing parameters to ensure that nodes remain healthy and responsive despite network delays.
If the cluster administrator has performed latency tests for platform verification, they can discover the need to adjust the operation of the cluster to ensure stability in cases of high latency.
The cluster administrator needs to change only one parameter, recorded in a file, which controls four parameters affecting how supervisory processes read status and interpret the health of the cluster. Changing only the one parameter provides cluster tuning in an easy, supportable manner.
The Kubelet process provides the starting point for monitoring cluster health. The Kubelet sets status values for all nodes in the OpenShift Container Platform cluster. The Kubernetes Controller Manager (kube controller) reads the status values every 10 seconds, by default. If the kube controller cannot read a node status value, it loses contact with that node after a configured period. The default behavior is:
-
The node controller on the control plane updates the node health to
Unhealthyand marks the nodeReadycondition`Unknown`. - In response, the scheduler stops scheduling pods to that node.
-
The Node Lifecycle Controller adds a
node.kubernetes.io/unreachabletaint with aNoExecuteeffect to the node and schedules any pods on the node for eviction after five minutes, by default.
This behavior can cause problems if your network is prone to latency issues, especially if you have nodes at the network edge. In some cases, the Kubernetes Controller Manager might not receive an update from a healthy node due to network latency. The Kubelet evicts pods from the node even though the node is healthy.
To avoid this problem, you can use worker latency profiles to adjust the frequency that the Kubelet and the Kubernetes Controller Manager wait for status updates before taking action. These adjustments help to ensure that your cluster runs properly if network latency between the control plane and the worker nodes is not optimal.
These worker latency profiles contain three sets of parameters that are predefined with carefully tuned values to control the reaction of the cluster to increased latency. There is no need to experimentally find the best values manually.
You can configure worker latency profiles when installing a cluster or at any time you notice increased latency in your cluster network.
19.1. Understanding worker latency profiles
Review the following information to learn about worker latency profiles, which allow you to control the reaction of the cluster to latency issues without needing to determine the best values by using manual methods.
Worker latency profiles are four different categories of carefully-tuned parameters. The four parameters which implement these values are node-status-update-frequency, node-monitor-grace-period, default-not-ready-toleration-seconds and default-unreachable-toleration-seconds.
Setting these parameters manually is not supported. Incorrect parameter settings adversely affect cluster stability.
All worker latency profiles configure the following parameters:
- node-status-update-frequency
- Specifies how often the kubelet posts node status to the API server.
- node-monitor-grace-period
-
Specifies the amount of time in seconds that the Kubernetes Controller Manager waits for an update from a kubelet before marking the node unhealthy and adding the
node.kubernetes.io/not-readyornode.kubernetes.io/unreachabletaint to the node. - default-not-ready-toleration-seconds
- Specifies the amount of time in seconds after marking a node unhealthy that the Kube API Server Operator waits before evicting pods from that node.
- default-unreachable-toleration-seconds
- Specifies the amount of time in seconds after marking a node unreachable that the Kube API Server Operator waits before evicting pods from that node.
The following Operators monitor the changes to the worker latency profiles and respond accordingly:
-
The Machine Config Operator (MCO) updates the
node-status-update-frequencyparameter on the compute nodes. -
The Kubernetes Controller Manager updates the
node-monitor-grace-periodparameter on the control plane nodes. -
The Kubernetes API Server Operator updates the
default-not-ready-toleration-secondsanddefault-unreachable-toleration-secondsparameters on the control plane nodes.
Although the default configuration works in most cases, OpenShift Container Platform offers two other worker latency profiles for situations where the network is experiencing higher latency than usual. The three worker latency profiles are described in the following sections:
- Default worker latency profile
With the
Defaultprofile, eachKubeletupdates its status every 10 seconds (node-status-update-frequency). TheKube Controller Managerchecks the statuses ofKubeletevery 5 seconds.The Kubernetes Controller Manager waits 40 seconds (
node-monitor-grace-period) for a status update fromKubeletbefore considering theKubeletunhealthy. If no status is made available to the Kubernetes Controller Manager, it then marks the node with thenode.kubernetes.io/not-readyornode.kubernetes.io/unreachabletaint and evicts the pods on that node.If a pod is on a node that has the
NoExecutetaint, the pod runs according totolerationSeconds. If the node has no taint, it will be evicted in 300 seconds (default-not-ready-toleration-secondsanddefault-unreachable-toleration-secondssettings of theKube API Server).Expand Profile Component Parameter Value Default
kubelet
node-status-update-frequency10s
Kubelet Controller Manager
node-monitor-grace-period40s
Kubernetes API Server Operator
default-not-ready-toleration-seconds300s
Kubernetes API Server Operator
default-unreachable-toleration-seconds300s
- Medium worker latency profile
Use the
MediumUpdateAverageReactionprofile if the network latency is slightly higher than usual.The
MediumUpdateAverageReactionprofile reduces the frequency of kubelet updates to 20 seconds and changes the period that the Kubernetes Controller Manager waits for those updates to 2 minutes. The pod eviction period for a pod on that node is reduced to 60 seconds. If the pod has thetolerationSecondsparameter, the eviction waits for the period specified by that parameter.The Kubernetes Controller Manager waits for 2 minutes to consider a node unhealthy. In another minute, the eviction process starts.
Expand Profile Component Parameter Value MediumUpdateAverageReaction
kubelet
node-status-update-frequency20s
Kubelet Controller Manager
node-monitor-grace-period2m
Kubernetes API Server Operator
default-not-ready-toleration-seconds60s
Kubernetes API Server Operator
default-unreachable-toleration-seconds60s
- Low worker latency profile
Use the
LowUpdateSlowReactionprofile if the network latency is extremely high.The
LowUpdateSlowReactionprofile reduces the frequency of kubelet updates to 1 minute and changes the period that the Kubernetes Controller Manager waits for those updates to 5 minutes. The pod eviction period for a pod on that node is reduced to 60 seconds. If the pod has thetolerationSecondsparameter, the eviction waits for the period specified by that parameter.The Kubernetes Controller Manager waits for 5 minutes to consider a node unhealthy. In another minute, the eviction process starts.
Expand Profile Component Parameter Value LowUpdateSlowReaction
kubelet
node-status-update-frequency1m
Kubelet Controller Manager
node-monitor-grace-period5m
Kubernetes API Server Operator
default-not-ready-toleration-seconds60s
Kubernetes API Server Operator
default-unreachable-toleration-seconds60s
The latency profiles do not support custom machine config pools, only the default worker machine config pools.
19.2. Implementing worker latency profiles at cluster creation
To ensure cluster stability in high latency environments, implement worker latency profiles during cluster creation.
To edit the configuration of the installation program, first use the command openshift-install create manifests to create the default node manifest and other manifest YAML files. This file structure must exist before you can add workerLatencyProfile. The platform on which you are installing might have varying requirements. Refer to the Installing section of the documentation for your specific platform.
Procedure
- Create the manifest that is needed to build the cluster by using a folder name appropriate for your installation.
-
Create a YAML file to define
config.node. The file must be in themanifestsdirectory. -
When defining
workerLatencyProfilein the manifest for the first time, specify any of the profiles at cluster creation time:Default,MediumUpdateAverageReactionorLowUpdateSlowReaction.
Verification
View the manifest file by running the following command. The output of the command should show the creation of the
spec.workerLatencyProfileDefaultvalue in the manifest file.$ openshift-install create manifests --dir=<cluster_install_dir>-
<cluster_install_dir>: Specifies the directory where you installed your cluster. Edit the manifest and add the value by entering the following command. The following example command uses the
vieditor to show an example manifest file with the "Default"workerLatencyProfilevalue added.$ vi <cluster_install_dir>/manifests/config-node-default-profile.yaml<cluster_install_dir>: Specifies the directory where you installed your cluster.Example output
apiVersion: config.openshift.io/v1 kind: Node metadata: name: cluster spec: workerLatencyProfile: "Default" # ...
19.3. Using and changing worker latency profiles
You can change a worker latency profile to deal with network latency at any time by editing the node.config object. With this configuration, you can ensure that your cluster runs properly if network latency between the control plane and the compute nodes fluctuates.
You must move one worker latency profile at a time. For example, you cannot move directly from the Default profile to the LowUpdateSlowReaction worker latency profile. You must move from the Default worker latency profile to the MediumUpdateAverageReaction profile and then to the LowUpdateSlowReaction profile. Similarly, when returning to the Default profile, you must move from the low profile to the medium profile first, then to Default.
You can also configure worker latency profiles upon installing an OpenShift Container Platform cluster.
Procedure
Move to the medium worker latency profile:
Edit the
node.configobject:$ oc edit nodes.config/clusterAdd
spec.workerLatencyProfile: MediumUpdateAverageReaction:Example
node.configobjectapiVersion: config.openshift.io/v1 kind: Node metadata: annotations: include.release.openshift.io/ibm-cloud-managed: "true" include.release.openshift.io/self-managed-high-availability: "true" include.release.openshift.io/single-node-developer: "true" release.openshift.io/create-only: "true" creationTimestamp: "2022-07-08T16:02:51Z" generation: 1 name: cluster ownerReferences: - apiVersion: config.openshift.io/v1 kind: ClusterVersion name: version uid: 36282574-bf9f-409e-a6cd-3032939293eb resourceVersion: "1865" uid: 0c0f7a4c-4307-4187-b591-6155695ac85b spec: workerLatencyProfile: MediumUpdateAverageReaction # ...where:
spec.workerLatencyProfile.MediumUpdateAverageReaction- Specifies that the medium worker latency policy should be used.
Scheduling on each compute node is disabled as the change is being applied.
Optional: Move to the low worker latency profile:
Edit the
node.configobject:$ oc edit nodes.config/clusterChange the
spec.workerLatencyProfilevalue toLowUpdateSlowReaction:Example
node.configobjectapiVersion: config.openshift.io/v1 kind: Node metadata: annotations: include.release.openshift.io/ibm-cloud-managed: "true" include.release.openshift.io/self-managed-high-availability: "true" include.release.openshift.io/single-node-developer: "true" release.openshift.io/create-only: "true" creationTimestamp: "2022-07-08T16:02:51Z" generation: 1 name: cluster ownerReferences: - apiVersion: config.openshift.io/v1 kind: ClusterVersion name: version uid: 36282574-bf9f-409e-a6cd-3032939293eb resourceVersion: "1865" uid: 0c0f7a4c-4307-4187-b591-6155695ac85b spec: workerLatencyProfile: LowUpdateSlowReaction # ...where:
spec.workerLatencyProfile.LowUpdateSlowReaction- Specifies that the low worker latency policy should be used.
Scheduling on each compute node is disabled as the change is being applied.
Verification
When all nodes return to the
Readycondition, you can use the following command to look in the Kubernetes Controller Manager to ensure it was applied:$ oc get KubeControllerManager -o yaml | grep -i workerlatency -A 5 -B 5Example output
# ... - lastTransitionTime: "2022-07-11T19:47:10Z" reason: ProfileUpdated status: "False" type: WorkerLatencyProfileProgressing - lastTransitionTime: "2022-07-11T19:47:10Z" message: all static pod revision(s) have updated latency profile reason: ProfileUpdated status: "True" type: WorkerLatencyProfileComplete - lastTransitionTime: "2022-07-11T19:20:11Z" reason: AsExpected status: "False" type: WorkerLatencyProfileDegraded - lastTransitionTime: "2022-07-11T19:20:36Z" status: "False" # ...where:
status.message: all static pod revision(s) have updated latency profile- Specifies that the profile is applied and active.
To change the medium profile to default or change the default to medium, edit the
node.configobject and set thespec.workerLatencyProfileparameter to the appropriate value.
19.4. Displaying resulting values of worker latency profile
To verify the configuration of your compute nodes, display the resulting values of the worker latency profile configured for those nodes. This ensures that the Kubelet parameters are correctly adjusted for high latency environments and helps you confirm system stability.
The following procedure uses example commands to display the values in the worker latency profile configured for your node.
Procedure
Check the
default-not-ready-toleration-secondsanddefault-unreachable-toleration-secondsfields output by the Kube API Server:$ oc get KubeAPIServer -o yaml | grep -A 1 default-Example output
default-not-ready-toleration-seconds: - "300" default-unreachable-toleration-seconds: - "300"Check the values of the
node-monitor-grace-periodfield from the Kube Controller Manager:$ oc get KubeControllerManager -o yaml | grep -A 1 node-monitorExample output
node-monitor-grace-period: - 40sCheck the
nodeStatusUpdateFrequencyvalue from the Kubelet by entering the following command. Set the directory/hostas the root directory within the debug shell. By changing the root directory to/host, you can run binaries contained in the executable paths of the host.$ oc debug node/<compute_node_name>$ chroot /host# cat /etc/kubernetes/kubelet.conf|grep nodeStatusUpdateFrequencyExample output
“nodeStatusUpdateFrequency”: “10s”These outputs validate the set of timing variables for the Worker Latency Profile.
Chapter 20. Workload partitioning
To prevent platform processes from interrupting your applications, configure workload partitioning. This isolates OpenShift Container Platform services and infrastructure pods to a reserved set of CPUs, ensuring that the remaining compute resources are available exclusively for your customer workloads.
The minimum number of reserved CPUs required for the cluster management is four CPU Hyper-Threads (HTs).
In the context of enabling workload partitioning and managing CPU resources effectively, the cluster might not permit incorrectly configured nodes to join the cluster through a node admission webhook. When the workload partitioning feature is enabled, the machine config pools for control plane nodes and compute nodes get supplied with configurations for nodes to use. Adding new nodes to these pools ensures the pools correctly get configured before joining the cluster.
Currently, nodes must have uniform configurations per machine config pool to ensure that correct CPU affinity is set across all nodes within that pool. After admission, nodes within the cluster identify themselves as supporting a new resource type called management.workload.openshift.io/cores and accurately report their CPU capacity. Workload partitioning can be enabled during cluster installation only by adding the additional field cpuPartitioningMode to the install-config.yaml file.
When workload partitioning is enabled, the management.workload.openshift.io/cores resource allows the scheduler to correctly assign pods based on the cpushares capacity of the host, not just the default cpuset. This ensures more precise allocation of resources for workload partitioning scenarios.
Workload partitioning ensures that CPU requests and limits specified in the pod’s configuration are respected. In OpenShift Container Platform 4.16 or later, accurate CPU usage limits are set for platform pods through CPU partitioning. As workload partitioning uses the custom resource type of management.workload.openshift.io/cores, the values for requests and limits are the same due to a requirement by Kubernetes for extended resources. However, the annotations modified by workload partitioning correctly reflect the desired limits.
Extended resources cannot be overcommitted, so request and limit must be equal if both are present in a container spec.
20.1. Enabling workload partitioning
To partition cluster management pods into a specified CPU affinity, enable workload partitioning. This configuration ensures that management pods operate within the reserved CPU limits defined in your Performance Profile, preventing them from consuming resources intended for customer workloads.
Consider additional post-installation Operators that use workload partitioning when calculating how many reserved CPU cores to set aside for the platform.
Workload partitioning isolates user workloads from platform workloads using standard Kubernetes scheduling capabilities.
You can enable workload partitioning only during cluster installation. You cannot disable workload partitioning post-installation. However, you can change the CPU configuration for reserved and isolated CPUs post-installation.
The procedure demonstrates enabling workload partitioning cluster-wide.
Procedure
In the
install-config.yamlfile, add the additional fieldcpuPartitioningModeand set it toAllNodes.apiVersion: v1 baseDomain: devcluster.openshift.com cpuPartitioningMode: AllNodes compute: - architecture: amd64 hyperthreading: Enabled name: worker platform: {} replicas: 3 controlPlane: architecture: amd64 hyperthreading: Enabled name: master platform: {} replicas: 3-
cpuPartitioningMode: Specifies the cluster to set up for CPU partitioning at install time. The default value isNone, which ensures that no CPU partitioning is enabled at install time.
-
20.2. Performance profiles and workload partitioning
To enable workload partitioning, apply a performance profile. This configuration specifies the isolated and reserved CPUs, ensuring that customer workloads run on dedicated cores without interruption from platform processes.
An appropriately configured performance profile specifies the isolated and reserved CPUs. Create a performance profile by using the Performance Profile Creator (PPC) tool.
Sample performance profile configuration
apiVersion: performance.openshift.io/v2
kind: PerformanceProfile
metadata:
# if you change this name make sure the 'include' line in TunedPerformancePatch.yaml
# matches this name: include=openshift-node-performance-${PerformanceProfile.metadata.name}
# Also in file 'validatorCRs/informDuValidator.yaml':
# name: 50-performance-${PerformanceProfile.metadata.name}
name: openshift-node-performance-profile
annotations:
ran.openshift.io/reference-configuration: "ran-du.redhat.com"
spec:
additionalKernelArgs:
- "rcupdate.rcu_normal_after_boot=0"
- "efi=runtime"
- "vfio_pci.enable_sriov=1"
- "vfio_pci.disable_idle_d3=1"
- "module_blacklist=irdma"
cpu:
isolated: $isolated
reserved: $reserved
hugepages:
defaultHugepagesSize: $defaultHugepagesSize
pages:
- size: $size
count: $count
node: $node
machineConfigPoolSelector:
pools.operator.machineconfiguration.openshift.io/$mcp: ""
nodeSelector:
node-role.kubernetes.io/$mcp: ''
numa:
topologyPolicy: "restricted"
# To use the standard (non-realtime) kernel, set enabled to false
realTimeKernel:
enabled: true
workloadHints:
# WorkloadHints defines the set of upper level flags for different type of workloads.
# See https://github.com/openshift/cluster-node-tuning-operator/blob/master/docs/performanceprofile/performance_profile.md#workloadhints
# for detailed descriptions of each item.
# The configuration below is set for a low latency, performance mode.
realTime: true
highPowerConsumption: false
perPodPowerManagement: false| PerformanceProfile CR field | Description |
|---|---|
|
|
Ensure that
|
|
|
|
|
| Set the isolated CPUs. Ensure all of the Hyper-Threading pairs match. Important The reserved and isolated CPU pools must not overlap and together must span all available cores. CPU cores that are not accounted for cause an undefined behaviour in the system. |
|
| Set the reserved CPUs. When workload partitioning is enabled, system processes, kernel threads, and system container threads are restricted to these CPUs. All CPUs that are not isolated should be reserved. |
|
|
|
|
|
Set |
|
|
Use |
Chapter 21. Using the Node Observability Operator
The Node Observability Operator collects and stores CRI-O and Kubelet profiling or metrics from scripts of compute nodes.
With the Node Observability Operator, you can query the profiling data, enabling analysis of performance trends in CRI-O and Kubelet. It supports debugging performance-related issues and executing embedded scripts for network metrics by using the run field in the custom resource definition. To enable CRI-O and Kubelet profiling or scripting, you can configure the type field in the custom resource definition.
The Node Observability Operator is a Technology Preview feature only. Technology Preview features are not supported with Red Hat production service level agreements (SLAs) and might not be functionally complete. Red Hat does not recommend using them in production. These features provide early access to upcoming product features, enabling customers to test functionality and provide feedback during the development process.
For more information about the support scope of Red Hat Technology Preview features, see Technology Preview Features Support Scope.
21.1. Workflow of the Node Observability Operator
The following workflow outlines on how to query the profiling data using the Node Observability Operator:
- Install the Node Observability Operator in the OpenShift Container Platform cluster.
- Create a NodeObservability custom resource to enable the CRI-O profiling on the worker nodes of your choice.
- Run the profiling query to generate the profiling data.
21.2. Installing the Node Observability Operator
The Node Observability Operator is not installed in OpenShift Container Platform by default. You can install the Node Observability Operator by using the OpenShift Container Platform CLI or the web console.
21.2.1. Installing the Node Observability Operator using the CLI
You can install the Node Observability Operator by using the OpenShift CLI (oc).
Prerequisites
- You have installed the OpenShift CLI (oc).
-
You have access to the cluster with
cluster-adminprivileges.
Procedure
Confirm that the Node Observability Operator is available by running the following command:
$ oc get packagemanifests -n openshift-marketplace node-observability-operatorExample output
NAME CATALOG AGE node-observability-operator Red Hat Operators 9hCreate the
node-observability-operatornamespace by running the following command:$ oc new-project node-observability-operatorCreate an
OperatorGroupobject YAML file:cat <<EOF | oc apply -f - apiVersion: operators.coreos.com/v1 kind: OperatorGroup metadata: name: node-observability-operator namespace: node-observability-operator spec: targetNamespaces: [] EOFCreate a
Subscriptionobject YAML file to subscribe a namespace to an Operator:cat <<EOF | oc apply -f - apiVersion: operators.coreos.com/v1alpha1 kind: Subscription metadata: name: node-observability-operator namespace: node-observability-operator spec: channel: alpha name: node-observability-operator source: redhat-operators sourceNamespace: openshift-marketplace EOF
Verification
View the install plan name by running the following command:
$ oc -n node-observability-operator get sub node-observability-operator -o yaml | yq '.status.installplan.name'Example output
install-dt54wVerify the install plan status by running the following command:
$ oc -n node-observability-operator get ip <install_plan_name> -o yaml | yq '.status.phase'<install_plan_name>is the install plan name that you obtained from the output of the previous command.Example output
COMPLETEVerify that the Node Observability Operator is up and running:
$ oc get deploy -n node-observability-operatorExample output
NAME READY UP-TO-DATE AVAILABLE AGE node-observability-operator-controller-manager 1/1 1 1 40h
21.2.2. Installing the Node Observability Operator using the web console
You can install the Node Observability Operator from the OpenShift Container Platform web console.
Prerequisites
-
You have access to the cluster with
cluster-adminprivileges. - You have access to the OpenShift Container Platform web console.
Procedure
- Log in to the OpenShift Container Platform web console.
- In the Administrator’s navigation panel, expand Operators → OperatorHub.
- In the All items field, enter Node Observability Operator and select the Node Observability Operator tile.
- Click Install.
On the Install Operator page, configure the following settings:
- In the Update channel area, click alpha.
- In the Installation mode area, click A specific namespace on the cluster.
- From the Installed Namespace list, select node-observability-operator from the list.
- In the Update approval area, select Automatic.
- Click Install.
Verification
- In the Administrator’s navigation panel, expand Operators → Installed Operators.
- Verify that the Node Observability Operator is listed in the Operators list.
21.3. Requesting CRI-O and Kubelet profiling data using the Node Observability Operator
Creating a Node Observability custom resource to collect CRI-O and Kubelet profiling data.
21.3.1. Creating the Node Observability custom resource
You must create and run the NodeObservability custom resource (CR) before you run the profiling query. When you run the NodeObservability CR, it creates the necessary machine config and machine config pool CRs to enable the CRI-O profiling on the worker nodes matching the nodeSelector.
If CRI-O profiling is not enabled on the worker nodes, the NodeObservabilityMachineConfig resource gets created. Worker nodes matching the nodeSelector specified in NodeObservability CR restarts. This might take 10 or more minutes to complete.
Kubelet profiling is enabled by default.
The CRI-O unix socket of the node is mounted on the agent pod, which allows the agent to communicate with CRI-O to run the pprof request. Similarly, the kubelet-serving-ca certificate chain is mounted on the agent pod, which allows secure communication between the agent and node’s kubelet endpoint.
Prerequisites
- You have installed the Node Observability Operator.
- You have installed the OpenShift CLI (oc).
-
You have access to the cluster with
cluster-adminprivileges.
Procedure
Log in to the OpenShift Container Platform CLI by running the following command:
$ oc login -u kubeadmin https://<HOSTNAME>:6443Switch back to the
node-observability-operatornamespace by running the following command:$ oc project node-observability-operatorCreate a CR file named
nodeobservability.yamlthat contains the following text:apiVersion: nodeobservability.olm.openshift.io/v1alpha2 kind: NodeObservability metadata: name: cluster1 spec: nodeSelector: kubernetes.io/hostname: <node_hostname>2 type: crio-kubeletRun the
NodeObservabilityCR:oc apply -f nodeobservability.yamlExample output
nodeobservability.olm.openshift.io/cluster createdReview the status of the
NodeObservabilityCR by running the following command:$ oc get nob/cluster -o yaml | yq '.status.conditions'Example output
conditions: conditions: - lastTransitionTime: "2022-07-05T07:33:54Z" message: 'DaemonSet node-observability-ds ready: true NodeObservabilityMachineConfig ready: true' reason: Ready status: "True" type: ReadyNodeObservabilityCR run is completed when the reason isReadyand the status isTrue.
21.3.2. Running the profiling query
To run the profiling query, you must create a NodeObservabilityRun resource. The profiling query is a blocking operation that fetches CRI-O and Kubelet profiling data for a duration of 30 seconds. After the profiling query is complete, you must retrieve the profiling data inside the container file system /run/node-observability directory. The lifetime of data is bound to the agent pod through the emptyDir volume, so you can access the profiling data while the agent pod is in the running status.
You can request only one profiling query at any point of time.
Prerequisites
- You have installed the Node Observability Operator.
-
You have created the
NodeObservabilitycustom resource (CR). -
You have access to the cluster with
cluster-adminprivileges.
Procedure
Create a
NodeObservabilityRunresource file namednodeobservabilityrun.yamlthat contains the following text:apiVersion: nodeobservability.olm.openshift.io/v1alpha2 kind: NodeObservabilityRun metadata: name: nodeobservabilityrun spec: nodeObservabilityRef: name: clusterTrigger the profiling query by running the
NodeObservabilityRunresource:$ oc apply -f nodeobservabilityrun.yamlReview the status of the
NodeObservabilityRunby running the following command:$ oc get nodeobservabilityrun nodeobservabilityrun -o yaml | yq '.status.conditions'Example output
conditions: - lastTransitionTime: "2022-07-07T14:57:34Z" message: Ready to start profiling reason: Ready status: "True" type: Ready - lastTransitionTime: "2022-07-07T14:58:10Z" message: Profiling query done reason: Finished status: "True" type: FinishedThe profiling query is complete once the status is
Trueand type isFinished.Retrieve the profiling data from the container’s
/run/node-observabilitypath by running the following bash script:for a in $(oc get nodeobservabilityrun nodeobservabilityrun -o yaml | yq .status.agents[].name); do echo "agent ${a}" mkdir -p "/tmp/${a}" for p in $(oc exec "${a}" -c node-observability-agent -- bash -c "ls /run/node-observability/*.pprof"); do f="$(basename ${p})" echo "copying ${f} to /tmp/${a}/${f}" oc exec "${a}" -c node-observability-agent -- cat "${p}" > "/tmp/${a}/${f}" done done
21.4. Node Observability Operator scripting
Scripting allows you to run pre-configured bash scripts, using the current Node Observability Operator and Node Observability Agent.
These scripts monitor key metrics like CPU load, memory pressure, and worker node issues. They also collect sar reports and custom performance metrics.
21.4.1. Creating the Node Observability custom resource for scripting
You must create and run the NodeObservability custom resource (CR) before you run the scripting. When you run the NodeObservability CR, it enables the agent in scripting mode on the compute nodes matching the nodeSelector label.
Prerequisites
- You have installed the Node Observability Operator.
-
You have installed the OpenShift CLI (
oc). -
You have access to the cluster with
cluster-adminprivileges.
Procedure
Log in to the OpenShift Container Platform cluster by running the following command:
$ oc login -u kubeadmin https://<host_name>:6443Switch to the
node-observability-operatornamespace by running the following command:$ oc project node-observability-operatorCreate a file named
nodeobservability.yamlthat contains the following content:apiVersion: nodeobservability.olm.openshift.io/v1alpha2 kind: NodeObservability metadata: name: cluster1 spec: nodeSelector: kubernetes.io/hostname: <node_hostname>2 type: scripting3 Create the
NodeObservabilityCR by running the following command:$ oc apply -f nodeobservability.yamlExample output
nodeobservability.olm.openshift.io/cluster createdReview the status of the
NodeObservabilityCR by running the following command:$ oc get nob/cluster -o yaml | yq '.status.conditions'Example output
conditions: conditions: - lastTransitionTime: "2022-07-05T07:33:54Z" message: 'DaemonSet node-observability-ds ready: true NodeObservabilityScripting ready: true' reason: Ready status: "True" type: ReadyThe
NodeObservabilityCR run is completed when thereasonisReadyandstatusis"True".
21.4.2. Configuring Node Observability Operator scripting
Prerequisites
- You have installed the Node Observability Operator.
-
You have created the
NodeObservabilitycustom resource (CR). -
You have access to the cluster with
cluster-adminprivileges.
Procedure
Create a file named
nodeobservabilityrun-script.yamlthat contains the following content:apiVersion: nodeobservability.olm.openshift.io/v1alpha2 kind: NodeObservabilityRun metadata: name: nodeobservabilityrun-script namespace: node-observability-operator spec: nodeObservabilityRef: name: cluster type: scriptingImportantYou can request only the following scripts:
-
metrics.sh -
network-metrics.sh(usesmonitor.sh)
-
Trigger the scripting by creating the
NodeObservabilityRunresource with the following command:$ oc apply -f nodeobservabilityrun-script.yamlReview the status of the
NodeObservabilityRunscripting by running the following command:$ oc get nodeobservabilityrun nodeobservabilityrun-script -o yaml | yq '.status.conditions'Example output
Status: Agents: Ip: 10.128.2.252 Name: node-observability-agent-n2fpm Port: 8443 Ip: 10.131.0.186 Name: node-observability-agent-wcc8p Port: 8443 Conditions: Conditions: Last Transition Time: 2023-12-19T15:10:51Z Message: Ready to start profiling Reason: Ready Status: True Type: Ready Last Transition Time: 2023-12-19T15:11:01Z Message: Profiling query done Reason: Finished Status: True Type: Finished Finished Timestamp: 2023-12-19T15:11:01Z Start Timestamp: 2023-12-19T15:10:51ZThe scripting is complete once
StatusisTrueandTypeisFinished.Retrieve the scripting data from the root path of the container by running the following bash script:
#!/bin/bash RUN=$(oc get nodeobservabilityrun --no-headers | awk '{print $1}') for a in $(oc get nodeobservabilityruns.nodeobservability.olm.openshift.io/${RUN} -o json | jq .status.agents[].name); do echo "agent ${a}" agent=$(echo ${a} | tr -d "\"\'\`") base_dir=$(oc exec "${agent}" -c node-observability-agent -- bash -c "ls -t | grep node-observability-agent" | head -1) echo "${base_dir}" mkdir -p "/tmp/${agent}" for p in $(oc exec "${agent}" -c node-observability-agent -- bash -c "ls ${base_dir}"); do f="/${base_dir}/${p}" echo "copying ${f} to /tmp/${agent}/${p}" oc exec "${agent}" -c node-observability-agent -- cat ${f} > "/tmp/${agent}/${p}" done done
Legal Notice
Copyright © Red Hat
OpenShift documentation is licensed under the Apache License 2.0 (https://www.apache.org/licenses/LICENSE-2.0).
Modified versions must remove all Red Hat trademarks.
Portions adapted from https://github.com/kubernetes-incubator/service-catalog/ with modifications by Red Hat.
Red Hat, Red Hat Enterprise Linux, the Red Hat logo, the Shadowman logo, JBoss, OpenShift, Fedora, the Infinity logo, and RHCE are trademarks of Red Hat, Inc., registered in the United States and other countries.
Linux® is the registered trademark of Linus Torvalds in the United States and other countries.
Java® is a registered trademark of Oracle and/or its affiliates.
XFS® is a trademark of Silicon Graphics International Corp. or its subsidiaries in the United States and/or other countries.
MySQL® is a registered trademark of MySQL AB in the United States, the European Union and other countries.
Node.js® is an official trademark of the OpenJS Foundation.
The OpenStack® Word Mark and OpenStack logo are either registered trademarks/service marks or trademarks/service marks of the OpenStack Foundation, in the United States and other countries and are used with the OpenStack Foundation’s permission. We are not affiliated with, endorsed or sponsored by the OpenStack Foundation, or the OpenStack community.
All other trademarks are the property of their respective owners.