Configuring automation execution
Learn how to manage, monitor, and use automation controller
Abstract
Preface
This guide describes the administration of automation controller through custom scripts, management jobs, and more. Written for DevOps engineers and administrators, the Configuring automation execution guide assumes a basic understanding of the systems requiring management with automation controllers easy-to-use graphical interface.
Providing feedback on Red Hat documentation
If you have a suggestion to improve this documentation, or find an error, you can contact technical support at https://access.redhat.com to open a request.
Chapter 1. Start, stop, and restart automation controller
Automation controller includes an administrator utility script, automation-controller-service. The script can start, stop, and restart all automation controller services running on the current single automation controller node. The script includes the message queue components and the database if it is an integrated installation.
External databases must be explicitly managed by the administrator. You can find the services script in /usr/bin/automation-controller-service, which can be invoked with the following command:
root@localhost:~$ automation-controller-service restart
In clustered installs, the automation-controller-service restart does not include PostgreSQL as part of the services that are restarted. This is because it exists external to automation controller, and PostgreSQL does not always need to be restarted. Use systemctl restart automation-controller to restart services on clustered environments instead.
You must also restart each cluster node for certain changes to persist as opposed to a single node for a localhost install.
For more information on clustered environments, see the Clustering section.
You can also invoke the services script using distribution-specific service management commands. Distribution packages often provide a similar script, sometimes as an init script, to manage services. For more information, see your distribution-specific service management system.
When running automation controller in a container, do not use the automation-controller-service script. Restart the pod using the container environment instead.
Chapter 2. Automation controller configuration
You can configure some automation controller options by using the Settings menu of the User Interface.
Save applies the changes you make, but it does not exit the edit dialog.
To return to the Settings page, from the navigation panel select Settings or use the breadcrumbs at the top of the current view.
2.1. Configuring system settings
You can use the System menu to define automation controller system settings.
Procedure
- From the navigation panel, select → . The System Settings page is displayed.
- Click .
You can configure the following options:
- Base URL of the service: This setting is used by services such as notifications to render a valid URL to the service.
Proxy IP allowed list: If the service is behind a reverse proxy or load balancer, use this setting to configure the proxy IP addresses from which the service should trust custom
REMOTE_HOST_HEADERSheader values.If this setting is an empty list (the default), the headers specified by
REMOTE_HOST_HEADERSare trusted unconditionally.-
CSRF Trusted Origins List: If the service is behind a reverse proxy or load balancer, use this setting to configure the
schema://addressesfrom which the service should trust Origin header values. - Red Hat customer username: This username is used to send data to Automation Analytics.
- Red Hat customer password: This password is used to send data to Automation Analytics.
- Red Hat or Satellite username: This username is used to send data to Automation Analytics.
- Red Hat or Satellite password: This password is used to send data to Automation Analytics.
- Global default execution environment: The execution environment to be used when one has not been configured for a job template.
Custom virtual environment paths: Paths where automation controller looks for custom virtual environments.
Enter one path per line.
- Last gather date for Automation Analytics: Set the date and time.
Automation Analytics Gather Interval: Interval (in seconds) between data gathering.
If Gather data for Automation Analytics is set to false, this value is ignored.
- Last cleanup date for HostMetrics: Set the date and time.
- Last computing date of HostMetricSummaryMonthly: Set the date and time.
-
Remote Host Headers: HTTP headers and meta keys to search to decide remote hostname or IP. Add additional items to this list, such as
HTTP_X_FORWARDED_FOR, if behind a reverse proxy. For more information, see Configuring proxy support for Red Hat Ansible Automation Platform. - Automation Analytics upload URL: This value has been set manually in a settings file. This setting is used to configure the upload URL for data collection for Automation Analytics.
Defines subscription usage model and shows Host Metrics:
You can select the following options:
- Enable Activity Stream: Set to enable capturing activity for the activity stream.
- Enable Activity Stream for Inventory Sync: Set to enable capturing activity for the activity stream when running inventory sync.
- All Users Visible to Organization Admins: Set to control whether any organization administrator can view all users and teams, even those not associated with their organization.
Organization Admins Can Manage Users and Teams: Set to control whether any organization administrator has the privileges to create and manage users and teams.
You might want to disable this ability if you are using an LDAP or SAML integration.
- Gather data for Automation Analytics: Set to enable the service to gather data on automation and send it to Automation Analytics.
- Click
2.2. Configuring jobs
You can use the Job option to define the operation of Jobs in automation controller.
Procedure
- From the navigation panel, select → .
On the Job Settings page, click .
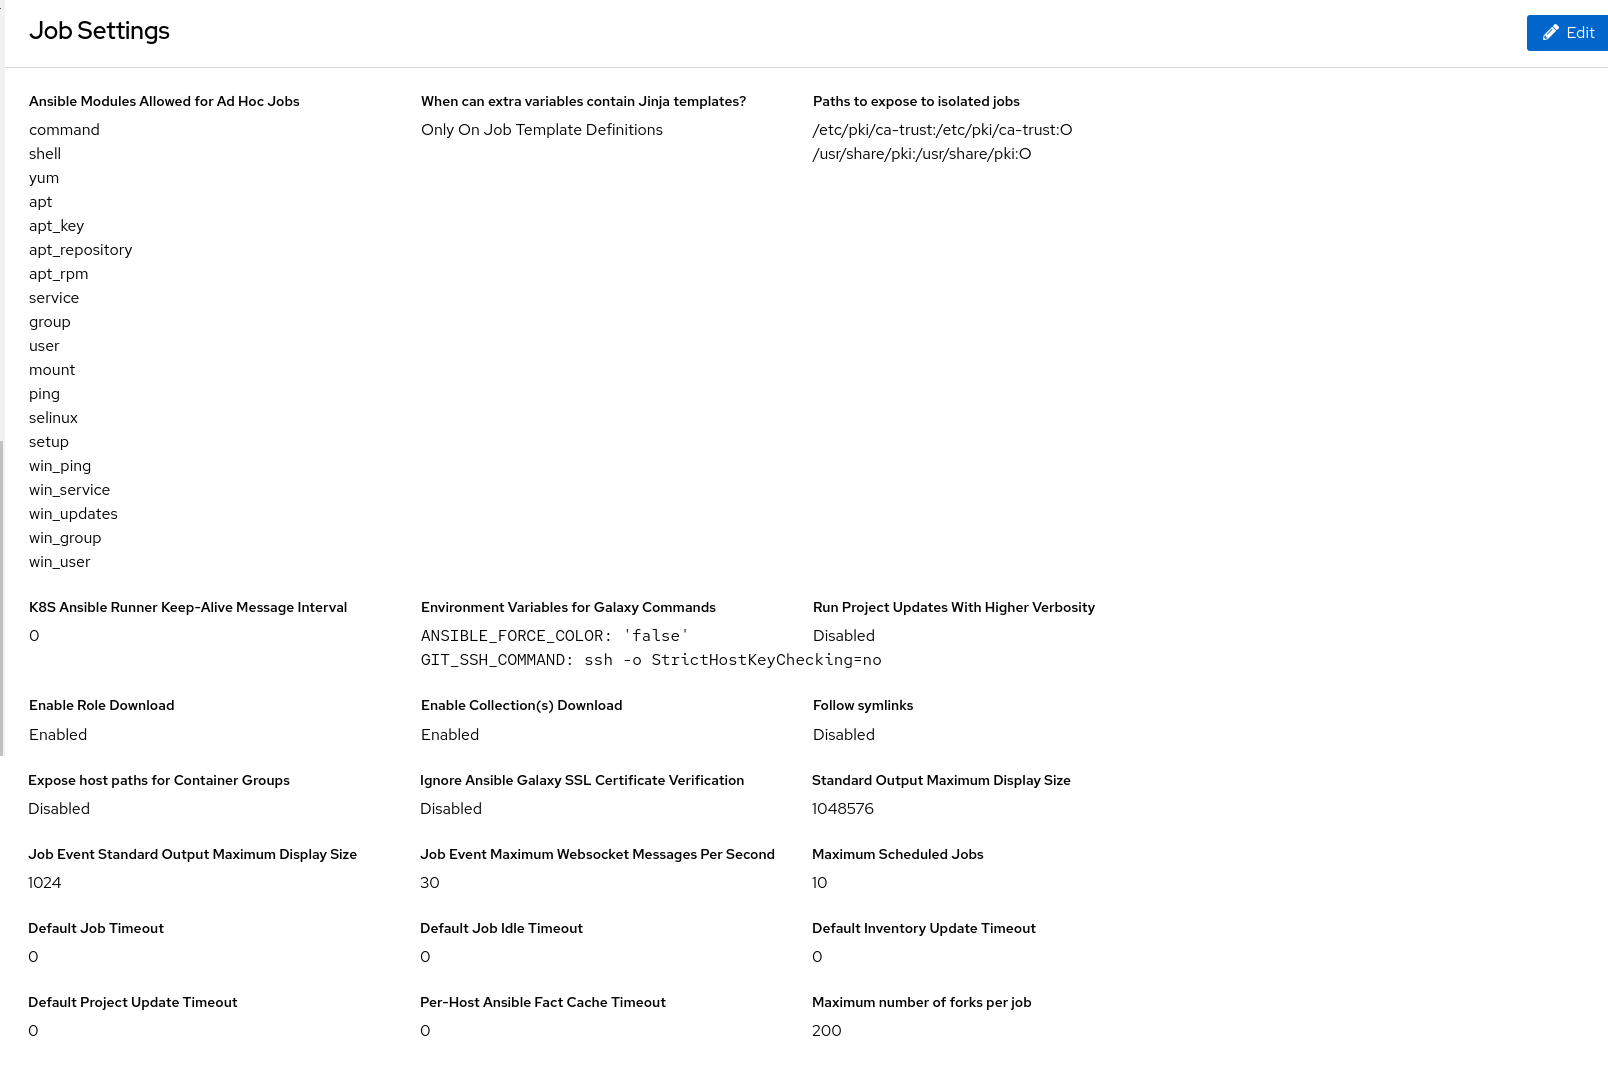
You can configure the following options:
Ansible Modules Allowed For Ad Hoc Jobs: List of modules allowed to be used by ad hoc jobs.
The directory in which the service creates new temporary directories for job execution and isolation (such as credential files).
When can extra variables contain Jinja templates?: Ansible allows variable substitution through the Jinja2 templating language for
--extra-vars.This poses a potential security risk where users with the ability to specify extra vars at job launch time can use Jinja2 templates to run arbitrary Python.
Set this value to either
templateornever.Paths to expose to isolated jobs: List of paths that would otherwise be hidden to expose to isolated jobs.
Enter one path per line.
Volumes are mounted from the execution node to the container.
The supported format is
HOST-DIR[:CONTAINER-DIR[:OPTIONS]].- Extra Environment Variables: Additional environment variables set for playbook runs, inventory updates, project updates, and notification sending.
K8S Ansible Runner Keep-Alive Message Interval: Only applies to jobs running in a Container Group.
If not 0, send a message every specified number of seconds to keep the connection open.
- Environment Variables for Galaxy Commands: Additional environment variables set for invocations of ansible-galaxy within project updates. Useful if you must use a proxy server for ansible-galaxy but not git.
- Standard Output Maximum Display Size: Maximum Size of Standard Output in bytes to display before requiring the output be downloaded.
-
Job Event Standard Output Maximum Display Size: Maximum Size of Standard Output in bytes to display for a single job or ad hoc command event. stdout ends with
…when truncated. Job Event Maximum Websocket Messages Per Second: The maximum number of messages to update the UI live job output with per second.
A value of 0 means no limit.
- Maximum Scheduled Jobs: Maximum number of the same job template that can be waiting to run when launching from a schedule before no more are created.
- Ansible Callback Plugins: List of paths to search for extra callback plugins to be used when running jobs.
Default Job Timeout: If no output is detected from ansible in this number of seconds the execution will be terminated.
Use a value of 0 to indicate that no idle timeout should be imposed.
Enter one path per line.
Default Job Idle Timeout: If no output is detected from ansible in this number of seconds the execution will be terminated.
Use a value of 0 to indicate that no idle timeout should be imposed.
Default Inventory Update Timeout: Maximum time in seconds to allow inventory updates to run.
Use a value of 0 to indicate that no timeout should be imposed.
A timeout set on an individual inventory source will override this.
Default Project Update Timeout: Maximum time in seconds to allow project updates to run.
Use a value of 0 to indicate that no timeout should be imposed.
A timeout set on an individual project will override this.
Per-Host Ansible Fact Cache Timeout: Maximum time, in seconds, that stored Ansible facts are considered valid since the last time they were modified.
Only valid, non-stale, facts are accessible by a playbook.
This does not influence the deletion of
ansible_factsfrom the database.Use a value of 0 to indicate that no timeout should be imposed.
Maximum number of forks per job: Saving a Job Template with more than this number of forks results in an error.
When set to 0, no limit is applied.
- Job execution path: Only available in operator-based installations.
Container Run Options: Only available in operator-based installations.
List of options to pass to Podman run example:
['--network', 'slirp4netns:enable_ipv6=true', '--log-level', 'debug'].You can set the following options:
-
Run Project Updates With Higher Verbosity: Select to add the CLI
-vvvflag to playbook runs ofproject_update.ymlused for project updates -
Enable Role Download: Select to allow roles to be dynamically downloaded from a
requirements.ymlfile for SCM projects. -
Enable Collection(s) Download: Select to allow collections to be dynamically downloaded from a
requirements.ymlfile for SCM projects. Follow symlinks: Select to follow symbolic links when scanning for playbooks.
Be aware that setting this to
Truecan lead to infinite recursion if a link points to a parent directory of itself.Expose host paths for Container Groups: Select to expose paths through hostPath for the Pods created by a Container Group.
HostPath volumes present many security risks, and it is best practice to avoid the use of HostPaths when possible.
Ignore Ansible Galaxy SSL Certificate Verification: If set to
true, certificate validation is not done when installing content from any Galaxy server.Click the tooltip
 icon next to the field that you need additional information about.
For more information about configuring Galaxy settings, see the Ansible Galaxy Support section of Using automation execution.
NoteThe values for all timeouts are in seconds.
- Click to apply the settings.
2.3. Logging and aggregation settings
For information about these settings, see Setting up logging.
2.4. Configuring Automation Analytics
When you imported your license for the first time, you were automatically opted in for the collection of data that powers Automation Analytics, a cloud service that is part of the Ansible Automation Platform subscription.
Procedure
- From the navigation panel, select → . The Subscription page is displayed.
If you have not already set up a subscription, do so now, and ensure that on the next page you have selected Automation Analytics to use analytics data to enhance future releases of Ansible Automation Platform and to provide the Red Hat insights service to subscribers.

- From the navigation panel, select → .
- Click .
- Toggle the Gather data for Automation Analytics switch and enter your Red Hat customer credentials.
You can also configure the following options:
- Red Hat Customer Name: This username is used to send data to Automation Analytics.
- Red Hat Customer Password: This password is used to send data to Automation Analytics.
- Red Hat or Satellite Username: This username is used to send data to Automation Analytics.
- Red Hat or Satellite password: This password is used to send data to Automation Analytics.
- Last gather date for Automation Analytics: Set the date and time
- Automation Analytics Gather Interval: Interval (in seconds) between data gathering.
- Click .
2.5. Additional settings for automation controller
There are additional advanced settings that can affect automation controller behavior that are not available in the automation controller UI.
For traditional virtual machine based deployments, these settings can be provided to automation controller by creating a file in /etc/tower/conf.d/custom.py. When settings are provided to automation controller through file-based settings, the settings file must be present on all control plane nodes. These include all of the hybrid or control type nodes in the automationcontroller group in the installer inventory.
For these settings to be effective, restart the service with automation-controller-service restart on each node with the settings file. If the settings provided in this file are also visible in the automation controller UI, then they are marked as "Read only" in the UI.
Chapter 3. Performance tuning for automation controller
Tune your automation controller to optimize performance and scalability. When planning your workload, ensure that you identify your performance and scaling needs, adjust for any limitations, and monitor your deployment.
Automation controller is a distributed system with multiple components that you can tune, including the following:
- Task system in charge of scheduling jobs
- Control Plane in charge of controlling jobs and processing output
- Execution plane where jobs run
- Web server in charge of serving the API
- Websocket system that serve and broadcast websocket connections and data
- Database used by multiple components
3.1. Capacity planning for deploying automation controller
Capacity planning for automation controller is planning the scale and characteristics of your deployment so that it has the capacity to run the planned workload. Capacity planning includes the following phases:
- Characterizing your workload
- Reviewing the capabilities of different node types
- Planning the deployment based on the requirements of your workload
3.1.1. Characteristics of your workload
Before planning your deployment, establish the workload that you want to support. Consider the following factors to characterize an automation controller workload:
- Managed hosts
- Tasks per hour per host
- Maximum number of concurrent jobs that you want to support
- Maximum number of forks set on jobs. Forks determine the number of hosts that a job acts on concurrently.
- Maximum API requests per second
- Node size that you prefer to deploy (CPU/Memory/Disk)
3.1.2. Types of nodes in automation controller
You can configure four types of nodes in an automation controller deployment:
- Control nodes
- Hybrid nodes
- Execution nodes
- Hop nodes
However, for an operator-based environment, there are no hybrid or control nodes. There are container groups, which make up containers running on the Kubernetes cluster. That comprises the control plane. That control plane is local to the Kubernetes cluster in which Red Hat Ansible Automation Platform is deployed.
3.1.2.1. Benefits of scaling control nodes
Control and hybrid nodes provide control capacity. They provide the ability to start jobs and process their output into the database. Every job is assigned a control node. In the default configuration, each job requires one capacity unit to control. For example, a control node with 100 capacity units can control a maximum of 100 jobs.
Vertically scaling a control node by deploying a larger virtual machine with more resources increases the following capabilities of the control plane:
- The number of jobs that a control node can perform control tasks for, which requires both more CPU and memory.
- The number of job events a control node can process concurrently.
Scaling CPU and memory in the same proportion is recommended, for example, 1 CPU: 4 GB RAM. Even when memory consumption is high, increasing the CPU of an instance can often relieve pressure. The majority of the memory that control nodes consume is from unprocessed events that are stored in a memory-based queue.
Vertically scaling a control node does not automatically increase the number of workers that handle web requests.
An alternative to vertically scaling is horizontally scaling by deploying more control nodes. This allows spreading control tasks across more nodes as well as allowing web traffic to be spread over more nodes, given that you provision a load balancer to spread requests across nodes. Horizontally scaling by deploying more control nodes in many ways can be preferable as it additionally provides for more redundancy and workload isolation in the event that a control node goes down or experiences higher than normal load.
3.1.2.2. Benefits of scaling execution nodes
Execution and hybrid nodes provide execution capacity. The capacity consumed by a job is equal to the number of forks set on the job template or the number of hosts in the inventory, whichever is less, plus one additional capacity unit to account for the main ansible process. For example, a job template with the default forks value of 5 acting on an inventory with 50 hosts consumes 6 capacity units from the execution node it is assigned to.
Vertically scaling an execution node by deploying a larger virtual machine with more resources provides more forks for job execution. This increases the number of concurrent jobs that an instance can run.
In general, scaling CPU alongside memory in the same proportion is recommended. Like control and hybrid nodes, there is a capacity adjustment on each execution node that you can use to align actual use with the estimation of capacity consumption that the automation controller makes. By default, all nodes are set to the top of that range. If actual monitoring data reveals the node to be over-used, decreasing the capacity adjustment can help bring this in line with actual usage.
An alternative to vertically scaling execution nodes is horizontally scaling the execution plane by deploying more virtual machines to be execution nodes. Because horizontally scaling can provide additional isolation of workloads, you can assign different instances to different instance groups. You can then assign these instance groups to organizations, inventories, or job templates. For example, you can configure an instance group that can only be used for running jobs against a certain Inventory. In this scenario, by horizontally scaling the execution plane, you can ensure that lower-priority jobs do not block higher-priority jobs
3.1.2.3. Benefits of scaling hop nodes
Because hop nodes use very low memory and CPU, vertically scaling these nodes does not impact capacity. Monitor the network bandwidth of any hop node that serves as the sole connection between many execution nodes and the control plane. If bandwidth use is saturated, consider changing the network.
Horizontally scaling by adding more hop nodes could provide redundancy in the event that one hop node goes down, which can allow traffic to continue to flow between the control plane and the execution nodes.
3.1.2.4. Ratio of control to execution capacity
Assuming default configuration, the maximum recommended ratio of control capacity to execution capacity is 1:5 in traditional VM deployments. This ensures that there is enough control capacity to run jobs on all the execution capacity available and process the output. Any less control capacity in relation to the execution capacity, and it would not be able to launch enough jobs to use the execution capacity.
There are cases in which you might want to modify this ratio closer to 1:1. For example, in cases where a job produces a high level of job events, reducing the amount of execution capacity in relation to the control capacity helps relieve pressure on the control nodes to process that output.
3.2. Example capacity planning exercise
After you have determined the workload capacity that you want to support, you must plan your deployment based on the requirements of the workload. To help you with your deployment, review the following planning exercise.
For this example, the cluster must support the following capacity:
- 300 managed hosts
- 1,000 tasks per hour per host or 16 tasks per minute per host
- 10 concurrent jobs
- Forks set to 5 on playbooks. This is the default.
- Average event size is 1 Mb
The virtual machines have 4 CPU and 16 GB RAM, and disks that have 3000 IOPs.
3.2.1. Example workload requirements
For this example capacity planning exercise, use the following workload requirements:
Execution capacity
To run the 10 concurrent jobs requires at least 60 units of execution capacity.
- You calculate this by using the following equation: (10 jobs * 5 forks) + (10 jobs * 1 base task impact of a job) = 60 execution capacity
Control capacity
- To control 10 concurrent jobs requires at least 10 units of control capacity.
To calculate the number of events per hour that you need to support 300 managed hosts and 1,000 tasks per hour per host, use the following equation:
- 1000 tasks * 300 managed hosts per hour = 300,000 events per hour at minimum.
- You must run the job to see exactly how many events it produces, because this is dependent on the specific task and verbosity. For example, a debug task printing “Hello World” produces 6 job events with the verbosity of 1 on one host. With a verbosity of 3, it produces 34 job events on one host. Therefore, you must estimate that the task produces at least 6 events. This would produce closer to 3,000,000 events per hour, or approximately 833 events per second.
Determining quantity of execution and control nodes needed
To determine how many execution and control nodes you need, reference the experimental results in the following table that shows the observed event processing rate of a single control node with 5 execution nodes of equal size (API Capacity column). The default “forks” setting of job templates is 5, so using this default, the maximum number of jobs a control node can dispatch to execution nodes makes 5 execution nodes of equal CPU/RAM use 100% of their capacity, arriving to the previously mentioned 1:5 ratio of control to execution capacity.
| Node | API capacity | Default execution capacity | Default control capacity | Mean event processing rate at 100% capacity usage | Mean events processing rate at 50% capacity usage | Mean event processing rate at 40% capacity usage |
|---|---|---|---|---|---|---|
| 4 CPU at 2.5Ghz, 16 GB RAM control node, a maximum of 3000 IOPs disk | about 10 requests per second | n/a | 137 jobs | 1100 per second | 1400 per second | 1630 per second |
| 4 CPU at 2.5Ghz, 16 GB RAM execution node, a maximum of 3000 IOPs disk | n/a | 137 | n/a | n/a | n/a | n/a |
| 4 CPU at 2.5Ghz, 16 GB RAM database node, a maximum of 3000 IOPs disk | n/a | n/a | n/a | n/a | n/a | n/a |
Because controlling jobs competes with job event processing on the control node, over-provisioning control capacity can reduce processing times. When processing times are high, you can experience a delay between when the job runs and when you can view the output in the API or UI.
For this example, for a workload on 300 managed hosts, executing 1000 tasks per hour per host, 10 concurrent jobs with forks set to 5 on playbooks, and an average event size 1 Mb, use the following procedure:
- Deploy 1 execution node, 1 control node, 1 database node of 4 CPU at 2.5Ghz, 16 GB RAM, and disks that have about 3000 IOPs.
- Keep the default fork setting of 5 on job templates.
- Use the capacity change feature in the instance view of the UI on the control node to reduce the capacity down to 16, the lowest value, to reserve more of the control node’s capacity for processing events.
Additional Resources
- For more information about workloads with high levels of API interaction, see Scaling Automation Controller for API Driven Workloads.
- For more information about managing capacity with instances, see Managing capacity with Instances.
- For more information about operator-based deployments, see Red Hat Ansible Automation Platform Performance Considerations for Operator Based Installations.
3.3. Performance troubleshooting for automation controller
Users experience many request timeouts (504 or 503 errors), or in general high API latency. In the UI, clients face slow login and long wait times for pages to load. What system is the likely culprit?
- If these issues occur only on login, and you use external authentication, the problem is likely with the integration of your external authentication provider and you should seek Red Hat support.
- For other issues with timeouts or high API latency, see Web server tuning.
Long wait times for job output to load.
- Job output streams from the execution node where the ansible-playbook is actually run to the associated control node. Then the callback receiver serializes this data and writes it to the database. Relevant settings to observe and tune can be found in Settings for managing job event processing and PostgreSQL database configuration and maintenance for automation controller.
- In general, to resolve this symptom it is important to observe the CPU and memory use of the control nodes. If CPU or memory use is very high, you can either horizontally scale the control plane by deploying more virtual machines to be control nodes that naturally spreads out work more, or to modify the number of jobs a control node will manage at a time. For more information, see Capacity settings for control and execution nodes for more information.
What can you do to increase the number of jobs that automation controller can run concurrently?
Factors that cause jobs to remain in “pending” state are:
- Waiting for “dependencies” to finish: this includes project updates and inventory updates when “update on launch” behavior is enabled.
- The “allow_simultaneous” setting of the job template: if multiple jobs of the same job template are in “pending” status, check the “allow_simultaneous” setting of the job template (“Concurrent Jobs” checkbox in the UI). If this is not enabled, only one job from a job template can run at a time.
- The “forks” value of your job template: the default value is 5. The amount of capacity required to run the job is roughly the forks value (some small overhead is accounted for). If the forks value is set to a very large number, this will limit what nodes will be able to run it.
- Lack of either control or execution capacity: see “awx_instance_remaining_capacity” metric from the application metrics available on /api/v2/metrics. See Metrics for monitoring automation controller application for more information about how to check metrics. See Capacity planning for deploying automation controller for information about how to plan your deployment to handle the number of jobs you are interested in.
Jobs run more slowly on automation controller than on a local machine.
- Some additional overhead is expected, because automation controller might be dispatching your job to a separate node. In this case, automation controller is starting a container and running ansible-playbook there, serializing all output and writing it to a database.
- Project update on launch and inventory update on launch behavior can cause additional delays at job start time.
- Size of projects can impact how long it takes to start the job, as the project is updated on the control node and transferred to the execution node. Internal cluster routing can impact network performance. For more information, see Internal cluster routing.
- Container pull settings can impact job start time. The execution environment is a container that is used to run jobs within it. Container pull settings can be set to “Always”, “Never” or “If not present”. If the container is always pulled, this can cause delays.
- Ensure that all cluster nodes, including execution, control, and the database, have been deployed in instances with storage rated to the minimum required IOPS, because the manner in which automation controller runs ansible and caches event data implicates significant disk I/O. For more information, see Red Hat Ansible Automation Platform system requirements.
Database storage does not stop growing.
- Automation controller has a management job titled “Cleanup Job Details”. By default, it is set to keep 120 days of data and to run once a week. To reduce the amount of data in the database, you can shorten the retention time. For more information, see Removing old activity stream data.
- Running the cleanup job deletes the data in the database. However, the database must at some point perform its vacuuming operation which reclaims storage. See PostgreSQL database configuration and maintenance for automation controller for more information about database vacuuming.
3.4. Metrics to monitor automation controller
Monitor your automation controller hosts at the system and application levels.
System level monitoring includes the following information:
- Disk I/O
- RAM use
- CPU use
- Network traffic
Application level metrics provide data that the application knows about the system. This data includes the following information:
- How many jobs are running in a given instance
- Capacity information about instances in the cluster
- How many inventories are present
- How many hosts are in those inventories
Using system and application metrics can help you identify what was happening in the application when a service degradation occurred. Information about automation controller’s performance over time helps when diagnosing problems or doing capacity planning for future growth.
3.4.1. Metrics for monitoring automation controller application
For application level monitoring, automation controller provides Prometheus-style metrics on an API endpoint /api/v2/metrics. Use these metrics to monitor aggregate data about job status and subsystem performance, such as for job output processing or job scheduling.
The metrics endpoint includes descriptions of each metric. Metrics of particular interest for performance include:
awx_status_total- Current total of jobs in each status. Helps correlate other events to activity in system.
- Can monitor upticks in errored or failed jobs.
awx_instance_remaining_capacity
- Amount of capacity remaining for running additional jobs.
callback_receiver_event_processing_avg_seconds- colloquially called “job events lag”.
- Running average of the lag time between when a task occurred in ansible and when the user is able to see it. This indicates how far behind the callback receiver is in processing events. When this number is very high, users can consider scaling up the control plane or using the capacity adjustment feature to reduce the number of jobs a control node controls.
callback_receiver_events_insert_db- Counter of events that have been inserted by a node. Can be used to calculate the job event insertion rate over a given time period.
callback_receiver_events_queue_size_redis- Indicator of how far behind callback receiver is in processing events. If too high, Redis can cause the control node to run out of memory (OOM).
3.4.2. System level monitoring
Monitoring the CPU and memory use of your cluster hosts is important because capacity management for instances does not introspect into the actual resource usage of hosts. The resource impact of automation jobs depends on what the playbooks are doing. For example, many cloud or networking modules do most of the processing on the execution node, which runs the Ansible Playbook. The impact on the automation controller is very different than if you were running a native module like “yum” where the work is performed on the target hosts where the execution node spends much of the time during this task waiting on results.
If CPU or memory usage is very high, consider lowering the capacity adjustment (available on the instance detail page) on affected instances in the automation controller. This limits how many jobs are run on or controlled by this instance.
Monitor the disk I/O and use of your system. The manner in which an automation controller node runs Ansible and caches output on the file system, and eventually saves it in the database, creates high levels of disk reads and writes. Identifying poor disk performance early can help prevent poor user experience and system degradation.
Additional resources
- For more information about configuring monitoring, see Metrics.
- Additional insights into automation usage are available when you enable data collection for automation analytics. For more information, see Automation analytics and Red Hat Insights for Red Hat Ansible Automation Platform.
3.5. PostgreSQL database configuration and maintenance for automation controller
To improve the performance of automation controller, you can configure the following configuration parameters in the database:
Maintenance
The VACUUM and ANALYZE tasks are important maintenance activities that can impact performance. In normal PostgreSQL operation, tuples that are deleted or obsoleted by an update are not physically removed from their table; they remain present until a VACUUM is done. Therefore it’s necessary to do VACUUM periodically, especially on frequently-updated tables. ANALYZE collects statistics about the contents of tables in the database, and stores the results in the pg_statistic system catalog. Subsequently, the query planner uses these statistics to help determine the most efficient execution plans for queries. The autovacuuming PostgreSQL configuration parameter automates the execution of VACUUM and ANALYZE commands. Setting autovacuuming to true is a good practice. However, autovacuuming will not occur if there is never any idle time on the database. If it is observed that autovacuuming is not sufficiently cleaning up space on the database disk, then scheduling specific vacuum tasks during specific maintenance windows can be a solution.
Configuration parameters
To improve the performance of the PostgreSQL server, configure the following Grand Unified Configuration (GUC) parameters that manage database memory. You can find these parameters inside the $PDATA directory in the postgresql.conf file, which manages the configurations of the database server.
-
shared_buffers: determines how much memory is dedicated to the server for caching data. The default value for this parameter is 128 MB. When you modify this value, you must set it between 15% and 25% of the machine’s total RAM.
You must restart the database server after changing the value for shared_buffers.
work_mem: provides the amount of memory to be used by internal sort operations and hash tables before disk-swapping. Sort operations are used for order by, distinct, and merge join operations. Hash tables are used in hash joins and hash-based aggregation. The default value for this parameter is 4 MB. Setting the correct value of thework_memparameter improves the speed of a search by reducing disk-swapping.-
Use the following formula to calculate the optimal value of the
work_memparameter for the database server:
-
Use the following formula to calculate the optimal value of the
Total RAM * 0.25 / max_connections
Setting a large work_mem can cause the PostgreSQL server to go out of memory (OOM) if there are too many open connections to the database.
-
max_connections: specifies the maximum number of concurrent connections to the database server. -
maintenance_work_mem: provides the maximum amount of memory to be used by maintenance operations, such as vacuum, create index, and alter table add foreign key operations. The default value for this parameter is 64 MB. Use the following equation to calculate a value for this parameter:
Total RAM * 0.05
Set maintenance_work_mem higher than work_mem to improve performance for vacuuming.
Additional resources
For more information on autovacuuming settings, see Automatic Vacuuming.
3.6. Automation controller tuning
You can configure many automation controller settings by using the automation controller UI, API, and file based settings including:
- Live events in the automation controller UI
- Job event processing
- Control and execution node capacity
- Instance group and container group capacity
- Task management (job scheduling)
- Internal cluster routing
- Web server tuning
3.6.1. Managing live events in the automation controller UI
Events are sent to any node where there is a UI client subscribed to a job. This task is expensive, and becomes more expensive as the number of events that the cluster is producing increases and the number of control nodes increases, because all events are broadcast to all nodes regardless of how many clients are subscribed to particular jobs.
To reduce the overhead of displaying live events in the UI, administrators can choose to either:
- Disable live streaming events.
- Reduce the number of events shown per second or before truncating or hiding events in the UI.
When you disable live streaming of events, they are only loaded on hard refresh to a job’s output detail page. When you reduce the number of events shown per second, this limits the overhead of showing live events, but still provides live updates in the UI without a hard refresh.
3.6.1.1. Disabling live streaming events
Procedure
Disable live streaming events by using one of the following methods:
-
In the API, set
UI_LIVE_UPDATES_ENABLEDto False. - Navigate to your automation controller. Open the Miscellaneous System Settings window. Set the Enable Activity Stream toggle to Off.
-
In the API, set
3.6.1.2. Settings to modify rate and size of events
If you cannot disable live streaming of events because of their size, reduce the number of events that are displayed in the UI. You can use the following settings to manage how many events are displayed:
Settings available for editing in the UI or API:
-
EVENT_STDOUT_MAX_BYTES_DISPLAY: Maximum amount ofstdoutto display (as measured in bytes). This truncates the size displayed in the UI. -
MAX_WEBSOCKET_EVENT_RATE: Number of events to send to clients per second.
Settings available by using file based settings:
-
MAX_UI_JOB_EVENTS: Number of events to display. This setting hides the rest of the events in the list. -
MAX_EVENT_RES_DATA: The maximum size of the ansible callback event’s "res" data structure. The "res" is the full "result" of the module. When the maximum size of ansible callback events is reached, then the remaining output will be truncated. Default value is 700000 bytes. -
LOCAL_STDOUT_EXPIRE_TIME: The amount of time before astdoutfile is expired and removed locally.
3.6.2. Settings for managing job event processing
The callback receiver processes all the output of jobs and writes this output as job events to the automation controller database. The callback receiver has a pool of workers that processes events in batches. The number of workers automatically increases with the number of CPU available on an instance.
Administrators can override the number of callback receiver workers with the setting JOB_EVENT_WORKERS. Do not set more than 1 worker per CPU, and there must be at least 1 worker. Greater values have more workers available to clear the Redis queue as events stream to the automation controller, but can compete with other processes such as the web server for CPU seconds, uses more database connections (1 per worker), and can reduce the batch size of events each worker commits.
Each worker builds up a buffer of events to write in a batch. The default amount of time to wait before writing a batch is 1 second. This is controlled by the JOB_EVENT_BUFFER_SECONDS setting. Increasing the amount of time the worker waits between batches can result in larger batch sizes.
3.6.3. Capacity settings for control and execution nodes
The following settings impact capacity calculations on the cluster. Set them to the same value on all control nodes by using the following file-based settings.
-
AWX_CONTROL_NODE_TASK_IMPACT: Sets the impact of controlling jobs. You can use it when your control plane exceeds desired CPU or memory usage to control the number of jobs that your control plane can run at the same time. -
SYSTEM_TASK_FORKS_CPUandSYSTEM_TASK_FORKS_MEM: Influence how many resources are estimated to be consumed by each fork of Ansible. By default, 1 fork of Ansible is estimated to use 0.25 of a CPU and 100 Mb of memory.
3.6.4. Capacity settings for instance group and container group
Use the max_concurrent_jobs and max_forks settings available on instance groups to limit how many jobs and forks can be consumed across an instance group or container group.
-
To calculate the
max_concurrent_jobsyou need on a container group consider thepod_specsetting for that container group. In thepod_spec, you can see the resource requests and limits for the automation job pod. Use the following equation to calculate the maximum concurrent jobs that you need:
((number of worker nodes in kubernetes cluster) * (CPU available on each worker)) / (CPU request on pod_spec) = maximum number of concurrent jobs
For example, if your
pod_specindicates that a pod will request 250 mcpu Kubernetes cluster has 1 worker node with 2 CPU, the maximum number of jobs that you need to start with is 8.-
You can also consider the memory consumption of the forks in the jobs. Calculate the appropriate setting of
max_forkswith the following equation:
-
You can also consider the memory consumption of the forks in the jobs. Calculate the appropriate setting of
((number of worker nodes in kubernetes cluster) * (memory available on each worker)) / (memory request on pod_spec) = maximum number of forks
For example, given a single worker node with 8 Gb of Memory, we determine that the
max forkswe want to run is 81. This way, either 39 jobs with 1 fork can run (task impact is always forks + 1), or 2 jobs with forks set to 39 can run.-
You might have other business requirements that motivate using
max_forksormax_concurrent_jobsto limit the number of jobs launched in a container group.
-
You might have other business requirements that motivate using
3.6.5. Settings for scheduling jobs
The task manager periodically collects tasks that need to be scheduled and determines what instances have capacity and are eligible for running them. The task manager has the following workflow:
- Find and assign the control and execution instances.
- Update the job’s status to waiting.
-
Message the control node through
pg_notifyfor the dispatcher to pick up the task and start running it.
If the scheduling task is not completed within TASK_MANAGER_TIMEOUT seconds (default 300 seconds), the task is terminated early. Timeout issues generally arise when there are thousands of pending jobs.
One way the task manager limits how much work it can do in a single run is the START_TASK_LIMIT setting. This limits how many jobs it can start in a single run. The default is 100 jobs. If more jobs are pending, a new scheduler task is scheduled to run immediately after. Users who are willing to have potentially longer latency between when a job is launched and when it starts, to have greater overall throughput, can consider increasing the START_TASK_LIMIT. To see how long individual runs of the task manager take, use the Prometheus metric task_manager__schedule_seconds, available in /api/v2/metrics.
Jobs elected to begin running by the task manager do not do so until the task manager process exits and commits its changes. The TASK_MANAGER_TIMEOUT setting determines how long a single run of the task manager will run for before committing its changes. When the task manager reaches its timeout, it attempts to commit any progress it made. The task is not actually forced to exit until after a grace period (determined by TASK_MANAGER_TIMEOUT_GRACE_PERIOD) has passed.
3.6.6. Internal Cluster Routing
Automation controller cluster hosts communicate across the network within the cluster. In the inventory file for the traditional VM installer, you can indicate multiple routes to the cluster nodes that are used in different ways:
Example:
[automationcontroller]
controller1 ansible_user=ec2-user ansible_host=10.10.12.11 node_type=hybrid routable_hostname=somehost.somecompany.org
-
controller1is the inventory hostname for the automation controller host. The inventory hostname is what is shown as the instance hostname in the application. This can be useful when preparing for disaster recovery scenarios where you want to use the backup/restore method to restore the cluster to a new set of hosts that have different IP addresses. In this case you can have entries in/etc/hoststhat map these inventory hostnames to IP addresses, and you can use internal IP addresses to mitigate any DNS issues when it comes to resolving public DNS names. -
ansible_host=10.10.12.11indicates how the installer reaches the host, which in this case is an internal IP address. This is not used outside of the installer. -
routable_hostname=somehost.somecompany.orgindicates the hostname that is resolvable for the peers that connect to this node on the receptor mesh. Since it may cross multiple networks, we are using a hostname that will map to an IP address resolvable for the receptor peers.
3.6.7. Web server tuning
Control and Hybrid nodes each serve the UI and API of automation controller. WSGI traffic is served by the uwsgi web server on a local socket. ASGI traffic is served by Daphne. NGINX listens on port 443 and proxies traffic as needed.
To scale automation controller’s web service, follow these best practices:
- Deploy multiple control nodes and use a load balancer to spread web requests over multiple servers.
- Set max connections per automation controller to 100.
To optimize automation controller’s web service on the client side, follow these guidelines:
- Direct user to use dynamic inventory sources instead of individually creating inventory hosts by using the API.
- Use webhook notifications instead of polling for job status.
- Use the bulk APIs for host creation and job launching to batch requests.
- Use token authentication. For automation clients that must make many requests very quickly, using tokens is a best practice, because depending on the type of user, there may be additional overhead when using basic authentication.
Additional resources
- For more information on workloads with high levels of API interaction, see Scaling Automation Controller for API Driven Workloads.
- For more information on bulk API, see Bulk API in Automation Controller.
- For more information on how to generate and use tokens, see Token-Based Authentication.
Chapter 4. Management Jobs
Management Jobs assist in the cleaning of old data from automation controller, including system tracking information, tokens, job histories, and activity streams. You can use this if you have specific retention policies or need to decrease the storage used by your automation controller database.
From the navigation panel, select → → .
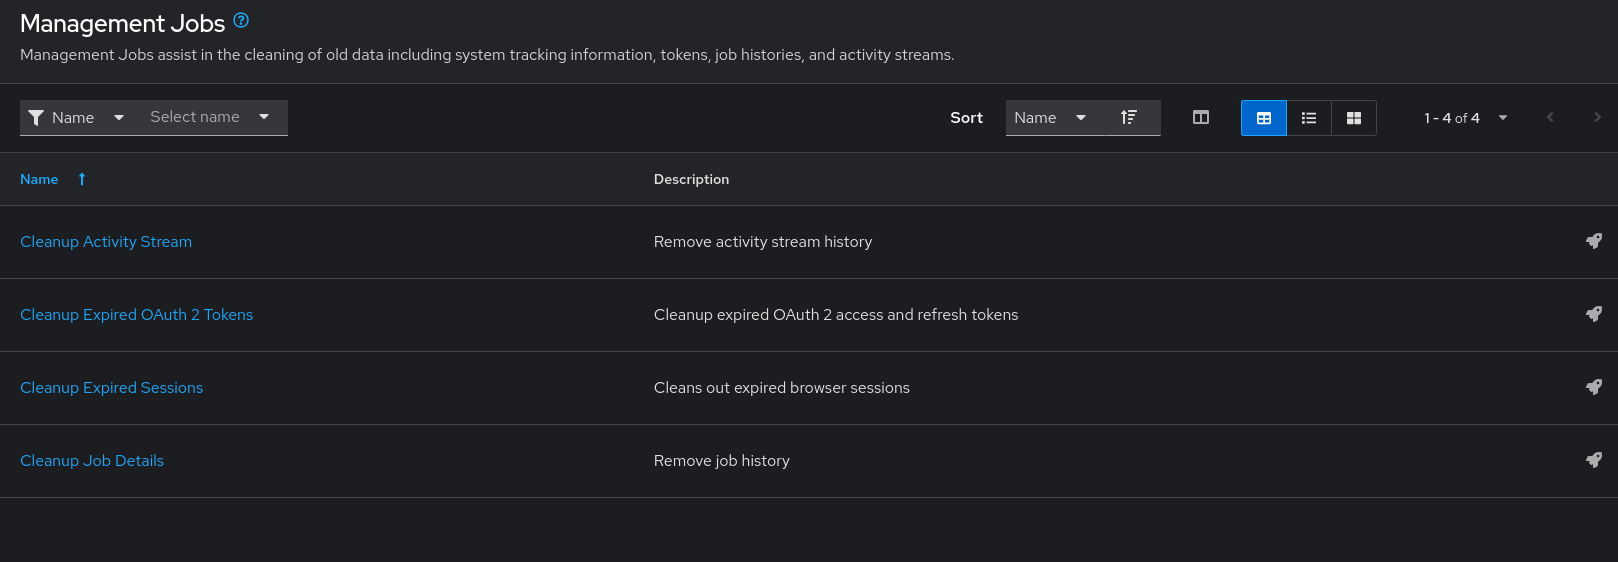
The following job types are available for you to schedule and launch:
- Cleanup Activity Stream: Remove activity stream history older than a specified number of days
- Cleanup Expired OAuth 2 Tokens: Remove expired OAuth 2 access tokens and refresh tokens
- Cleanup Expired Sessions: Remove expired browser sessions from the database
- Cleanup Job Details: Remove job history older than a specified number of days
4.1. Removing old activity stream data
To remove older activity stream data, click the launch
![]() icon beside Cleanup Activity Stream.
icon beside Cleanup Activity Stream.
Enter the number of days of data you want to save and click .
4.1.1. Scheduling deletion
Use the following procedure to review or set a schedule for purging data marked for deletion:
Procedure
For a particular cleanup job, click the Schedules tab.
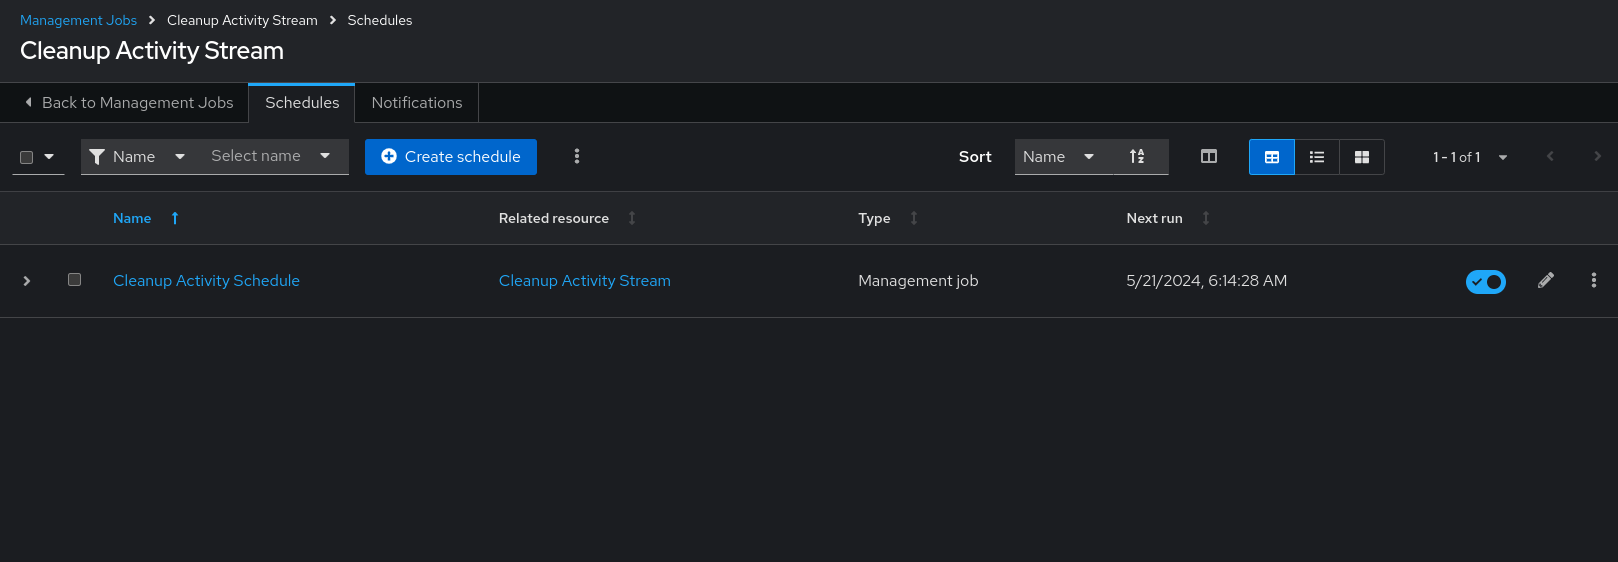
- Click the name of the job, Cleanup Activity Schedule in this example, to review the schedule settings.
Click to change them. You can also click to create a new schedule for this management job.
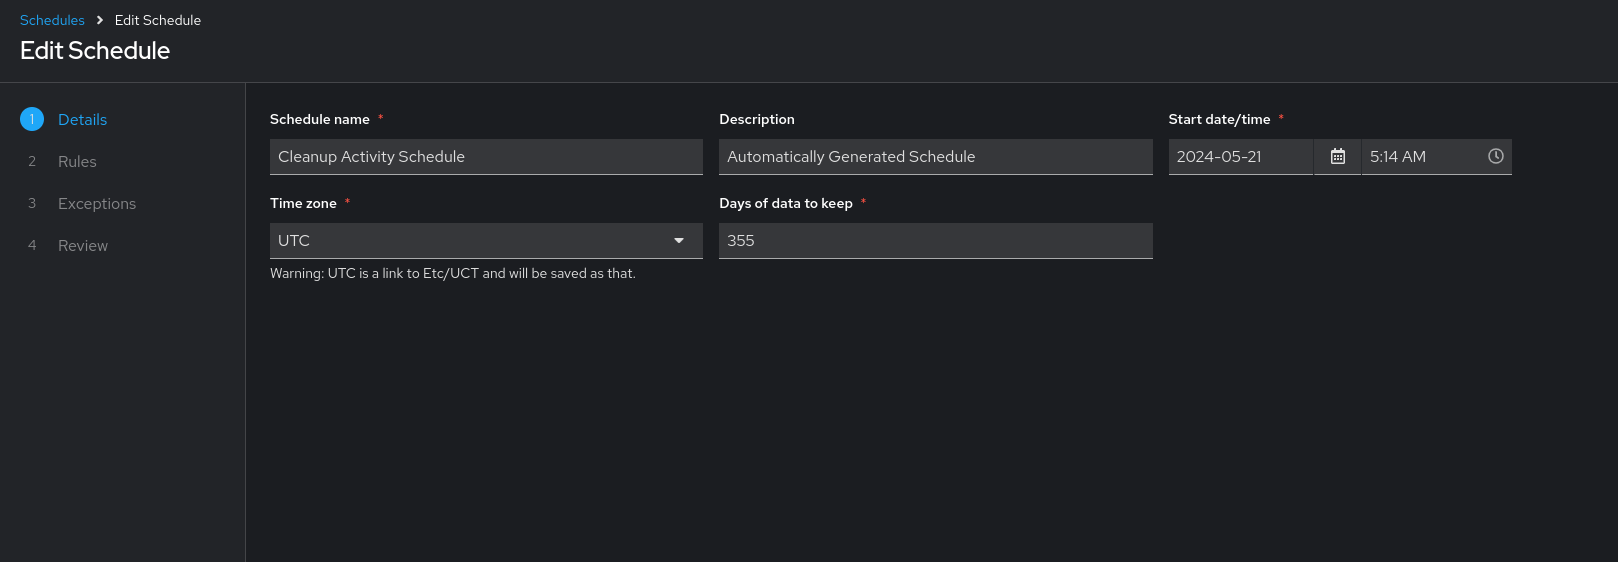
Enter the appropriate details into the following fields and click Next:
- Schedule name required
- Start date/time required
- Time zone the entered Start Time should be in this time zone.
- Repeat frequency the appropriate options display as the update frequency is modified including data you do not want to include by specifying exceptions.
- Days of data to keep required - specify how much data you want to retain.
The Details tab displays a description of the schedule and a list of the scheduled occurrences in the selected Local Time Zone.
Jobs are scheduled in UTC. Repeating jobs that run at a specific time of day can move relative to a local time zone when Daylight Saving Time shifts occur.
4.1.2. Setting notifications
Use the following procedure to review or set notifications associated with a management job:
Procedure
- For a particular cleanup job, select the Notifications tab.
If none exist, see Creating a notification template in Using automation execution.
4.2. Cleanup Expired OAuth2 Tokens
To remove expired OAuth2 tokens, click the launch
![]() icon next to Cleanup Expired OAuth2 Tokens.
icon next to Cleanup Expired OAuth2 Tokens.
You can review or set a schedule for cleaning up expired OAuth2 tokens by performing the same procedure described for activity stream management jobs.
For more information, see Scheduling deletion.
You can also set or review notifications associated with this management job the same way as described in setting notifications for activity stream management jobs.
For more information, see Notifications in Using automation execution.
4.2.1. Cleanup Expired Sessions
To remove expired sessions, click the launch
![]() icon beside Cleanup Expired Sessions.
icon beside Cleanup Expired Sessions.
You can review or set a schedule for cleaning up expired sessions by performing the same procedure described for activity stream management jobs. For more information, see Scheduling deletion.
You can also set or review notifications associated with this management job the same way as described in Notifications for activity stream management jobs.
For more information, see Notifications in Using automation execution.
4.2.2. Removing Old Job History
To remove job history older than a specified number of days, click the launch
![]() icon beside Cleanup Job Details.
icon beside Cleanup Job Details.
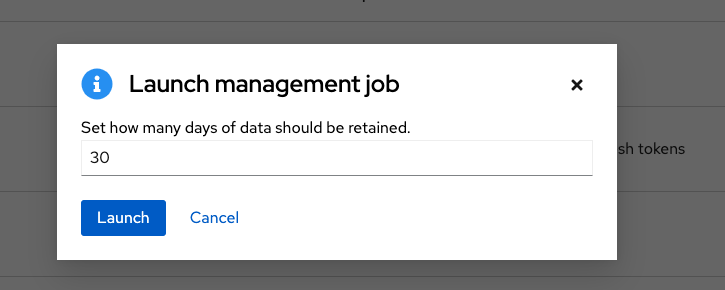
Enter the number of days of data you want to save and click .
The initial job run for an automation controller resource, such as Projects, or Job Templates, are excluded from Cleanup Job Details, regardless of retention value.
You can review or set a schedule for cleaning up old job history by performing the same procedure described for activity stream management jobs.
For more information, see Scheduling deletion.
You can also set or review notifications associated with this management job in the same way as described in Notifications for activity stream management jobs, or for more information, see Notifications in Using automation execution.
Chapter 5. Inventory File Importing
With automation controller you can select an inventory file from source control, rather than creating one from scratch. The files are non-editable, and as inventories are updated at the source, the inventories within the projects are also updated accordingly, including the group_vars and host_vars files or directory associated with them. SCM types can consume both inventory files and scripts. Both inventory files and custom inventory types use scripts.
Imported hosts have a description of imported by default. This can be overridden by setting the _awx_description variable on a given host. For example, if importing from a sourced .ini file, you can add the following host variables:
[main]
127.0.0.1 _awx_description="my host 1"
127.0.0.2 _awx_description="my host 2"
Similarly, group descriptions also default to imported, but can also be overridden by _awx_description.
To use old inventory scripts in source control, see Export old inventory scripts in Using automation execution.
5.1. Source control management Inventory Source Fields
The source fields used are:
-
source_project: the project to use. -
source_path: the relative path inside the project indicating a directory or a file. If left blank, "" is still a relative path indicating the root directory of the project. -
source_vars: if set on a "file" type inventory source then they are passed to the environment variables when running.
Additionally:
- An update of the project automatically triggers an inventory update where it is used.
- An update of the project is scheduled immediately after creation of the inventory source.
- Neither inventory nor project updates are blocked while a related job is running.
-
In cases where you have a large project (around 10 GB), disk space on
/tmpcan be an issue.
You can specify a location manually in the automation controller UI from the Add source page of an inventory. Refer to Adding a source for instructions on creating an inventory source.
When you update a project, refresh the listing to use the latest source control management (SCM) information. If no inventory sources use a project as an SCM inventory source, then the inventory listing might not be refreshed on update.
For inventories with SCM sources, the job Details page for inventory updates displays a status indicator for the project update and the name of the project.
The status indicator links to the project update job.
The project name links to the project.
You can perform an inventory update while a related job is running.
5.1.1. Supported File Syntax
Automation controller uses the ansible-inventory module from Ansible to process inventory files, and supports all valid inventory syntax that automation controller requires.
Chapter 6. Clustering
Clustering is sharing load between hosts. Each instance must be able to act as an entry point for UI and API access. This must enable the automation controller administrators to use load balancers in front of as many instances as they want and keep good data visibility.
Load balancing is optional, and it is entirely possible to have ingress on one or all instances as needed.
Each instance must be able to join the automation controller cluster and expand its ability to run jobs. This is a simple system where jobs can run anywhere rather than be directed on where to run. Also, you can group clustered instances into different pools or queues, called Instance groups as described in Using automation execution.
Ansible Automation Platform supports container-based clusters by using Kubernetes, meaning you can install new automation controller instances on this platform without any variation or diversion in functionality. You can create instance groups to point to a Kubernetes container. For more information, see the Container and instance groups section in Using automation execution.
Supported operating systems
The following operating systems are supported for establishing a clustered environment:
- Red Hat Enterprise Linux 8 or later
Isolated instances are not supported in conjunction with running automation controller in OpenShift.
6.1. Setup considerations
Learn about the initial setup of clusters. To upgrade an existing cluster, see Upgrade Planning in the Ansible Automation Platform Upgrade and Migration Guide.
Note the following important considerations in the new clustering environment:
- PostgreSQL is a standalone instance and is not clustered. Automation controller does not manage replica configuration or database failover (if the user configures standby replicas).
- When you start a cluster, the database node must be a standalone server, and PostgreSQL must not be installed on one of the automation controller nodes.
-
PgBouncer is not recommended for connection pooling with automation controller. Automation controller relies on
pg_notifyfor sending messages across various components, and therefore,PgBouncercannot readily be used in transaction pooling mode. - All instances must be reachable from all other instances and they must be able to reach the database. It is also important for the hosts to have a stable address or hostname (depending on how the automation controller host is configured).
- All instances must be geographically collocated, with reliable low-latency connections between instances.
-
To upgrade to a clustered environment, your primary instance must be part of the
defaultgroup in the inventory and it needs to be the first host listed in thedefaultgroup. - Manual projects must be manually synced to all instances by the customer, and updated on all instances at once.
-
The
inventoryfile for platform deployments should be saved or persisted. If new instances are to be provisioned, the passwords, configuration options, and host names, must be made available to installation program.
6.2. Install and configure
Provisioning new instances for a VM-based install involves updating the inventory file and re-running the setup playbook. It is important that the inventory file has all passwords and information used when installing the cluster or other instances might be reconfigured. The inventory file has a single inventory group, automationcontroller.
All instances are responsible for various housekeeping tasks related to task scheduling, such as determining where jobs are supposed to be launched and processing playbook events, as well as periodic cleanup.
[automationcontroller]
hostA
hostB
hostC
[instance_group_east]
hostB
hostC
[instance_group_west]
hostC
hostD
If no groups are selected for a resource, then the automationcontroller group is used, but if any other group is selected, then the automationcontroller group is not used in any way.
The database group remains for specifying an external PostgreSQL. If the database host is provisioned separately, this group must be empty:
[automationcontroller]
hostA
hostB
hostC
[database]
hostDB
When a playbook runs on an individual controller instance in a cluster, the output of that playbook is broadcast to all of the other nodes as part of automation controller’s WebSocket-based streaming output functionality. You must handle this data broadcast by using internal addressing by specifying a private routable address for each node in your inventory:
[automationcontroller]
hostA routable_hostname=10.1.0.2
hostB routable_hostname=10.1.0.3
hostC routable_hostname=10.1.0.4
routable_hostname
For more information about routable_hostname, see General variables in the Red Hat Ansible Automation Platform Installation Guide.
Earlier versions of automation controller used the variable name rabbitmq_host. If you are upgrading from an earlier version of the platform, and you previously specified rabbitmq_host in your inventory, rename rabbitmq_host to routable_hostname before upgrading.
6.2.1. Instances and ports used by automation controller and automation hub
Ports and instances used by automation controller and also required by the on-premise automation hub node are as follows:
- Port 80, 443 (normal automation controller and automation hub ports)
- Port 22 (ssh - ingress only required)
- Port 5432 (database instance - if the database is installed on an external instance, it must be opened to automation controller instances)
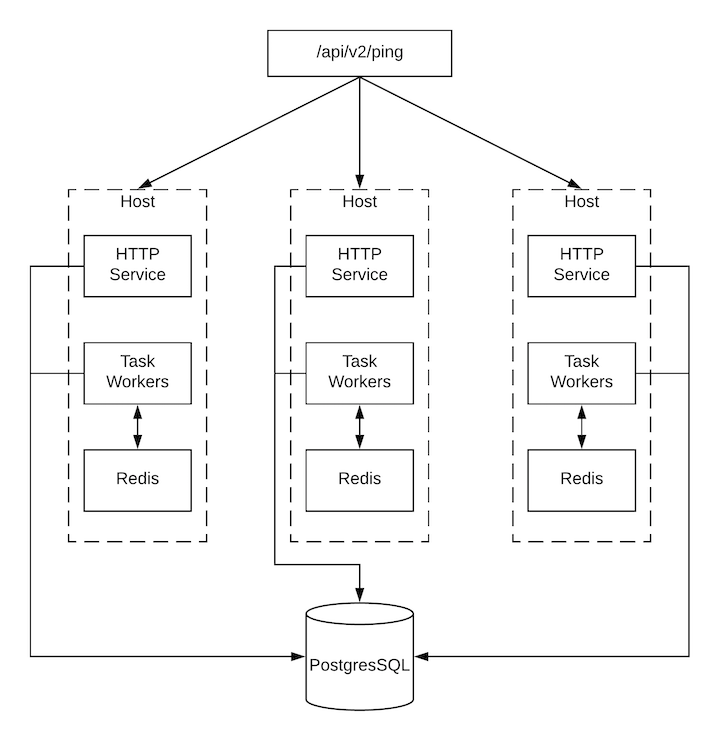
6.3. Status and monitoring by browser API
Automation controller reports as much status as it can using the browser API at /api/v2/ping to validate the health of the cluster. This includes the following:
- The instance servicing the HTTP request
- The timestamps of the last heartbeat of all other instances in the cluster
- Instance Groups and Instance membership in those groups
View more details about Instances and Instance Groups, including running jobs and membership information at /api/v2/instances/ and /api/v2/instance_groups/.
6.4. Instance services and failure behavior
Each automation controller instance is made up of the following different services working collaboratively:
- HTTP services
- This includes the automation controller application itself and external web services.
- Callback receiver
- Receives job events from running Ansible jobs.
- Dispatcher
- The worker queue that processes and runs all jobs.
- Redis
- This key value store is used as a queue for event data propagated from ansible-playbook to the application.
- Rsyslog
- The log processing service used to deliver logs to various external logging services.
Automation controller is configured so that if any of these services or their components fail, then all services are restarted. If these fail often in a short span of time, then the entire instance is placed offline in an automated fashion to allow remediation without causing unexpected behavior.
For backing up and restoring a clustered environment, see the Backup and restore clustered environments section.
6.5. Job runtime behavior
The way jobs are run and reported to a normal user of automation controller does not change. On the system side, note the following differences:
When a job is submitted from the API interface it is pushed into the dispatcher queue. Each automation controller instance connects to and receives jobs from that queue using a scheduling algorithm. Any instance in the cluster is just as likely to receive the work and execute the task. If an instance fails while executing jobs, then the work is marked as permanently failed.
- Project updates run successfully on any instance that could potentially run a job. Projects synchronize themselves to the correct version on the instance immediately before running the job. If the required revision is already locally checked out and Galaxy or Collections updates are not required, then a sync cannot be performed.
-
When the synchronization happens, it is recorded in the database as a project update with a
launch_type = syncandjob_type = run. Project syncs do not change the status or version of the project; instead, they update the source tree only on the instance where they run. -
If updates are required from Galaxy or Collections, a sync is performed that downloads the required roles, consuming more space in your
/tmp file. In cases where you have a large project (around 10 GB), disk space on/tmpcan be an issue.
6.5.1. Job runs
By default, when a job is submitted to the automation controller queue, it can be picked up by any of the workers. However, you can control where a particular job runs, such as restricting the instances from which a job runs on.
To support taking an instance offline temporarily, there is a property enabled defined on each instance. When this property is disabled, no jobs are assigned to that instance. Existing jobs finish, but no new work is assigned.
Troubleshooting
When you issue a cancel request on a running automation controller job, automation controller issues a SIGINT to the ansible-playbook process. While this causes Ansible to stop dispatching new tasks and exit, in many cases, module tasks that were already dispatched to remote hosts will run to completion. This behavior is similar to pressing Ctrl-c during a command-line Ansible run.
With respect to software dependencies, if a running job is canceled, the job is removed but the dependencies remain.
6.6. Deprovisioning instances
Re-running the setup playbook does not automatically deprovision instances since clusters do not currently distinguish between an instance that was taken offline intentionally or due to failure. Instead, shut down all services on the automation controller instance and then run the deprovisioning tool from any other instance.
Procedure
-
Shut down the instance or stop the service with the command:
automation-controller-service stop. Run the following deprovision command from another instance to remove it from the automation controller cluster:
$ awx-manage deprovision_instance --hostname=<name used in inventory file>
Example
$ awx-manage deprovision_instance --hostname=hostB
Deprovisioning instance groups in automation controller does not automatically deprovision or remove instance groups. For more information, see the Deprovisioning instance groups section in Using automation execution.
Chapter 7. Automation controller logfiles
Automation controller logfiles can be accessed from two centralized locations:
-
/var/log/tower/ -
/var/log/supervisor/
In the /var/log/tower/ directory, you can view logfiles captured by:
- tower.log: Captures the log messages such as runtime errors that occur when the job is executed.
- callback_receiver.log: Captures callback receiver logs that handles callback events when running ansible jobs.
- dispatcher.log: Captures log messages for the automation controller dispatcher worker service.
- job_lifecycle.log: Captures details of the job run, whether it is blocked, and what condition is blocking it.
- management_playbooks.log: Captures the logs of management playbook runs, and isolated job runs such as copying the metadata.
- rsyslog.err: Captures rsyslog errors authenticating with external logging services when sending logs to them.
- task_system.log: Captures the logs of tasks that automation controller is running in the background, such as adding cluster instances and logs related to information gathering or processing for analytics.
- tower_rbac_migrations.log: Captures the logs for rbac database migration or upgrade.
- tower_system_tracking_migrations.log: Captures the logs of the controller system tracking migration or upgrade.
- wsbroadcast.log: Captures the logs of websocket connections in the controller nodes.
In the /var/log/supervisor/ directory, you can view logfiles captured by:
-
awx-callback-receiver.log: Captures the log of callback receiver that handles callback events when running ansible jobs, managed by
supervisord. - awx-daphne.log: Captures the logs of Websocket communication of WebUI.
- awx-dispatcher.log: Captures the logs that occur when dispatching a task to an automation controller instance, such as when running a job.
-
awx-rsyslog.log: Captures the logs for the
rsyslogservice. - awx-uwsgi.log: Captures the logs related to uWSGI, which is an application server.
- awx-wsbroadcast.log: Captures the logs of the websocket service that is used by automation controller.
-
failure-event-handler.stderr.log: Captures the standard errors for
/usr/bin/failure-event-handlersupervisord’s subprocess. -
supervisord.log: Captures the logs related to
supervisorditself. - wsrelay.log: Captures the communication logs within the websocket relay server.
- ws_heartbeat.log: Captures the periodic checks on the health of services running on the host.
- rsyslog_configurer.log: Captures rsyslog configuration activity associated with authenticating with external logging services.
The /var/log/supervisor/ directory includes stdout files for all services as well.
You can expect the following log paths to be generated by services used by automation controller (and Ansible Automation Platform):
- /var/log/nginx/
- /var/lib/pgsql/data/pg_log/
- /var/log/redis/
Troubleshooting
Error logs can be found in the following locations:
-
Automation controller server errors are logged in
/var/log/tower. -
Supervisors logs can be found in
/var/log/supervisor/. - Nginx web server errors are logged in the httpd error log.
-
Configure other automation controller logging needs in
/etc/tower/conf.d/.
Explore client-side issues using the JavaScript console built into most browsers and report any errors to Ansible through the Red Hat Customer portal at: https://access.redhat.com/.
Chapter 8. Logging and Aggregation
Logging provides the capability to send detailed logs to third-party external log aggregation services. Services connected to this data feed serve as a means of gaining insight into automation controller use or technical trends. The data can be used to analyze events in the infrastructure, monitor for anomalies, and correlate events in one service with events in another.
The types of data that are most useful to automation controller are job fact data, job events or job runs, activity stream data, and log messages. The data is sent in JSON format over a HTTP connection using minimal service-specific adjustments engineered in a custom handler or through an imported library.
The version of rsyslog that is installed by automation controller does not include the following rsyslog modules:
- rsyslog-udpspoof.x86_64
- rsyslog-libdbi.x86_64
After installing automation controller, you must only use the automation controller provided rsyslog package for any logging outside of automation controller that might have previously been done with the RHEL provided rsyslog package.
If you already use rsyslog for logging system logs on the automation controller instances, you can continue to use rsyslog to handle logs from outside of automation controller by running a separate rsyslog process (using the same version of rsyslog that automation controller uses), and pointing it to a separate /etc/rsyslog.conf file.
Use the /api/v2/settings/logging/ endpoint to configure how the automation controller rsyslog process handles messages that have not yet been sent in the event that your external logger goes offline:
-
LOG_AGGREGATOR_ACTION_QUEUE_SIZE: Defines how large the rsyslog action queue can grow in number of messages stored. This can have an impact on memory use. When the queue reaches 75% of this number, the queue starts writing to disk (queue.highWatermarkinrsyslog). When it reaches 90%,NOTICE,INFO, andDEBUGmessages start to be discarded (queue.discardMarkwith 'queue.discardSeverity=5`).
Equivalent to the rsyslogd queue.maxdiskspace setting on the action.
It stores files in the directory specified by LOG_AGGREGATOR_MAX_DISK_USAGE_PATH. * LOG_AGGREGATOR_MAX_DISK_USAGE_PATH: Specifies the location to store logs that should be retried after an outage of the external log aggregator (defaults to /var/lib/awx). Equivalent to the rsyslogd queue.spoolDirectory setting.
For example, if Splunk goes offline, rsyslogd stores a queue on the disk until Splunk comes back online. By default, it stores up to 1GB of events (while Splunk is offline) but you can increase that to more than 1GB if necessary, or change the path where you save the queue.
8.1. Loggers
The following are special loggers (except for awx, which constitutes generic server logs) that provide large amounts of information in a predictable structured or semi-structured format, using the same structure as if obtaining the data from the API:
-
job_events: Provides data returned from the Ansible callback module. -
activity_stream: Displays the record of changes to the objects within the application. -
system_tracking: Provides fact data gathered by Ansiblesetupmodule, that is,gather_facts: truewhen job templates are run with Enable Fact Cache selected. -
awx: Provides generic server logs, which include logs that would normally be written to a file. It contains the standard metadata that all logs have, except it only has the message from the log statement.
These loggers only use the log-level of INFO, except for the awx logger, which can be any given level.
Additionally, the standard automation controller logs are deliverable through this same mechanism. It should be apparent how to enable or disable each of these five sources of data without manipulating a complex dictionary in your local settings file, and how to adjust the log-level consumed from the standard automation controller logs.
From the navigation panel, select → to configure the logging components in automation controller.
8.1.1. Log message schema
Common schema for all loggers:
-
cluster_host_id: Unique identifier of the host within the automation controller cluster. -
level: Standard python log level, roughly reflecting the significance of the event. All of the data loggers as a part of 'level' useINFOlevel, but the other automation controller logs use different levels as appropriate. -
logger_name: Name of the logger we use in the settings, for example, "activity_stream". -
@timestamp: Time of log. -
path: File path in code where the log was generated.
8.1.2. Activity stream schema
This uses the fields common to all loggers listed in Log message schema.
It has the following additional fields:
-
actor: Username of the user who took the action documented in the log. -
changes: JSON summary of what fields changed, and their old or new values. -
operation: The basic category of the changes logged in the activity stream, for instance, "associate". -
object1: Information about the primary object being operated on, consistent with what is shown in the activity stream. -
object2: If applicable, the second object involved in the action.
This logger reflects the data being saved into job events, except when they would otherwise conflict with expected standard fields from the logger, in which case the fields are nested. Notably, the field host on the job_event model is given as event_host. There is also a sub-dictionary field, event_data within the payload, which contains different fields depending on the specifics of the Ansible event.
This logger also includes the common fields in Log message schema.
8.1.3. Scan / fact / system tracking data schema
These contain detailed dictionary-type fields that are either services, packages, or files.
services: For services scans, this field is included and has keys based on the name of the service.NotePeriods are not allowed by elastic search in names, and are replaced with "_" by the log formatter.
-
package: Included for log messages from package scans. -
files: Included for log messages from file scans. -
host: Name of the host the scan applies to. -
inventory_id: The inventory id the host is inside of.
This logger also includes the common fields in Log message schema.
8.1.4. Job status changes
This is a lower-volume source of information about changes in job states compared to job events, and captures changes to types of unified jobs other than job template based jobs.
This logger also includes the common fields in Log message schema and fields present on the job model.
8.1.5. Automation controller logs
This logger also includes the common fields in Log message schema.
In addition, this contains a msg field with the log message. Errors contain a separate traceback field. From the navigation panel, select → . On the Logging Settings page click and use the ENABLE EXTERNAL LOGGING option to enable or disable the logging components.
8.1.6. Logging Aggregator Services
The logging aggregator service works with the following monitoring and data analysis systems:
8.1.6.1. Splunk
Automation controller’s Splunk logging integration uses the Splunk HTTP Collector. When configuring a SPLUNK logging aggregator, add the full URL to the HTTP Event Collector host, as in the following example:
https://<yourcontrollerfqdn>/api/v2/settings/logging

{
    "LOG_AGGREGATOR_HOST": "https://<yoursplunk>:8088/services/collector/event",
    "LOG_AGGREGATOR_PORT": null,
    "LOG_AGGREGATOR_TYPE": "splunk",
    "LOG_AGGREGATOR_USERNAME": "",
    "LOG_AGGREGATOR_PASSWORD": "$encrypted$",
    "LOG_AGGREGATOR_LOGGERS": [
        "awx",
        "activity_stream",
        "job_events",
        "system_tracking"
    ],
    "LOG_AGGREGATOR_INDIVIDUAL_FACTS": false,
    "LOG_AGGREGATOR_ENABLED": true,
    "LOG_AGGREGATOR_CONTROLLER_UUID": ""
}
The Splunk HTTP Event Collector listens on port 8088 by default, so you must provide the full HEC event URL (with the port number) for LOG_AGGREGATOR_HOST for incoming requests to be processed successfully.
Typical values are shown in the following example:
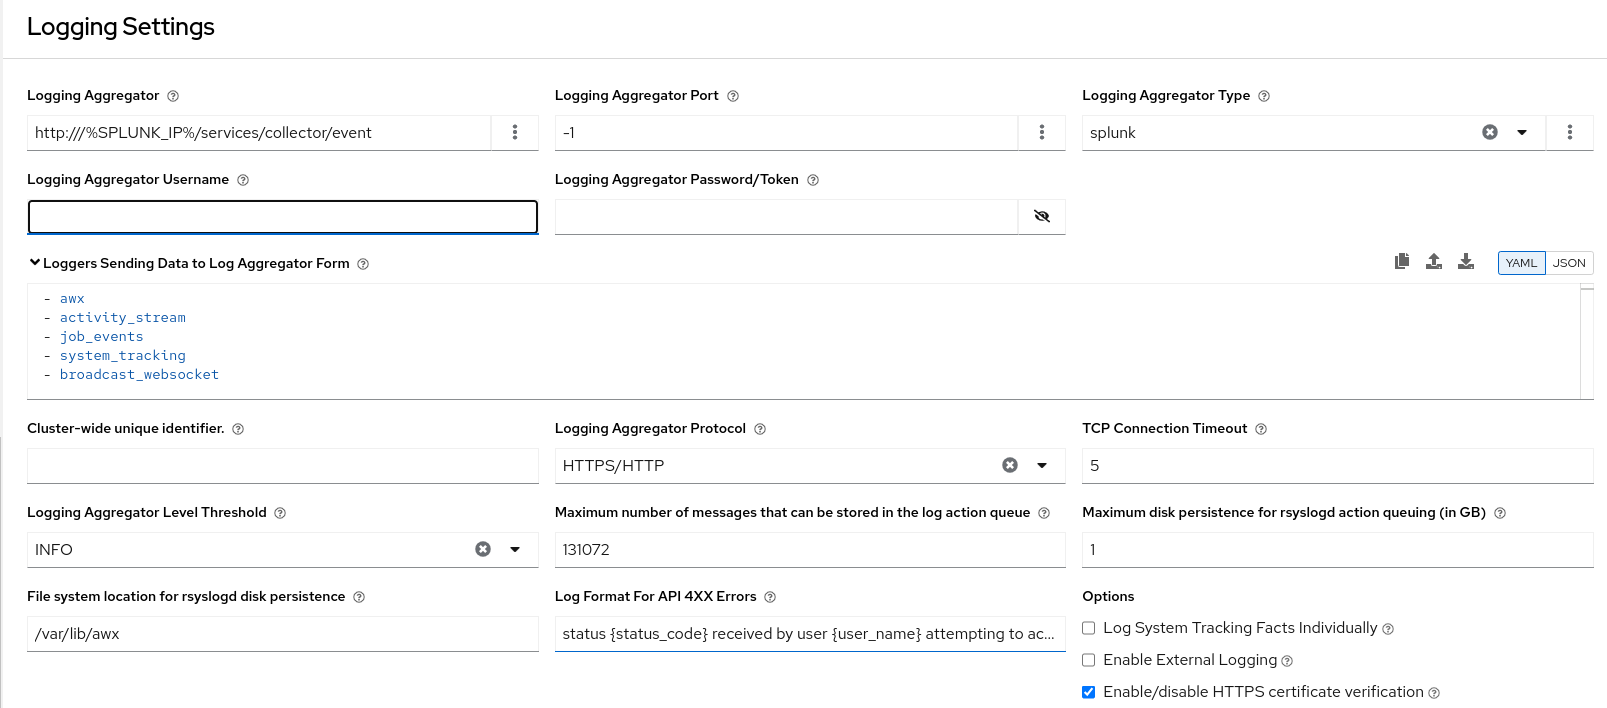
For more information on configuring the HTTP Event Collector, see the Splunk documentation.
8.1.6.2. Loggly
For more information on sending logs through Loggly’s HTTP endpoint, see the Loggly documentation.
Loggly uses the URL convention shown in the Logging Aggregator field in the following example:
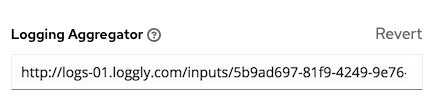
8.1.6.3. Sumologic
In Sumologic, create a search criteria containing the JSON files that provide the parameters used to collect the data you need.

8.1.6.4. Elastic stack (formerly ELK stack)
If you are setting up your own version of the elastic stack, the only change you require is to add the following lines to the logstash logstash.conf file:
filter {
  json {
    source => "message"
  }
}Backward-incompatible changes were introduced with Elastic 5.0.0, and different configurations might be required depending on what version you are using.
8.2. Setting up logging
Use the following procedure to set up logging to any of the aggregator types.
Procedure
- From the navigation panel, select → .
On the Logging settings page, click .
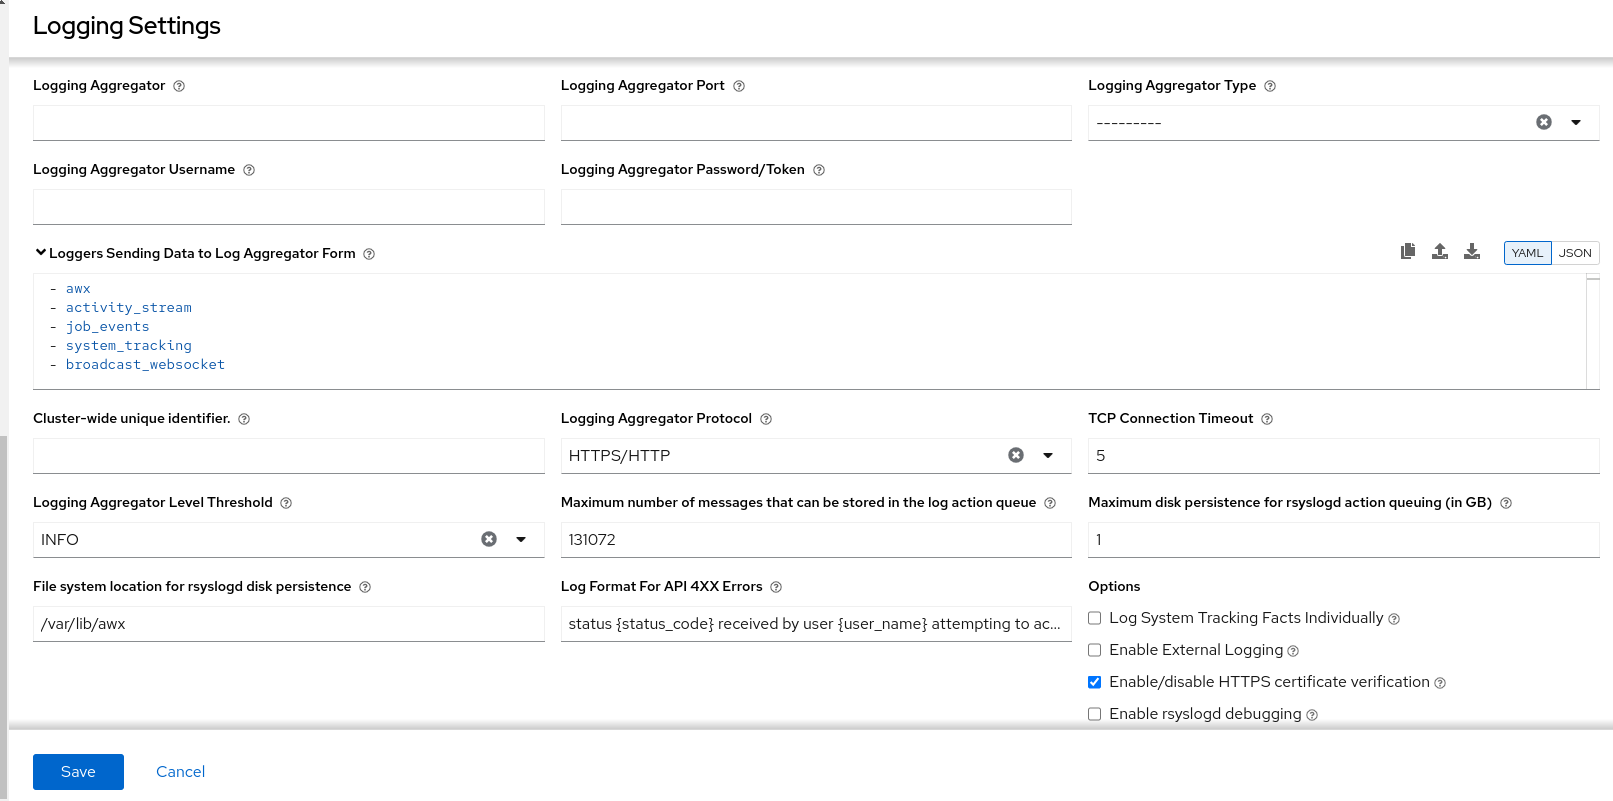
You can configure the following options:
- Logging Aggregator: Enter the hostname or IP address that you want to send logs to.
Logging Aggregator Port: Specify the port for the aggregator if it requires one.
NoteWhen the connection type is HTTPS, you can enter the hostname as a URL with a port number, after which, you are not required to enter the port again. However, TCP and UDP connections are determined by the hostname and port number combination, rather than URL. Therefore, in the case of a TCP or UDP connection, supply the port in the specified field. If a URL is entered in the Logging Aggregator field instead, its hostname portion is extracted as the hostname.
Logging Aggregator Type: Click to select the aggregator service from the list:

- Logging Aggregator Username: Enter the username of the logging aggregator if required.
- Logging Aggregator Password/Token: Enter the password of the logging aggregator if required.
-
Loggers to Send Data to the Log Aggregator Form: All four types of data are pre-populated by default. Click the tooltip
icon next to the field for additional information on each data type. Delete the data types you do not want.
- Cluster wide unique identifier: Use this to uniquely identify instances.
- Logging Aggregator Protocol: Click to select a connection type (protocol) to communicate with the log aggregator. Subsequent options vary depending on the selected protocol.
- TCP Connection Timeout: Specify the connection timeout in seconds. This option is only applicable to HTTPS and TCP log aggregator protocols.
- Logging Aggregator Level Threshold: Select the level of severity you want the log handler to report.
-
Maximum number of messages that can be stored in the log action queue:Defines how large the
rsyslogaction queue can grow in number of messages stored. This can have an impact on memory use. When the queue reaches 75% of this number, the queue starts writing to disk (queue.highWatermarkinrsyslog). When it reaches 90%,NOTICE,INFO, andDEBUGmessages start to be discarded (queue.discardMarkwithqueue.discardSeverity=5). -
Maximum disk persistence for rsyslogd action queuing (in GB): The amount of data to store (in gigabytes) if an
rsyslogaction takes time to process an incoming message (defaults to 1). Equivalent to thersyslogd queue.maxdiskspacesetting on the action (e.g.omhttp). It stores files in the directory specified byLOG_AGGREGATOR_MAX_DISK_USAGE_PATH. -
File system location for rsyslogd disk persistence: Location to persist logs that should be retried after an outage of the external log aggregator (defaults to
/var/lib/awx). Equivalent to thersyslogd queue.spoolDirectorysetting. - Log Format For API 4XX Errors: Configure a specific error message. For more information, see API 4XX Error Configuration.
Set the following options:
Log System Tracking Facts Individually: Click the tooltip
icon for additional information, such as whether or not you want to turn it on, or leave it off by default.
Review your entries for your chosen logging aggregation. The following example is set up for Splunk:
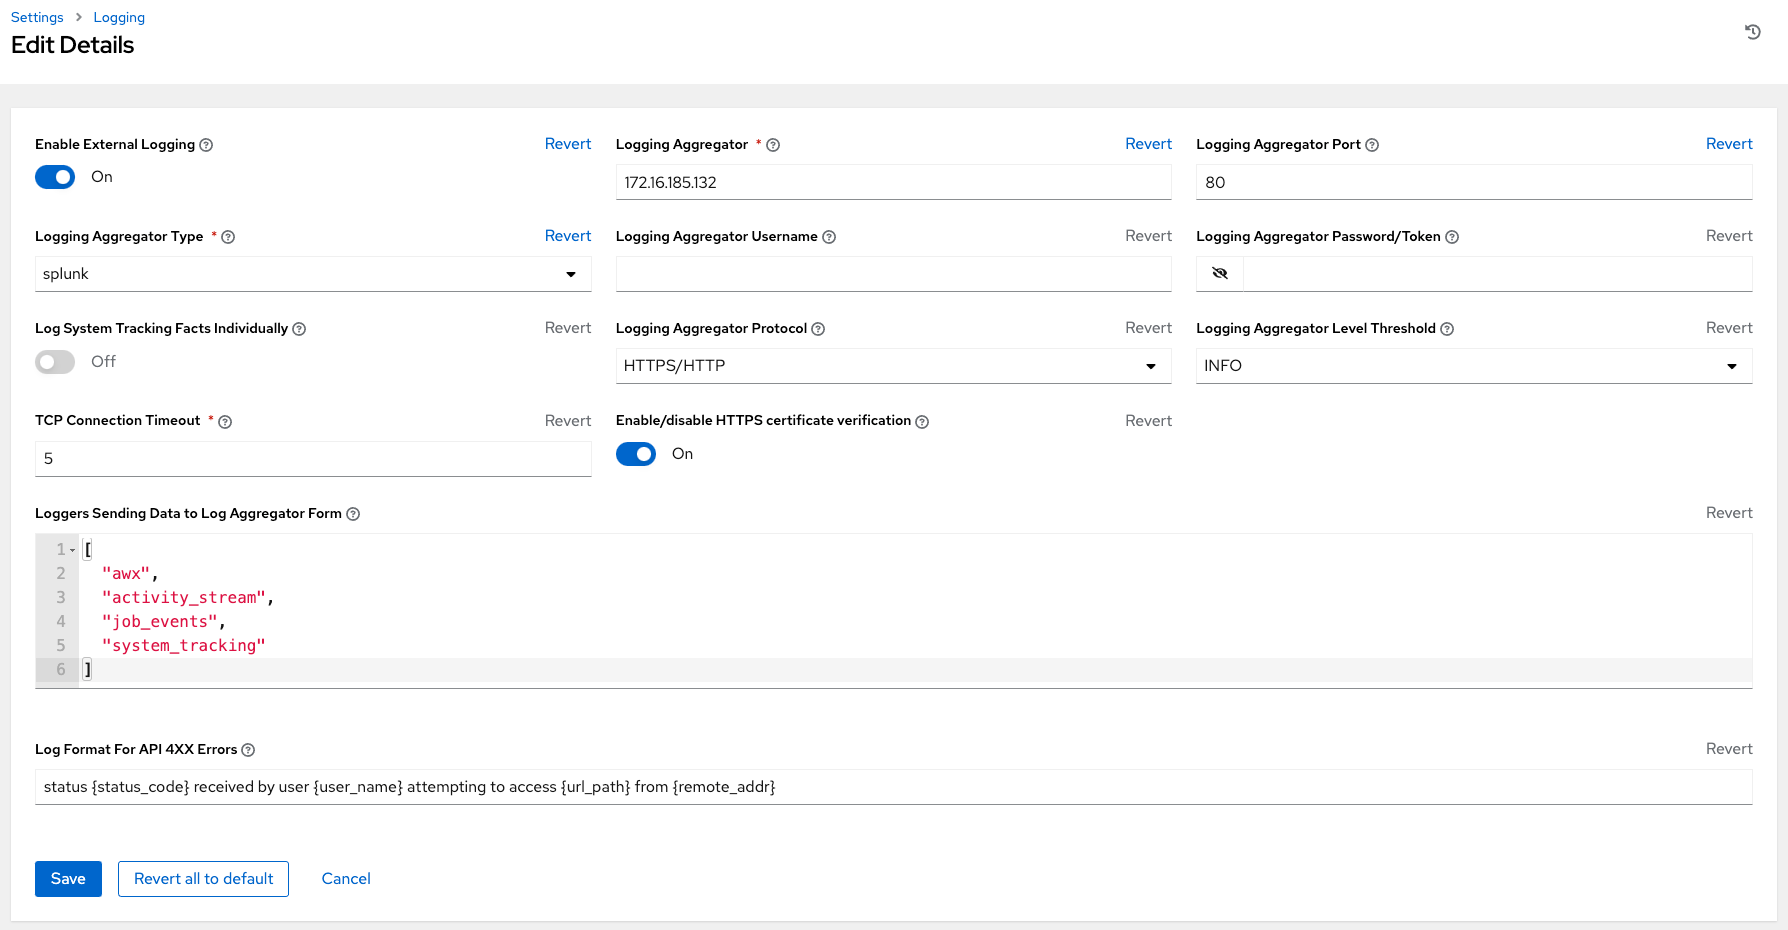
- Enable External Logging: Select this checkbox if you want to send logs to an external log aggregator.
- Enable/disable HTTPS certificate verification: Certificate verification is enabled by default for the HTTPS log protocol. Select this checkbox if yoiu want the log handler to verify the HTTPS certificate sent by the external log aggregator before establishing a connection.
Enable rsyslogd debugging: Select this checkbox to enable high verbosity debugging for
rsyslogd. Useful for debugging connection issues for external log aggregation.- Click or to abandon the changes.
8.3. API 4XX Error Configuration
When the API encounters an issue with a request, it typically returns an HTTP error code in the 400 range along with an error. When this happens, an error message is generated in the log that follows the following pattern:
' status {status_code} received by user {user_name} attempting to access {url_path} from {remote_addr} 'These messages can be configured as required. Use the following procedure to modify the default API 4XX errors log message format.
Procedure
- From the navigation panel, select → .
- On the Logging settings page, click .
- Modify the field Log Format For API 4XX Errors.
Items surrounded by {} are substituted when the log error is generated. The following variables can be used:
- status_code: The HTTP status code the API is returning.
- user_name: The name of the user that was authenticated when making the API request.
- url_path: The path portion of the URL being called (the API endpoint).
- remote_addr: The remote address received by automation controller.
- error: The error message returned by the API or, if no error is specified, the HTTP status as text.
8.4. Troubleshooting logging
Logging Aggregation
If you have sent a message with the test button to your configured logging service through http or https, but did not receive the message, check the /var/log/tower/rsyslog.err log file. This is where errors are stored if they occurred when authenticating rsyslog with an http or https external logging service. Note that if there are no errors, this file does not exist.
API 4XX Errors
You can include the API error message for 4XX errors by modifying the log format for those messages. Refer to the API 4XX Error Configuration.
LDAP
You can enable logging messages for the LDAP adapter. For more information, see API 4XX Error Configuration.
SAML
You can enable logging messages for the SAML adapter the same way you can enable logging for LDAP.
Chapter 9. Metrics
A metrics endpoint, /api/v2/metrics/ is available in the API that produces instantaneous metrics about automation controller, which can be consumed by system monitoring software such as the open source project Prometheus.
The types of data shown at the metrics/ endpoint are Content-type: text/plain and application/json.
This endpoint contains useful information, such as counts of how many active user sessions there are, or how many jobs are actively running on each automation controller node.
You can configure Prometheus to scrape these metrics from automation controller by hitting the automation controller metrics endpoint and storing this data in a time-series database.
Clients can later use Prometheus in conjunction with other software such as Grafana or Metricbeat to visualize that data and set up alerts.
9.1. Setting up Prometheus
To set up and use Prometheus, you must install Prometheus on a virtual machine or container.
For more information, see the First steps with Prometheus documentation.
Procedure
In the Prometheus configuration file (typically
prometheus.yml), specify a<token_value>, a valid username and password for an automation controller user that you have created, and a<controller_host>.NoteAlternatively, you can provide an OAuth2 token (which can be generated at
/api/v2/users/N/personal_tokens/). By default, the configuration assumes a user with username=adminand password=password.Using an OAuth2 Token, created at the
/api/v2/tokensendpoint to authenticate Prometheus with automation controller, the following example provides a valid scrape configuration if the URL for your automation controller’s metrics endpoint ishttps://controller_host:443/metrics.scrape_configs - job_name: 'controller' tls_config: insecure_skip_verify: True metrics_path: /api/v2/metrics scrape_interval: 5s scheme: https bearer_token: <token_value> # basic_auth: # username: admin # password: password static_configs: - targets: - <controller_host>For help configuring other aspects of Prometheus, such as alerts and service discovery configurations, see the Prometheus configuration documentation.
If Prometheus is already running, you must restart it to apply the configuration changes by making a POST to the reload endpoint, or by killing the Prometheus process or service.
Use a browser to navigate to your graph in the Prometheus UI at
http://<your_prometheus>:9090/graphand test out some queries. For example, you can query the current number of active automation controller user sessions by executing:awx_sessions_total{type="user"}.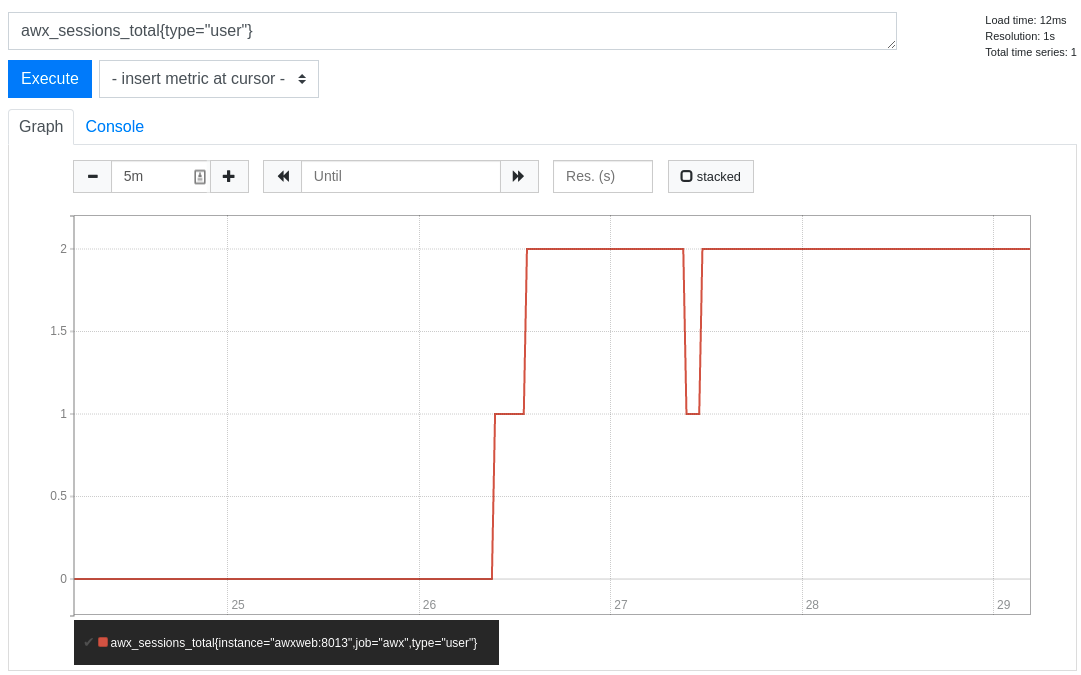
Refer to the metrics endpoint in the automation controller API for your instance (api/v2/metrics) for more ways to query.
Chapter 10. Secret management system
Users and system administrators upload machine and cloud credentials so that automation can access machines and external services on their behalf. By default, sensitive credential values such as SSH passwords, SSH private keys, and API tokens for cloud services are stored in the database after being encrypted.
With external credentials backed by credential plugins, you can map credential fields (such as a password or an SSH Private key) to values stored in a secret management system instead of providing them to automation controller directly.
Automation controller provides a secret management system that include integrations for:
- AWS Secrets Manager Lookup
- Centrify Vault Credential Provider Lookup
- CyberArk Central Credential Provider Lookup (CCP)
- CyberArk Conjur Secrets Manager Lookup
- HashiCorp Vault Key-Value Store (KV)
- HashiCorp Vault SSH Secrets Engine
- Microsoft Azure Key Management System (KMS)
- Thycotic DevOps Secrets Vault
- Thycotic Secret Server
These external secret values are fetched before running a playbook that needs them.
Additional resources
For more information about specifying secret management system credentials in the user interface, see Managing user credentials.
10.1. Configuring and linking secret lookups
When pulling a secret from a third-party system, you are linking credential fields to external systems. To link a credential field to a value stored in an external system, select the external credential corresponding to that system and provide metadata to look up the required value. The metadata input fields are part of the external credential type definition of the source credential.
Automation controller provides a credential plugin interface for developers, integrators, system administrators, and power-users with the ability to add new external credential types to extend it to support other secret management systems.
Use the following procedure to use automation controller to configure and use each of the supported third-party secret management systems.
Procedure
Create an external credential for authenticating with the secret management system. At minimum, give a name for the external credential and select one of the following for the Credential Type field:
- AWS Secrets Manager Lookup
- Centrify Vault Credential Provider Lookup
- CyberArk Central Credential Provider (CCP) Lookup
- CyberArk Conjur Secrets Manager Lookup
- HashiCorp Vault Secret Lookup
- HashiCorp Vault Signed SSH
- Microsoft Azure Key Vault
- Thycotic DevOps Secrets Vault
In this example, the Demo Credential is the target credential.
-
For any of the fields that follow the Type Details area that you want to link to the external credential, click the key
 icon in the input field to link one or more input fields to the external credential along with metadata for locating the secret in the external system.
- Select the input source to use to retrieve your secret information.
Select the credential you want to link to, and click . This takes you to the Metadata tab of the input source. This example shows the Metadata prompt for HashiVault Secret Lookup. Metadata is specific to the input source you select.
For more information, see the Metadata for credential input sources table.
- Click to verify connection to the secret management system. If the lookup is unsuccessful, an error message displays:
- Click . You return to the Details screen of your target credential.
- Repeat these steps, starting with Step 3 to complete the remaining input fields for the target credential. By linking the information in this manner, automation controller retrieves sensitive information, such as username, password, keys, certificates, and tokens from the third-party management systems and populates the remaining fields of the target credential form with that data.
- If necessary, supply any information manually for those fields that do not use linking as a way of retrieving sensitive information. For more information about each of the fields, see the appropriate [Credential Types].
- Click .
Additional resources
For more information, see the development documents for Credential plugins.
10.1.1. Metadata for credential input sources
The information required for the Metadata tab of the input source.
AWS Secrets Manager Lookup
| Metadata | Description |
|---|---|
| AWS Secrets Manager Region (required) | The region where the secrets manager is located. |
| AWS Secret Name (required) | Specify the AWS secret name that was generated by the AWS access key. |
Centrify Vault Credential Provider Lookup
| Metadata | Description |
|---|---|
| Account name (required) | Name of the system account or domain associated with Centrify Vault. |
| System Name | Specify the name used by the Centrify portal. |
CyberArk Central Credential Provider Lookup
| Metadata | Description |
|---|---|
| Object Query (Required) | Lookup query for the object. |
| Object Query Format |
Select |
| Object Property |
Specifies the name of the property to return. For example, |
| Reason | If required for the object’s policy, supply a reason for checking out the secret, as CyberArk logs those. |
CyberArk Conjur Secrets Lookup
| Metadata | Description |
|---|---|
| Secret Identifier | The identifier for the secret. |
| Secret Version | Specify a version of the secret, if necessary, otherwise, leave it empty to use the latest version. |
HashiVault Secret Lookup
| Metadata | Description |
|---|---|
| Name of Secret Backend | Specify the name of the KV backend to use. Leave it blank to use the first path segment of the Path to Secret field instead. |
| Path to Secret (required) |
Specify the path to where the secret information is stored; for example, |
| Key Name (required) | Specify the name of the key to look up the secret information. |
| Secret Version (V2 Only) | Specify a version if necessary, otherwise, leave it empty to use the latest version. |
HashiCorp Signed SSH
| Metadata | Description |
|---|---|
| Unsigned Public Key (required) | Specify the public key of the certificate you want to have signed. It needs to be present in the authorized keys file of the target hosts. |
| Path to Secret (required) |
Specify the path to where the secret information is stored; for example, |
| Role Name (required) | A role is a collection of SSH settings and parameters that are stored in Hashi vault. Typically, you can specify some with different privileges or timeouts, for example. So you could have a role that is permitted to get a certificate signed for root, and other less privileged ones, for example. |
| Valid Principals | Specify a user (or users) other than the default, that you are requesting vault to authorize the cert for the stored key. Hashi vault has a default user for whom it signs, for example, ec2-user. |
Microsoft Azure KMS
| Metadata | Description |
|---|---|
| Secret Name (required) | The name of the secret as it is referenced in Microsoft Azure’s Key vault app. |
| Secret Version | Specify a version of the secret, if necessary, otherwise, leave it empty to use the latest version. |
Thycotic DevOps Secrets Vault
| Metadata | Description |
|---|---|
| Secret Path (required) | Specify the path to where the secret information is stored, for example, /path/username. |
Thycotic Secret Server
| Metadata | Description |
|---|---|
| Secret ID (required) | The identifier for the secret. |
| Secret Field | Specify the field to be used from the secret. |
10.1.2. AWS Secrets Manager lookup
This plugin enables Amazon Web Services to be used as a credential input source to pull secrets from the Amazon Web Services Secrets Manager. The AWS Secrets Manager provides similar service to Microsoft Azure Key Vault, and the AWS collection provides a lookup plugin for it.
When AWS Secrets Manager lookup is selected for Credential type, give the following metadata to configure your lookup:
- AWS Access Key (required): give the access key used for communicating with AWS key management system
- AWS Secret Key (required): give the secret as obtained by the AWS IAM console
10.1.3. Centrify Vault Credential Provider Lookup
You need the Centrify Vault web service running to store secrets for this integration to work. When you select Centrify Vault Credential Provider Lookup for Credential Type, give the following metadata to configure your lookup:
- Centrify Tenant URL (required): give the URL used for communicating with Centrify’s secret management system
- Centrify API User (required): give the username
- Centrify API Password (required): give the password
- OAuth2 Application ID : specify the identifier given associated with the OAuth2 client
- OAuth2 Scope : specify the scope of the OAuth2 client
10.1.4. CyberArk Central Credential Provider (CCP) Lookup
The CyberArk Central Credential Provider web service must be running to store secrets for this integration to work. When you select CyberArk Central Credential Provider Lookup for Credential Type, give the following metadata to configure your lookup:
- CyberArk CCP URL (required): give the URL used for communicating with CyberArk CCP’s secret management system. It must include the URL scheme such as http or https.
- Optional: Web Service ID: specify the identifier for the web service. Leaving this blank defaults to AIMWebService.
- Application ID (required): specify the identifier given by CyberArk CCP services.
- Client Key: paste the client key if provided by CyberArk.
-
Client Certificate: include the
BEGIN CERTIFICATEandEND CERTIFICATElines when pasting the certificate, if provided by CyberArk. - Verify SSL Certificates: this option is only available when the URL uses HTTPS. Check this option to verify that the server’s SSL/TLS certificate is valid and trusted. For environments that use internal or private CA’s, leave this option unchecked to disable verification.
10.1.5. CyberArk Conjur Secrets Manager Lookup
With a Conjur Cloud tenant available to target, configure the CyberArk Conjur Secrets Lookup external management system credential plugin.
When you select CyberArk Conjur Secrets Manager Lookup for Credential Type, give the following metadata to configure your lookup:
- Conjur URL (required): provide the URL used for communicating with CyberArk Conjur’s secret management system. This must include the URL scheme, such as http or https.
- API Key (required): provide the key given by your Conjur admin
- Account (required): the organization’s account name
- Username (required): the specific authenticated user for this service
-
Public Key Certificate: include the
BEGIN CERTIFICATEandEND CERTIFICATElines when pasting the public key, if provided by CyberArk
10.1.6. HashiCorp Vault Secret Lookup
When you select HashiCorp Vault Secret Lookup for Credential Type, give the following metadata to configure your lookup:
- Server URL (required): give the URL used for communicating with HashiCorp Vault’s secret management system.
- Token: specify the access token used to authenticate HashiCorp’s server.
- CA Certificate: specify the CA certificate used to verify HashiCorp’s server.
- AppRole role_id: specify the ID if using AppRole for authentication.
- AppRole secret_id: specify the corresponding secret ID for AppRole authentication.
- Client Certificate: specify a PEM-encoded client certificate when using the TLS authentication method, including any required intermediate certificates expected by Hashicorp Vault.
- Client Certificate Key: specify a PEM-encoded certificate private key when using the TLS authentication method.
- TLS Authentication Role: specify the role or certificate name in Hashicorp Vault that corresponds to your client certificate when using the TLS authentication method. If it is not provided, Hashicorp Vault attempts to match the certificate automatically.
- Namespace name: specify the Namespace name (Hashicorp Vault enterprise only).
- Kubernetes role: specify the role name when using Kubernetes authentication.
- Username: enter the username of the user to be used to authenticate this service.
- Password: enter the password associated with the user to be used to authenticate this service.
-
Path to Auth: specify a path if other than the default path of
/approle. - API Version (required): select v1 for static lookups and v2 for versioned lookups.
LDAP authentication requires LDAP to be configured in HashiCorp’s Vault UI and a policy added to the user. Cubbyhole is the name of the default secret mount. If you have proper permissions, you can create other mounts and write key values to those.
To test the lookup, create another credential that uses Hashicorp Vault lookup.
Additional resources
For more detail about the LDAP authentication method and its fields, see the Vault documentation for LDAP auth method.
For more information about AppRole authentication method and its fields, see the Vault documentation for AppRole auth method.
For more information about the userpass authentication method and its fields, see the Vault documentation for userpass auth method.
For more information about the Kubernetes auth method and its fields, see the Vault documentation for Kubernetes auth method.
For more information about the TLS certificate auth method and its fields, see the Vault documentation for TLS certificates auth method.
10.1.7. HashiCorp Vault Signed SSH
When you select HashiCorp Vault Signed SSH for Credential Type, give the following metadata to configure your lookup:
- Server URL (required): give the URL used for communicating with HashiCorp Signed SSH’s secret management system.
- Token: specify the access token used to authenticate HashiCorp’s server.
- CA Certificate: specify the CA certificate used to verify HashiCorp’s server.
- AppRole role_id: specify the ID for AppRole authentication.
- AppRole secret_id: specify the corresponding secret ID for AppRole authentication.
- Client Certificate: specify a PEM-encoded client certificate when using the TLS authentication method, including any required intermediate certificates expected by Hashicorp Vault.
- Client Certificate Key: specify a PEM-encoded certificate private key when using the TLS authentication method.
- TLS Authentication Role: specify the role or certificate name in Hashicorp Vault that corresponds to your client certificate when using the TLS authentication method. If it is not provided, Hashicorp Vault attempts to match the certificate automatically.
- Namespace name: specify the Namespace name (Hashicorp Vault enterprise only).
- Kubernetes role: specify the role name when using Kubernetes authentication.
- Username: enter the username of the user to be used to authenticate this service.
- Password: enter the password associated with the user to be used to authenticate this service.
-
Path to Auth: specify a path if other than the default path of
/approle.
Additional resources
For more information about AppRole authentication method and its fields, see the Vault documentation for AppRole Auth Method.
For more information about the Kubernetes authentication method and its fields, see the Vault documentation for Kubernetes auth method.
For more information about the TLS certificate auth method and its fields, see the Vault documentation for TLS certificates auth method.
10.1.8. Microsoft Azure Key Vault
When you select Microsoft Azure Key Vault for Credential Type, give the following metadata to configure your lookup:
- Vault URL (DNS Name) (required): give the URL used for communicating with Microsoft Azure’s key management system
- Client ID (required): give the identifier as obtained by Microsoft Entra ID
- Client Secret (required): give the secret as obtained by Microsoft Entra ID
- Tenant ID (required): give the unique identifier that is associated with an Microsoft Entra ID instance within an Azure subscription
- Cloud Environment: select the applicable cloud environment to apply
10.1.9. Thycotic DevOps Secrets Vault
When you select Thycotic DevOps Secrets Vault for Credential Type, give the following metadata to configure your lookup:
- Tenant (required): give the URL used for communicating with Thycotic’s secret management system
- Top-level Domain (TLD): give the top-level domain designation, for example .com, .edu, or .org, associated with the secret vault you want to integrate
- Client ID (required): give the identifier as obtained by the Thycotic secret management system
- Client Secret (required): give the secret as obtained by the Thycotic secret management system
10.1.10. Thycotic Secret Server
When you select Thycotic Secrets Server for Credential Type, give the following metadata to configure your lookup:
- Secret Server URL (required): give the URL used for communicating with the Thycotic Secrets Server management system
- Username (required): specify the authenticated user for this service
- Domain: give the (application) user domain
- Password (required): give the password associated with the user
Chapter 11. Secret handling and connection security
Automation controller handles secrets and connections securely.
11.1. Secret handling
Automation controller manages three sets of secrets:
- User passwords for local automation controller users.
- Secrets for automation controller operational use, such as database password or message bus password.
- Secrets for automation use, such as SSH keys, cloud credentials, or external password vault credentials.
You must have 'local' user access for the following users:
- postgres
- awx
- redis
- receptor
- nginx
11.1.1. User passwords for local users
Automation controller hashes local automation controller user passwords with the PBKDF2 algorithm using a SHA256 hash. Users who authenticate by external account mechanisms, such as LDAP, SAML, and OAuth, do not have any password or secret stored.
11.1.2. Secret handling for operational use
The operational secrets found in automation controller are as follows:
-
/etc/tower/SECRET_KEY: A secret key used for encrypting automation secrets in the database. If theSECRET_KEYchanges or is unknown, you cannot access encrypted fields in the database. -
/etc/tower/tower.{cert,key}: An SSL certificate and key for the automation controller web service. A self-signed certificate or key is installed by default; you can provide a locally appropriate certificate and key. -
A database password in
/etc/tower/conf.d/postgres.pyand a message bus password in/etc/tower/conf.d/channels.py.
These secrets are stored unencrypted on the automation controller server, because they are all needed to be read by the automation controller service at startup in an automated fashion. All secrets are protected by UNIX permissions, and restricted to root and the automation controller awx service user.
If you need to hide these secrets, the files that these secrets are read from are interpreted by Python. You can adjust these files to retrieve these secrets by some other mechanism anytime a service restarts. This is a customer provided modification that might need to be reapplied after every upgrade. Red Hat Support and Red Hat Consulting have examples of such modifications.
If the secrets system is down, automation controller cannot get the information and can fail in a way that is recoverable once the service is restored. Using some redundancy on that system is highly recommended.
If you believe the SECRET_KEY that automation controller generated for you has been compromised and needs to be regenerated, you can run a tool from the installer that behaves much like the automation controller backup and restore tool.
Ensure that you backup your automation controller database before you generate a new secret key.
To generate a new secret key:
- Follow the procedure described in the Backing up and Restoring section.
Use the inventory from your install (the same inventory with which you run backups and restores), and run the following command:
setup.sh -k.
A backup copy of the previous key is saved in /etc/tower/.
11.1.3. Secret handling for automation use
Automation controller stores a variety of secrets in the database that are either used for automation or are a result of automation.
These secrets include the following:
- All secret fields of all credential types, including passwords, secret keys, authentication tokens, and secret cloud credentials.
- Secret tokens and passwords for external services defined automation controller settings.
- "password" type survey field entries.
To encrypt secret fields, automation controller uses AES in CBC mode with a 256-bit key for encryption, PKCS7 padding, and HMAC using SHA256 for authentication.
The encryption or decryption process derives the AES-256 bit encryption key from the SECRET_KEY, the field name of the model field and the database assigned auto-incremented record ID. Therefore, if any attribute used in the key generation process changes, the automation controller fails to correctly decrypt the secret.
Automation controller is designed so that:
-
The
SECRET_KEYis never readable in playbooks that automation controller launches. - These secrets are never readable by automation controller users.
- No secret field values are ever made available by the automation controller REST API.
If a secret value is used in a playbook, it is recommended that you use no_log on the task so that it is not accidentally logged.
11.2. Connection security
Automation controller allows for connections to internal services, external access, and managed nodes.
You must have 'local' user access for the following users:
- postgres
- awx
- redis
- receptor
- nginx
11.2.1. Internal services
Automation controller connects to the following services as part of internal operation:
- PostgreSQL database
- The connection to the PostgreSQL database is done by password authentication over TCP, either through localhost or remotely (external database). This connection can use PostgreSQL’s built-in support for SSL/TLS, as natively configured by the installer support. SSL/TLS protocols are configured by the default OpenSSL configuration.
- A Redis key or value store
- The connection to Redis is over a local UNIX socket, restricted to the awx service user.
11.2.2. External access
Automation controller is accessed via standard HTTP/HTTPS on standard ports, provided by Nginx. A self-signed certificate or key is installed by default; you can provide a locally appropriate certificate and key. SSL/TLS algorithm support is configured in the /etc/nginx/nginx.conf configuration file. An "intermediate" profile is used by default, that you can configure. You must reapply changes after each update.
11.2.3. Managed nodes
Automation controller connects to managed machines and services as part of automation. All connections to managed machines are done by standard secure mechanisms, such as SSH, WinRM, or SSL/TLS. Each of these inherits configuration from the system configuration for the feature in question, such as the system OpenSSL configuration.
Chapter 12. Security best practices
You can deploy automation controller to automate typical environments securely. However, managing certain operating system environments, automation, and automation platforms, can require additional best practices to ensure security.
To secure Red Hat Enterprise Linux start with the following release-appropriate security guide:
- For Red Hat Enterprise Linux 8, see Security hardening.
- For Red Hat Enterprise Linux 9, see Security hardening.
12.1. Understand the architecture of Ansible Automation Platform and automation controller
Ansible Automation Platform and automation controller comprise a general-purpose, declarative automation platform. That means that when an Ansible Playbook is launched (by automation controller, or directly on the command line), the playbook, inventory, and credentials provided to Ansible are considered to be the source of truth. If you want policies around external verification of specific playbook content, job definition, or inventory contents, you must complete these processes before the automation is launched, either by the automation controller web UI, or the automation controller API.
The use of source control, branching, and mandatory code review is best practice for Ansible automation. There are tools that can help create process flow around using source control in this manner.
At a higher level, tools exist that enable creation of approvals and policy-based actions around arbitrary workflows, including automation. These tools can then use Ansible through the automation controller’s API to perform automation.
You must use a secure default administrator password at the time of automation controller installation. For more information, see Change the automation controller Administrator Password.
Automation controller exposes services on certain well-known ports, such as port 80 for HTTP traffic and port 443 for HTTPS traffic. Do not expose automation controller on the open internet, which reduces the threat surface of your installation.
12.1.1. Granting access
Granting access to certain parts of the system exposes security risks. Apply the following practices to help secure access:
12.1.2. Minimize administrative accounts
Minimizing the access to system administrative accounts is crucial for maintaining a secure system. A system administrator or root user can access, edit, and disrupt any system application. Limit the number of people or accounts with root access, where possible. Do not give out sudo to root or awx (the automation controller user) to untrusted users. Note that when restricting administrative access through mechanisms like sudo, restricting to a certain set of commands can still give a wide range of access. Any command that enables execution of a shell or arbitrary shell commands, or any command that can change files on the system, is equal to full root access.
With automation controller, any automation controller "system administrator" or "superuser" account can edit, change, and update an inventory or automation definition in automation controller. Restrict this to the minimum set of users possible for low-level automation controller configuration and disaster recovery only.
12.1.3. Minimize local system access
When you use automation controller with best practices, it does not require local user access except for administrative purposes. Non-administrator users do not have access to the automation controller system.
12.1.4. Remove user access to credentials
If an automation controller credential is only stored in the controller, you can further secure it. You can configure services such as OpenSSH to only permit credentials on connections from specific addresses. Credentials used by automation can be different from credentials used by system administrators for disaster-recovery or other ad hoc management, allowing for easier auditing.
12.1.5. Enforce separation of duties
Different pieces of automation might require access to a system at different levels. For example, you can have low-level system automation that applies patches and performs security baseline checking, while a higher-level piece of automation deploys applications. By using different keys or credentials for each piece of automation, the effect of any one key vulnerability is minimized, while also enabling baseline auditing.
12.2. Available resources
Several resources exist in automation controller and elsewhere to ensure a secure platform. Consider using the following functionalities:
12.2.1. Existing security functionality
Do not disable SELinux or automation controller’s existing multi-tenant containment. Use automation controller’s role-based access control (RBAC) to delegate the minimum level of privileges required to run automation. Use teams in automation controller to assign permissions to groups of users rather than to users individually.
Additional resources
For more information, see Role-Based Access Controls in Using automation execution.
12.2.2. External account stores
Maintaining a full set of users in automation controller can be a time-consuming task in a large organization. Automation controller supports connecting to external account sources by LDAP, SAML 2.0, and certain OAuth providers. Using this eliminates a source of error when working with permissions.
12.2.3. Django password policies
Automation controller administrators can use Django to set password policies at creation time through AUTH_PASSWORD_VALIDATORS to validate automation controller user passwords. In the custom.py file located at /etc/tower/conf.d of your automation controller instance, add the following code block example:
AUTH_PASSWORD_VALIDATORS = [
    {
        'NAME': 'django.contrib.auth.password_validation.UserAttributeSimilarityValidator',
    },
    {
        'NAME': 'django.contrib.auth.password_validation.MinimumLengthValidator',
        'OPTIONS': {
            'min_length': 9,
        }
    },
    {
        'NAME': 'django.contrib.auth.password_validation.CommonPasswordValidator',
    },
    {
        'NAME': 'django.contrib.auth.password_validation.NumericPasswordValidator',
    },
]
Additional resources
- For more information, see Password validation in Django in addition to the preceding example.
- Ensure that you restart your automation controller instance for the change to take effect. For more information, see Start, stop, and restart automation controller.
Chapter 13. The awx-manage Utility
Use the awx-manage utility to access detailed internal information of automation controller. Commands for awx-manage must run as the awx user only.
13.1. Inventory Import
awx-manage is a mechanism by which an automation controller administrator can import inventory directly into automation controller.
To use awx-manage properly, you must first create an inventory in automation controller to use as the destination for the import.
For help with awx-manage, run the following command:
awx-manage inventory_import [--help]
The inventory_import command synchronizes an automation controller inventory object with a text-based inventory file, dynamic inventory script, or a directory of one or more, as supported by core Ansible.
When running this command, specify either an --inventory-id or --inventory-name, and the path to the Ansible inventory source (--source).
awx-manage inventory_import --source=/ansible/inventory/ --inventory-id=1
By default, inventory data already stored in automation controller blends with data from the external source.
To use only the external data, specify --overwrite.
To specify that any existing hosts get variable data exclusively from the --source, specify --overwrite_vars.
The default behavior adds any new variables from the external source, overwriting keys that already exist, but preserving any variables that were not sourced from the external data source.
awx-manage inventory_import --source=/ansible/inventory/ --inventory-id=1 --overwrite
Edits and additions to Inventory host variables persist beyond an inventory synchronization as long as --overwrite_vars is not set.
13.2. Cleanup of old data
awx-manage has a variety of commands used to clean old data from automation controller. Automation controller administrators can use the automation controller Management Jobs interface for access or use the command line.
awx-manage cleanup_jobs [--help]
This permanently deletes the job details and job output for jobs older than a specified number of days.
awx-manage cleanup_activitystream [--help]
This permanently deletes any [Activity stream] data older than a specific number of days.
13.3. Cluster management
For more information about the awx-manage provision_instance and awx-manage deprovision_instance commands, see Clustering.
Do not run other awx-manage commands unless instructed by Ansible Support.
13.4. Analytics gathering
Use this command to gather analytics on-demand outside of the predefined window (the default is 4 hours):
$ awx-manage gather_analytics --ship
For customers with disconnected environments who want to collect usage information about unique hosts automated across a time period, use this command:
awx-manage host_metric --since YYYY-MM-DD --until YYYY-MM-DD --json
The parameters --since and --until specify date ranges and are optional, but one of them has to be present.
The --json flag specifies the output format and is optional.
Chapter 14. Backup and restore
You can backup and restore your system using the Ansible Automation Platform setup playbook.
For more information, see the Backup and restore clustered environments section.
Ensure that you restore to the same version from which it was backed up. However, you must use the most recent minor version of a release to backup or restore your Ansible Automation Platform installation version. For example, if the current Ansible Automation Platform version you are on is 2.0.x, use only the latest 2.0 installer.
Backup and restore only works on PostgreSQL versions supported by your current platform version. For more information, see Red Hat Ansible Automation Platform system requirements in the Red Hat Ansible Automation Platform Installation Guide.
The Ansible Automation Platform setup playbook is invoked as setup.sh from the path where you unpacked the platform installer tarball. It uses the same inventory file used by the install playbook. The setup script takes the following arguments for backing up and restoring:
-
-b: Perform a database backup rather than an installation. -
-r: Perform a database restore rather than an installation.
As the root user, call setup.sh with the appropriate parameters and the Ansible Automation Platform backup or restored as configured:
root@localhost:~# ./setup.sh -b
root@localhost:~# ./setup.sh -r
Backup files are created on the same path that setup.sh script exists. You can change it by specifying the following EXTRA_VARS:
root@localhost:~# ./setup.sh -e 'backup_dest=/path/to/backup_dir/' -b
A default restore path is used unless you provide EXTRA_VARS with a non-default path, as shown in the following example:
root@localhost:~# ./setup.sh -e 'restore_backup_file=/path/to/nondefault/backup.tar.gz' -r
Optionally, you can override the inventory file used by passing it as an argument to the setup script:
setup.sh -i <inventory file>
14.1. Backup and restore playbooks
In addition to the install.yml file included with your setup.sh setup playbook, there are also backup.yml and restore.yml files.
These playbooks serve to backup and restore.
The overall backup, backs up:
- The database
-
The
SECRET_KEYfile
The per-system backups include:
- Custom configuration files
- Manual projects
- The restore backup restores the backed up files and data to a freshly installed and working second instance of automation controller.
When restoring your system, the installer checks to see that the backup file exists before beginning the restoration. If the backup file is not available, your restoration fails.
Make sure that your automation controller hosts are properly set up with SSH keys, user or pass variables in the hosts file, and that the user has sudo access.
14.2. Backup and restoration considerations
Consider the following points when you backup and restore your system:
- Disk space
- Review your disk space requirements to ensure you have enough room to backup configuration files, keys, other relevant files, and the database of the Ansible Automation Platform installation.
- System credentials
-
Confirm you have the required system credentials when working with a local database or a remote database. On local systems, you might need
rootorsudoaccess, depending on how credentials are set up. On remote systems, you might need different credentials to grant you access to the remote system you are trying to backup or restore. - Version
- You must always use the most recent minor version of a release to backup or restore your Ansible Automation Platform installation version. For example, if the current platform version you are on is 2.0.x, only use the latest 2.0 installer.
- File path
-
When using
setup.shin order to do a restore from the default restore file path,/var/lib/awx,-ris still required in order to do the restore, but it no longer accepts an argument. If a non-default restore file path is needed, you must provide this as an extra_var (root@localhost:~# ./setup.sh -e 'restore_backup_file=/path/to/nondefault/backup.tar.gz' -r). - Directory
-
If the backup file is placed in the same directory as the
setup.shinstaller, the restore playbook automatically locates the restore files. In this case, you do not need to use therestore_backup_fileextra var to specify the location of the backup file.
14.3. Backup and restore clustered environments
The procedure for backup and restore for a clustered environment is similar to a single install, except for some of the following considerations:
For more information on installing clustered environments, see the Install and configure section.
- If restoring to a new cluster, ensure that the old cluster is shut down before proceeding because they can conflict with each other when accessing the database.
- Per-node backups are only restored to nodes bearing the same hostname as the backup.
When restoring to an existing cluster, the restore contains the following:
- A dump of the PostgreSQL database
- UI artifacts, included in the database dump
-
An automation controller configuration (retrieved from
/etc/tower) - An automation controller secret key
- Manual projects
14.3.1. Restore to a different cluster
When restoring a backup to a separate instance or cluster, manual projects and custom settings under /etc/tower are retained. Job output and job events are stored in the database, and therefore, not affected.
The restore process does not alter instance groups present before the restore. It does not introduce any new instance groups either. Restored automation controller resources that were associated to instance groups likely need to be reassigned to instance groups present on the new automation controller cluster.
Chapter 15. Usability Analytics and Data Collection
Usability data collection is included with automation controller to collect data to better understand how automation controller users interact with it.
Only users installing a trial of or a fresh installation of are opted-in for this data collection.
Automation controller collects user data automatically to help improve the product.
For information on setting up Automation Analytics, see Configuring Automation Analytics.
15.1. Automation Analytics
When you imported your license for the first time, you were automatically opted in for the collection of data that powers Automation Analytics, a cloud service that is part of the Ansible Automation Platform subscription.
For opt-in of Automation Analytics to have any effect, your instance of automation controller must be running on Red Hat Enterprise Linux.
As with Red Hat Insights, Automation Analytics is built to collect the minimum amount of data needed. No credential secrets, personal data, automation variables, or task output is gathered.
When you imported your license for the first time, you were automatically opted in to Automation Analytics. To configure or disable this feature, see Configuring Automation Analytics.
By default, the data is collected every four hours. When you enable this feature, data is collected up to a month in arrears (or until the previous collection). You can turn off this data collection at any time in the Miscellaneous System settings of the System configuration window.
This setting can also be enabled through the API by specifying INSIGHTS_TRACKING_STATE = true in either of these endpoints:
-
api/v2/settings/all -
api/v2/settings/system
The Automation Analytics generated from this data collection can be found on the Red Hat Cloud Services portal.
Clusters data is the default view. This graph represents the number of job runs across all automation controller clusters over a period of time. The previous example shows a span of a week in a stacked bar-style chart that is organized by the number of jobs that ran successfully (in green) and jobs that failed (in red).
Alternatively, you can select a single cluster to view its job status information.
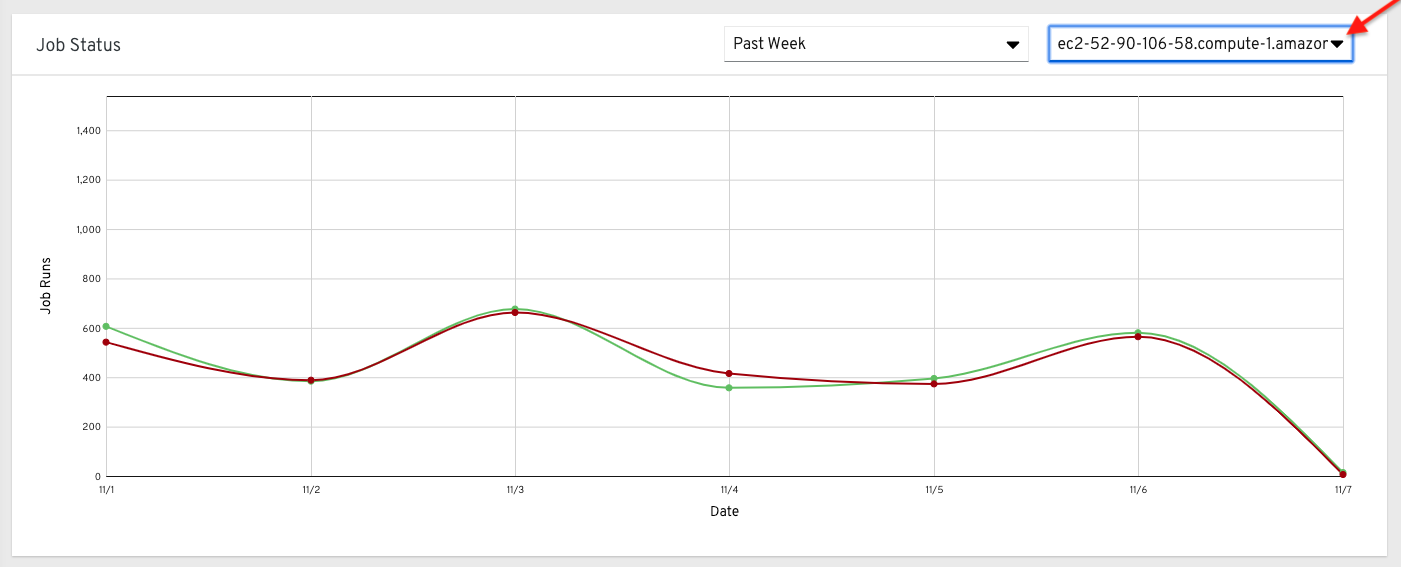
This multi-line chart represents the number of job runs for a single automation controller cluster for a specified period of time. The preceding example shows a span of a week, organized by the number of successfully running jobs (in green) and jobs that failed (in red). You can specify the number of successful and failed job runs for a selected cluster over a span of one week, two weeks, and monthly increments.
On the clouds navigation panel, select to view information for the following:
The organization statistics page will be deprecated in a future release.
15.1.1. Use by organization
The following chart represents the number of tasks run inside all jobs by a particular organization.

15.1.2. Job runs by organization
This chart represents automation controller use across all automation controller clusters by organization, calculated by the number of jobs run by that organization.

15.1.3. Organization status
This bar chart represents automation controller use by organization and date, which is calculated by the number of jobs run by that organization on a particular date.
Alternatively, you can specify to show the number of job runs per organization in one week, two weeks, and monthly increments.

15.2. Details of data collection
Automation Analytics collects the following classes of data from automation controller:
- Basic configuration, such as which features are enabled, and what operating system is being used
- Topology and status of the automation controller environment and hosts, including capacity and health
Counts of automation resources:
- organizations, teams, and users
- inventories and hosts
- credentials (indexed by type)
- projects (indexed by type)
- templates
- schedules
- active sessions
- running and pending jobs
- Job execution details (start time, finish time, launch type, and success)
- Automation task details (success, host id, playbook/role, task name, and module used)
You can use awx-manage gather_analytics (without --ship) to inspect the data that automation controller sends, so that you can satisfy your data collection concerns. This creates a tarball that contains the analytics data that is sent to Red Hat.
This file contains a number of JSON and CSV files. Each file contains a different set of analytics data.
- manifest.json
- config.json
- instance_info.json
- counts.json
- org_counts.json
- cred_type_counts.json
- inventory_counts.json
- projects_by_scm_type.json
- query_info.json
- job_counts.json
- job_instance_counts.json
- unified_job_template_table.csv
- unified_jobs_table.csv
- workflow_job_template_node_table.csv
- workflow_job_node_table.csv
- events_table.csv
15.2.1. manifest.json
manifest.json is the manifest of the analytics data. It describes each file included in the collection, and what version of the schema for that file is included.
The following is an example manifest.json file:
  "config.json": "1.1",
  "counts.json": "1.0",
  "cred_type_counts.json": "1.0",
  "events_table.csv": "1.1",
  "instance_info.json": "1.0",
  "inventory_counts.json": "1.2",
  "job_counts.json": "1.0",
  "job_instance_counts.json": "1.0",
  "org_counts.json": "1.0",
  "projects_by_scm_type.json": "1.0",
  "query_info.json": "1.0",
  "unified_job_template_table.csv": "1.0",
  "unified_jobs_table.csv": "1.0",
  "workflow_job_node_table.csv": "1.0",
  "workflow_job_template_node_table.csv": "1.0"
}
15.2.2. config.json
The config.json file contains a subset of the configuration endpoint /api/v2/config from the cluster. An example config.json is:
{
    "ansible_version": "2.9.1",
    "authentication_backends": [
        "social_core.backends.azuread.AzureADOAuth2",
        "django.contrib.auth.backends.ModelBackend"
    ],
    "external_logger_enabled": true,
    "external_logger_type": "splunk",
    "free_instances": 1234,
    "install_uuid": "d3d497f7-9d07-43ab-b8de-9d5cc9752b7c",
    "instance_uuid": "bed08c6b-19cc-4a49-bc9e-82c33936e91b",
    "license_expiry": 34937373,
    "license_type": "enterprise",
    "logging_aggregators": [
        "awx",
        "activity_stream",
        "job_events",
        "system_tracking"
    ],
    "pendo_tracking": "detailed",
    "platform": {
        "dist": [
            "redhat",
            "7.4",
            "Maipo"
        ],
        "release": "3.10.0-693.el7.x86_64",
        "system": "Linux",
        "type": "traditional"
    },
    "total_licensed_instances": 2500,
    "controller_url_base": "https://ansible.rhdemo.io",
    "controller_version": "3.6.3"
}
Which includes the following fields:
- ansible_version: The system Ansible version on the host
- authentication_backends: The user authentication backends that are available. For more information, see Configuring an authentication type.
- external_logger_enabled: Whether external logging is enabled
- external_logger_type: What logging backend is in use if enabled. For more information, see Logging and aggregation.
- logging_aggregators: What logging categories are sent to external logging. For more information, see Logging and aggregation.
- free_instances: How many hosts are available in the license. A value of zero means the cluster is fully consuming its license.
- install_uuid: A UUID for the installation (identical for all cluster nodes)
- instance_uuid: A UUID for the instance (different for each cluster node)
- license_expiry: Time to expiry of the license, in seconds
- license_type: The type of the license (should be 'enterprise' for most cases)
-
pendo_tracking: State of
usability_data_collection - platform: The operating system the cluster is running on
- total_licensed_instances: The total number of hosts in the license
- controller_url_base: The base URL for the cluster used by clients (shown in Automation Analytics)
- controller_version: Version of the software on the cluster
15.2.3. instance_info.json
The instance_info.json file contains detailed information on the instances that make up the cluster, organized by instance UUID.
The following is an example instance_info.json file:
{
    "bed08c6b-19cc-4a49-bc9e-82c33936e91b": {
        "capacity": 57,
        "cpu": 2,
        "enabled": true,
        "last_isolated_check": "2019-08-15T14:48:58.553005+00:00",
        "managed_by_policy": true,
        "memory": 8201400320,
        "uuid": "bed08c6b-19cc-4a49-bc9e-82c33936e91b",
        "version": "3.6.3"
    }
    "c0a2a215-0e33-419a-92f5-e3a0f59bfaee": {
        "capacity": 57,
        "cpu": 2,
        "enabled": true,
        "last_isolated_check": "2019-08-15T14:48:58.553005+00:00",
        "managed_by_policy": true,
        "memory": 8201400320,
        "uuid": "c0a2a215-0e33-419a-92f5-e3a0f59bfaee",
        "version": "3.6.3"
    }
}
Which includes the following fields:
- capacity: The capacity of the instance for executing tasks.
- cpu: Processor cores for the instance
- memory: Memory for the instance
- enabled: Whether the instance is enabled and accepting tasks
- managed_by_policy: Whether the instance’s membership in instance groups is managed by policy, or manually managed
- version: Version of the software on the instance
15.2.4. counts.json
The counts.json file contains the total number of objects for each relevant category in a cluster.
The following is an example counts.json file:
{
    "active_anonymous_sessions": 1,
    "active_host_count": 682,
    "active_sessions": 2,
    "active_user_sessions": 1,
    "credential": 38,
    "custom_inventory_script": 2,
    "custom_virtualenvs": 4,
    "host": 697,
    "inventories": {
        "normal": 20,
        "smart": 1
    },
    "inventory": 21,
    "job_template": 78,
    "notification_template": 5,
    "organization": 10,
    "pending_jobs": 0,
    "project": 20,
    "running_jobs": 0,
    "schedule": 16,
    "team": 5,
    "unified_job": 7073,
    "user": 28,
    "workflow_job_template": 15
}
Each entry in this file is for the corresponding API objects in /api/v2, with the exception of the active session counts.
15.2.5. org_counts.json
The org_counts.json file contains information on each organization in the cluster, and the number of users and teams associated with that organization.
The following is an example org_counts.json file:
{
    "1": {
        "name": "Operations",
        "teams": 5,
        "users": 17
    },
    "2": {
        "name": "Development",
        "teams": 27,
        "users": 154
    },
    "3": {
        "name": "Networking",
        "teams": 3,
        "users": 28
    }
}
15.2.6. cred_type_counts.json
The cred_type_counts.json file contains information on the different credential types in the cluster, and how many credentials exist for each type.
The following is an example cred_type_counts.json file:
{
    "1": {
        "credential_count": 15,
        "managed_by_controller": true,
        "name": "Machine"
    },
    "2": {
        "credential_count": 2,
        "managed_by_controller": true,
        "name": "Source Control"
    },
    "3": {
        "credential_count": 3,
        "managed_by_controller": true,
        "name": "Vault"
    },
    "4": {
        "credential_count": 0,
        "managed_by_controller": true,
        "name": "Network"
    },
    "5": {
        "credential_count": 6,
        "managed_by_controller": true,
        "name": "Amazon Web Services"
    },
    "6": {
        "credential_count": 0,
        "managed_by_controller": true,
        "name": "OpenStack"
    },
15.2.7. inventory_counts.json
The inventory_counts.json file contains information on the different inventories in the cluster.
The following is an example inventory_counts.json file:
{
    "1": {
        "hosts": 211,
        "kind": "",
        "name": "AWS Inventory",
        "source_list": [
            {
                "name": "AWS",
                "num_hosts": 211,
                "source": "ec2"
            }
        ],
        "sources": 1
    },
    "2": {
        "hosts": 15,
        "kind": "",
        "name": "Manual inventory",
        "source_list": [],
        "sources": 0
    },
    "3": {
        "hosts": 25,
        "kind": "",
        "name": "SCM inventory - test repo",
        "source_list": [
            {
                "name": "Git source",
                "num_hosts": 25,
                "source": "scm"
            }
        ],
        "sources": 1
    }
    "4": {
        "num_hosts": 5,
        "kind": "smart",
        "name": "Filtered AWS inventory",
        "source_list": [],
        "sources": 0
    }
}
15.2.8. projects_by_scm_type.json
The projects_by_scm_type.json file provides a breakdown of all projects in the cluster, by source control type.
The following is an example projects_by_scm_type.json file:
{
    "git": 27,
    "hg": 0,
    "insights": 1,
    "manual": 0,
    "svn": 0
}
15.2.9. query_info.json
The query_info.json file provides details on when and how the data collection happened.
The following is an example query_info.json file:
{
    "collection_type": "manual",
    "current_time": "2019-11-22 20:10:27.751267+00:00",
    "last_run": "2019-11-22 20:03:40.361225+00:00"
}
collection_type is one of manual or automatic.
15.2.10. job_counts.json
The job_counts.json file provides details on the job history of the cluster, describing both how jobs were launched, and what their finishing status is.
The following is an example job_counts.json file:
    "launch_type": {
        "dependency": 3628,
        "manual": 799,
        "relaunch": 6,
        "scheduled": 1286,
        "scm": 6,
        "workflow": 1348
    },
    "status": {
        "canceled": 7,
        "failed": 108,
        "successful": 6958
    },
    "total_jobs": 7073
}
15.2.11. job_instance_counts.json
The job_instance_counts.json file provides the same detail as job_counts.json, broken down by instance.
The following is an example job_instance_counts.json file:
{
    "localhost": {
        "launch_type": {
            "dependency": 3628,
            "manual": 770,
            "relaunch": 3,
            "scheduled": 1009,
            "scm": 6,
            "workflow": 1336
        },
        "status": {
            "canceled": 2,
            "failed": 60,
            "successful": 6690
        }
    }
}
Note that instances in this file are by hostname, not by UUID as they are in instance_info.
15.2.12. unified_job_template_table.csv
The unified_job_template_table.csv file provides information on job templates in the system. Each line contains the following fields for the job template:
- id: Job template id.
- name: Job template name.
- polymorphic_ctype_id: The id of the type of template it is.
-
model: The name of the
polymorphic_ctype_idfor the template. Examples includeproject,systemjobtemplate,jobtemplate,inventorysource, andworkflowjobtemplate. - created: When the template was created.
- modified: When the template was last updated.
-
created_by_id: The
useridthat created the template. Blank if done by the system. -
modified_by_id: The
useridthat last modified the template. Blank if done by the system. - current_job_id: Currently executing job id for the template, if any.
- last_job_id: Last execution of the job.
- last_job_run: Time of last execution of the job.
-
last_job_failed: Whether the
last_job_idfailed. -
status: Status of
last_job_id. - next_job_run: Next scheduled execution of the template, if any.
-
next_schedule_id: Schedule id for
next_job_run, if any.
15.2.13. unified_jobs_table.csv
The unified_jobs_table.csv file provides information on jobs run by the system.
Each line contains the following fields for a job:
- id: Job id.
- name: Job name (from the template).
- polymorphic_ctype_id: The id of the type of job it is.
-
model: The name of the
polymorphic_ctype_idfor the job. Examples includejobandworkflow. - organization_id: The organization ID for the job.
-
organization_name: Name for the
organization_id. - created: When the job record was created.
- started: When the job started executing.
- finished: When the job finished.
- elapsed: Elapsed time for the job in seconds.
- unified_job_template_id: The template for this job.
-
launch_type: One of
manual,scheduled,relaunched,scm,workflow, ordependency. - schedule_id: The id of the schedule that launched the job, if any,
- instance_group_id: The instance group that executed the job.
- execution_node: The node that executed the job (hostname, not UUID).
- controller_node: The automation controller node for the job, if run as an isolated job, or in a container group.
- cancel_flag: Whether the job was canceled.
- status: Status of the job.
- failed: Whether the job failed.
- job_explanation: Any additional detail for jobs that failed to execute properly.
- forks: Number of forks executed for this job.
15.2.14. workflow_job_template_node_table.csv
The workflow_job_template_node_table.csv file provides information on the nodes defined in workflow job templates on the system.
Each line contains the following fields for a worfklow job template node:
- id: Node id.
- created: When the node was created.
- modified: When the node was last updated.
- unified_job_template_id: The id of the job template, project, inventory, or other parent resource for this node.
- workflow_job_template_id: The workflow job template that contains this node.
- inventory_id: The inventory used by this node.
- success_nodes: Nodes that are triggered after this node succeeds.
- failure_nodes: Nodes that are triggered after this node fails.
- always_nodes: Nodes that always are triggered after this node finishes.
- all_parents_must_converge: Whether this node requires all its parent conditions satisfied to start.
15.2.15. workflow_job_node_table.csv
The workflow_job_node_table.csv provides information on the jobs that have been executed as part of a workflow on the system.
Each line contains the following fields for a job run as part of a workflow:
- id: Node id.
- created: When the node was created.
- modified: When the node was last updated.
- job_id: The job id for the job run for this node.
- unified_job_template_id: The id of the job template, project, inventory, or other parent resource for this node.
- workflow_job_template_id: The workflow job template that contains this node.
- inventory_id: The inventory used by this node.
- success_nodes: Nodes that are triggered after this node succeeds.
- failure_nodes: Nodes that are triggered after this node fails.
- always_nodes: Nodes that always are triggered after this node finishes.
- do_not_run: Nodes that were not run in the workflow due to their start conditions not being triggered.
- all_parents_must_converge: Whether this node requires all its parent conditions satisfied to start.
15.2.16. events_table.csv
The events_table.csv file provides information on all job events from all job runs in the system.
Each line contains the following fields for a job event:
- id: Event id.
- uuid: Event UUID.
- created: When the event was created.
- parent_uuid: The parent UUID for this event, if any.
- event: The Ansible event type.
-
task_action: The module associated with this event, if any (such as
commandoryum). -
failed: Whether the event returned
failed. -
changed: Whether the event returned
changed. - playbook: Playbook associated with the event.
- play: Play name from playbook.
- task: Task name from playbook.
- role: Role name from playbook.
- job_id: Id of the job this event is from.
- host_id: Id of the host this event is associated with, if any.
- host_name: Name of the host this event is associated with, if any.
- start: Start time of the task.
- end: End time of the task.
- duration: Duration of the task.
- warnings: Any warnings from the task or module.
- deprecations: Any deprecation warnings from the task or module.
15.3. Analytics Reports
Reports for data collected are available through console.redhat.com.
Other Automation Analytics data currently available and accessible through the platform UI include the following:
Automation Calculator is a view-only version of the Automation Calculator utility that shows a report that represents (possible) savings to the subscriber.

Host Metrics is an analytics report collected for host data such as, when they were first automated, when they were most recently automated, how many times they were automated, and how many times each host has been deleted.
Subscription Usage reports the historical usage of your subscription. Subscription capacity and licenses consumed per month are displayed, with the ability to filter by the last year, two years, or three years.
Chapter 16. Troubleshooting automation controller
Useful troubleshooting information for automation controller.
16.1. Unable to connect to your host
If you are unable to run the helloworld.yml example playbook from the Managing projects section of the Getting started with automation controller guide or other playbooks due to host connection errors, try the following:
-
Can you
sshto your host? Ansible depends on SSH access to the servers you are managing. -
Are your
hostnamesand IPs correctly added in your inventory file? Check for typos.
16.2. Unable to login to automation controller through HTTP
Access to automation controller is intentionally restricted through a secure protocol (HTTPS). In cases where your configuration is set up to run an automation controller node behind a load balancer or proxy as "HTTP only", and you only want to access it without SSL (for troubleshooting, for example), you must add the following settings in the custom.py file located at /etc/tower/conf.d of your automation controller instance:
SESSION_COOKIE_SECURE = False
CSRF_COOKIE_SECURE = False
If you change these settings to false it enables automation controller to manage cookies and login sessions when using the HTTP protocol. You must do this on every node of a cluster installation.
To apply the changes, run:
automation-controller-service restart
16.3. Unable to run a playbook
If you are unable to run the helloworld.yml example playbook from the Managing projects section of the Getting started with automation controller guide due to playbook errors, try the following:
-
Ensure that you are authenticating with the user currently running the commands. If not, check how the username has been set up or pass the
--user=usernameor-u usernamecommands to specify a user. -
Is your YAML file correctly indented? You might need to line up your whitespace correctly. Indentation level is significant in YAML. You can use
yamlintto check your playbook.
16.4. Unable to run a job
If you are unable to run a job from a playbook, review the playbook YAML file. When importing a playbook, either manually or by a source control mechanism, keep in mind that the host definition is controlled by automation controller and should be set to hosts:all.
16.5. Playbooks do not show up in the Job Template list
If your playbooks are not showing up in the Job Template list, check the following:
- Ensure that the playbook is valid YML and can be parsed by Ansible.
-
Ensure that the permissions and ownership of the project path (
/var/lib/awx/projects) is set up so that the "awx" system user can view the files. Run the following command to change the ownership:
chown awx -R /var/lib/awx/projects/
16.6. Playbook stays in pending
If you are attempting to run a playbook job and it stays in the Pending state indefinitely, try the following actions:
-
Ensure that all supervisor services are running through
supervisorctl status. -
Ensure that the
/var/ partitionhas more than 1 GB of space available. Jobs do not complete with insufficient space on the/var/partition. -
Run
automation-controller-service restarton the automation controller server.
If you continue to have issues, run sosreport as root on the automation controller server, then file a support request with the result.
16.7. Reusing an external database causes installations to fail
Instances have been reported where reusing the external database during subsequent installation of nodes causes installation failures.
Example
You perform a clustered installation. Then, you need to do this again and perform a second clustered installation reusing the same external database, only this subsequent installation failed.
When setting up an external database that has been used in a prior installation, you must manually clear the database used for the clustered node before any additional installations can succeed.
16.8. Viewing private EC2 VPC instances in the automation controller inventory
By default, automation controller only shows instances in a VPC that have an Elastic IP (EIP) associated with them.
Procedure
- From the navigation panel, select → → .
Select the inventory that has the Source set to Amazon EC2, and click the Source tab. In the Source Variables field, enter:
vpc_destination_variable: private_ip_address
- Click and trigger an update of the group.
Once this is done you can see your VPC instances.
Automation controller must be running inside the VPC with access to those instances if you want to configure them.
Chapter 17. Automation controller tips and tricks
- Use the automation controller CLI Tool
- Change the automation controller Admin Password
- Create an automation controller Admin from the commandline
- Set up a jump host to use with automation controller
- View Ansible outputs for JSON commands when using automation controller
- Locate and configure the Ansible configuration file
- View a listing of all ansible_ variables
- The ALLOW_JINJA_IN_EXTRA_VARS variable
- Configure the controllerhost hostname for notifications
- Launch Jobs with curl
- Filter instances returned by the dynamic inventory sources in automation controller
- Use an unreleased module from Ansible source with automation controller
- Connect to Windows with winrm
- Import existing inventory files and host/group vars into automation controller
17.1. The automation controller CLI Tool
Automation controller has a full-featured command line interface.
For more information on configuration and use, see the AWX Command Line Interface and the AWX manage utility section.
17.2. Change the automation controller Administrator Password
During the installation process, you are prompted to enter an administrator password that is used for the admin superuser or system administrator created by automation controller. If you log in to the instance by using SSH, it tells you the default administrator password in the prompt.
If you need to change this password at any point, run the following command as root on the automation controller server:
awx-manage changepassword admin
Next, enter a new password. After that, the password you have entered works as the administrator password in the web UI.
To set policies at creation time for password validation using Django, see Django password policies.
17.3. Create an automation controller Administrator from the command line
Occasionally you might find it helpful to create a system administrator (superuser) account from the command line.
To create a superuser, run the following command as root on the automation controller server and enter the administrator information as prompted:
awx-manage createsuperuser
17.4. Set up a jump host to use with automation controller
Credentials supplied by automation controller do not flow to the jump host through ProxyCommand. They are only used for the end-node when the tunneled connection is set up.
You can configure a fixed user/keyfile in the AWX user’s SSH configuration in the ProxyCommand definition that sets up the connection through the jump host.
For example:
Host tampa
Hostname 10.100.100.11
IdentityFile [privatekeyfile]

Host 10.100..
Proxycommand ssh -W [jumphostuser]@%h:%p tampa
You can also add a jump host to your automation controller instance through Inventory variables.
These variables can be set at either the inventory, group, or host level. To add this, navigate to your inventory and in the variables field of whichever level you choose, add the following variables:
ansible_user: <user_name>
ansible_connection: ssh
ansible_ssh_common_args: '-o ProxyCommand="ssh -W %h:%p -q <user_name>@<jump_server_name>"'
17.5. View Ansible outputs for JSON commands when using automation controller
When working with automation controller, you can use the API to obtain the Ansible outputs for commands in JSON format.
To view the Ansible outputs, browse to https://<controller server name>/api/v2/jobs/<job_id>/job_events/
17.6. Locate and configure the Ansible configuration file
While Ansible does not require a configuration file, OS packages often include a default one in /etc/ansible/ansible.cfg for possible customization.
To use a custom ansible.cfg file, place it at the root of your project. Automation controller runs ansible-playbook from the root of the project directory, where it finds the custom ansible.cfg file.
An ansible.cfg file anywhere else in the project is ignored.
To learn which values you can use in this file, see Generating a sample ansible.cfg file in the Ansible documentation.
Using the defaults are acceptable for starting out, but you can configure the default module path or connection type here, as well as other things.
Automation controller overrides some ansible.cfg options. For example, automation controller stores the SSH ControlMaster sockets, the SSH agent socket, and any other per-job run items in a per-job temporary directory that is passed to the container used for job execution.
17.7. View a listing of all ansible_ variables
By default, Ansible gathers "facts" about the machines under its management, accessible in Playbooks and in templates.
To view all facts available about a machine, run the setup module as an ad hoc action:
ansible -m setup hostname
This prints out a dictionary of all facts available for that particular host. For more information, see information-discovered-from-systems-facts in the Ansible documentation.
17.8. The ALLOW_JINJA_IN_EXTRA_VARS variable
Setting ALLOW_JINJA_IN_EXTRA_VARS = template only works for saved job template extra variables.
Prompted variables and survey variables are excluded from the 'template'.
This parameter has three values:
-
Only On Template Definitionsto allow usage of Jinja saved directly on a job template definition (the default). -
Neverto disable all Jinja usage (recommended). -
Alwaysto always allow Jinja (strongly discouraged, but an option for prior compatibility).
This parameter is configurable in the Jobs Settings page of the automation controller UI.
17.9. Configuring the controllerhost hostname for notifications
From the System settings page, you can replace https://controller.example.com in the Base URL of the Service field with your preferred hostname to change the notification hostname.
Refreshing your automation controller license also changes the notification hostname. New installations of automation controller need not set the hostname for notifications.
17.10. Launching Jobs with curl
Launching jobs with the automation controller API is simple.
The following are some easy to follow examples using the curl tool.
Assuming that your Job Template ID is '1', your controller IP is 192.168.42.100, and that admin and awxsecret are valid login credentials, you can create a new job this way:
curl -f -k -H 'Content-Type: application/json' -XPOST \
    --user admin:awxsecret \
    ht p://192.168.42.100/api/v2/job_templates/1/launch/
This returns a JSON object that you can parse and use to extract the 'id' field, which is the ID of the newly created job. You can also pass extra variables to the Job Template call, as in the following example:
curl -f -k -H 'Content-Type: application/json' -XPOST \
    -d '{"extra_vars": "{\"foo\": \"bar\"}"}' \
    --user admin:awxsecret http://192.168.42.100/api/v2/job_templates/1/launch/
The extra_vars parameter must be a string which contains JSON, not just a JSON dictionary. Use caution when escaping the quotes, etc.
17.11. Filtering instances returned by the dynamic inventory sources in the controller
By default, the dynamic inventory sources in automation controller (such as AWS and Google) return all instances available to the cloud credentials being used. They are automatically joined into groups based on various attributes. For example, AWS instances are grouped by region, by tag name, value, and security groups. To target specific instances in your environment, write your playbooks so that they target the generated group names.
For example:
---
- hosts: tag_Name_webserver
  tasks:
  ...
You can also use the Limit field in the Job Template settings to limit a playbook run to a certain group, groups, hosts, or a combination of them. The syntax is the same as the --limit parameter on the ansible-playbook command line.
You can also create your own groups by copying the auto-generated groups into your custom groups. Make sure that the Overwrite option is disabled on your dynamic inventory source, otherwise subsequent synchronization operations delete and replace your custom groups.
17.12. Use an unreleased module from Ansible source with automation controller
If there is a feature that is available in the latest Ansible core branch that you want to use with your automation controller system, making use of it in automation controller is simple.
First, determine which is the updated module you want to use from the available Ansible Core Modules or Ansible Extra Modules GitHub repositories.
Next, create a new directory, at the same directory level of your Ansible source playbooks, named /library.
When this is created, copy the module you want to use and drop it into the /library directory. It is consumed first by your system modules and can be removed once you have updated the stable version with your normal package manager.
17.13. Use callback plugins with automation controller
Ansible has a flexible method of handling actions during playbook runs, called callback plugins. You can use these plugins with automation controller to do things such as notify services upon playbook runs or failures, or send emails after every playbook run.
For official documentation on the callback plugin architecture, see Developing plugins.
Automation controller does not support the stdout callback plugin because Ansible only permits one, and it is already being used for streaming event data.
You might also want to review some example plugins, which should be modified for site-specific purposes, such as those available at: https://github.com/ansible/ansible/tree/devel/lib/ansible/plugins/callback
To use these plugins, put the callback plugin .py file into a directory called /callback_plugins alongside your playbook in your automation controller Project. Then, specify their paths (one path per line) in the Ansible Callback Plugins field of the Job settings:
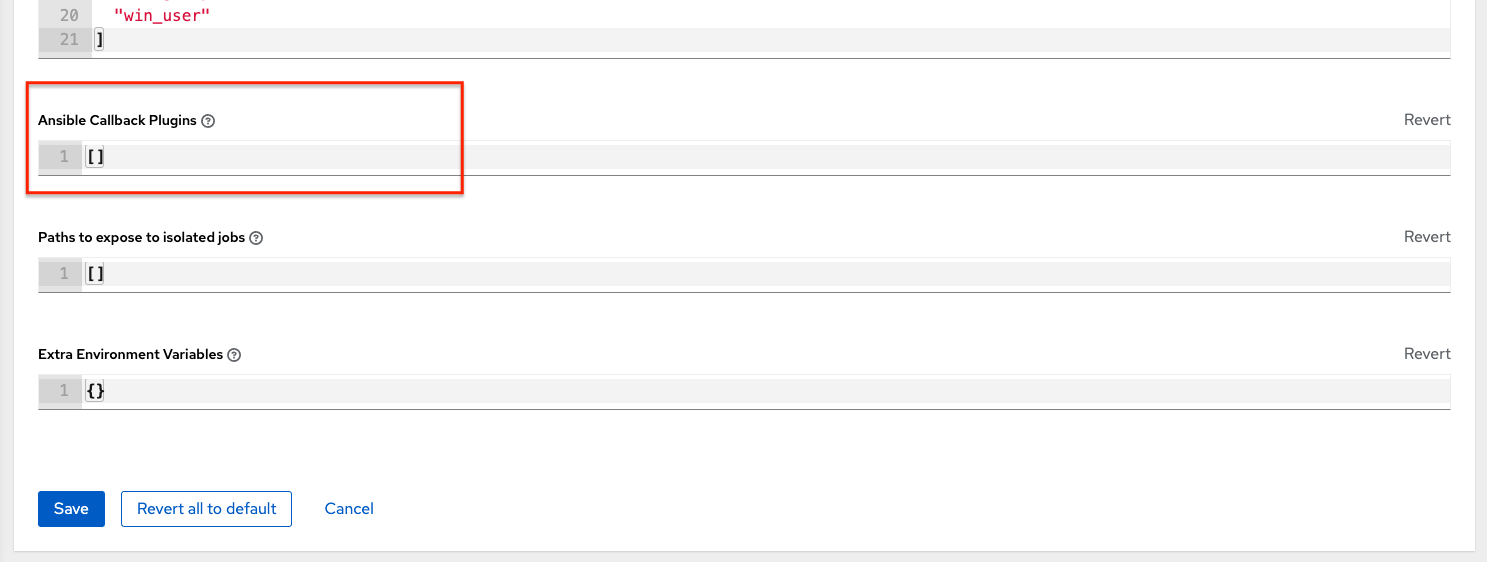
To have most callbacks shipped with Ansible applied globally, you must add them to the callback_whitelist section of your ansible.cfg.
If you have custom callbacks, see Enabling callback plugins.
17.14. Connect to Windows with winrm
By default, automation controller attempts to ssh to hosts.
You must add the winrm connection information to the group variables to which the Windows hosts belong.
To get started, edit the Windows group in which the hosts reside and place the variables in the source or edit screen for the group.
To add winrm connection info:
-
Edit the properties for the selected group by clicking on the Edit
 icon of the group name that contains the Windows servers. In the "variables" section, add your connection information as follows:
 ansible_connection: winrm
When complete, save your edits. If Ansible was previously attempting an SSH connection and failed, you should re-run the job template.
17.15. Import existing inventory files and host/group vars into automation controller
To import an existing static inventory and the accompanying host and group variables into automation controller, your inventory must be in a structure similar to the following:
inventory/
|-- group_vars
|   `-- mygroup
|-- host_vars
|   `-- myhost
`-- hosts
To import these hosts and vars, run the awx-manage command:
awx-manage inventory_import --source=inventory/ \
  --inventory-name="My Controller Inventory"
If you only have a single flat file of inventory, a file called ansible-hosts, for example, import it as follows:
awx-manage inventory_import --source=./ansible-hosts \
  --inventory-name="My Controller Inventory"
In case of conflicts or to overwrite an inventory named "My Controller Inventory", run:
awx-manage inventory_import --source=inventory/ \
  --inventory-name="My Controller Inventory" \
  --overwrite --overwrite-vars
If you receive an error, such as:
ValueError: need more than 1 value to unpack
Create a directory to hold the hosts file, as well as the group_vars:
mkdir -p inventory-directory/group_vars
Then, for each of the groups that have :vars listed, create a file called inventory-directory/group_vars/<groupname> and format the variables in YAML format.
The importer then handles the conversion correctly.