Using the Cryostat dashboard
Abstract
Preface
The Red Hat build of Cryostat is a container-native implementation of JDK Flight Recorder (JFR) that you can use to securely monitor the Java Virtual Machine (JVM) performance in workloads that run on an OpenShift Container Platform cluster. You can use Cryostat 2.4 to start, stop, retrieve, archive, import, and export JFR data for JVMs inside your containerized applications by using a web console or an HTTP API.
Depending on your use case, you can store and analyze your recordings directly on your Red Hat OpenShift cluster by using the built-in tools that Cryostat provides or you can export recordings to an external monitoring application to perform a more in-depth analysis of your recorded data.
Red Hat build of Cryostat is a Technology Preview feature only. Technology Preview features are not supported with Red Hat production service level agreements (SLAs) and might not be functionally complete. Red Hat does not recommend using them in production. These features provide early access to upcoming product features, enabling customers to test functionality and provide feedback during the development process.
For more information about the support scope of Red Hat Technology Preview features, see Technology Preview Features Support Scope.
Making open source more inclusive
Red Hat is committed to replacing problematic language in our code, documentation, and web properties. We are beginning with these four terms: master, slave, blacklist, and whitelist. Because of the enormity of this endeavor, these changes will be implemented gradually over several upcoming releases. For more details, see our CTO Chris Wright’s message.
Chapter 1. Overview of the Cryostat dashboard
The Cryostat Dashboard provides a high-level overview of the target Java Virtual Machines (JVMs) that are connected to Cryostat and helps you to identify and resolve performance issues, review system efficiency, and determine how to optimize application performance.
By using the dashboard, you can view performance data for your JDK Flight Recorder (JFR) recordings and important information and metrics about your target JVMs. The dashboard displays static and dynamic information about your connected JVMs through a variety of dashboard cards, which you can organize and customize in different layouts, according to your requirements.
You access the dashboard directly from the navigation menu of the Cryostat console by clicking Dashboard.
Chapter 2. Dashboard cards
The Cryostat Dashboard displays information about target Java Virtual Machines (JVMs) in the form of cards on the user interface. Each card displays a different set of information or metrics about the selected target JVM. For example, heap usage, thread statistics, or JVM vendor information.
The following dashboard cards are available:
- Target JVM Details
- Automated Analysis
- MBean Metrics Chart
Target JVM Details
The Target JVM Details card provides high-level information that relates to the selected target JVM.
Figure 2.1. Example Target JVM Details dashboard card
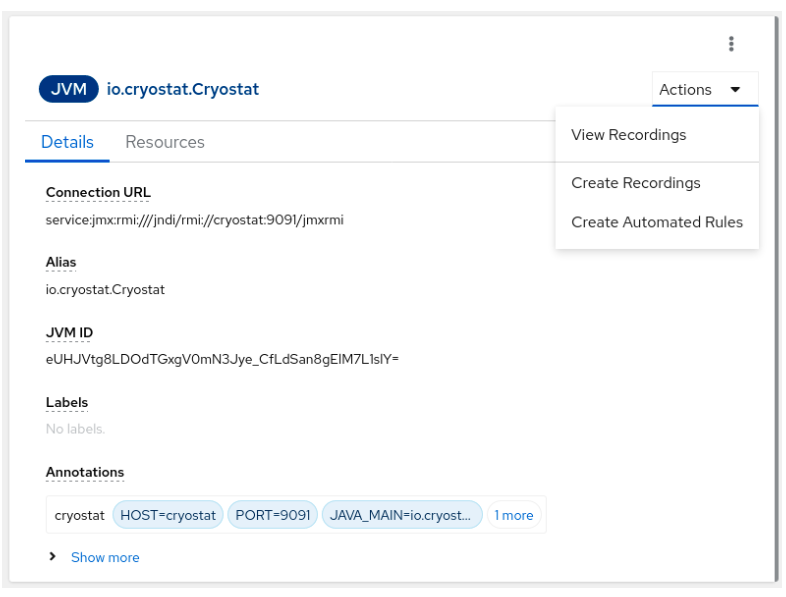
On the Details tab, you can view information such as the connection URL, labels, JVM ID, and annotations for the selected target JVM. You can also view the JVM start time, version, vendor, operating system architecture, and the number of available processors.
You can perform additional actions directly from the card. By clicking Actions, you can view recordings, start new recordings, or create automated rules for the selected target JVM.
On the Resources tab, you can view details about the resources related to the target JVM, such as the number of active recordings or the number of automated rules.
Automated Analysis
Automated analysis is a JDK Mission Control (JMC) tool with which you can diagnose issues with your target JVMs by analyzing JDK Flight Recording (JFR) data for potential errors. Cryostat integrates the JMC automated analysis reports and produces a report that shows any errors associated with the data. The Automated Analysis card provides an alternative way of displaying this report information.
Figure 2.2. Example Automated Analysis dashboard card
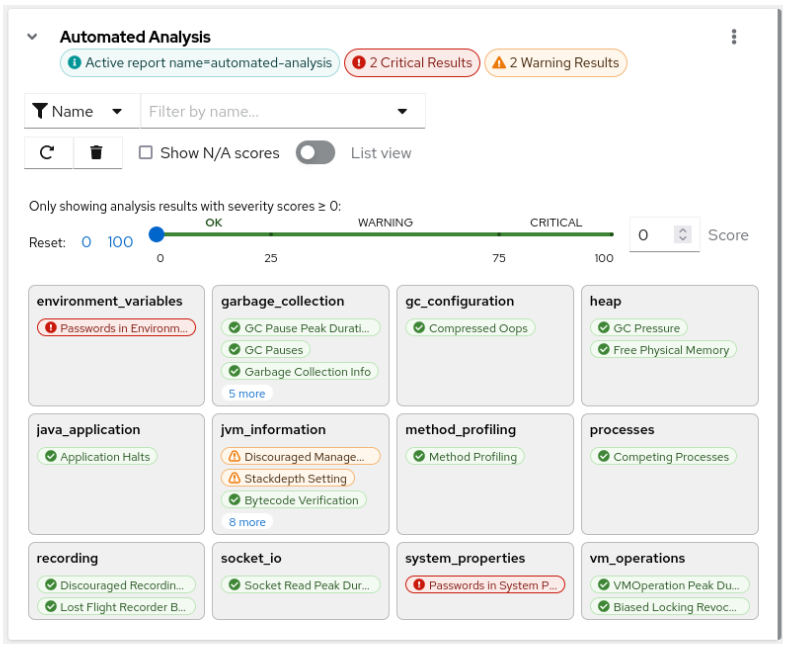
On the Automated Analysis card, you can create a JFR recording that Cryostat uses to periodically evaluate any configuration or performance issues with the selected target JVM. After you click the corresponding label for each result, the card displays the following information:
- Results of the analysis categorized according to a severity score. Severity scores range from 0, which means no error, to 100, which means a potentially critical error. You might also receive a severity score marked as N/A, which indicates that the severity score is not applicable to the recording.
- A description of the results that includes a summary, an explanation of the error, and a potential solution, if applicable.
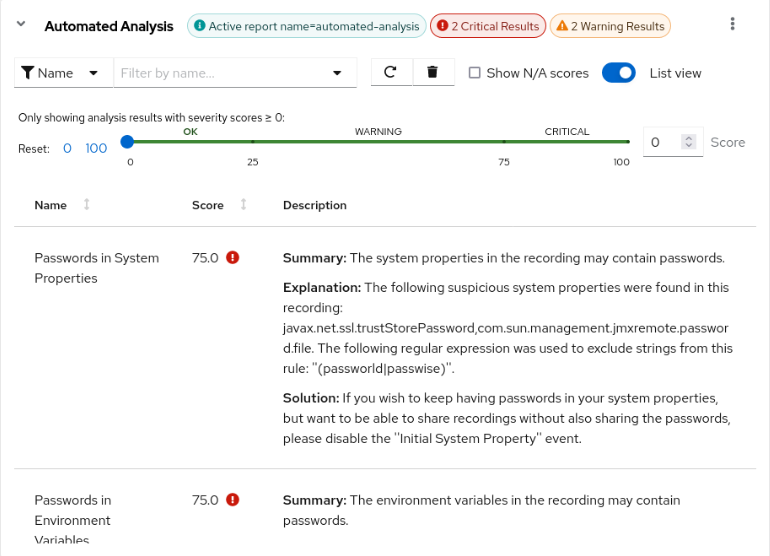
You can choose to display the card information in a list format by selecting List view.
Figure 2.3. Example Automated Analysis dashboard card displayed as a list view
MBean Metrics Chart
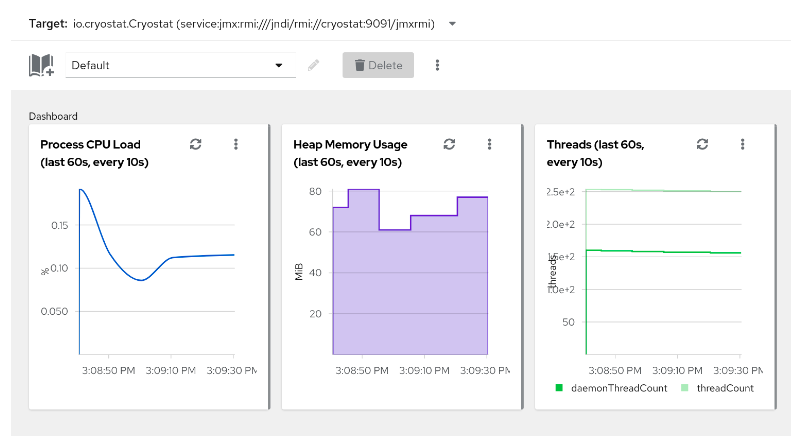
The MBean Metrics Chart card displays performance metrics about the target JVM through remote access to supported MXBeans interfaces of the JVM, including Thread, Runtime, OperatingSystem, and Memory MXBeans.
Cryostat gathers a range of data from these MXBeans interfaces and displays them in the MBean Metrics Chart cards.
From the Performance Metric field, you can select the metric you want to view, for example, Process CPU Load, Physical Memory, or Heap Memory Usage, then configure the card details.
Once configured, cards showing each metric are displayed on your dashboard.
Figure 2.4. Example MBean Metrics Chart card
Chapter 3. Customizing the Cryostat dashboard
The Cryostat Dashboard displays information about target Java Virtual Machines (JVMs) in the form of cards on the user interface. You can configure the cards and customize different dashboard layouts according to your requirements.
3.1. Creating a custom dashboard layout
Create customized layouts to organize the display of dashboard cards, according to your requirements. You can organize the cards in different configurations and create custom views to display the data and specific metrics that are most relevant to your current requirements.
You can add, remove, and arrange the cards and switch between different layouts. You can also create layout templates that you can download, reuse, or share with other users so that they can access the same information and metrics. By using dashboard layouts, you do not need to modify your dashboard manually each time you want to view different information.
Prerequisites
- Created a Cryostat instance in your project.
- Logged in to your Cryostat web console.
- Created a target JVM to monitor.
Procedure
- On the Cryostat web console, click Dashboard.
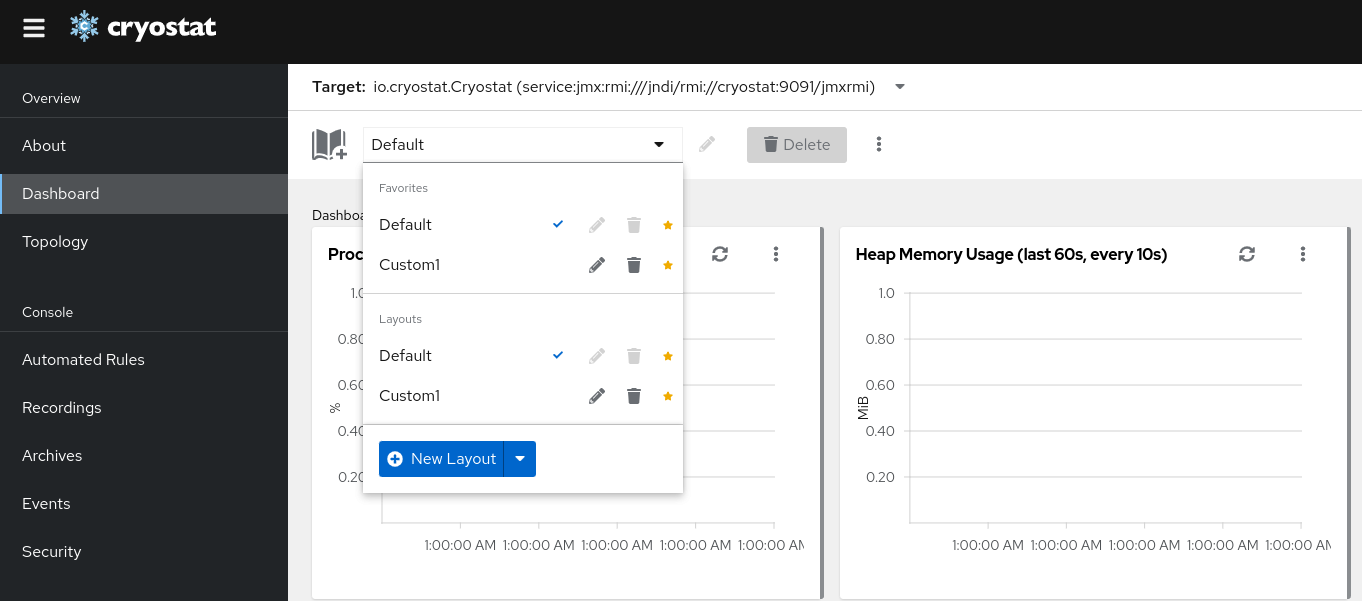
- On the toolbar, click the layout selector dropdown menu.
Click New Layout.
Figure 3.1. Creating a new dashboard layout
The new layout is assigned a default name. To specify a different name, click the pencil icon beside the name.
(Optional): To select an existing template or upload a new one, click the expandable menu on the New Layout button.
Figure 3.2. Creating a new dashboard layout by using a template
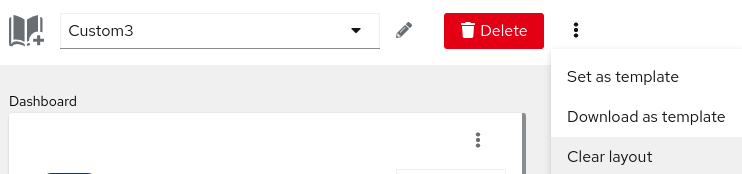
(Optional): To set or download a layout as a template or to clear the layout, click the more options icon (⋮):
Figure 3.3. Setting or downloading a layout as a template or clearing the layout
- To set the current layout as a template, select Set as template.
-
To download the current layout as a template, select Download as template. The template is downloaded as a
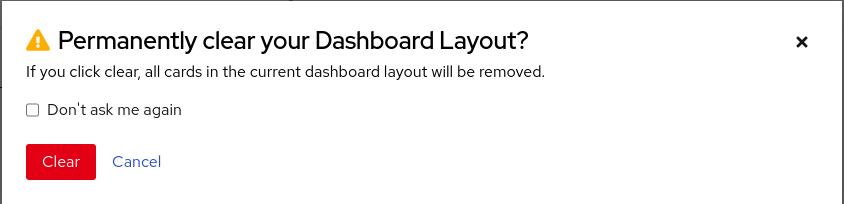
.jsonfile. To clear the current layout, select Clear layout. A confirmation dialog then opens. To confirm that you want to permanently clear the current dashboard layout, click Clear.
Figure 3.4. Clearing a dashboard layout

3.2. Adding cards to a dashboard layout
You can select and configure the cards you want to add to the Cryostat Dashboard. Each card displays a different set of information or metrics about the target JVM you select.
Prerequisites
- Created a Cryostat instance in your project.
- Logged in to your Cryostat web console.
- Created a target JVM to monitor.
Procedure
- On the Cryostat web console, click Dashboard.
- From the Target dropdown menu, select the target JVM whose information you want to view.
- To add a dashboard card, click the Add card icon. The Dashboard card catalog window opens.
- From the available cards types, select a card to add to your dashboard layout and click Finish. Repeat this step for each card that you want to add.
Some cards require additional configuration, for example, the MBeans Metrics Chart card. In this instance, click Next to access the configuration wizard, specify the values you require, then click Finish.
Revised on 2023-12-12 18:03:30 UTC