Dashboard Guide
Monitoring Ceph Cluster with Ceph Dashboard
Abstract
Chapter 1. Ceph dashboard overview
As a storage administrator, the Red Hat Ceph Storage Dashboard provides management and monitoring capabilities, allowing you to administer and configure the cluster, as well as visualize information and performance statistics related to it. The dashboard uses a web server hosted by the ceph-mgr daemon.
The dashboard is accessible from a web browser and includes many useful management and monitoring features, for example, to configure manager modules and monitor the state of OSDs.
The Ceph dashboard provides the following features:
- Multi-user and role management
The dashboard supports multiple user accounts with different permissions and roles. User accounts and roles can be managed using both, the command line and the web user interface. The dashboard supports various methods to enhance password security. Password complexity rules may be configured, requiring users to change their password after the first login or after a configurable time period.
For more information, see Managing roles on the Ceph Dashboard and Managing users on the Ceph dashboard.
- Single Sign-On (SSO)
The dashboard supports authentication with an external identity provider using the SAML 2.0 protocol.
For more information, see Enabling single sign-on for the Ceph dashboard.
- Auditing
The dashboard backend can be configured to log all PUT, POST and DELETE API requests in the Ceph manager log.
For more information about using the manager modules with the dashboard, see Viewing and editing the manager modules of the Ceph cluster on the dashboard.
Management features
The Red Hat Ceph Storage Dashboard includes various management features.
- Viewing cluster hierarchy
You can view the CRUSH map, for example, to determine which host a specific OSD ID is running on. This is helpful if an issue with an OSD occurs.
For more information, see Viewing the CRUSH map of the Ceph cluster on the dashboard.
- Configuring manager modules
You can view and change parameters for Ceph manager modules.
For more information, see Viewing and editing the manager modules of the Ceph cluster on the dashboard.
- Embedded Grafana dashboards
Ceph Dashboard Grafana dashboards might be embedded in external applications and web pages to surface information with Prometheus modules gathering the performance metrics.
For more information, see Ceph Dashboard components.
- Viewing and filtering logs
You can view event and audit cluster logs and filter them based on priority, keyword, date, or time range.
For more information, see Filtering logs of the Ceph cluster on the dashboard.
- Toggling dashboard components
You can enable and disable dashboard components so only the features you need are available.
For more information, see Toggling Ceph dashboard features.
- Managing OSD settings
You can set cluster-wide OSD flags using the dashboard. You can also Mark OSDs up, down or out, purge and reweight OSDs, perform scrub operations, modify various scrub-related configuration options, select profiles to adjust the level of backfilling activity. You can set and change the device class of an OSD, display and sort OSDs by device class. You can deploy OSDs on new drives and hosts.
For more information, see Managing Ceph OSDs on the dashboard.
- Viewing alerts
The alerts page allows you to see details of current alerts.
For more information, see Viewing alerts on the Ceph dashboard.
- Upgrading
You can upgrade the Ceph cluster version using the dashboard.
For more information, see Upgrading a cluster.
- Quality of service for images
You can set performance limits on images, for example limiting IOPS or read BPS burst rates.
For more information, see Managing block device images on the Ceph dashboard.
Monitoring features
Monitor different features from within the Red Hat Ceph Storage Dashboard.
- Username and password protection
You can access the dashboard only by providing a configurable username and password.
For more information, see Managing users on the Ceph dashboard.
- Overall cluster health
Displays performance and capacity metrics. This also displays the overall cluster status, storage utilization, for example, number of objects, raw capacity, usage per pool, a list of pools and their status and usage statistics.
For more information, see Viewing and editing the configuration of the Ceph cluster on the dashboard.
- Hosts
Provides a list of all hosts associated with the cluster along with the running services and the installed Ceph version.
For more information, see Monitoring hosts of the Ceph cluster on the dashboard.
- Performance counters
Displays detailed statistics for each running service.
For more information, see Monitoring services of the Ceph cluster on the dashboard.
- Monitors
Lists all Monitors, their quorum status and open sessions.
For more information, see Monitoring monitors of the Ceph cluster on the dashboard.
- Configuration editor
Displays all the available configuration options, their descriptions, types, default, and currently set values. These values are editable.
For more information, see Viewing and editing the configuration of the Ceph cluster on the dashboard.
- Cluster logs
Displays and filters the latest updates to the cluster’s event and audit log files by priority, date, or keyword.
For more information, see Filtering logs of the Ceph cluster on the dashboard.
- Device management
Lists all hosts known by the Orchestrator. Lists all drives attached to a host and their properties. Displays drive health predictions, SMART data, and blink enclosure LEDs.
For more information, see Monitoring hosts of the Ceph cluster on the dashboard.
- View storage cluster capacity
You can view raw storage capacity of the Red Hat Ceph Storage cluster in the Capacity pages of the Ceph dashboard.
For more information, see Understanding the landing page of the Ceph dashboard.
- Pools
Lists and manages all Ceph pools and their details. For example: applications, placement groups, replication size, EC profile, quotas, and CRUSH ruleset.
For more information, see Understanding the landing page of the Ceph dashboard and Monitoring pools of the Ceph cluster on the dashboard.
- OSDs
Lists and manages all OSDs, their status, and usage statistics. OSDs also lists detailed information, for example, attributes, OSD map, metadata, and performance counters for read and write operations. OSDs also lists all drives that are associated with an OSD.
For more information, see Monitoring Ceph OSDs on the dashboard.
- Images
Lists all Ceph Block Device (RBD) images and their properties such as size, objects, and features. Create, copy, modify and delete RBD images. Create, delete, and rollback snapshots of selected images, protect or unprotect these snapshots against modification. Copy or clone snapshots, flatten cloned images.
NoteThe performance graph for I/O changes in the Overall Performance tab for a specific image shows values only after specifying the pool that includes that image by setting the
rbd_stats_poolparameter in Cluster→Manager modules→Prometheus.For more information, see Monitoring block device images on the Ceph dashboard.
- Block device mirroring
Enables and configures Ceph Block Device (RBD) mirroring to a remote Ceph server. Lists all active sync daemons and their status, pools and RBD images including their synchronization state.
For more information, see Mirroring view on the Ceph dashboard.
- Ceph File Systems
Lists all active Ceph File System (CephFS) clients and associated pools, including their usage statistics. Evict active CephFS clients, manage CephFS quotas and snapshots, and browse a CephFS directory structure.
For more information, see Monitoring Ceph file systems on the dashboard.
- Object Gateway (RGW)
Lists all active object gateways and their performance counters. Displays and manages, including add, edit, and delete, Ceph Object Gateway users and their details, for example quotas, as well as the users’ buckets and their details, for example, owner or quotas.
For more information, see Monitoring Ceph Object Gateway daemons on the dashboard.
Security features
The dashboard provides the following security features.
- SSL and TLS support
All HTTP communication between the web browser and the dashboard is secured via SSL. A self-signed certificate can be created with a built-in command, but it is also possible to import custom certificates signed and issued by a Certificate Authority (CA).
For more information, see Ceph Dashboard installation and access.
Prerequisites
- System administrator level experience.
1.1. Ceph Dashboard components
The functionality of the dashboard is provided by multiple components.
- The Cephadm application for deployment.
-
The embedded dashboard
ceph-mgrmodule. -
The embedded Prometheus
ceph-mgrmodule. - The Prometheus time-series database.
- The Prometheus node-exporter daemon, running on each host of the storage cluster.
- The Grafana platform to provide monitoring user interface and alerting.
- The node-proxy agent, a background service on all nodes that collects hardware health data from Out-of-Band (OOB) interfaces like iLO. The hardware monitoring capability is enabled by default in IBM Storage Ceph Ceph 7.1, allowing users to view related data in the Dashboard or logs without manual configuration.
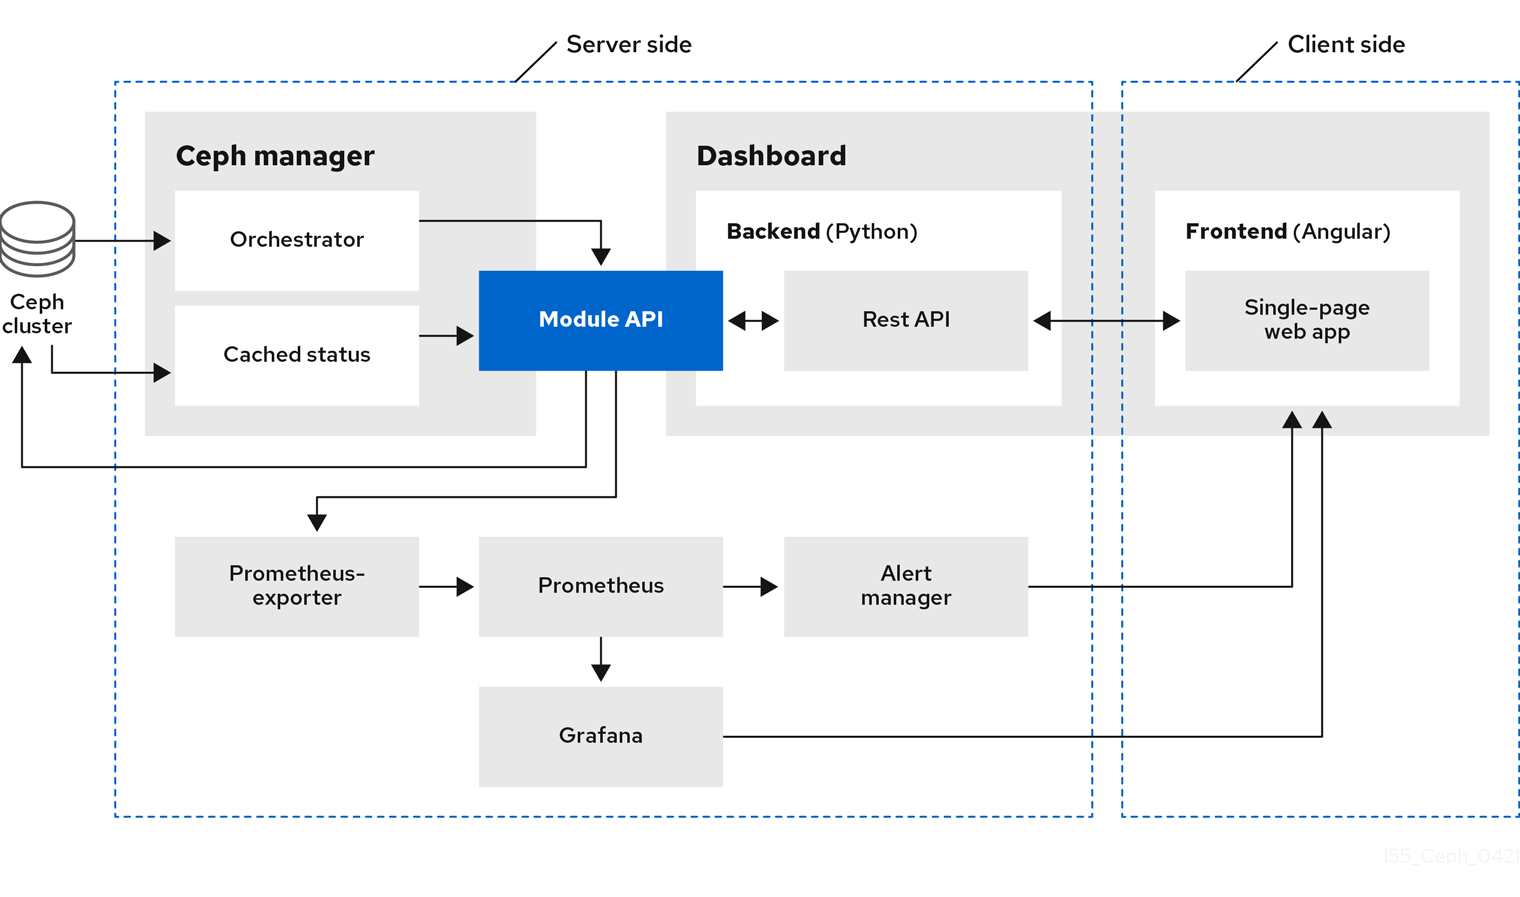
1.2. Red Hat Ceph Storage Dashboard architecture
The Dashboard architecture depends on the Ceph manager dashboard plugin and other components. See the following diagram to understand how the Ceph manager and dashboard work together.
Chapter 2. Ceph Dashboard installation and access
As a system administrator, you can access the dashboard with the credentials provided on bootstrapping the cluster.
Cephadm installs the dashboard by default. Following is an example of the dashboard URL:
URL: https://host01:8443/
User: admin
Password: zbiql951arUpdate the browser and clear the cookies prior to accessing the dashboard URL.
The following are the Cephadm bootstrap options that are available for the Ceph dashboard configurations:
- [–initial-dashboard-user INITIAL_DASHBOARD_USER] - Use this option while bootstrapping to set initial-dashboard-user.
- [–initial-dashboard-password INITIAL_DASHBOARD_PASSWORD] - Use this option while bootstrapping to set initial-dashboard-password.
- [–ssl-dashboard-port SSL_DASHBOARD_PORT] - Use this option while bootstrapping to set custom dashboard port other than default 8443.
- [–dashboard-key DASHBOARD_KEY] - Use this option while bootstrapping to set Custom key for SSL.
- [–dashboard-crt DASHBOARD_CRT] - Use this option while bootstrapping to set Custom certificate for SSL.
- [–skip-dashboard] - Use this option while bootstrapping to deploy Ceph without dashboard.
- [–dashboard-password-noupdate] - Use this option while bootstrapping if you used above two options and don’t want to reset password at the first time login.
- [–allow-fqdn-hostname] - Use this option while bootstrapping to allow hostname that is fully-qualified.
- [–skip-prepare-host] - Use this option while bootstrapping to skip preparing the host.
To avoid connectivity issues with dashboard related external URL, use the fully qualified domain names (FQDN) for hostnames, for example, host01.ceph.redhat.com.
Open the Grafana URL directly in the client internet browser and accept the security exception to see the graphs on the Ceph dashboard. Reload the browser to view the changes.
Example
[root@host01 ~]# cephadm bootstrap --mon-ip 127.0.0.1 --registry-json cephadm.txt --initial-dashboard-user admin --initial-dashboard-password zbiql951ar --dashboard-password-noupdate --allow-fqdn-hostname
While boostrapping the storage cluster using cephadm, you can use the --image option for either custom container images or local container images.
You have to change the password the first time you log into the dashboard with the credentials provided on bootstrapping only if --dashboard-password-noupdate option is not used while bootstrapping. You can find the Ceph dashboard credentials in the var/log/ceph/cephadm.log file. Search with the "Ceph Dashboard is now available at" string.
This section covers the following tasks:
- Network port requirements for Ceph dashboard.
- Accessing the Ceph dashboard.
- Expanding the cluster on the Ceph dashboard.
- Upgrading a cluster.
- Toggling Ceph dashboard features.
- Understanding the landing page of the Ceph dashboard.
- Enabling Red Hat Ceph Storage Dashboard manually.
- Changing the dashboard password using the Ceph dashboard.
- Changing the Ceph dashboard password using the command line interface.
-
Setting
adminuser password for Grafana. - Creating an admin account for syncing users to the Ceph dashboard.
- Syncing users to the Ceph dashboard using the Red Hat Single Sign-On.
- Enabling single sign-on for the Ceph dashboard.
- Disabling single sign-on for the Ceph dashboard.
2.1. Network port requirements for Ceph Dashboard
The Ceph dashboard components use certain TCP network ports which must be accessible. By default, the network ports are automatically opened in firewalld during installation of Red Hat Ceph Storage.
| Port | Use | Originating Host | Destination Host |
|---|---|---|---|
| 8443 | The dashboard web interface | IP addresses that need access to Ceph Dashboard UI and the host under Grafana server, since the AlertManager service can also initiate connections to the Dashboard for reporting alerts. | The Ceph Manager hosts. |
| 3000 | Grafana | IP addresses that need access to Grafana Dashboard UI and all Ceph Manager hosts and Grafana server. | The host or hosts running Grafana server. |
| 2049 | NFS-Ganesha | IP addresses that need access to NFS. | The IP addresses that provide NFS services. |
| 9095 | Default Prometheus server for basic Prometheus graphs | IP addresses that need access to Prometheus UI and all Ceph Manager hosts and Grafana server or Hosts running Prometheus. | The host or hosts running Prometheus. |
| 9093 | Prometheus Alertmanager | IP addresses that need access to Alertmanager Web UI and all Ceph Manager hosts and Grafana server or Hosts running Prometheus. | All Ceph Manager hosts and the host under Grafana server. |
| 9094 | Prometheus Alertmanager for configuring a highly available cluster made from multiple instances | All Ceph Manager hosts and the host under Grafana server. |
Prometheus Alertmanager High Availability (peer daemon sync), so both |
| 9100 |
The Prometheus | Hosts running Prometheus that need to view Node Exporter metrics Web UI and All Ceph Manager hosts and Grafana server or Hosts running Prometheus. | All storage cluster hosts, including MONs, OSDS, Grafana server host. |
| 9283 | Ceph Manager Prometheus exporter module | Hosts running Prometheus that need access to Ceph Exporter metrics Web UI and Grafana server. | All Ceph Manager hosts. |
2.2. Accessing the Ceph dashboard
You can access the Ceph dashboard to administer and monitor your Red Hat Ceph Storage cluster.
Prerequisites
- Successful installation of Red Hat Ceph Storage Dashboard.
- NTP is synchronizing clocks properly.
Procedure
Enter the following URL in a web browser:
Syntax
https://HOST_NAME:PORTReplace:
- HOST_NAME with the fully qualified domain name (FQDN) of the active manager host.
PORT with port
8443Example
https://host01:8443You can also get the URL of the dashboard by running the following command in the Cephadm shell:
Example
[ceph: root@host01 /]# ceph mgr servicesThis command will show you all endpoints that are currently configured. Look for the
dashboardkey to obtain the URL for accessing the dashboard.
-
On the login page, enter the username
adminand the default password provided during bootstrapping. - You have to change the password the first time you log in to the Red Hat Ceph Storage dashboard.
After logging in, the dashboard default landing page is displayed, which provides details, a high-level overview of status, performance, inventory, and capacity metrics of the Red Hat Ceph Storage cluster.
Figure 2.1. Ceph dashboard landing page

-
Click the menu icon (
 ) on the dashboard landing page to collapse or display the options in the vertical menu.
2.3. Expanding the cluster on the Ceph dashboard
You can use the dashboard to expand the Red Hat Ceph Storage cluster for adding hosts, adding OSDs, and creating services such as Alertmanager, Cephadm-exporter, CephFS-mirror, Grafana, ingress, MDS, NFS, node-exporter, Prometheus, RBD-mirror, and Ceph Object Gateway.
Once you bootstrap a new storage cluster, the Ceph Monitor and Ceph Manager daemons are created and the cluster is in HEALTH_WARN state. After creating all the services for the cluster on the dashboard, the health of the cluster changes from HEALTH_WARN to HEALTH_OK status.
Prerequisites
- Bootstrapped storage cluster. See Bootstrapping a new storage cluster section in the Red Hat Ceph Storage Installation Guide for more details.
-
At least
cluster-managerrole for the user on the Red Hat Ceph Storage Dashboard. See the User roles and permissions on the Ceph dashboard section in the Red Hat Ceph Storage Dashboard Guide for more details.
Procedure
Copy the admin key from the bootstrapped host to other hosts:
Syntax
ssh-copy-id -f -i /etc/ceph/ceph.pub root@HOST_NAMEExample
[ceph: root@host01 /]# ssh-copy-id -f -i /etc/ceph/ceph.pub root@host02 [ceph: root@host01 /]# ssh-copy-id -f -i /etc/ceph/ceph.pub root@host03- Log in to the dashboard with the default credentials provided during bootstrap.
- Change the password and log in to the dashboard with the new password .
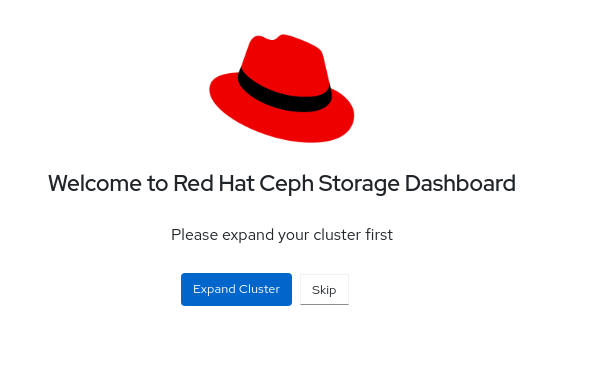
On the landing page, click Expand Cluster.
NoteClicking Expand Cluster opens a wizard taking you through the expansion steps. To skip and add hosts and services separately, click Skip.
Figure 2.2. Expand cluster
Add hosts. This needs to be done for each host in the storage cluster.
- In the Add Hosts step, click Add.
Provide the hostname. This is same as the hostname that was provided while copying the key from the bootstrapped host.
NoteAdd multiple hosts by using a comma-separated list of host names, a range expression, or a comma separated range expression.
- Optional: Provide the respective IP address of the host.
- Optional: Select the labels for the hosts on which the services are going to be created. Click the pencil icon to select or add new labels.
Click Add Host.
The new host is displayed in the Add Hosts pane.
- Click Next.
Create OSDs:
- In the Create OSDs step, for Primary devices, Click Add.
- In the Primary Devices window, filter for the device and select the device.
- Click Add.
- Optional: In the Create OSDs window, if you have any shared devices such as WAL or DB devices, then add the devices.
- Optional: In the Features section, select Encryption to encrypt the features.
- Click Next.
Create services:
- In the Create Services step, click Create.
In the Create Service form:
- Select a service type.
-
Provide the service ID. The ID is a unique name for the service. This ID is used in the service name, which is
service_type.service_id.
…Optional: Select if the service is Unmanaged.
+ When Unmanaged services is selected, the orchestrator will not start or stop any daemon associated with this service. Placement and all other properties are ignored.
- Select if the placement is by hosts or label.
- Select the hosts.
In the Count field, provide the number of daemons or services that need to be deployed.
Click Create Service.
The new service is displayed in the Create Services pane.
- In the Create Service window, Click Next.
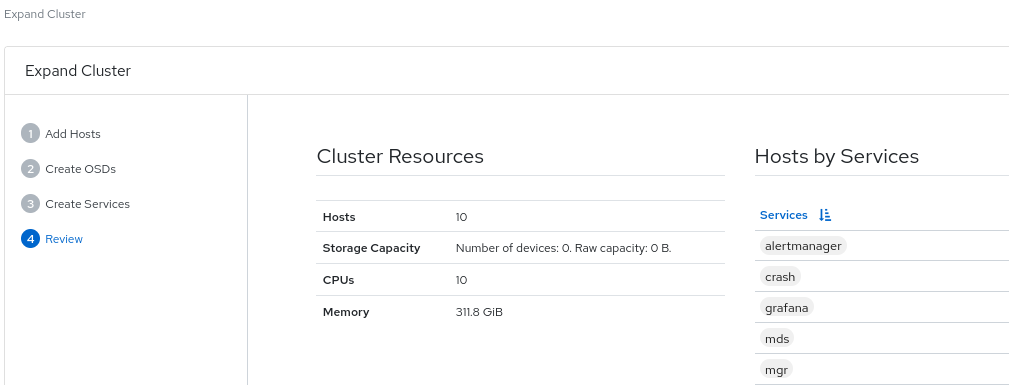
Review the cluster expansion details.
Review the Cluster Resources, Hosts by Services, Host Details. To edit any parameters, click Back and follow the previous steps.
Figure 2.3. Review cluster
Click Expand Cluster.
The
Cluster expansion displayednotification is displayed and the cluster status changes to HEALTH_OK on the dashboard.
Verification
Log in to the
cephadmshell:Example
[root@host01 ~]# cephadm shellRun the
ceph -scommand.Example
[ceph: root@host01 /]# ceph -sThe health of the cluster is HEALTH_OK.
2.4. Upgrading a cluster
Upgrade Ceph clusters using the dashboard.
Cluster images are pulled automatically from registry.redhat.io. Optionally, use custom images for upgrade.
Procedure
View if cluster upgrades are available and upgrade as needed from Administration > Upgrade on the dashboard.
NoteIf the dashboard displays the
Not retrieving upgradesmessage, check if the registries were added to the container configuration files with the appropriate log in credentials to Podman or docker.Click Pause or Stop during the upgrade process, if needed. The upgrade progress is shown in the progress bar along with information messages during the upgrade.
NoteWhen stopping the upgrade, the upgrade is first paused and then prompts you to stop the upgrade.
- Optional. View cluster logs during the upgrade process from the Cluster logs section of the Upgrade page.
- Verify that the upgrade is completed successfully by confirming that the cluster status displays OK state.
2.5. Toggling Ceph dashboard features
You can customize the Red Hat Ceph Storage dashboard components by enabling or disabling features on demand. All features are enabled by default. When disabling a feature, the web-interface elements become hidden and the associated REST API end-points reject any further requests for that feature. Enabling and disabling dashboard features can be done from the command-line interface or the web interface.
Available features:
Ceph Block Devices:
-
Image management,
rbd -
Mirroring,
mirroring
-
Image management,
-
Ceph File System,
cephfs -
Ceph Object Gateway,
rgw -
NFS Ganesha gateway,
nfs
By default, the Ceph Manager is collocated with the Ceph Monitor.
You can disable multiple features at once.
Once a feature is disabled, it can take up to 20 seconds to reflect the change in the web interface.
Prerequisites
- Installation and configuration of the Red Hat Ceph Storage dashboard software.
- User access to the Ceph Manager host or the dashboard web interface.
- Root level access to the Ceph Manager host.
Procedure
To toggle the dashboard features from the dashboard web interface:
- On the dashboard landing page, go to Administration→Manager Modules and select the dashboard module.
- Click Edit.
- In the Edit Manager module form, you can enable or disable the dashboard features by selecting or clearing the check boxes next to the different feature names.
- After the selections are made, click Update.
To toggle the dashboard features from the command-line interface:
Log in to the Cephadm shell:
Example
[root@host01 ~]# cephadm shellList the feature status:
Example
[ceph: root@host01 /]# ceph dashboard feature statusDisable a feature:
[ceph: root@host01 /]# ceph dashboard feature disable rgwThis example disables the Ceph Object Gateway feature.
Enable a feature:
[ceph: root@host01 /]# ceph dashboard feature enable cephfsThis example enables the Ceph Filesystem feature.
2.6. Understanding the landing page of the Ceph dashboard
The landing page displays an overview of the entire Ceph cluster using navigation bars and individual panels.
The menu bar provides the following options:
- Tasks and Notifications
- Provides task and notification messages.
- Help
- Provides links to the product and REST API documentation, details about the Red Hat Ceph Storage Dashboard, and a form to report an issue.
- Dashboard Settings
- Gives access to user management and telemetry configuration.
- User
- Use this menu to see log in status, to change a password, and to sign out of the dashboard.
Figure 2.4. Menu bar

The navigation menu can be opened or hidden by clicking the navigation menu icon
 .
.
Dashboard
The main dashboard displays specific information about the state of the cluster.
The main dashboard can be accessed at any time by clicking Dashboard from the navigation menu.
The dashboard landing page organizes the panes into different categories.
Figure 2.5. Ceph dashboard landing page

- Details
- Displays specific cluster information and if telemetry is active or inactive.
- Status
- Displays the health of the cluster and host and daemon states. The current health status of the Ceph storage cluster is displayed. Danger and warning alerts are displayed directly on the landing page. Click View alerts for a full list of alerts.
- Capacity
- Displays storage usage metrics. This is displayed as a graph of used, warning, and danger. The numbers are in percentages and in GiB.
- Inventory
Displays the different parts of the cluster, how many are available, and their status.
Link directly from Inventory to specific inventory items, where available.
- Hosts
- Displays the total number of hosts in the Ceph storage cluster.
- Monitors
- Displays the number of Ceph Monitors and the quorum status.
- Managers
- Displays the number and status of the Manager Daemons.
- OSDs
- Displays the total number of OSDs in the Ceph Storage cluster and the number that are up, and in.
- Pools
- Displays the number of storage pools in the Ceph cluster.
- PGs
Displays the total number of placement groups (PGs). The PG states are divided into Working and Warning to simplify the display. Each one encompasses multiple states. + The Working state includes PGs with any of the following states:
- activating
- backfill_wait
- backfilling
- creating
- deep
- degraded
- forced_backfill
- forced_recovery
- peering
- peered
- recovering
- recovery_wait
- repair
- scrubbing
- snaptrim
- snaptrim_wait + The Warning state includes PGs with any of the following states:
- backfill_toofull
- backfill_unfound
- down
- incomplete
- inconsistent
- recovery_toofull
- recovery_unfound
- remapped
- snaptrim_error
- stale
- undersized
- Object Gateways
- Displays the number of Object Gateways in the Ceph storage cluster.
- Metadata Servers
- Displays the number and status of metadata servers for Ceph File Systems (CephFS).
- Cluster Utilization
- The Cluster Utilization pane displays information related to data transfer speeds. Select the time range for the data output from the list. Select a range between the last 5 minutes to the last 24 hours.
- Used Capacity (RAW)
- Displays usage in GiB.
- IOPS
- Displays total I/O read and write operations per second.
- OSD Latencies
- Displays total applies and commits per millisecond.
- Client Throughput
- Displays total client read and write throughput in KiB per second.
- Recovery Throughput
- Displays the rate of cluster healing and balancing operations. For example, the status of any background data that may be moving due to a loss of disk is displayed. The information is displayed in bytes per second.
2.7. Changing the dashboard password using the Ceph dashboard
By default, the password for accessing dashboard is randomly generated by the system while bootstrapping the cluster. You have to change the password the first time you log in to the Red Hat Ceph Storage dashboard. You can change the password for the admin user using the dashboard.
Prerequisites
- A running Red Hat Ceph Storage cluster.
Procedure
Log in to the dashboard:
Syntax
https://HOST_NAME:8443- Go to User→Change password on the menu bar.
- Enter the old password, for verification.
- In the New password field enter a new password. Passwords must contain a minimum of 8 characters and cannot be the same as the last one.
- In the Confirm password field, enter the new password again to confirm.
Click Change Password.
You will be logged out and redirected to the login screen. A notification appears confirming the password is changed.
2.8. Changing the Ceph dashboard password using the command line interface
If you have forgotten your Ceph dashboard password, you can change the password using the command line interface.
Prerequisites
- A running Red Hat Ceph Storage cluster.
- Root-level access to the host on which the dashboard is installed.
Procedure
Log into the Cephadm shell:
Example
[root@host01 ~]# cephadm shellCreate the
dashboard_password.ymlfile:Example
[ceph: root@host01 /]# touch dashboard_password.ymlEdit the file and add the new dashboard password:
Example
[ceph: root@host01 /]# vi dashboard_password.ymlReset the dashboard password:
Syntax
ceph dashboard ac-user-set-password DASHBOARD_USERNAME -i PASSWORD_FILEExample
[ceph: root@host01 /]# ceph dashboard ac-user-set-password admin -i dashboard_password.yml
{"username": "admin", "password": "$2b$12$i5RmvN1PolR61Fay0mPgt.GDpcga1QpYsaHUbJfoqaHd1rfFFx7XS", "roles": ["administrator"], "name": null, "email": null, "lastUpdate": , "enabled": true, "pwdExpirationDate": null, "pwdUpdateRequired": false}
Verification
- Log in to the dashboard with your new password.
2.9. Setting admin user password for Grafana
By default, cephadm does not create an admin user for Grafana. With the Ceph Orchestrator, you can create an admin user and set the password.
With these credentials, you can log in to the storage cluster’s Grafana URL with the given password for the admin user.
Prerequisites
- A running Red Hat Ceph Storage cluster with the monitoring stack installed.
-
Root-level access to the
cephadmhost. -
The
dashboardmodule enabled.
Procedure
As a root user, create a
grafana.ymlfile and provide the following details:Syntax
service_type: grafana
spec:
  initial_admin_password: PASSWORD
Example
service_type: grafana
spec:
  initial_admin_password: mypassword
Mount the
grafana.ymlfile under a directory in the container:Example
[root@host01 ~]# cephadm shell --mount grafana.yml:/var/lib/ceph/grafana.ymlNoteEvery time you exit the shell, you have to mount the file in the container before deploying the daemon.
Optional: Check if the
dashboardCeph Manager module is enabled:Example
[ceph: root@host01 /]# ceph mgr module lsOptional: Enable the
dashboardCeph Manager module:Example
[ceph: root@host01 /]# ceph mgr module enable dashboardApply the specification using the
orchcommand:Syntax
ceph orch apply -i FILE_NAME.ymlExample
[ceph: root@host01 /]# ceph orch apply -i /var/lib/ceph/grafana.ymlRedeploy
grafanaservice:Example
[ceph: root@host01 /]# ceph orch redeploy grafanaThis creates an admin user called
adminwith the given password and the user can log in to the Grafana URL with these credentials.
Verification:
Log in to Grafana with the credentials:
Syntax
https://HOST_NAME:PORTExample
https://host01:3000/
2.10. Enabling Red Hat Ceph Storage Dashboard manually
If you have installed a Red Hat Ceph Storage cluster by using --skip-dashboard option during bootstrap, you can see that the dashboard URL and credentials are not available in the bootstrap output. You can enable the dashboard manually using the command-line interface. Although the monitoring stack components such as Prometheus, Grafana, Alertmanager, and node-exporter are deployed, they are disabled and you have to enable them manually.
Prerequisite
-
A running Red Hat Ceph Storage cluster installed with
--skip-dashboardoption during bootstrap. - Root-level access to the host on which the dashboard needs to be enabled.
Procedure
Log into the Cephadm shell:
Example
[root@host01 ~]# cephadm shellCheck the Ceph Manager services:
Example
[ceph: root@host01 /]# ceph mgr services

{
    "prometheus": "http://10.8.0.101:9283/"
}
You can see that the Dashboard URL is not configured.
Enable the dashboard module:
Example
[ceph: root@host01 /]# ceph mgr module enable dashboardCreate the self-signed certificate for the dashboard access:
Example
[ceph: root@host01 /]# ceph dashboard create-self-signed-certNoteYou can disable the certificate verification to avoid certification errors.
Check the Ceph Manager services:
Example
[ceph: root@host01 /]# ceph mgr services

{
    "dashboard": "https://10.8.0.101:8443/",
    "prometheus": "http://10.8.0.101:9283/"
}
Create the admin user and password to access the Red Hat Ceph Storage dashboard:
Syntax
echo -n "PASSWORD" > PASSWORD_FILE
ceph dashboard ac-user-create admin -i PASSWORD_FILE administrator
Example
[ceph: root@host01 /]# echo -n "p@ssw0rd" > password.txt [ceph: root@host01 /]# ceph dashboard ac-user-create admin -i password.txt administrator- Enable the monitoring stack. See the Enabling monitoring stack section in the Red Hat Ceph Storage Dashboard Guide for details.
2.11. Creating an admin account for syncing users to the Ceph dashboard
You have to create an admin account to synchronize users to the Ceph dashboard.
After creating the account, use Red Hat Single Sign-on (SSO) to synchronize users to the Ceph dashboard. See the Syncing users to the Ceph dashboard using Red Hat Single Sign-On section in the Red Hat Ceph Storage Dashboard Guide.
Prerequisites
- A running Red Hat Ceph Storage cluster.
- Dashboard is installed.
- Admin level access to the dashboard.
- Users are added to the dashboard.
- Root-level access on all the hosts.
- Java OpenJDK installed. For more information, see the Installing a JRE on RHEL by using yum section of the Installing and using OpenJDK 8 for RHEL guide for OpenJDK on the Red Hat Customer Portal.
- Red hat Single Sign-On installed from a ZIP file. See the Installing RH-SSO from a ZIP File section of the Server Installation and Configuration Guide for Red Hat Single Sign-On on the Red Hat Customer Portal.
Procedure
- Download the Red Hat Single Sign-On 7.4.0 Server on the system where Red Hat Ceph Storage is installed.
Unzip the folder:
[root@host01 ~]# unzip rhsso-7.4.0.zipNavigate to the
standalone/configurationdirectory and open thestandalone.xmlfor editing:[root@host01 ~]# cd standalone/configuration [root@host01 configuration]# vi standalone.xmlFrom the
bindirectory of the newly createdrhsso-7.4.0folder, run theadd-user-keycloakscript to add the initial administrator user:[root@host01 bin]# ./add-user-keycloak.sh -u admin-
Replace all instances of
localhostand two instances of127.0.0.1with the IP address of the machine where Red Hat SSO is installed. Start the server. From the
bindirectory ofrh-sso-7.4folder, run thestandaloneboot script:[root@host01 bin]# ./standalone.shCreate the admin account in https: IP_ADDRESS :8080/auth with a username and password:
NoteYou have to create an admin account only the first time that you log into the console.
- Log into the admin console with the credentials created.
2.12. Syncing users to the Ceph dashboard using Red Hat Single Sign-On
You can use Red Hat Single Sign-on (SSO) with Lightweight Directory Access Protocol (LDAP) integration to synchronize users to the Red Hat Ceph Storage Dashboard.
The users are added to specific realms in which they can access the dashboard through SSO without any additional requirements of a password.
Prerequisites
- A running Red Hat Ceph Storage cluster.
- Dashboard is installed.
- Admin level access to the dashboard.
- Users are added to the dashboard. See the Creating users on Ceph dashboard section in the Red Hat Ceph Storage Dashboard Guide.
- Root-level access on all the hosts.
- Admin account created for syncing users. See the Creating an admin account for syncing users to the Ceph dashboard section in the Red Hat Ceph Storage Dashboard Guide.
Procedure
- To create a realm, click the Master drop-down menu. In this realm, you can provide access to users and applications.
In the Add Realm window, enter a case-sensitive realm name and set the parameter Enabled to ON and click Create:

In the Realm Settings tab, set the following parameters and click Save:
- Enabled - ON
- User-Managed Access - ON
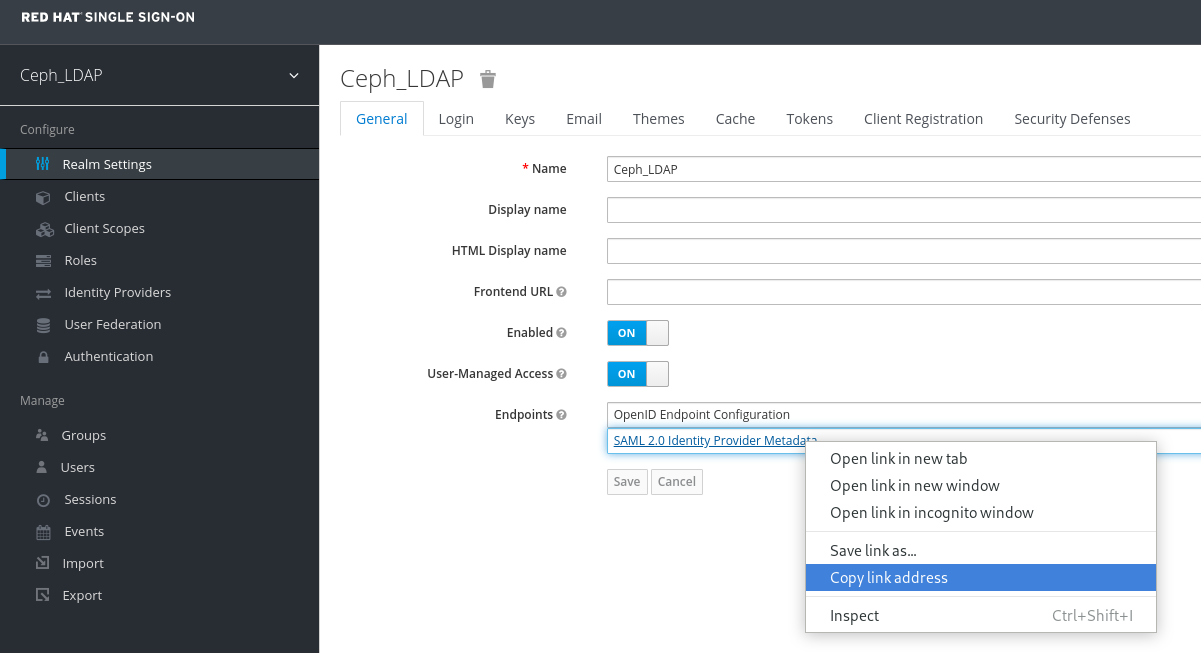
Make a note of the link address of SAML 2.0 Identity Provider Metadata to paste in Client Settings.
In the Clients tab, click Create:

In the Add Client window, set the following parameters and click Save:
Client ID - BASE_URL:8443/auth/saml2/metadata
Example
https://example.ceph.redhat.com:8443/auth/saml2/metadata
- Client Protocol - saml
In the Client window, under Settings tab, set the following parameters:
Expand Table 2.2. Client Settings tab Name of the parameter Syntax Example Client IDBASE_URL:8443/auth/saml2/metadata
https://example.ceph.redhat.com:8443/auth/saml2/metadata
EnabledON
ON
Client Protocolsaml
saml
Include AuthnStatementON
ON
Sign DocumentsON
ON
Signature AlgorithmRSA_SHA1
RSA_SHA1
SAML Signature Key NameKEY_ID
KEY_ID
Valid Redirect URLsBASE_URL:8443/*
https://example.ceph.redhat.com:8443/*
Base URLBASE_URL:8443
https://example.ceph.redhat.com:8443/
Master SAML Processing URLhttps://localhost:8080/auth/realms/REALM_NAME/protocol/saml/descriptor
https://localhost:8080/auth/realms/Ceph_LDAP/protocol/saml/descriptor
NotePaste the link of SAML 2.0 Identity Provider Metadata from Realm Settings tab.
Under Fine Grain SAML Endpoint Configuration, set the following parameters and click Save:
Expand Table 2.3. Fine Grain SAML configuration Name of the parameter Syntax Example Assertion Consumer Service POST Binding URL
BASE_URL:8443/#/dashboard
https://example.ceph.redhat.com:8443/#/dashboard
Assertion Consumer Service Redirect Binding URL
BASE_URL:8443/#/dashboard
https://example.ceph.redhat.com:8443/#/dashboard
Logout Service Redirect Binding URL
BASE_URL:8443/
https://example.ceph.redhat.com:8443/
In the Clients window, Mappers tab, set the following parameters and click Save:
Expand Table 2.4. Client Mappers tab Name of the parameter Value Protocolsaml
Nameusername
Mapper PropertyUser Property
Propertyusername
SAML Attribute nameusername
In the Clients Scope tab, select role_list:
- In Mappers tab, select role list, set the Single Role Attribute to ON.
Select User_Federation tab:
- In User Federation window, select ldap from the drop-down menu:
In User_Federation window, Settings tab, set the following parameters and click Save:
Expand Table 2.5. User Federation Settings tab Name of the parameter Value Console Display Namerh-ldap
Import UsersON
Edit_ModeREAD_ONLY
Username LDAP attributeusername
RDN LDAP attributeusername
UUID LDAP attributensuniqueid
User Object ClassesinetOrgPerson, organizationalPerson, rhatPerson
Connection URLExample: ldap://ldap.corp.redhat.com Click Test Connection. You will get a notification that the LDAP connection is successful.
Users DNou=users, dc=example, dc=com
Bind Typesimple
Click Test authentication. You will get a notification that the LDAP authentication is successful.
In Mappers tab, select first name row and edit the following parameter and Click Save:
- LDAP Attribute - givenName
In User_Federation tab, Settings tab, Click Synchronize all users:
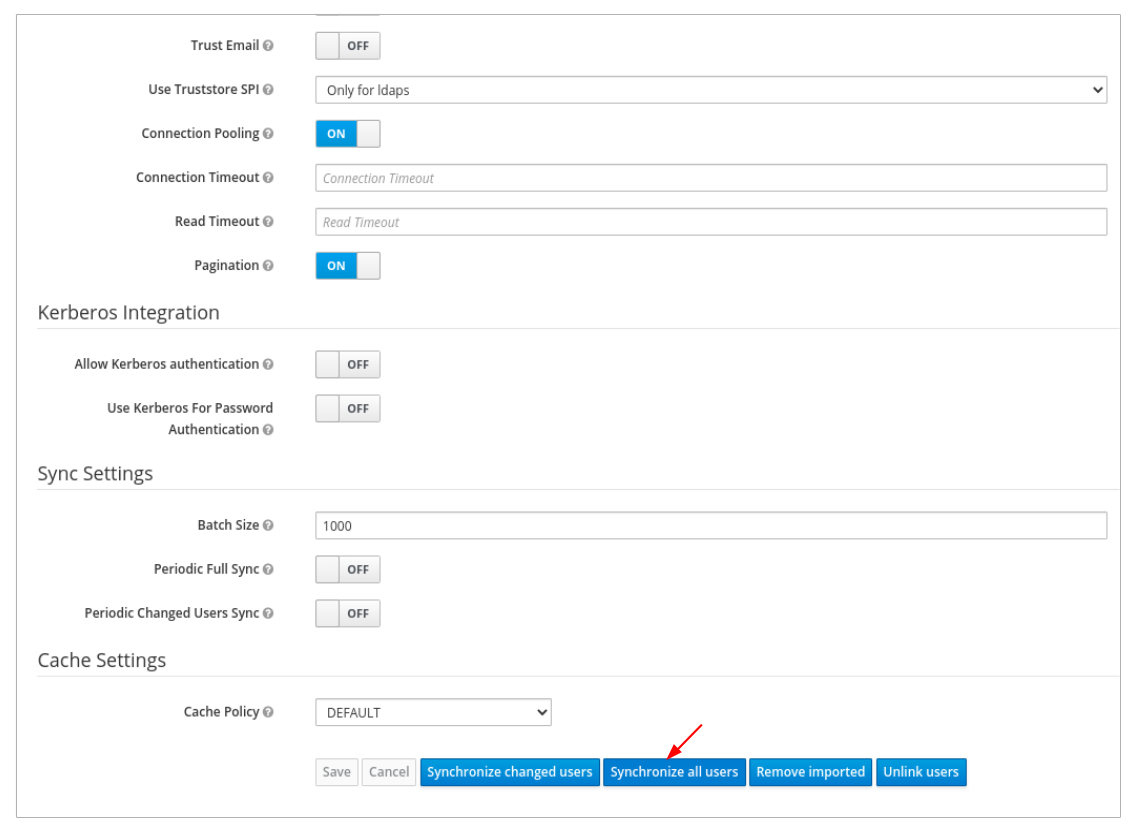
You will get a notification that the sync of users is finished successfully.
In the Users tab, search for the user added to the dashboard and click the Search icon:
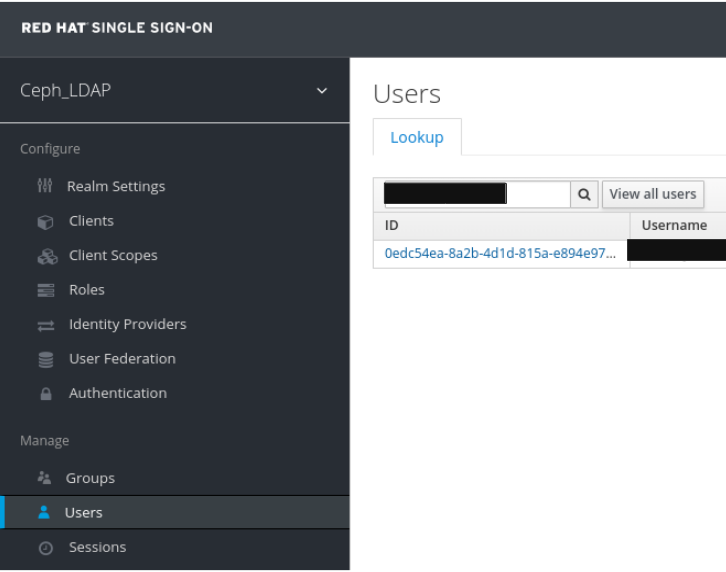
To view the user , click the specific row. You should see the federation link as the name provided for the User Federation.
 Important
Do not add users manually as the users will not be synchronized by LDAP. If added manually, delete the user by clicking Delete.
NoteIf Red Hat SSO is currently being used within your work environment, be sure to first enable SSO. For more information, see the Enabling Single Sign-On for the Ceph Dashboard section in the Red Hat Ceph Storage Dashboard Guide.
Verification
Users added to the realm and the dashboard can access the Ceph dashboard with their mail address and password.
Example
https://example.ceph.redhat.com:8443
2.13. Enabling Single Sign-On for the Ceph Dashboard
The Ceph Dashboard supports external authentication of users with the Security Assertion Markup Language (SAML) 2.0 protocol. Before using single sign-On (SSO) with the Ceph dashboard, create the dashboard user accounts and assign the desired roles. The Ceph Dashboard performs authorization of the users and the authentication process is performed by an existing Identity Provider (IdP). You can enable single sign-on using the SAML protocol.
Prerequisites
- A running Red Hat Ceph Storage cluster.
- Installation of the Ceph Dashboard.
- Root-level access to The Ceph Manager hosts.
Procedure
To configure SSO on Ceph Dashboard, run the following command:
Syntax
cephadm shell CEPH_MGR_HOST ceph dashboard sso setup saml2 CEPH_DASHBOARD_BASE_URL IDP_METADATA IDP_USERNAME_ATTRIBUTE IDP_ENTITY_ID SP_X_509_CERT SP_PRIVATE_KEYExample
[root@host01 ~]# cephadm shell host01 ceph dashboard sso setup saml2 https://dashboard_hostname.ceph.redhat.com:8443 idp-metadata.xml username https://10.70.59.125:8080/auth/realms/realm_name /home/certificate.txt /home/private-key.txtReplace
-
CEPH_MGR_HOST with Ceph
mgrhost. For example,host01 - CEPH_DASHBOARD_BASE_URL with the base URL where Ceph Dashboard is accessible.
- IDP_METADATA with the URL to remote or local path or content of the IdP metadata XML. The supported URL types are http, https, and file.
- Optional: IDP_USERNAME_ATTRIBUTE with the attribute used to get the username from the authentication response. Defaults to uid.
- Optional: IDP_ENTITY_ID with the IdP entity ID when more than one entity ID exists on the IdP metadata.
- Optional: SP_X_509_CERT with the file path of the certificate used by Ceph Dashboard for signing and encryption.
- Optional: SP_PRIVATE_KEY with the file path of the private key used by Ceph Dashboard for signing and encryption.
-
CEPH_MGR_HOST with Ceph
Verify the current SAML 2.0 configuration:
Syntax
cephadm shell CEPH_MGR_HOST ceph dashboard sso show saml2Example
[root@host01 ~]# cephadm shell host01 ceph dashboard sso show saml2To enable SSO, run the following command:
Syntax
cephadm shell CEPH_MGR_HOST ceph dashboard sso enable saml2
SSO is "enabled" with "SAML2" protocol.
Example
[root@host01 ~]# cephadm shell host01 ceph dashboard sso enable saml2Open your dashboard URL.
Example
https://dashboard_hostname.ceph.redhat.com:8443- On the SSO page, enter the login credentials. SSO redirects to the dashboard web interface.
2.14. Disabling Single Sign-On for the Ceph Dashboard
You can disable single sign-on for Ceph Dashboard using the SAML 2.0 protocol.
Prerequisites
- A running Red Hat Ceph Storage cluster.
- Installation of the Ceph Dashboard.
- Root-level access to The Ceph Manager hosts.
- Single sign-on enabled for Ceph Dashboard
Procedure
To view status of SSO, run the following command:
Syntax
cephadm shell CEPH_MGR_HOST ceph dashboard sso statusExample
[root@host01 ~]#  cephadm shell host01 ceph dashboard sso status
SSO is "enabled" with "SAML2" protocol.
To disable SSO, run the following command:
Syntax
cephadm shell CEPH_MGR_HOST ceph dashboard sso disable
SSO is "disabled".
Example
[root@host01 ~]# cephadm shell host01 ceph dashboard sso disable
Chapter 3. Managing roles on the Ceph dashboard
As a storage administrator, you can create, edit, clone, and delete roles on the dashboard.
By default, there are eight system roles. You can create custom roles and give permissions to those roles. These roles can be assigned to users based on the requirements.
This section covers the following administrative tasks:
3.1. User roles and permissions on the Ceph dashboard
User accounts are associated with a set of roles that define the specific dashboard functionality which can be accessed.
The Red Hat Ceph Storage dashboard functionality or modules are grouped within a security scope. Security scopes are predefined and static. The current available security scopes on the Red Hat Ceph Storage dashboard are:
- cephfs: Includes all features related to CephFS management.
- config-opt: Includes all features related to management of Ceph configuration options.
- dashboard-settings: Allows to edit the dashboard settings.
- grafana: Include all features related to Grafana proxy.
- hosts: Includes all features related to the Hosts menu entry.
- log: Includes all features related to Ceph logs management.
- manager: Includes all features related to Ceph manager management.
- monitor: Includes all features related to Ceph monitor management.
- nfs-ganesha: Includes all features related to NFS-Ganesha management.
- osd: Includes all features related to OSD management.
- pool: Includes all features related to pool management.
- prometheus: Include all features related to Prometheus alert management.
- rbd-image: Includes all features related to RBD image management.
- rbd-mirroring: Includes all features related to RBD mirroring management.
- rgw: Includes all features related to Ceph object gateway (RGW) management.
A role specifies a set of mappings between a security scope and a set of permissions. There are four types of permissions:
- Read
- Create
- Update
- Delete
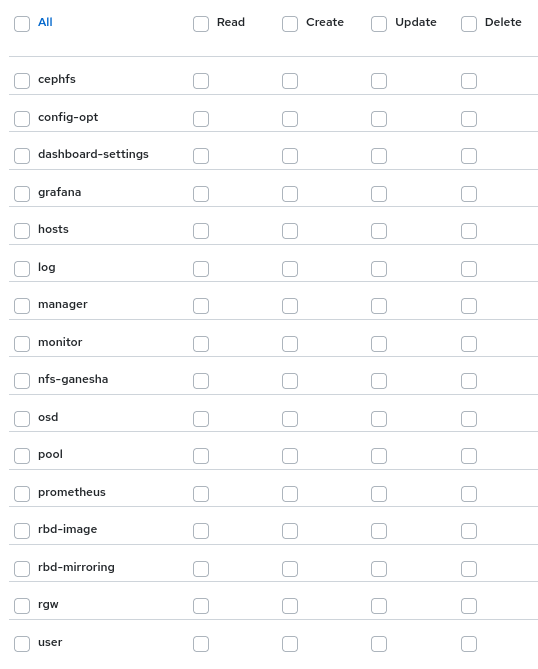
The list of system roles are:
- administrator: Allows full permissions for all security scopes.
- block-manager: Allows full permissions for RBD-image and RBD-mirroring scopes.
- cephfs-manager: Allows full permissions for the Ceph file system scope.
- cluster-manager: Allows full permissions for the hosts, OSDs, monitor, manager, and config-opt scopes.
- ganesha-manager: Allows full permissions for the NFS-Ganesha scope.
- pool-manager: Allows full permissions for the pool scope.
- read-only: Allows read permission for all security scopes except the dashboard settings and config-opt scopes.
- rgw-manager: Allows full permissions for the Ceph object gateway scope.

For example, you need to provide rgw-manager access to the users for all Ceph object gateway operations.
3.2. Creating roles on the Ceph dashboard
You can create custom roles on the dashboard and these roles can be assigned to users based on their roles.
Prerequisites
- A running Red Hat Ceph Storage cluster.
- Dashboard is installed.
- Admin-level access to the dashboard.
Procedure
- Log in to the Dashboard.
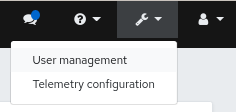
Click the Dashboard Settings icon and then click User management.
- On Roles tab, click Create.
In the Create Role window, set the Name, Description, and select the Permissions for this role, and then click the Create Role button.
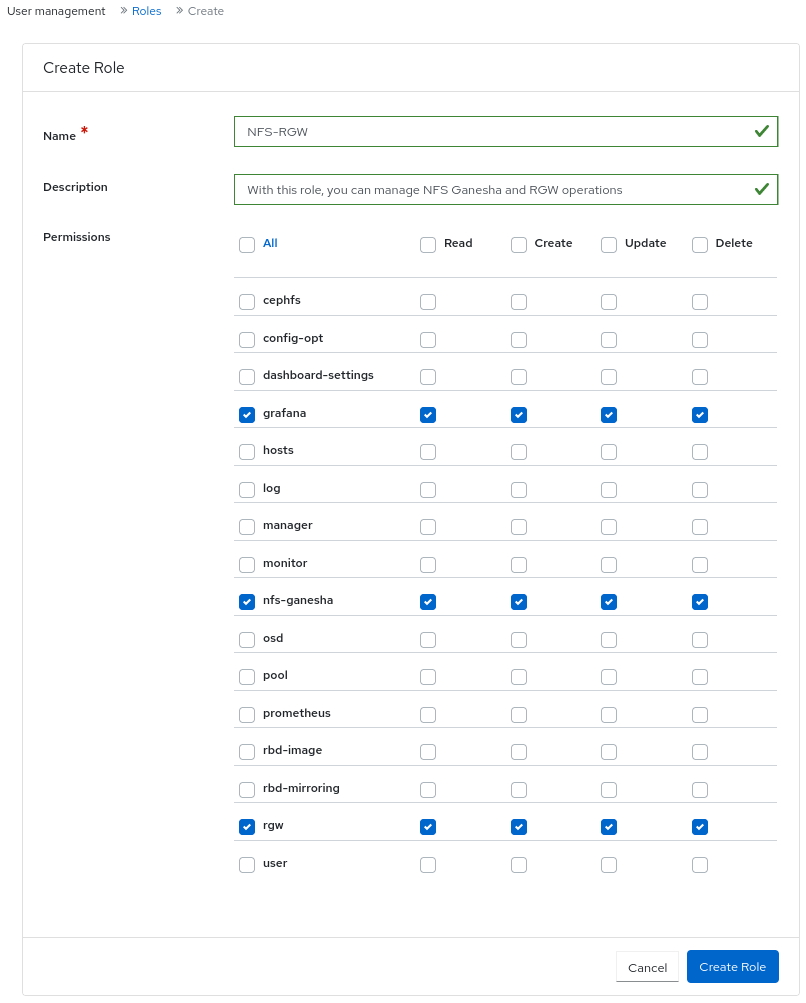
In this example, the user assigned with
ganesha-managerandrgw-managerroles can manage all NFS-Ganesha gateway and Ceph object gateway operations.- You get a notification that the role was created successfully.
- Click on the Expand/Collapse icon of the row to view the details and permissions given to the roles.
3.3. Editing roles on the Ceph dashboard
The dashboard allows you to edit roles on the dashboard.
Prerequisites
- A running Red Hat Ceph Storage cluster.
- Dashboard is installed.
- Admin-level access to the dashboard.
- A role is created on the dashboard.
Procedure
- Log in to the Dashboard.
Click the Dashboard Settings icon and then click User management.

- On Roles tab, click the role you want to edit.
In the Edit Role window, edit the parameters, and then click Edit Role.
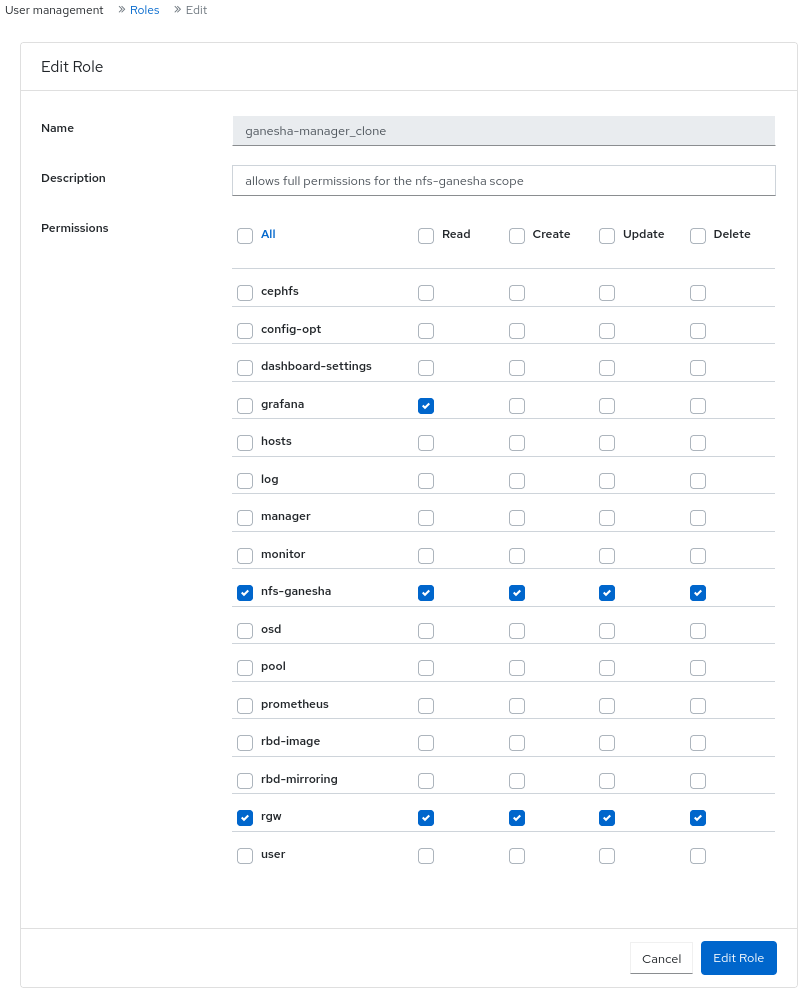
- You get a notification that the role was updated successfully.
3.4. Cloning roles on the Ceph dashboard
When you want to assign additional permissions to existing roles, you can clone the system roles and edit it on the Red Hat Ceph Storage Dashboard.
Prerequisites
- A running Red Hat Ceph Storage cluster.
- Dashboard is installed.
- Admin-level access to the dashboard.
- Roles are created on the dashboard.
Procedure
- Log in to the Dashboard.
Click the Dashboard Settings icon and then click User management.

- On Roles tab, click the role you want to clone.
- Select Clone from the Edit drop-down menu.
In the Clone Role dialog box, enter the details for the role, and then click Clone Role.
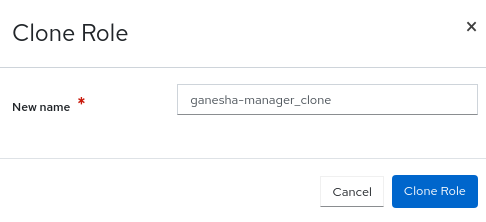
- Once you clone the role, you can customize the permissions as per the requirements.
3.5. Deleting roles on the Ceph dashboard
You can delete the custom roles that you have created on the Red Hat Ceph Storage dashboard.
You cannot delete the system roles of the Ceph Dashboard.
Prerequisites
- A running Red Hat Ceph Storage cluster.
- Dashboard is installed.
- Admin-level access to the dashboard.
- A custom role is created on the dashboard.
Procedure
- Log in to the Dashboard.
Click the Dashboard Settings icon and then select User management.

- On the Roles tab, click the role you want to delete and select Delete from the action drop-down.
In the Delete Role notification, select Yes, I am sure and click Delete Role.
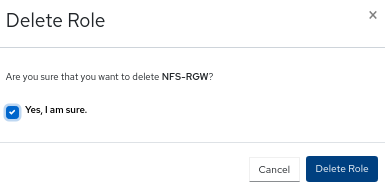
Chapter 4. Managing users on the Ceph dashboard
As a storage administrator, you can create, edit, and delete users with specific roles on the Red Hat Ceph Storage dashboard. Role-based access control is given to each user based on their roles and the requirements.
You can also create, edit, import, export, and delete Ceph client authentication keys on the dashboard. Once you create the authentication keys, you can rotate keys using command-line interface (CLI). Key rotation meets the current industry and security compliance requirements.
This section covers the following administrative tasks:
4.1. Creating users on the Ceph dashboard
You can create users on the Red Hat Ceph Storage dashboard with adequate roles and permissions based on their roles. For example, if you want the user to manage Ceph object gateway operations, then you can give rgw-manager role to the user.
Prerequisites
- A running Red Hat Ceph Storage cluster.
- Dashboard is installed.
- Admin-level access to the dashboard.
The Red Hat Ceph Storage Dashboard does not support any email verification when changing a users password. This behavior is intentional, because the Dashboard supports Single Sign-On (SSO) and this feature can be delegated to the SSO provider.
Procedure
- Log in to the Dashboard.
Click the Dashboard Settings icon and then click User management.

- On Users tab, click Create.
In the Create User window, set the Username and other parameters including the roles, and then click Create User.
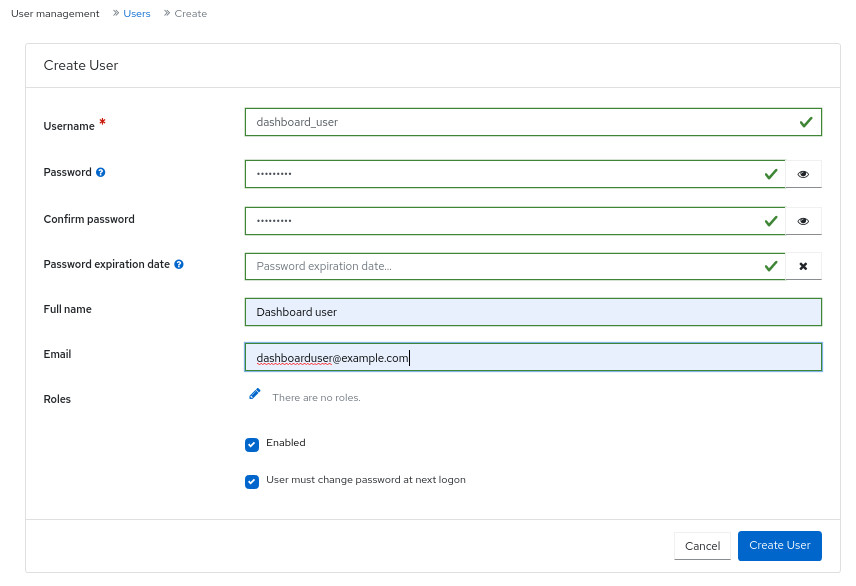
- You get a notification that the user was created successfully.
4.2. Editing users on the Ceph dashboard
You can edit the users on the Red Hat Ceph Storage dashboard. You can modify the user’s password and roles based on the requirements.
Prerequisites
- A running Red Hat Ceph Storage cluster.
- Dashboard is installed.
- Admin-level access to the dashboard.
- User created on the dashboard.
Procedure
- Log in to the Dashboard.
Click the Dashboard Settings icon and then click User management.

- To edit the user, click the row.
- On Users tab, select Edit from the Edit drop-down menu.
In the Edit User window, edit parameters like password and roles, and then click Edit User.
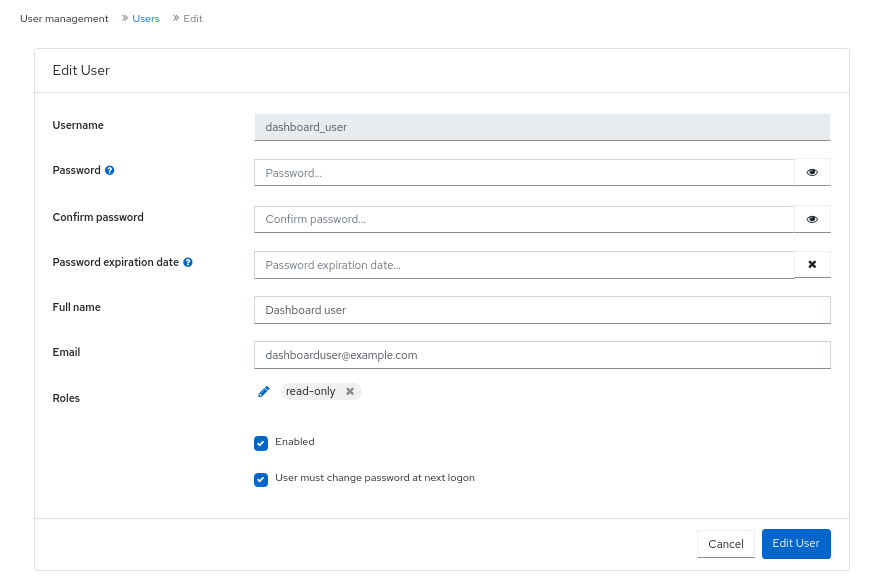 Note
NoteIf you want to disable any user’s access to the Ceph dashboard, you can uncheck Enabled option in the Edit User window.
- You get a notification that the user was created successfully.
4.3. Deleting users on the Ceph dashboard
You can delete users on the Ceph dashboard. Some users might be removed from the system. The access to such users can be deleted from the Ceph dashboard.
Prerequisites
- A running Red Hat Ceph Storage cluster.
- Dashboard is installed.
- Admin-level access to the dashboard.
- User created on the dashboard.
Procedure
- Log in to the Dashboard.
Click the Dashboard Settings icon and then click User management.

- On Users tab, click the user you want to delete.
- select Delete from the Edit drop-down menu.
In the Delete User notification, select Yes, I am sure and click Delete User.
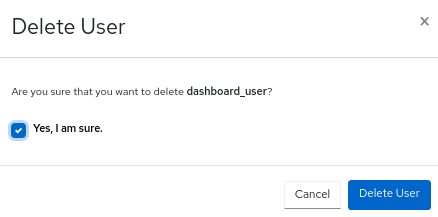
4.4. User capabilities
Ceph stores data RADOS objects within pools irrespective of the Ceph client used. Ceph users must have access to a given pool to read and write data, and must have executable permissions to use Ceph administrative’s commands. Creating users allows you to control their access to your Red Hat Ceph Storage cluster, its pools, and the data within the pools.
Ceph has a concept of type of user which is always client. You need to define the user with the TYPE.ID where ID is the user ID, for example, client.admin. This user typing is because the Cephx protocol is used not only by clients but also non-clients, such as Ceph Monitors, OSDs, and Metadata Servers. Distinguishing the user type helps to distinguish between client users and other users. This distinction streamlines access control, user monitoring, and traceability.
4.4.1. Capabilities
Ceph uses capabilities (caps) to describe the permissions granted to an authenticated user to exercise the functionality of the monitors, OSDs, and metadata servers. The capabilities restrict access to data within a pool, a namespace within a pool, or a set of pools based on their applications tags. A Ceph administrative user specifies the capabilities of a user when creating or updating the user.
You can set the capabilities to monitors, managers, OSDs, and metadata servers.
-
The Ceph Monitor capabilities include
r,w, andxaccess settings. These can be applied in aggregate from pre-defined profiles withprofile NAME. -
The OSD capabilities include
r,w,x,class-read, andclass-writeaccess settings. These can be applied in aggregate from pre-defined profiles withprofile NAME. -
The Ceph Manager capabilities include
r,w, andxaccess settings. These can be applied in aggregate from pre-defined profiles withprofile NAME. -
For administrators, the metadata server (MDS) capabilities include
allow *.
The Ceph Object Gateway daemon (radosgw) is a client of the Red Hat Ceph Storage cluster and is not represented as a Ceph storage cluster daemon type.
4.5. Access capabilities
This section describes the different access or entity capabilities that can be given to a Ceph user or a Ceph client such as Block Device, Object Storage, File System, and native API.
Additionally, you can describe the capability profiles while assigning roles to clients.
allow, Description-
Precedes access settings for a daemon. Implies
rwfor MDS only r, Description- Gives the user read access. Required with monitors to retrieve the CRUSH map.
w, Description- Gives the user write access to objects.
x, Description-
Gives the user the capability to call class methods, that is, both read and write, and to conduct
authoperations on monitors. class-read, Description-
Gives the user the capability to call class read methods. Subset of
x. class-write, Description-
Gives the user the capability to call class write methods. Subset of
x. - *,
all, Description - Gives the user read, write, and execute permissions for a particular daemon or a pool, as well as the ability to execute admin commands.
The following entries describe valid capability profile:
profile osd, Description- This is applicable to Ceph Monitor only. Gives a user permissions to connect as an OSD to other OSDs or monitors. Conferred on OSDs to enable OSDs to handle replication heartbeat traffic and status reporting.
profile mds, Description- This is applicable to Ceph Monitor only. Gives a user permissions to connect as an MDS to other MDSs or monitors.
profile bootstrap-osd, Description-
This is applicable to Ceph Monitor only. Gives a user permissions to bootstrap an OSD. Conferred on deployment tools, such as
ceph-volumeandcephadm, so that they have permissions to add keys when bootstrapping an OSD. profile bootstrap-mds, Description-
This is applicable to Ceph Monitor only. Gives a user permissions to bootstrap a metadata server. Conferred on deployment tools, such as
cephadm, so that they have permissions to add keys when bootstrapping a metadata server. profile bootstrap-rbd, Description-
This is applicable to Ceph Monitor only. Gives a user permissions to bootstrap an RBD user. Conferred on deployment tools, such as
cephadm, so that they have permissions to add keys when bootstrapping an RBD user. profile bootstrap-rbd-mirror, Description-
This is applicable to Ceph Monitor only. Gives a user permissions to bootstrap an
rbd-mirrordaemon user. Conferred on deployment tools, such ascephadm, so that they have permissions to add keys when bootstrapping anrbd-mirrordaemon. profile rbd, Description-
This is applicable to Ceph Monitor, Ceph Manager, and Ceph OSDs. Gives a user permissions to manipulate RBD images. When used as a Monitor cap, it provides the user with the minimal privileges required by an RBD client application; such privileges include the ability to blocklist other client users. When used as an OSD cap, it provides an RBD client application with read-write access to the specified pool. The Manager cap supports optional
poolandnamespacekeyword arguments. profile rbd-mirror, Description-
This is applicable to Ceph Monitor only. Gives a user permissions to manipulate RBD images and retrieve RBD mirroring config-key secrets. It provides the minimal privileges required for the user to manipulate the
rbd-mirrordaemon. profile rbd-read-only, Description-
This is applicable to Ceph Monitor and Ceph OSDS. Gives a user read-only permissions to RBD images. The Manager cap supports optional
poolandnamespacekeyword arguments. profile simple-rados-client, Description- This is applicable to Ceph Monitor only. Gives a user read-only permissions for monitor, OSD, and PG data. Intended for use by direct librados client applications.
profile simple-rados-client-with-blocklist, Description- This is applicable to Ceph Monitor only. Gives a user read-only permissions for monitor, OSD, and PG data. Intended for use by direct librados client applications. Also includes permissions to add blocklist entries to build high-availability (HA) applications.
profile fs-client, Description- This is applicable to Ceph Monitor only. Gives a user read-only permissions for monitor, OSD, PG, and MDS data. Intended for CephFS clients.
profile role-definer, Description- This is applicable to Ceph Monitor and Auth. Gives user all permissions for the auth subsystem, read-only access to monitors, and nothing else. Useful for automation tools. WARNING: Do not assign this unless you really, know what you are doing, as the security ramifications are substantial and pervasive.
profile crash, Description-
This is applicable to Ceph Monitor and Ceph Manager. Gives a user read-only access to monitors. Used in conjunction with the manager crash module to upload daemon
crashdumps into monitor storage for later analysis.
4.6. Creating user capabilities
Create role-based access users with different capabilities on the Ceph dashboard.
For details on different user capabilities, see User capabilities and Access capabilities
Prerequisites
- A running Red Hat Ceph Storage cluster.
- Dashboard is installed.
- Admin-level access to the dashboard.
Procedure
- From the dashboard navigation, go to Administration→Ceph Users.
- Click Create.
In the Create User form, provide the following details:
-
User entity: Enter as
TYPE.ID. -
Entity: This can be
mon,mgr,osd, ormds. Entity Capabilities: Enter the capabilities that you can to provide to the user. For example, 'allow *' and
profile crashare some of the capabilities that can be assigned to the client.NoteYou can add more entities to the user, based on the requirement.

-
User entity: Enter as
Click Create User.
A notification displays that the user is created successfully.
4.7. Editing user capabilities
Edit the roles of users or clients on the dashboard.
For details on different user capabilities, see User capabilities and Access capabilities
Prerequisites
- A running Red Hat Ceph Storage cluster.
- Dashboard is installed.
- Admin-level access to the dashboard.
Procedure
- From the dashboard navigation, go to Administration→Ceph Users.
- Select the user whose roles you want to edit.
- Click Edit.
In the Edit User form, edit the Entity and Entity Capabilities, as needed.
NoteYou can add more entities to the user based on the requirement.
Click Edit User.
A notification displays that the user is successfully edited.
4.8. Importing user capabilities
Import the roles of users or clients from the the local host to the client on the dashboard.
For details on different user capabilities, see User capabilities and Access capabilities
Prerequisites
- A running Red Hat Ceph Storage cluster.
- Dashboard is installed.
- Admin-level access to the dashboard.
Procedure
Create a keyring file on the local host:
Example
[localhost:~]$ cat import.keyring [client.test11] key = AQD9S29kmjgJFxAAkvhFar6Af3AWKDY2DsULRg== caps mds = "allow *" caps mgr = "allow *" caps mon = "allow *" caps osd = "allow r"- From the dashboard navigation, go to Administration→Ceph Users.
- Select the user whose roles you want to export.
- Select Edit→Import.
- In the Import User form, click Choose File.
- Browse to the file on your local host and select.
Click Import User.
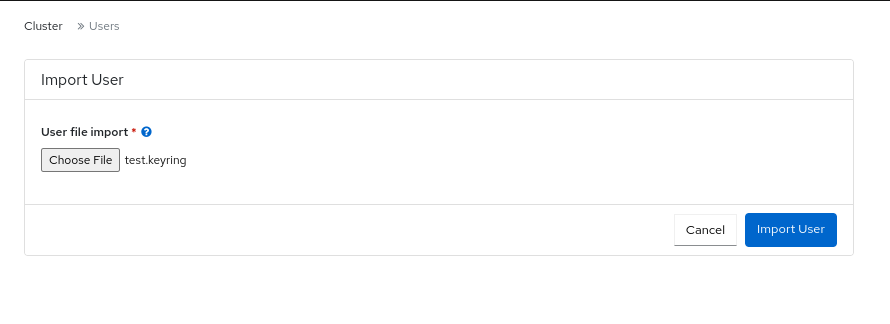
A notification displays that the keys are successfully imported.
4.9. Exporting user capabilities
Export the roles of the users or clients from the dashboard to a the local host.
For details on different user capabilities, see User capabilities and Access capabilities
Prerequisites
- A running Red Hat Ceph Storage cluster.
- Dashboard is installed.
- Admin-level access to the dashboard.
Procedure
- From the dashboard navigation, go to Administration→Ceph Users.
- Select the user whose roles you want to export.
- Select Export from the action drop-down.
From the Ceph user export data dialog, click Copy to Clipboard.
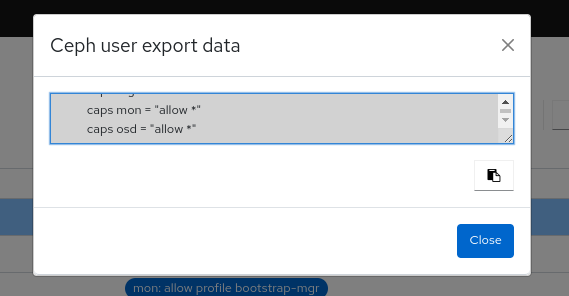
A notification displays that the keys are successfully copied.
On your local system, create a keyring file and paste the keys:
Example
[localhost:~]$ cat exported.keyring [client.test11] key = AQD9S29kmjgJFxAAkvhFar6Af3AWKDY2DsULRg== caps mds = "allow *" caps mgr = "allow *" caps mon = "allow *" caps osd = "allow r"- Click Close.
4.10. Deleting user capabilities
Delete the roles of users or clients on the dashboard.
Prerequisites
- A running Red Hat Ceph Storage cluster.
- Dashboard is installed.
- Admin-level access to the dashboard.
Procedure
- From the dashboard navigation, go to Administration→Ceph Users.
- Select the user that you want to delete and select Delete from the action drop-down.
- In the Delete user dialog, select Yes, I am sure..
Click Delete user.
A notification displays that the user is deleted successfully.
Chapter 5. Managing Ceph daemons
As a storage administrator, you can manage Ceph daemons on the Red Hat Ceph Storage dashboard.
5.1. Daemon actions
The Red Hat Ceph Storage dashboard allows you to start, stop, restart, and redeploy daemons.
These actions are supported on all daemons except monitor and manager daemons.
Prerequisites
- A running Red Hat Ceph Storage cluster.
- Dashboard is installed.
- At least one daemon is configured in the storage cluster.
Procedure
You can manage daemons two ways.
From the Services page:
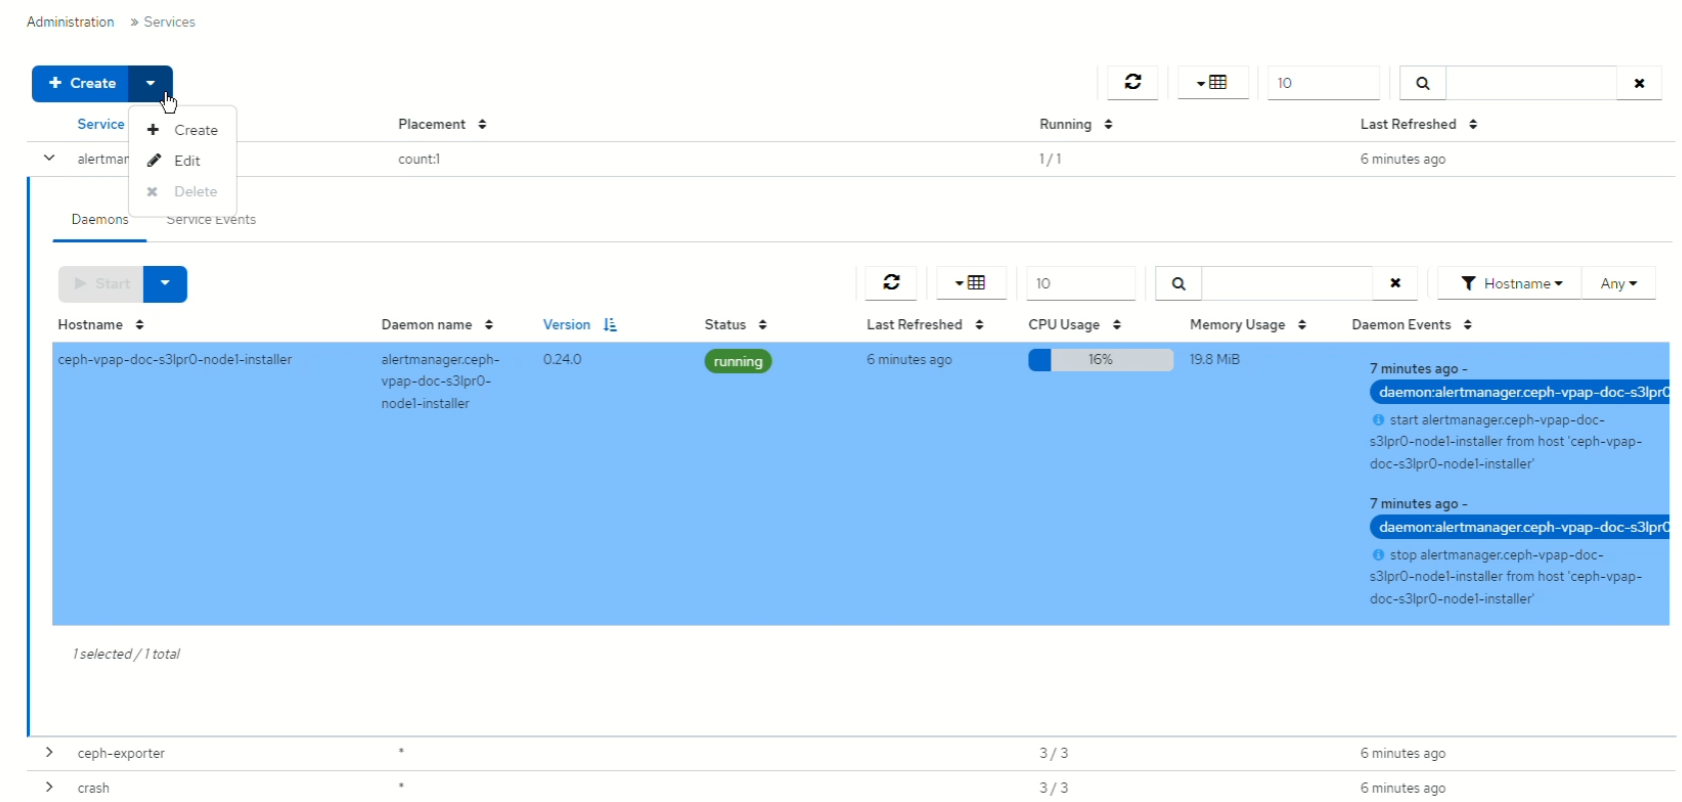
- From the dashboard navigation, go to Administration→Services.
Expand the service with the daemon that will have the action run on.
NoteThe row can be collapsed at any time.
On the Daemons tab, select the row with the daemon.
NoteThe Daemons table can be searched and filtered.
Select the action that needs to be run on the daemon. The options are Start, Stop, Restart, and Redeploy.
Figure 5.1. Managing daemons from Services
From the Hosts page:
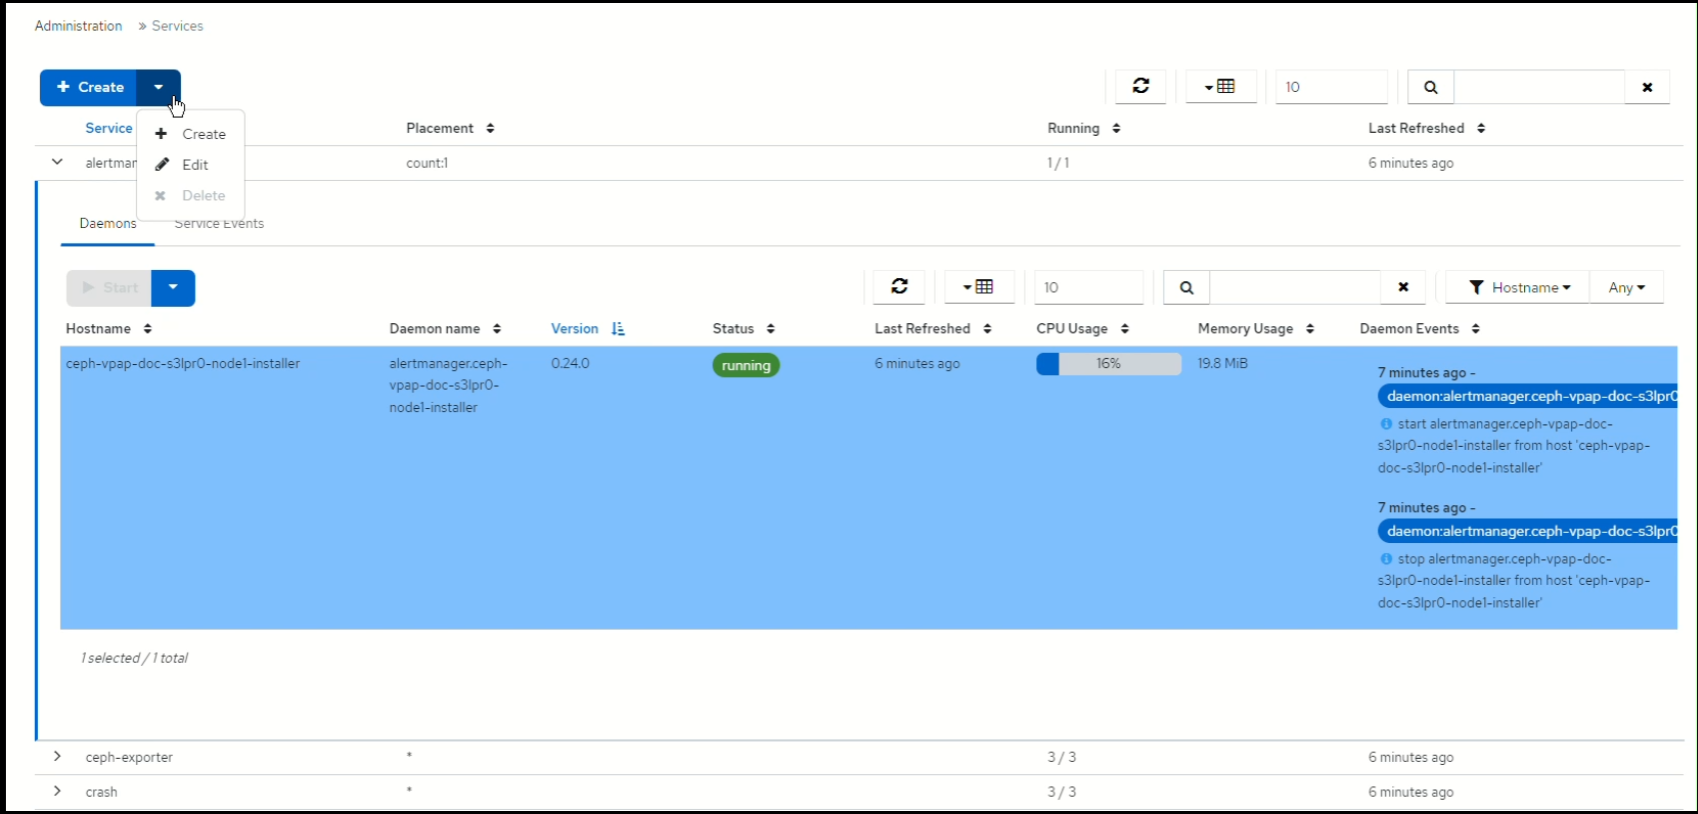
- From the dashboard navigation, go to Cluster→Hosts.
- On the Hosts List tab, expand the host row and select the host with the daemon to perform the action on.
On the Daemons tab of the host, select the row with the daemon.
NoteThe Daemons table can be searched and filtered.
Select the action that needs to be run on the daemon. The options are Start, Stop, Restart, and Redeploy.
Figure 5.2. Managing daemons from Hosts
Chapter 6. Monitoring the cluster on the Ceph dashboard
As a storage administrator, you can use Red Hat Ceph Storage Dashboard to monitor specific aspects of the cluster based on types of hosts, services, data access methods, and more.
This section covers the following administrative tasks:
- Monitoring hosts of the Ceph cluster on the dashboard.
- Viewing and editing the configuration of the Ceph cluster on the dashboard.
- Viewing and editing the manager modules of the Ceph cluster on the dashboard.
- Monitoring monitors of the Ceph cluster on the dashboard.
- Monitoring services of the Ceph cluster on the dashboard.
- Monitoring Ceph OSDs on the dashboard.
- Monitoring HAProxy on the dashboard.
- Viewing the CRUSH map of the Ceph cluster on the dashboard.
- Filtering logs of the Ceph cluster on the dashboard.
- Viewing centralized logs of the Ceph cluster on the dashboard.
- Monitoring pools of the Ceph cluster on the dashboard.
- Monitoring Ceph file systems on the dashboard.
- Monitoring Ceph Object Gateway daemons on the dashboard.
- Monitoring block device images on the Ceph dashboard.
6.1. Monitoring hosts of the Ceph cluster on the dashboard
You can monitor the hosts of the cluster on the Red Hat Ceph Storage Dashboard.
The following are the different tabs on the hosts page. Each tab contains a table with the relavent information. The tables are searchable and customizable by column and row.
To change the order of the columns, select the column name and drag to place within the table.
To select which columns are displaying, click the toggle columns button and select or clear column names.
Enter the number of rows to be displayed in the row selector field.
- Devices
- This tab has a table that details the device ID, state of the device health, life expectancy, device name, prediction creation date, and the daemons on the hosts.
- Physical Disks
- This tab has a table that details all disks attached to a selected host, as well as their type, size and others. It has details such as device path, type of device, available, vendor, model, size, and the OSDs deployed. To identify which disk is where on the physical device, select the device and click Identify. Select the duration of how long the LED should blink for to find the selected disk.
- Daemons
- This tab has a table that details all services that have been deployed on the selected host, which container they are running in, and their current status. The table has details such as daemon name, daemon version, status, when the daemon was last refreshed, CPU usage, memory usage (in MiB), and daemon events. Daemon actions can be run from this tab. For more details, see Daemon actions.
- Performance Details
- This tab has details such as OSDs deployed, CPU utilization, RAM usage, network load, network drop rate, and OSD disk performance statistics. View performance information through the embedded Grafana Dashboard.
- Device health
- For SMART-enabled devices, you can get the individual health status and SMART data only on the OSD deployed hosts.
Prerequisites
- A running Red Hat Ceph Storage cluster.
- Dashboard is installed.
- Hosts are added to the storage cluster.
- All the services, monitor, manager, and OSD daemons are deployed on the storage cluster.
Procedure
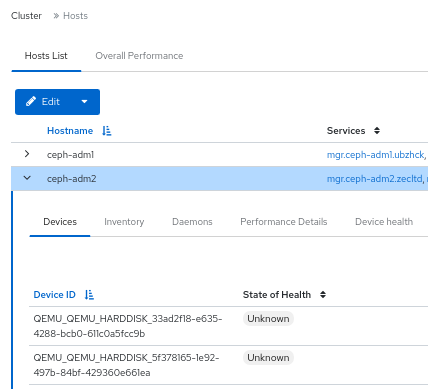
- From the dashboard navigation, go to Cluster→Hosts.
- On the Hosts List tab, expand the host row and select the host with the daemon to perform the action on.
On the Daemons tab of the host, select the row with the daemon.
NoteThe Daemons table can be searched and filtered.
Select the action that needs to be run on the daemon. The options are Start, Stop, Restart, and Redeploy.
Figure 6.1. Monitoring hosts of the Ceph cluster
6.2. Viewing and editing the configuration of the Ceph cluster on the dashboard
You can view various configuration options of the Ceph cluster on the dashboard. You can edit only some configuration options.
Prerequisites
- A running Red Hat Ceph Storage cluster.
- Dashboard is installed.
- All the services are deployed on the storage cluster.
Procedure
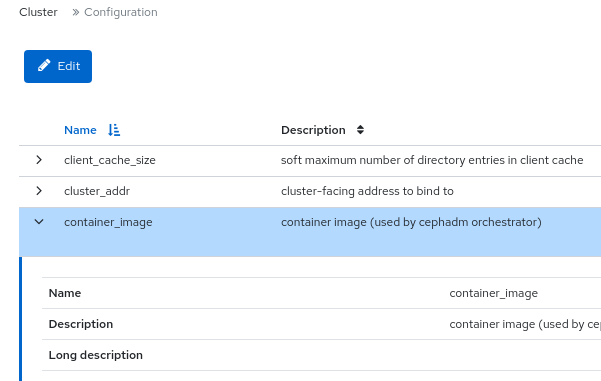
- From the dashboard navigation, go to Administration→Configuration.
To view the details of the configuration, expand the row contents.
Figure 6.2. Configuration options
- Optional: Use the search field to find a configuration.
Optional: You can filter for a specific configuration. Use the following filters:
- Level - Basic, advanced, or dev
- Service - Any, mon, mgr, osd, mds, common, mds_client, rgw, and similar filters.
- Source - Any, mon, and similar filters
- Modified - yes or no
To edit a configuration, select the configuration row and click Edit.
Use the Edit form to edit the required parameters, and click Update.
A notification displays that the configuration was updated successfully.
6.3. Viewing and editing the manager modules of the Ceph cluster on the dashboard
Manager modules are used to manage module-specific configuration settings. For example, you can enable alerts for the health of the cluster.
You can view, enable or disable, and edit the manager modules of a cluster on the Red Hat Ceph Storage dashboard.
Prerequisites
- A running Red Hat Ceph Storage cluster.
- Dashboard is installed.
Viewing the manager modules
- From the dashboard navigation, go to Administration→Manager Modules.
To view the details of a specific manager module, expand the row contents.
Figure 6.3. Manager modules

Enabling a manager module
Select the row and click Enable from the action drop-down.
Disabling a manager module
Select the row and click Disable from the action drop-down.
Editing a manager module
Select the row:
NoteNot all modules have configurable parameters. If a module is not configurable, the Edit button is disabled.
Edit the required parameters and click Update.
A notification displays that the module was updated successfully.
6.4. Monitoring monitors of the Ceph cluster on the dashboard
You can monitor the performance of the Ceph monitors on the landing page of the Red Hat Ceph Storage dashboard You can also view the details such as status, quorum, number of open session, and performance counters of the monitors in the Monitors panel.
Prerequisites
- A running Red Hat Ceph Storage cluster.
- Dashboard is installed.
- Monitors are deployed in the storage cluster.
Procedure
From the dashboard navigation, go to Cluster→Monitors.
The Monitors panel displays information about the overall monitor status and monitor hosts that are in and out of quorum.
To see the number of open sessions, hover the cursor over the Open Sessions.

To see performance counters for any monitor, click Name in the In Quorum and Not In Quorum tables.
Figure 6.4. Viewing monitor Performance Counters

6.5. Monitoring services of the Ceph cluster on the dashboard
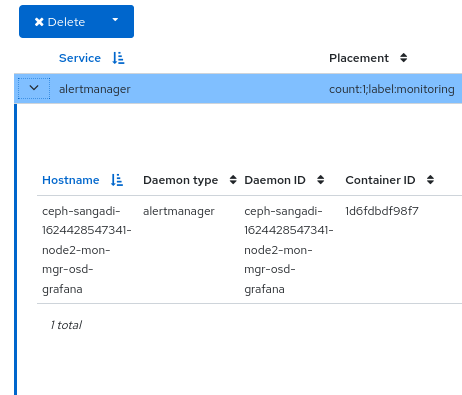
You can monitor the services of the cluster on the Red Hat Ceph Storage Dashboard. You can view the details such as hostname, daemon type, daemon ID, container ID, container image name, container image ID, version status and last refreshed time.
Prerequisites
- A running Red Hat Ceph Storage cluster.
- Dashboard is installed.
- Hosts are added to the storage cluster.
- All the services are deployed on the storage cluster.
Procedure
- From the dashboard navigation, go to Administration→Services.
Expand the service for more details.
Figure 6.5. Monitoring services of the Ceph cluster
6.6. Monitoring Ceph OSDs on the dashboard
You can monitor the status of the Ceph OSDs on the landing page of the Red Hat Ceph Storage Dashboard. You can also view the details such as host, status, device class, number of placement groups (PGs), size flags, usage, and read or write operations time in the OSDs tab.
The following are the different tabs on the OSDs page:
- Devices - This tab has details such as Device ID, state of health, life expectancy, device name, and the daemons on the hosts.
- Attributes (OSD map) - This tab shows the cluster address, details of heartbeat, OSD state, and the other OSD attributes.
- Metadata - This tab shows the details of the OSD object store, the devices, the operating system, and the kernel details.
- Device health - For SMART-enabled devices, you can get the individual health status and SMART data.
- Performance counter - This tab gives details of the bytes written on the devices.
- Performance Details - This tab has details such as OSDs deployed, CPU utilization, RAM usage, network load, network drop rate, and OSD disk performance statistics. View performance information through the embedded Grafana Dashboard.
Prerequisites
- A running Red Hat Ceph Storage cluster.
- Dashboard is installed.
- Hosts are added to the storage cluster.
- All the services including OSDs are deployed on the storage cluster.
Procedure
- From the dashboard navigation, go to Cluster→OSDs.
To view the details of a specific OSD, from the OSDs List tab, expand an OSD row.
Figure 6.6. Monitoring OSDs of the Ceph cluster
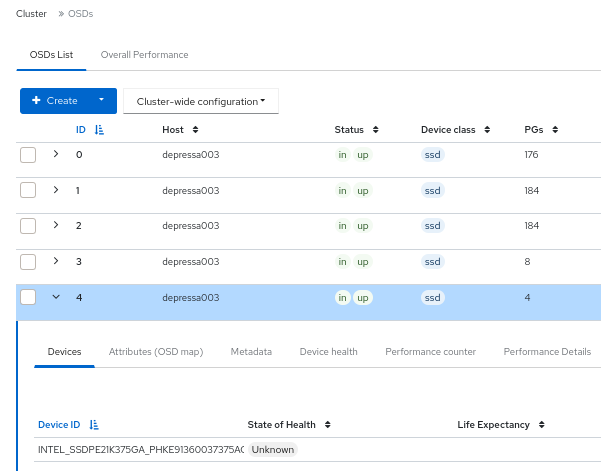
You can view additional details such as Devices, Attributes (OSD map), Metadata, Device Health, Performance counter, and Performance Details, by clicking on the respective tabs.
6.7. Monitoring HAProxy on the dashboard
The Ceph Object Gateway allows you to assign many instances of the object gateway to a single zone, so that you can scale out as load increases. Since each object gateway instance has its own IP address, you can use HAProxy to balance the load across Ceph Object Gateway servers.
You can monitor the following HAProxy metrics on the dashboard:
- Total responses by HTTP code.
- Total requests/responses.
- Total number of connections.
- Current total number of incoming / outgoing bytes.
You can also get the Grafana details by running the ceph dashboard get-grafana-api-url command.
Prerequisites
- A running Red Hat Ceph Storage cluster.
- Admin level access on the storage dashboard.
- An existing Ceph Object Gateway service, without SSL. If you want SSL service, the certificate should be configured on the ingress service, not the Ceph Object Gateway service.
- Ingress service deployed using the Ceph Orchestrator.
- Monitoring stack components are created on the dashboard.
Procedure
Log in to the Grafana URL and select the RGW_Overview panel:
Syntax
https://DASHBOARD_URL:3000Example
https://dashboard_url:3000- Verify the HAProxy metrics on the Grafana URL.
- From the Ceph dashboard navigation, go to Object→Gateways.
From the Overall Performance tab, verify the Ceph Object Gateway HAProxy metrics.
Figure 6.7. HAProxy metrics

6.8. Viewing the CRUSH map of the Ceph cluster on the dashboard
You can view the The CRUSH map that contains a list of OSDs and related information on the Red Hat Ceph Storage dashboard. Together, the CRUSH map and CRUSH algorithm determine how and where data is stored. The dashboard allows you to view different aspects of the CRUSH map, including OSD hosts, OSD daemons, ID numbers, device class, and more.
The CRUSH map allows you to determine which host a specific OSD ID is running on. This is helpful if there is an issue with an OSD.
Prerequisites
- A running Red Hat Ceph Storage cluster.
- Dashboard is installed.
- OSD daemons deployed on the storage cluster.
Procedure
- From the dashboard navigation, go to Cluster→CRUSH map.
To view the details of the specific OSD, click it’s row.
Figure 6.8. CRUSH Map detail view
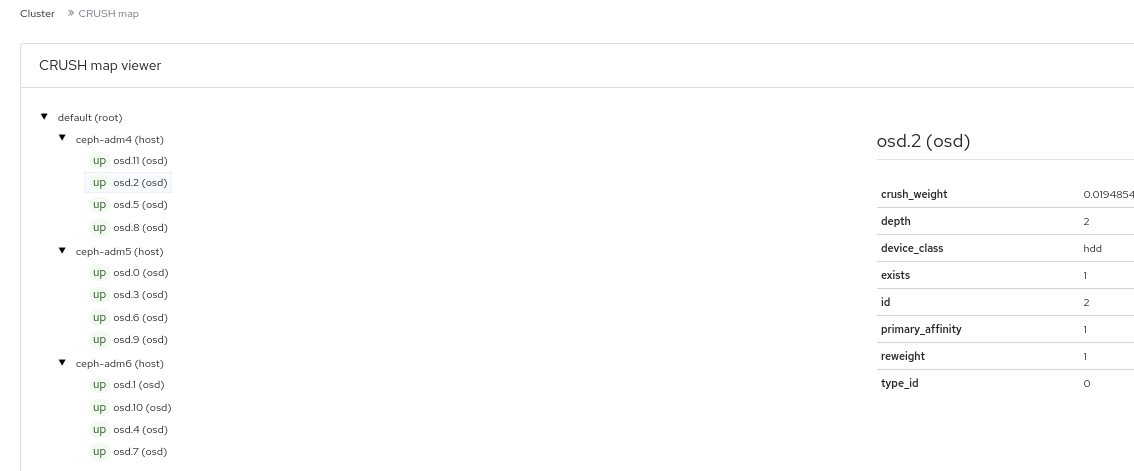
6.9. Filtering logs of the Ceph cluster on the dashboard
You can view and filter logs of the Red Hat Ceph Storage cluster on the dashboard based on several criteria. The criteria includes Priority, Keyword, Date, and Time range.
You can download the logs to the system or copy the logs to the clipboard as well for further analysis.
Prerequisites
- A running Red Hat Ceph Storage cluster.
- The Dashboard is installed.
- Log entries have been generated since the Ceph Monitor was last started.
The Dashboard logging feature only displays the thirty latest high level events. The events are stored in memory by the Ceph Monitor. The entries disappear after restarting the Monitor. If you need to review detailed or older logs, refer to the file based logs.
Procedure
- From the dashboard navigation, go to Observability→Logs.
From the Cluster Logs tab, view cluster logs.
Figure 6.9. Cluster logs

- Use the Priority filter to filter by Debug, Info, Warning, Error, or All.
- Use the Keyword field to enter text to search by keyword.
- Use the Date picker to filter by a specific date.
-
Use the Time range fields to enter a range, using the HH:MM - HH:MM format. Hours must be entered using numbers
0to23. - To combine filters, set two or more filters.
- To save the logs, use the Download or Copy to Clipboard buttons.
6.10. Viewing centralized logs of the Ceph cluster on the dashboard
Ceph Dashboard allows you to view logs from all the clients in a centralized space in the Red Hat Ceph Storage cluster for efficient monitoring. This is achieved through using Loki, a log aggregation system designed to store and query logs, and Promtail, an agent that ships the contents of local logs to a private Grafana Loki instance.
Prerequisites
- A running Red Hat Ceph Storage cluster.
- Dashboard is installed.
- Grafana is configured and logged into on the cluster.
Procedure
- From the dashboard navigation, go to Administration→Services.
- From Services, click Create.
-
In the Create Service form, from the Type list, select
loki. Fill in the remaining details, and click Create Service. Repeat the previous step to create the
Promtailservice. Selectpromtailfrom the Type list.The
lokiandpromtailservices are displayed in the Services table, after being created successfully.Figure 6.10. Creating Loki and Promtail services
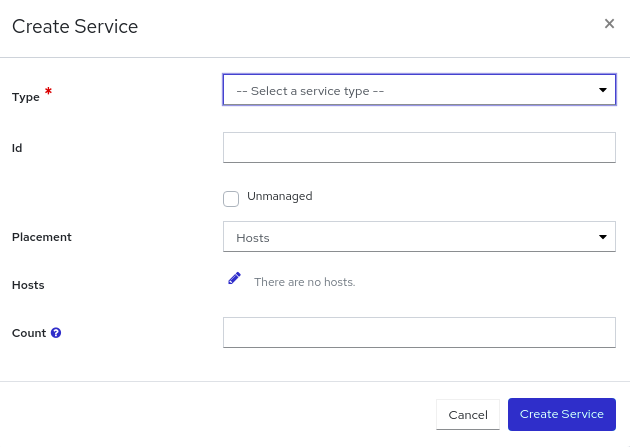 Note
NoteBy default, Promtail service is deployed on all the running hosts.
Enable logging to files.
- Go to Administration→Configuration.
-
Select
log_to_fileand click Edit. In the Edit log_to_file form, set the global value to
true.Figure 6.11. Configuring log files
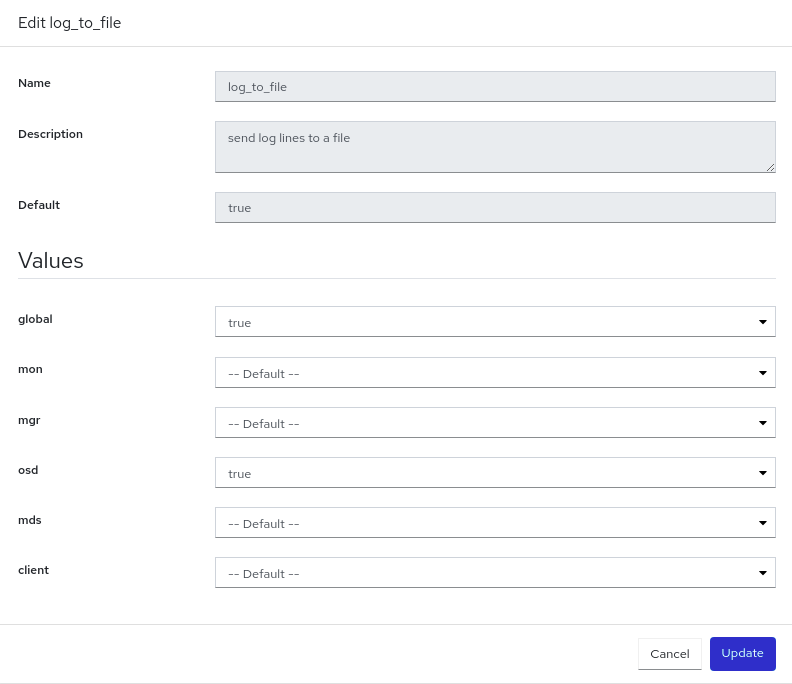
Click Update.
The
Updated config option log_to_filenotification displays and you are returned to the Configuration table.Repeat these steps for
mon_cluster_log_to_file, setting the global value totrue.NoteBoth
log_to_fileandmon_cluster_log_to_filefiles need to be configured.
View the centralized logs.
Go to Observability→Logs and switch to the Daemon Logs tab. Use Log browser to select files and click Show logs to view the logs from that file.
Figure 6.12. View centralized logs
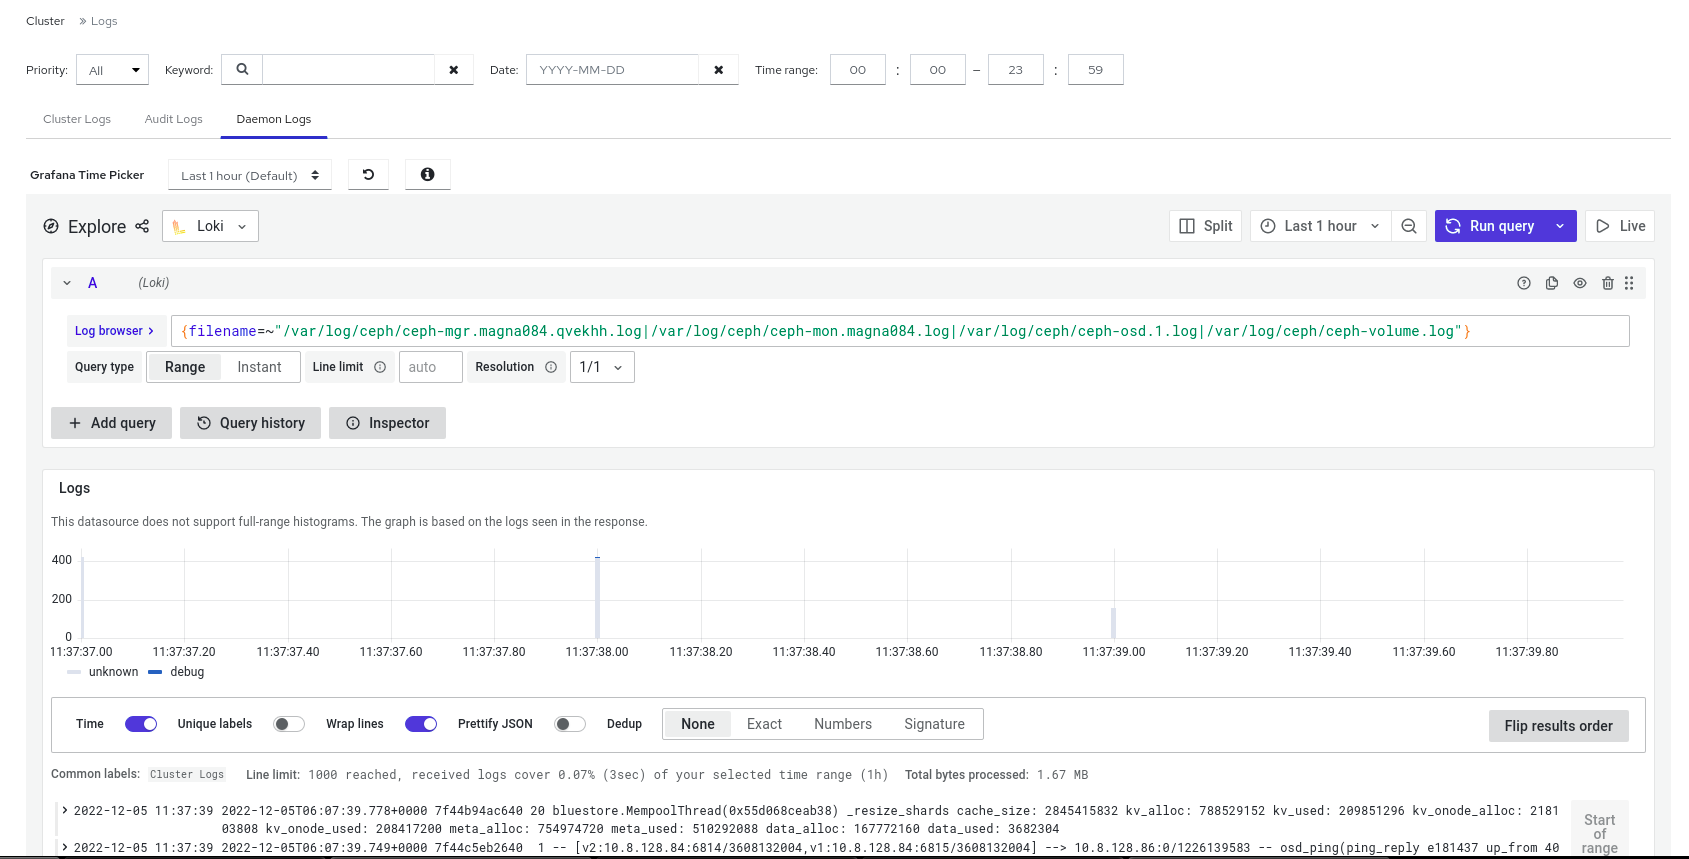 Note
NoteIf you do not see the logs, you need to sign in to Grafana and reload the page.
6.11. Monitoring pools of the Ceph cluster on the dashboard
You can view the details, performance details, configuration, and overall performance of the pools in a cluster on the Red Hat Ceph Storage Dashboard.
A pool plays a critical role in how the Ceph storage cluster distributes and stores data. If you have deployed a cluster without creating a pool, Ceph uses the default pools for storing data.
Prerequisites
- A running Red Hat Ceph Storage cluster.
- Dashboard is installed.
- Pools are created
Procedure
- From the dashboard navigation, go to Cluster→Pools.
- View the Pools List tab, which gives the details of Data protection and the application for which the pool is enabled. Hover the mouse over Usage, Read bytes, and Write bytes for the required details.
Expand the pool row for detailed information about a specific pool.
Figure 6.13. Monitoring pools
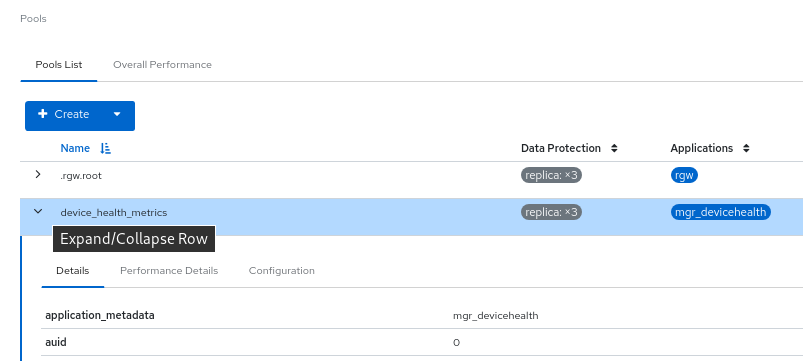
- For general information, go to the Overall Performance tab.
6.12. Monitoring Ceph File Systems on the dashboard
You can use the Red Hat Ceph Storage Dashboard to monitor Ceph File Systems (CephFS) and related components.
For each File System listed, the following tabs are available:
- Details
- View the metadata servers (MDS) and their rank plus any standby daemons, pools and their usage,and performance counters.
- Directories
- View list of directories, their quotas and snapshots. Select a directory to set and unset maximum file and size quotas and to create and delete snapshots for the specific directory.
- Subvolumes
- Create, edit, and view subvolume information. These can be filtered by subvolume groups.
- Subvolume groups
- Create, edit, and view subvolume group information.
- Snapshots
- Create, clone, and view snapshot information. These can be filtered by subvolume groups and subvolumes.
- Snapshot schedules
- Enable, create, edit, and delete snapshot schedules.
- Clients
- View and evict Ceph File System client information.
- Performance Details
- View the performance of the file systems through the embedded Grafana Dashboard.
Prerequisites
- A running Red Hat Ceph Storage cluster.
- Dashboard is installed.
- MDS service is deployed on at least one of the hosts.
- Ceph File System is installed.
Procedure
- From the dashboard navigation, go to File→File Systems.
- To view more information about an individual file system, expand the file system row.
6.13. Monitoring Ceph object gateway daemons on the dashboard
You can use the Red Hat Ceph Storage Dashboard to monitor Ceph object gateway daemons. You can view the details, performance counters, and performance details of the Ceph object gateway daemons.
Prerequisites
- A running Red Hat Ceph Storage cluster.
- Dashboard is installed.
- At least one Ceph object gateway daemon configured in the storage cluster.
Procedure
- From the dashboard navigation, go to Object→Gateways.
- View information about individual gateways, from the Gateways List tab.
- To view more information about an individual gateway, expand the gateway row.
- If you have configured multiple Ceph Object Gateway daemons, click on Sync Performance tab and view the multi-site performance counters.
6.14. Monitoring Block Device images on the Ceph dashboard
You can use the Red Hat Ceph Storage Dashboard to monitor and manage Block device images. You can view the details, snapshots, configuration details, and performance details of the images.
Prerequisites
- A running Red Hat Ceph Storage cluster.
- Dashboard is installed.
- A pool with the rbd application enabled is created.
- An image is created.
Procedure
- From the dashboard navigation, go to Block→Images.
Expand the image row to see detailed information.
Figure 6.14. Monitoring Block device images
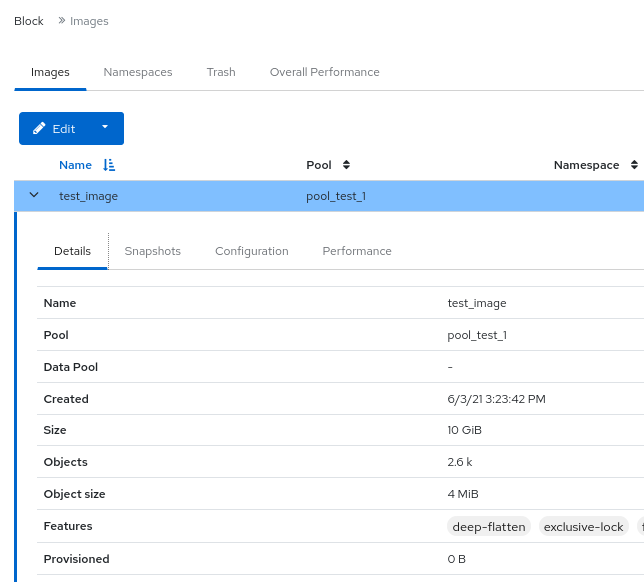
Chapter 7. Managing alerts on the Ceph dashboard
As a storage administrator, you can see the details of alerts and create silences for them on the Red Hat Ceph Storage dashboard. This includes the following pre-defined alerts:
- CephadmDaemonFailed
- CephadmPaused
- CephadmUpgradeFailed
- CephDaemonCrash
- CephDeviceFailurePredicted
- CephDeviceFailurePredictionTooHigh
- CephDeviceFailureRelocationIncomplete
- CephFilesystemDamaged
- CephFilesystemDegraded
- CephFilesystemFailureNoStandby
- CephFilesystemInsufficientStandby
- CephFilesystemMDSRanksLow
- CephFilesystemOffline
- CephFilesystemReadOnly
- CephHealthError
- CephHealthWarning
- CephMgrModuleCrash
- CephMgrPrometheusModuleInactive
- CephMonClockSkew
- CephMonDiskspaceCritical
- CephMonDiskspaceLow
- CephMonDown
- CephMonDownQuorumAtRisk
- CephNodeDiskspaceWarning
- CephNodeInconsistentMTU
- CephNodeNetworkPacketDrops
- CephNodeNetworkPacketErrors
- CephNodeRootFilesystemFull
- CephObjectMissing
- CephOSDBackfillFull
- CephOSDDown
- CephOSDDownHigh
- CephOSDFlapping
- CephOSDFull
- CephOSDHostDown
- CephOSDInternalDiskSizeMismatch
- CephOSDNearFull
- CephOSDReadErrors
- CephOSDTimeoutsClusterNetwork
- CephOSDTimeoutsPublicNetwork
- CephOSDTooManyRepairs
- CephPGBackfillAtRisk
- CephPGImbalance
- CephPGNotDeepScrubbed
- CephPGNotScrubbed
- CephPGRecoveryAtRisk
- CephPGsDamaged
- CephPGsHighPerOSD
- CephPGsInactive
- CephPGsUnclean
- CephPGUnavilableBlockingIO
- CephPoolBackfillFull
- CephPoolFull
- CephPoolGrowthWarning
- CephPoolNearFull
- CephSlowOps
- PrometheusJobMissing
Figure 7.1. Pre-defined alerts

You can also monitor alerts using simple network management protocol (SNMP) traps.
7.1. Enabling monitoring stack
You can manually enable the monitoring stack of the Red Hat Ceph Storage cluster, such as Prometheus, Alertmanager, and Grafana, using the command-line interface.
You can use the Prometheus and Alertmanager API to manage alerts and silences.
Prerequisite
- A running Red Hat Ceph Storage cluster.
- root-level access to all the hosts.
Procedure
Log into the
cephadmshell:Example
[root@host01 ~]# cephadm shellSet the APIs for the monitoring stack:
Specify the host and port of the Alertmanager server:
Syntax
ceph dashboard set-alertmanager-api-host ALERTMANAGER_API_HOST:PORTExample
[ceph: root@host01 /]# ceph dashboard set-alertmanager-api-host http://10.0.0.101:9093
Option ALERTMANAGER_API_HOST updated
To see the configured alerts, configure the URL to the Prometheus API. Using this API, the Ceph Dashboard UI verifies that a new silence matches a corresponding alert.
Syntax
ceph dashboard set-prometheus-api-host PROMETHEUS_API_HOST:PORTExample
[ceph: root@host01 /]# ceph dashboard set-prometheus-api-host http://10.0.0.101:9095
Option PROMETHEUS_API_HOST updated
After setting up the hosts, refresh your browser’s dashboard window.
Specify the host and port of the Grafana server:
Syntax
ceph dashboard set-grafana-api-url GRAFANA_API_URL:PORTExample
[ceph: root@host01 /]# ceph dashboard set-grafana-api-url https://10.0.0.101:3000
Option GRAFANA_API_URL updated
Get the Prometheus, Alertmanager, and Grafana API host details:
Example
[ceph: root@host01 /]# ceph dashboard get-alertmanager-api-host
http://10.0.0.101:9093
[ceph: root@host01 /]# ceph dashboard get-prometheus-api-host
http://10.0.0.101:9095
[ceph: root@host01 /]# ceph dashboard get-grafana-api-url
http://10.0.0.101:3000
Optional: If you are using a self-signed certificate in your Prometheus, Alertmanager, or Grafana setup, disable the certificate verification in the dashboard This avoids refused connections caused by certificates signed by an unknown Certificate Authority (CA) or that do not match the hostname.
For Prometheus:
Example
[ceph: root@host01 /]# ceph dashboard set-prometheus-api-ssl-verify FalseFor Alertmanager:
Example
[ceph: root@host01 /]# ceph dashboard set-alertmanager-api-ssl-verify FalseFor Grafana:
Example
[ceph: root@host01 /]# ceph dashboard set-grafana-api-ssl-verify False
Get the details of the self-signed certificate verification setting for Prometheus, Alertmanager, and Grafana:
Example
[ceph: root@host01 /]# ceph dashboard get-prometheus-api-ssl-verify
[ceph: root@host01 /]# ceph dashboard get-alertmanager-api-ssl-verify
[ceph: root@host01 /]# ceph dashboard get-grafana-api-ssl-verify
Optional: If the dashboard does not reflect the changes, you have to disable and then enable the dashboard:
Example
[ceph: root@host01 /]# ceph mgr module disable dashboard
[ceph: root@host01 /]# ceph mgr module enable dashboard
7.2. Configuring Grafana certificate
The cephadm deploys Grafana using the certificate defined in the ceph key/value store. If a certificate is not specified, cephadm generates a self-signed certificate during the deployment of the Grafana service.
You can configure a custom certificate with the ceph config-key set command.
Prerequisite
- A running Red Hat Ceph Storage cluster.
Procedure
Log into the
cephadmshell:Example
[root@host01 ~]# cephadm shellConfigure the custom certificate for Grafana:
Example
[ceph: root@host01 /]# ceph config-key set mgr/cephadm/grafana_key -i $PWD/key.pem
[ceph: root@host01 /]# ceph config-key set mgr/cephadm/grafana_crt -i $PWD/certificate.pem
If Grafana is already deployed, then run
reconfigto update the configuration:Example
[ceph: root@host01 /]# ceph orch reconfig grafanaEvery time a new certificate is added, follow the below steps:
Make a new directory
Example
[root@host01 ~]# mkdir /root/internalca
[root@host01 ~]# cd /root/internalca
Generate the key:
Example
[root@host01 internalca]# openssl ecparam -genkey -name secp384r1 -out $(date +%F).keyView the key:
Example
[root@host01 internalca]# openssl ec -text -in $(date +%F).key | lessMake a request:
Example
[root@host01 internalca]# umask 077; openssl req -config openssl-san.cnf -new -sha256 -key $(date +%F).key -out $(date +%F).csrReview the request prior to sending it for signature:
Example
[root@host01 internalca]# openssl req -text -in $(date +%F).csr | lessAs the CA sign:
Example
[root@host01 internalca]# openssl ca -extensions v3_req -in $(date +%F).csr -out $(date +%F).crt -extfile openssl-san.cnfCheck the signed certificate:
Example
[root@host01 internalca]# openssl x509 -text -in $(date +%F).crt -noout | less
7.3. Adding Alertmanager webhooks
You can add new webhooks to an existing Alertmanager configuration to receive real-time alerts about the health of the storage cluster. You have to enable incoming webhooks to allow asynchronous messages into third-party applications.
For example, if an OSD is down in a Red Hat Ceph Storage cluster, you can configure the Alertmanager to send notification on Google chat.
Prerequisite
- A running Red Hat Ceph Storage cluster with monitoring stack components enabled.
- Incoming webhooks configured on the receiving third-party application.
Procedure
Log into the
cephadmshell:Example
[root@host01 ~]# cephadm shellConfigure the Alertmanager to use the webhook for notification:
Syntax
service_type: alertmanager
spec:
  user_data:
    default_webhook_urls:
    - "_URLS_"
The
default_webhook_urlsis a list of additional URLs that are added to the default receivers'webhook_configsconfiguration.Example
service_type: alertmanager
spec:
  user_data:
    webhook_configs:
    - url: 'http:127.0.0.10:8080'
Update Alertmanager configuration:
Example
[ceph: root@host01 /]# ceph orch reconfig alertmanager
Verification
An example notification from Alertmanager to Gchat:
Example
using: https://chat.googleapis.com/v1/spaces/(xx- space identifyer -xx)/messages
posting: {'status': 'resolved', 'labels': {'alertname': 'PrometheusTargetMissing', 'instance': 'postgres-exporter.host03.chest
response: 200
response: {
"name": "spaces/(xx- space identifyer -xx)/messages/3PYDBOsIofE.3PYDBOsIofE",
"sender": {
"name": "users/114022495153014004089",
"displayName": "monitoring",
"avatarUrl": "",
"email": "",
"domainId": "",
"type": "BOT",
"isAnonymous": false,
"caaEnabled": false
},
"text": "Prometheus target missing (instance postgres-exporter.cluster.local:9187)\n\nA Prometheus target has disappeared. An e
"cards": [],
"annotations": [],
"thread": {
"name": "spaces/(xx- space identifyer -xx)/threads/3PYDBOsIofE"
},
"space": {
"name": "spaces/(xx- space identifyer -xx)",
"type": "ROOM",
"singleUserBotDm": false,
"threaded": false,
"displayName": "_privmon",
"legacyGroupChat": false
},
"fallbackText": "",
"argumentText": "Prometheus target missing (instance postgres-exporter.cluster.local:9187)\n\nA Prometheus target has disappea
"attachment": [],
"createTime": "2022-06-06T06:17:33.805375Z",
"lastUpdateTime": "2022-06-06T06:17:33.805375Z"
7.4. Viewing alerts on the Ceph dashboard
After an alert has fired, you can view it on the Red Hat Ceph Storage Dashboard. You can edit the Manager module settings to trigger a mail when an alert is fired.
Prerequisite
- A running Red Hat Ceph Storage cluster.
- Dashboard is installed.
- A running simple mail transfer protocol (SMTP) configured.
- An alert emitted.
Procedure
- From the dashboard navigation, go to Observability→Alerts.
- View active Prometheus alerts from the Active Alerts tab.
View all alerts from the Alerts tab.
To view alert details, expand the alert row.
To view the source of an alert, click on its row, and then click Source.

7.5. Creating a silence on the Ceph dashboard
You can create a silence for an alert for a specified amount of time on the Red Hat Ceph Storage Dashboard.
Prerequisite
- A running Red Hat Ceph Storage cluster.
- Dashboard is installed.
- An alert fired.
Procedure
- From the dashboard navigation, go to Observability→Alerts.
- On the Silences tab, click Create.
In the Create Silence form, fill in the required fields.
Use the Add matcher to add silence requirements.
Figure 7.2. Creating a silence
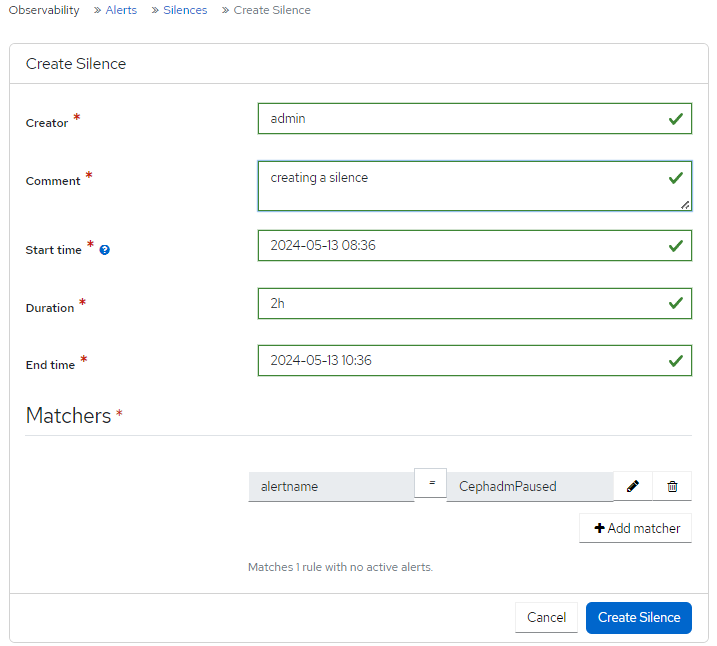
Click Create Silence.
A notification displays that the silence was created successfully and the Alerts Silenced updates in the Silences table.
7.6. Recreating a silence on the Ceph dashboard
You can recreate a silence from an expired silence on the Red Hat Ceph Storage Dashboard.
Prerequisite
- A running Red Hat Ceph Storage cluster.
- Dashboard is installed.
- An alert fired.
- A silence created for the alert.
Procedure
- From the dashboard navigation, go to Observability→Alerts.
- On the Silences tab, select the row with the alert that you want to recreate, and click Recreate from the action drop-down.
Edit any needed details, and click Recreate Silence button.
A notification displays indicating that the silence was edited successfully and the status of the silence is now active.
7.7. Editing a silence on the Ceph dashboard
You can edit an active silence, for example, to extend the time it is active on the Red Hat Ceph Storage Dashboard. If the silence has expired, you can either recreate a silence or create a new silence for the alert.
Prerequisite
- A running Red Hat Ceph Storage cluster.
- Dashboard is installed.
- An alert fired.
- A silence created for the alert.
Procedure
- Log in to the Dashboard.
- On the navigation menu, click Cluster.
- Select Monitoring from the drop-down menu.
- Click the Silences tab.
- To edit the silence, click it’s row.
- In the Edit drop-down menu, select Edit.
In the Edit Silence window, update the details and click Edit Silence.
Figure 7.3. Edit silence

- You get a notification that the silence was updated successfully.
7.8. Expiring a silence on the Ceph dashboard
You can expire a silence so any matched alerts will not be suppressed on the Red Hat Ceph Storage Dashboard.
Prerequisite
- A running Red Hat Ceph Storage cluster.
- Dashboard is installed.
- An alert fired.
- A silence created for the alert.
Procedure
- From the dashboard navigation, go to Observability→Alerts.
- On the Silences tab, select the row with the alert that you want to expire, and click Expire from the action drop-down.
In the Expire Silence notification, select Yes, I am sure and click Expire Silence.
A notification displays indicating that the silence was expired successfully and the Status of the alert is expired, in the Silences table.
Chapter 8. Managing pools on the Ceph dashboard
As a storage administrator, you can create, edit, and delete pools on the Red Hat Ceph Storage dashboard.
This section covers the following administrative tasks:
8.1. Creating pools on the Ceph dashboard
When you deploy a storage cluster without creating a pool, Ceph uses the default pools for storing data. You can create pools to logically partition your storage objects on the Red Hat Ceph Storage dashboard.
Prerequisites
- A running Red Hat Ceph Storage cluster.
- Dashboard is installed.
Procedure
- From the dashboard navigation, go to Cluster→Pools.
- Click Create.
Fill out the Create Pool form.
Figure 8.1. Creating pools
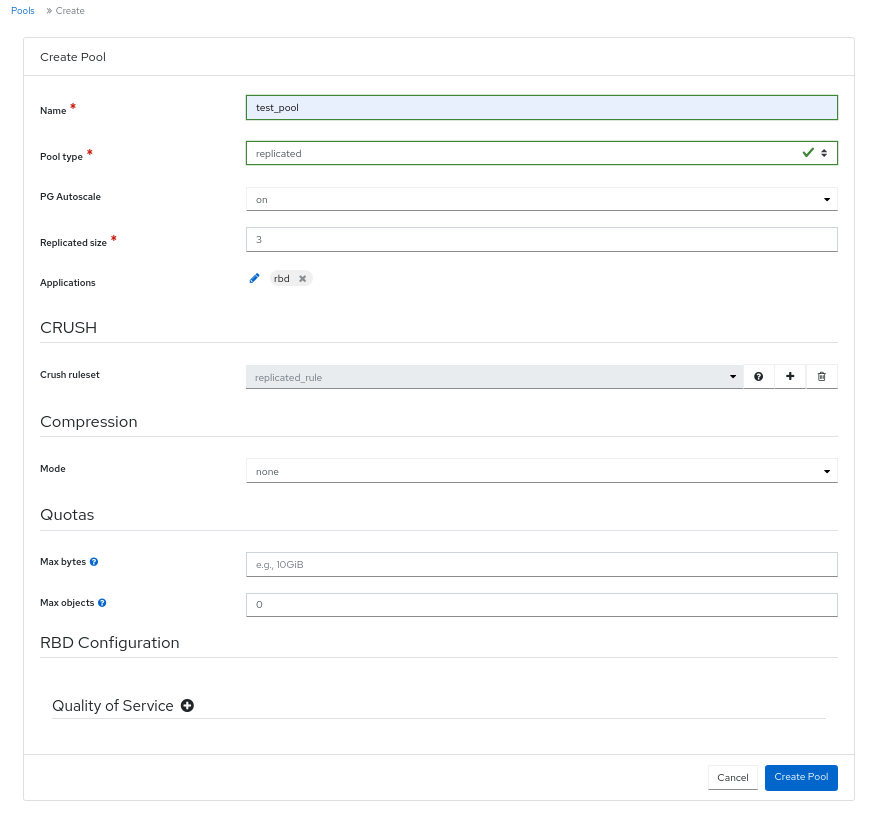 Note
NoteThe form changes based off of selection. Not all fields are mandatory.
- Set the name of the pool and select the pool type.
-
Select the Pool type, either
replicatedorerasure. Erasure is referred to as Erasure Coded (EC). -
Optional: Select if the PG Autoscale is
on,off, orwarn. - Optional: If using a replicated pool type, set the replicated size.
- Optional: If using an EC pool type configure the following additional settings.
- Optional: To see the settings for the currently selected EC profile, click the question mark.
- Optional: Add a new EC profile by clicking the plus symbol.
- Optional: Click the pencil symbol to select an application for the pool.
- Optional: Set the CRUSH rule, if applicable.
- Optional: If compression is required, select passive, aggressive, or force.
- Optional: Set the Quotas.
- Optional: Set the Quality of Service configuration.
To save the changes and complete creating the pool, click Create Pool.
A notification displays that the pool was created successfully.
8.2. Editing pools on the Ceph dashboard
You can edit the pools on the Red Hat Ceph Storage Dashboard.
Prerequisites
- A running Red Hat Ceph Storage cluster.
- Dashboard is installed.
- A pool is created.
Procedure
- From the dashboard navigation, go to Cluster→Pools.
- To edit the pool, select the pool row and click Edit.
- In the Edit Pool form, edit the required parameters.
Save changes, by clicking Edit Pool.
A notification displays that the pool was updated successfully.
8.3. Deleting pools on the Ceph dashboard
You can delete the pools on the Red Hat Ceph Storage Dashboard. Ensure that value of mon_allow_pool_delete is set to True in Manager modules.
Prerequisites
- A running Red Hat Ceph Storage cluster.
- Dashboard is installed.
- A pool is created.
Procedure
- From the dashboard navigation, go to Administration→Configuration.
From the Configuration table, select
mon_allow_pool_delete, and click Edit.NoteIf needed, clear filters and search for the configuration.
- From the Edit mon_allow_pool_delete form, in Values, set all values to true.
Click Update.
A notification displays that the configuration was updated successfully.
- Go to Cluster→Pools.
- Select the pool to be deleted, and click Delete from the action drop-down.
In the Delete Pool dialog, select Yes, I am sure. and complete, by clicking Delete Pool.
A notification displays that the pool was deleted successfully.
Chapter 9. Managing hosts on the Ceph dashboard
As a storage administrator, you can enable or disable maintenance mode for a host in the Red Hat Ceph Storage Dashboard. The maintenance mode ensures that shutting down the host, to perform maintenance activities, does not harm the cluster.
You can also remove hosts using Start Drain and Remove options in the Red Hat Ceph Storage Dashboard.
This section covers the following administrative tasks:
Prerequisites
- A running Red Hat Ceph Storage cluster.
- Dashboard is installed.
- Hosts, Ceph Monitors and Ceph Manager Daemons are added to the storage cluster.
9.1. Entering maintenance mode
You can enter a host into the maintenance mode before shutting it down on the Red Hat Ceph Storage Dashboard. If the maintenance mode gets enabled successfully, the host is taken offline without any errors for the maintenance activity to be performed. If the maintenance mode fails, it indicates the reasons for failure and the actions you need to take before taking the host down.
Prerequisites
- A running Red Hat Ceph Storage cluster.
- Dashboard is installed.
- All other prerequisite checks are performed internally by Ceph and any probable errors are taken care of internally by Ceph.
Procedure
- From the dashboard navigation, go to Cluster→Hosts.
Select the host to enter maintenance mode, and click Enter Maintenance from the action drop-down.
NoteIf the host contains Ceph Object Gateway (RGW) daemons, a warning displays that removing RGW daemons can cause clients to lose connectivity. Click Continue to enter maintenance.
NoteWhen a host enters maintenance mode, all daemons are stopped. Check the status of the daemons of a host by expanding the host view and switching to the Daemons tab.
A notification displays that the host was moved to maintance successfully.
Verification
The
maintenancelabel displays in the Status column of the Host table.NoteIf the maintenance mode fails, a notification displays, indicating the reasons for failure.
9.2. Exiting maintenance mode
To restart a host, you can move it out of maintenance mode on the Red Hat Ceph Storage Dashboard.
Prerequisites
- A running Red Hat Ceph Storage cluster.
- Dashboard is installed.
- All other prerequisite checks are performed internally by Ceph and any probable errors are taken care of internally by Ceph.
Procedure
- From the dashboard navigation, go to Cluster→Hosts.
Select the host currently in maintenance mode, and click Exit Maintenance from the action drop-down.
NoteIdentify which host is maintenance by checking for the
maintenancelabel in the Status column of the Host table.A notification displays that the host was moved out of maintenance successfully.
-
Create the required services on the host. By default,
crashandnode-exporterget deployed.
Verification
-
The
maintenancelabel is removed from the Status column of the Host table.
9.3. Removing hosts using the Ceph Dashboard
To remove a host from a Ceph cluster, you can use Start Drain and Remove options in Red Hat Ceph Storage Dashboard.
Prerequisites
- A running Red Hat Ceph Storage cluster.
- Dashboard is installed.
- All other prerequisite checks are performed internally by Ceph and any probable errors are taken care of internally by Ceph.
Procedure
- From the dashboard navigation, go to Cluster→Hosts.
- Select the host that is to be removed, and click Start Drain from the action drop-down.
Figure 9.1. Selecting Start Drain option
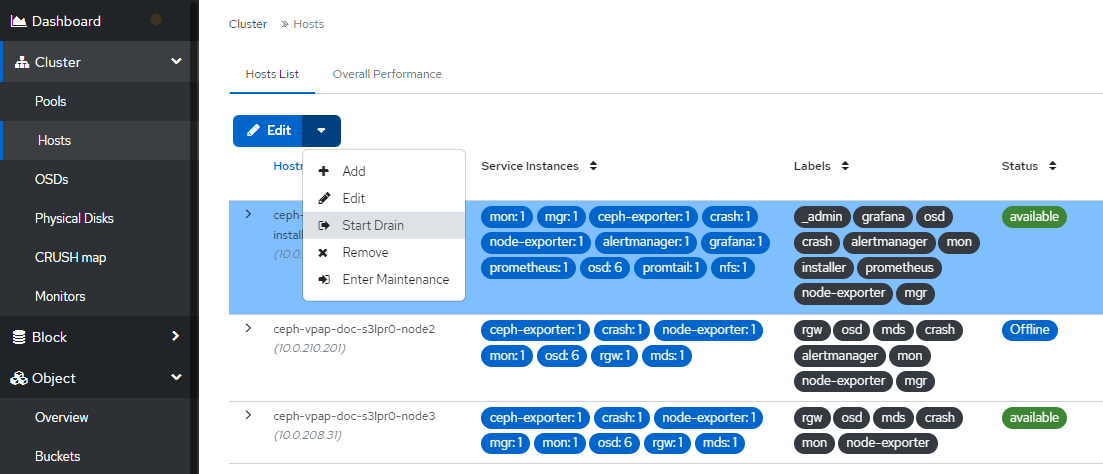
+ This option drains all the daemons from the host.
+
The _no_schedule label is automatically applied to the host, which blocks the deployment of daemons on this host.
Optional: To stop the draining of daemons from the host, click Stop Drain from the action drop-down.
- Check that all the daemons are removed from the host.
- Expand the host row.
Go to the Daemons tab. No daemons should be listed.
Figure 9.2. Checking the status of host daemons
 Important
A host can be safely removed from the cluster after all the daemons are removed from it.
- Select the host that is to be removed, and click Remove from the action drop-down.
In the Remove Host notification, select Yes, I am sure and click Remove Host.
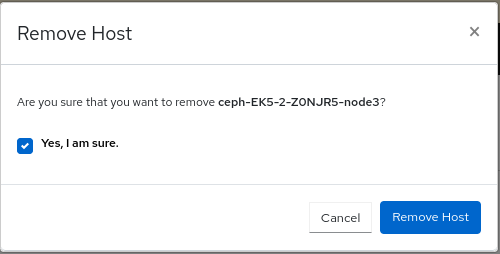
A notification displays that the host is removed successfully.
Chapter 10. Managing Ceph OSDs on the dashboard
As a storage administrator, you can monitor and manage OSDs on the Red Hat Ceph Storage Dashboard.
Some of the capabilities of the Red Hat Ceph Storage Dashboard are:
- List OSDs, their status, statistics, information such as attributes, metadata, device health, performance counters and performance details.
- Mark OSDs down, in, out, lost, purge, reweight, scrub, deep-scrub, destroy, delete, and select profiles to adjust backfilling activity.
- List all drives associated with an OSD.
- Set and change the device class of an OSD.
- Deploy OSDs on new drives and hosts.
Prerequisites
- A running Red Hat Ceph Storage cluster
-
cluster-managerlevel of access on the Red Hat Ceph Storage dashboard
10.1. Managing the OSDs on the Ceph dashboard
You can carry out the following actions on a Ceph OSD on the Red Hat Ceph Storage Dashboard:
- Create a new OSD.
- Edit the device class of the OSD.
- Mark the Flags as No Up, No Down, No In, or No Out.
- Scrub and deep-scrub the OSDs.
- Reweight the OSDs.
- Mark the OSDs Out, In, Down, or Lost.
- Purge the OSDs.
- Destroy the OSDs.
- Delete the OSDs.
Prerequisites
- A running Red Hat Ceph Storage cluster.
- Dashboard is installed.
- Hosts, Monitors, and Manager Daemons are added to the storage cluster.
Procedure
From the dashboard navigation, go to Cluster→OSDs.
Creating an OSD
To create the OSD, from the OSDs List table, click Create.
Figure 10.1. Add device for OSDs
 Note
NoteEnsure you have an available host and a few available devices. Check for available devices in Cluster→Physical Disks and filter for Available.
In the Create OSDs form, in the Deployment Options section, select one of the following options:
- Cost/Capacity-optimized: The cluster gets deployed with all available HDDs.
- Throughput-optimized: Slower devices are used to store data and faster devices are used to store journals/WALs.
- IOPS-optmized: All the available NVMe devices are used to deploy OSDs.
In the Advanced Mode section, add primary, WAL, and DB devices by clicking Add.
- Primary devices: Primary storage devices contain all OSD data.
- WAL devices: Write-Ahead-Log devices are used for BlueStore’s internal journal and are used only if the WAL device is faster than the primary device. For example, NVMe or SSD devices.
- DB devices: DB devices are used to store BlueStore’s internal metadata and are used only if the DB device is faster than the primary device. For example, NVMe or SSD devices.
- To encrypt your data, for security purposes, from the Features section of the form, select Encryption.
- Click Preview.
In the OSD Creation Preview dialog review the OSD and click Create.
A notification displays that the OSD was created successfully and the OSD status changes from in and down to in and up.
Editing an OSD
To edit an OSD, select the row and click Edit.
- From the Edit OSD form, edit the device class.
Click Edit OSD.
Figure 10.2. Edit an OSD
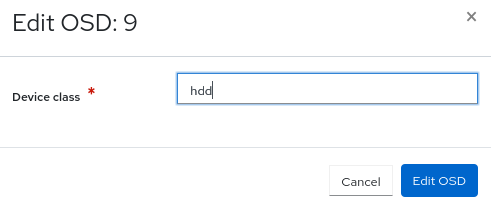
A notification displays that the OSD was updated successfully.
Marking the OSD flags
- To mark the flag of the OSD, select the row and click Flags from the action drop-down.
- In the Individual OSD Flags form, select the OSD flags needed.
Click Update.
Figure 10.3. Marking OSD flags
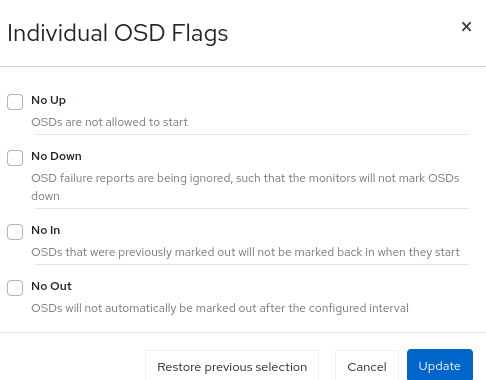
A notification displays that the OSD flags updated successfully.
Scrubbing an OSD
- To scrub an OSD, select the row and click Scrub from the action drop-down.
In the OSDs Scrub notification, click Update.
Figure 10.4. Scrubbing an OSD
A notification displays that the scrubbing of the OSD was initiated successfully.
Deep-scrubbing the OSDs
- To deep-scrub the OSD, select the row and click Deep Scrub from the action drop-down.
In the OSDs Deep Scrub notification, click Update.
Figure 10.5. Deep-scrubbing an OSD
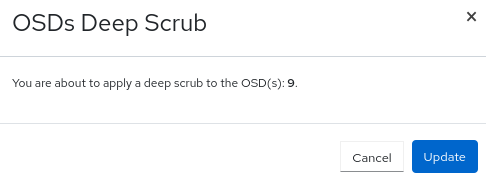
A notification displays that the deep scrubbing of the OSD was initiated successfully.
Reweighting the OSDs
- To reweight the OSD, select the row and click Reweight from the action drop-down.
- In the Reweight OSD form enter a value between 0 and 1.
Click Reweight.
Figure 10.6. Reweighting an OSD
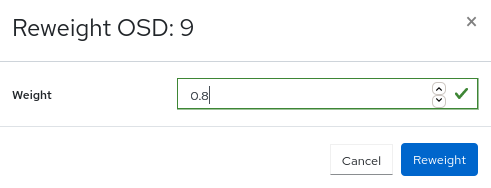
Marking OSDs out
- To mark an OSD as out, select the row and click Mark Out from the action drop-down.
In the Mark OSD out notification, click Mark Out.
Figure 10.7. Marking OSDs out
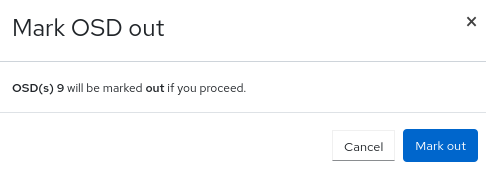
The OSD status changes to out.
Marking OSDs in
- To mark an OSD as in, select the OSD row that is in out status and click Mark In from the action drop-down.
In the Mark OSD in notification, click Mark In.
Figure 10.8. Marking OSDs in
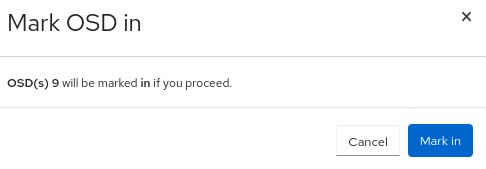
The OSD status changes to in.
Marking OSDs down
- To mark an OSD down, select the row and click Mark Down from the action drop-down.
In the Mark OSD down notification, click Mark Down.
Figure 10.9. Marking OSDs down
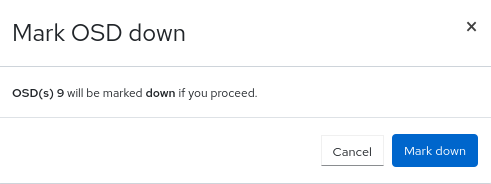
The OSD status changes to down.
Marking OSDs lost
- To mark an OSD lost, select the OSD in out and down status and click Mark Lost from the action drop-down.
In the Mark OSD Lost notification, select Yes, I am sure and click Mark Lost.
Figure 10.10. Marking OSDs lost
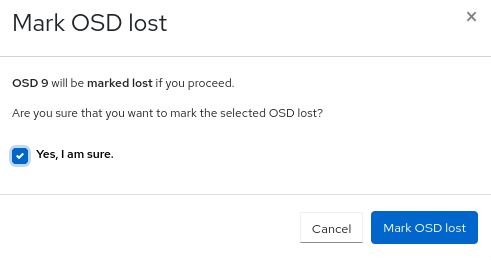
Purging OSDs
- To purge an OSD, select the OSD in down status and click Purge from the action drop-down.
In the Purge OSDs notification, select Yes, I am sure and click Purge OSD.
Figure 10.11. Purging OSDs

All the flags are reset and the OSD is back in in and up status.
Destroying OSDs
- To destroy an OSD, select the OSD in down status and click Destroy from the action drop-down.
In the Destroy OSDs notification, select Yes, I am sure and click Destroy OSD.
Figure 10.12. Destroying OSDs
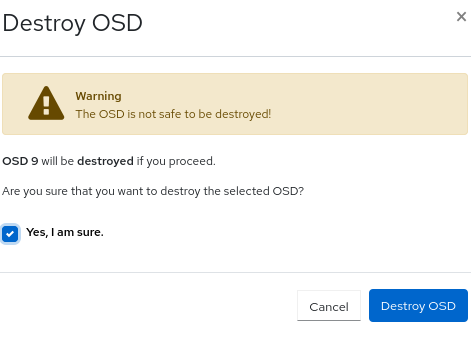
The OSD status changes to destroyed.
Deleting OSDs
- To delete an OSD, select the OSD and click Delete from the action drop-down.
In the Delete OSDs notification, select Yes, I am sure and click Delete OSD.
NoteYou can preserve the OSD_ID when you have to to replace the failed OSD.
Figure 10.13. Deleting OSDs
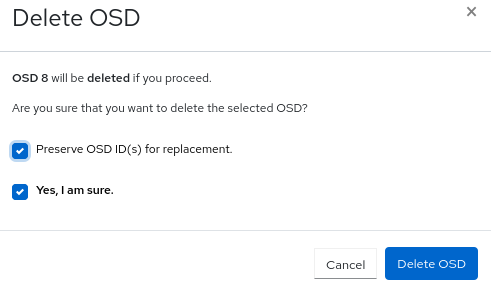
10.2. Replacing the failed OSDs on the Ceph dashboard
You can replace the failed OSDs in a Red Hat Ceph Storage cluster with the cluster-manager level of access on the dashboard. One of the highlights of this feature on the dashboard is that the OSD IDs can be preserved while replacing the failed OSDs.
Prerequisites
- A running Red Hat Ceph Storage cluster.
-
At least
cluster-managerlevel of access to the Ceph Dashboard. -
At least one of the OSDs is
down
Procedure
On the dashboard, you can identify the failed OSDs in the following ways:
- Dashboard AlertManager pop-up notifications.
- Dashboard landing page showing HEALTH_WARN status.
- Dashboard landing page showing failed OSDs.
Dashboard OSD page showing failed OSDs.

In this example, you can see that one of the OSDs is down on the landing page of the dashboard.
You can also view the LED blinking lights on the physical drive if one of the OSDs is down.
From Cluster→OSDs, on the OSDs List table, select the
outanddownOSD.- Click Flags from the action drop-down, select No Up in the Individual OSD Flags form, and click Update.
- Click Delete from the action drop-down. In the Delete OSD notification, select Preserve OSD ID(s) for replacement and Yes, I am sure and click Delete OSD.
- Wait until the status of the OSD changes to out and destroyed.
Optional: To change the No Up Flag for the entire cluster, from the Cluster-wide configuration menu, select Flags.
- In Cluster-wide OSDs Flags form, select No Up and click Update.
Optional: If the OSDs are down due to a hard disk failure, replace the physical drive:
- If the drive is hot-swappable, replace the failed drive with a new one.
- If the drive is not hot-swappable and the host contains multiple OSDs, you might have to shut down the whole host and replace the physical drive. Consider preventing the cluster from backfilling. See the Stopping and Starting Rebalancing chapter in the Red Hat Ceph Storage Troubleshooting Guide for details.
-
When the drive appears under the
/dev/directory, make a note of the drive path. - If you want to add the OSD manually, find the OSD drive and format the disk.
If the new disk has data, zap the disk:
Syntax
ceph orch device zap HOST_NAME PATH --forceExample
ceph orch device zap ceph-adm2 /dev/sdc --force
- From the Ceph Dashboard OSDs List, click Create.
In the Create OSDs form Advanced Mode section, add a primary device.
- In the Primary devices dialog, select a Hostname filter.
Select a device type from the list.
NoteYou have to select the Hostname first and then at least one filter to add the devices.
For example, from Hostname list, select
Typeand thenhdd.Select Vendor and from device list, select
ATA.
- Click Add.
- In the Create OSDs form, click Preview.
In the OSD Creation Preview dialog, click Create.
A notification displays that the OSD is created successfully and the OSD changes to be in the
outanddownstatus.
Select the newly created OSD that has out and down status.
- Click Mark In from the action drop-down.
In the Mark OSD in notification, click Mark In.
The OSD status changes to in.
- Click Flags from the action drop-down.
- Clear the No Up selection and click Update.
Optional: If you have changed the No Up flag before for cluster-wide configuration, in the Cluster-wide configuration menu, select Flags.
- In Cluster-wide OSDs Flags form, clear the No Up selection and click Update.
Verification
Verify that the OSD that was destroyed is created on the device and the OSD ID is preserved.

Chapter 11. Managing Ceph Object Gateway using the dashboard
As a storage administrator, the Ceph Object Gateway functions of the dashboard allow you to manage and monitor the Ceph Object Gateway.
You can also create the Ceph Object Gateway services with Secure Sockets Layer (SSL) using the dashboard.
For example, monitoring functions allow you to view details about a gateway daemon such as its zone name, or performance graphs of GET and PUT rates. Management functions allow you to view, create, and edit both users and buckets.
Ceph Object Gateway functions are divided between user functions and bucket functions.
11.1. Manually adding Ceph object gateway login credentials to the dashboard
The Red Hat Ceph Storage Dashboard can manage the Ceph Object Gateway, also known as the RADOS Gateway, or RGW. When Ceph Object Gateway is deployed with cephadm, the Ceph Object Gateway credentials used by the dashboard is automatically configured. You can also manually force the Ceph object gateway credentials to the Ceph dashboard using the command-line interface.
Prerequisites
- A running Red Hat Ceph Storage cluster.
- Dashboard is installed.
- Ceph Object Gateway is installed.
Procedure
Log into the Cephadm shell:
Example
[root@host01 ~]# cephadm shellSet up the credentials manually:
Example
[ceph: root@host01 /]# ceph dashboard set-rgw-credentialsThis creates a Ceph Object Gateway user with UID
dashboardfor each realm in the system.Optional: If you have configured a custom
adminresource in your Ceph Object Gateway admin API, you have to also set the the admin resource:Syntax
ceph dashboard set-rgw-api-admin-resource RGW_API_ADMIN_RESOURCEExample
[ceph: root@host01 /]# ceph dashboard set-rgw-api-admin-resource admin
Option RGW_API_ADMIN_RESOURCE updated
Optional: If you are using HTTPS with a self-signed certificate, disable certificate verification in the dashboard to avoid refused connections.
Refused connections can happen when the certificate is signed by an unknown Certificate Authority, or if the host name used does not match the host name in the certificate.
Syntax
ceph dashboard set-rgw-api-ssl-verify falseExample
[ceph: root@host01 /]# ceph dashboard set-rgw-api-ssl-verify False
Option RGW_API_SSL_VERIFY updated
Optional: If the Object Gateway takes too long to process requests and the dashboard runs into timeouts, you can set the timeout value:
Syntax
ceph dashboard set-rest-requests-timeout _TIME_IN_SECONDS_The default value of 45 seconds.
Example
[ceph: root@host01 /]# ceph dashboard set-rest-requests-timeout 240
11.2. Creating the Ceph Object Gateway services with SSL using the dashboard
After installing a Red Hat Ceph Storage cluster, you can create the Ceph Object Gateway service with SSL using two methods:
- Using the command-line interface.
- Using the dashboard.
Prerequisites
- A running Red Hat Ceph Storage cluster.
- Dashboard is installed.
- SSL key from Certificate Authority (CA).
Obtain the SSL certificate from a CA that matches the hostname of the gateway host. Red Hat recommends obtaining a certificate from a CA that has subject alternate name fields and a wildcard for use with S3-style subdomains.
Procedure
- From the dashboard navigation, go to Administration→Services.
- Click Create.
Fill in the Create Service form.
- Select rgw from the Type service list.
-
Enter the ID that is used in
service_id. - Select SSL.
Click Choose File and upload the SSL certificate
.pemformat.Figure 11.1. Creating Ceph Object Gateway service
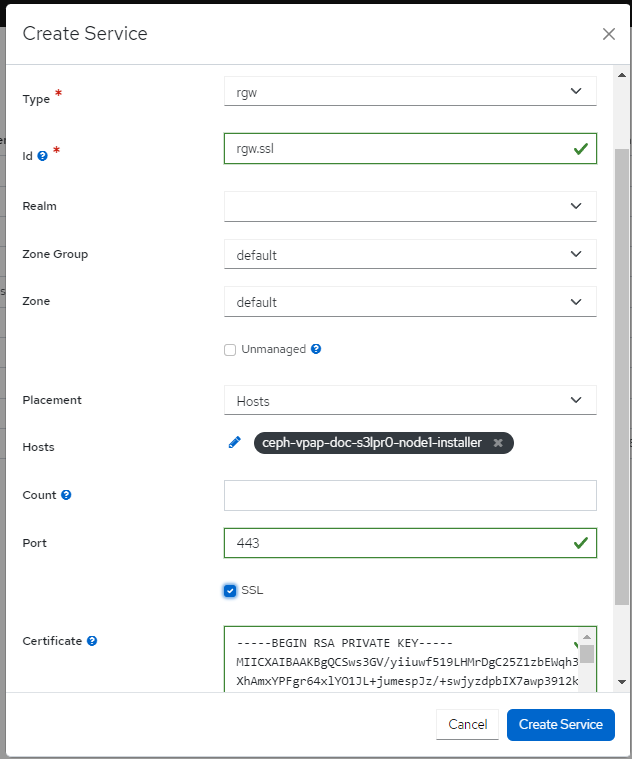
- Click Create Service.
- Check the Ceph Object Gateway service is up and running.
11.3. Configuring high availability for the Ceph Object Gateway on the dashboard
The ingress service provides a highly available endpoint for the Ceph Object Gateway. You can create and configure the ingress service using the Ceph Dashboard.
Prerequisites
- A running Red Hat Ceph Storage cluster.
- A minimum of two Ceph Object Gateway daemons running on different hosts.
- Dashboard is installed.
-
A running
rgwservice.
Procedure
- From the dashboard navigation, go to Administration→Services.
- Click Create.
-
In the Create Service form, select
ingressservice. Select backend service and edit the required parameters.
Figure 11.2. Creating
ingressservice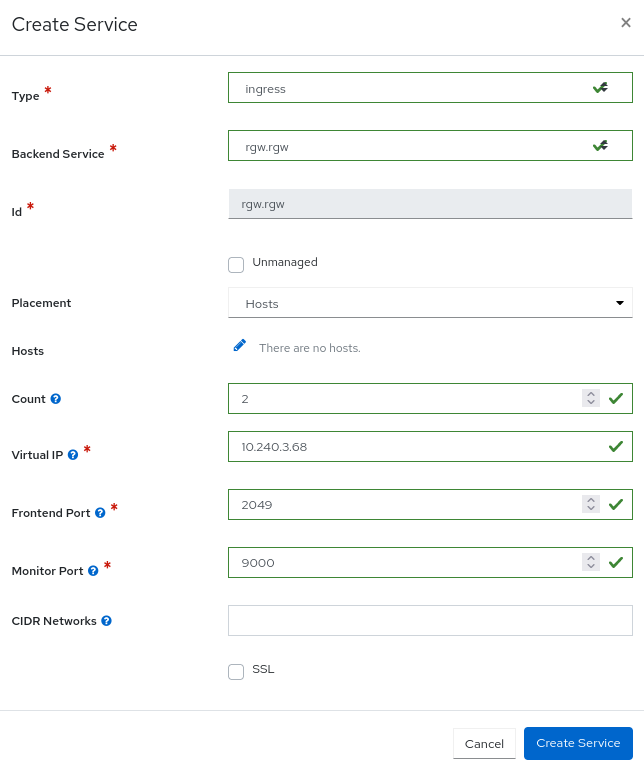
Click Create Service.
A notification displays that the
ingressservice was created successfully.
11.4. Managing Ceph Object Gateway users on the dashboard
As a storage administrator, the Red Hat Ceph Storage Dashboard allows you to view and manage Ceph Object Gateway users.
Prerequisites
- A running Red Hat Ceph Storage cluster.
- Dashboard is installed.
- The Ceph Object Gateway is installed.
- Object gateway login credentials are added to the dashboard.
11.4.1. Creating Ceph object gateway users on the dashboard
You can create Ceph object gateway users on the Red Hat Ceph Storage once the credentials are set-up using the CLI.
Prerequisites
- A running Red Hat Ceph Storage cluster.
- Dashboard is installed.
- The Ceph Object Gateway is installed.
- Object gateway login credentials are added to the dashboard.
Procedure
- From the dashboard navigation, go to Object→Users.
- On the Users tab, click Create.
Create User form, set the following parameters:
- Enter the User ID and Full name.
- If required, edit the maximum number of buckets.
- Optional: Fill in an Email address
- Optional: Select if the user is Suspended or a System user.
- Optional: In the S3 key section, set a custom access key and secret key by clearing the Auto-generate key selection.
- Optional: In the User quota section, select if the user quota is Enabled, Unlimited size, or has Unlimited objects. If there is a limited size enter the maximum size. If there are limited objects, enter the maximum objects.
- Optional: In the Bucket quota section, select if the bucket quota is Enabled, Unlimited size, or has Unlimited objects. If there is a limited size enter the maximum size. If there are limited objects, enter the maximum objects.
Click Create User.
Figure 11.3. Create Ceph object gateway user

A notification displays that the user was created successfully.
11.4.2. Adding roles to the Ceph Object Gateway users on the dashboard
You can add a role to a specific Ceph object gateway user on the Red Hat Ceph Storage dashboard.
Prerequisites
- Ceph Object Gateway is installed.
- Ceph Object gateway login credentials are added to the dashboard.
- Ceph Object gateway user is created.
Procedure
- Log in to the Dashboard.
- On the navigation bar, click Object Gateway.
- Click Roles.
- Select the user by clicking the relevant row.
- From Edit drop-down menu, select Create Role.
In the Create Role window, configure Role name, Path, and Assume Role Policy Document.
Figure 11.4. Create Ceph object gateway subuser
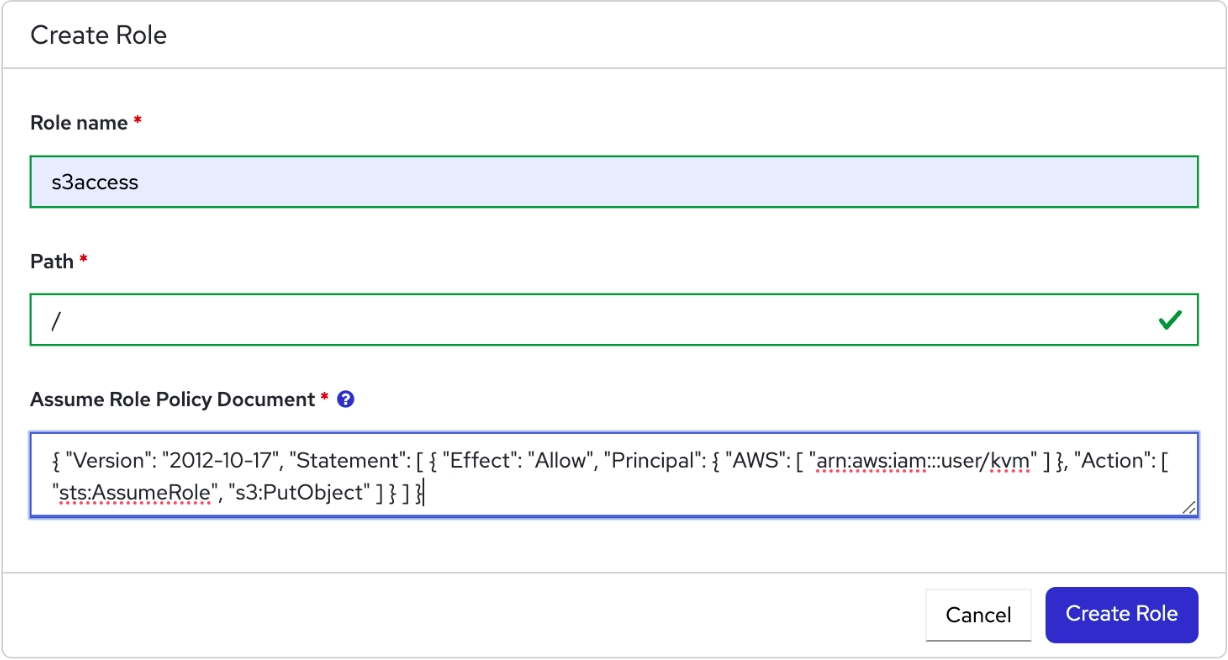
- Click Create Role.
11.4.3. Creating Ceph object gateway subusers on the dashboard
A subuser is associated with a user of the S3 interface. You can create a sub user for a specific Ceph object gateway user on the Red Hat Ceph Storage dashboard.
Prerequisites
- A running Red Hat Ceph Storage cluster.
- Dashboard is installed.
- The Ceph Object Gateway is installed.
- Object gateway login credentials are added to the dashboard.
- Object gateway user is created.
Procedure
- From the dashboard navigation, go to Object→Users.
- On the Uers tab, select a user and click Edit.
- In the Edit User form, click Create Subuser.
- In the Create Subuser dialog, enter the username and select the appropriate permissions.
Select the Auto-generate secret box and then click Create Subuser.
Figure 11.5. Create Ceph object gateway subuser
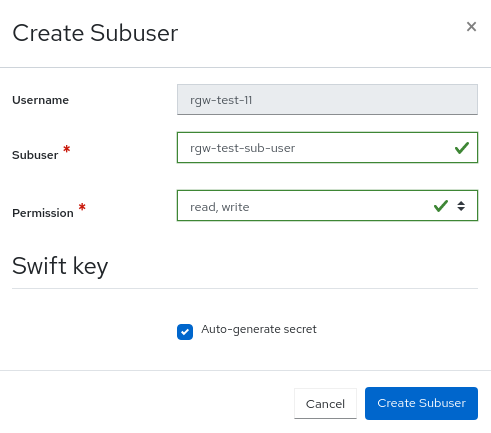 Note
NoteBy selecting Auto-generate-secret, the secret key for Object Gateway is generated automatically.
In the Edit User form, click Edit user.
A notification displays that the user was updated successfully.
11.4.4. Adding roles to Ceph Object Gateway users
You can add a role to a specific Ceph Object Gateway user on the Red Hat Ceph Storage Dashboard.
Prerequisites
- Ceph Object Gateway is installed.
- Ceph Object Gateway login credentials are added to the dashboard.
- Ceph Object Gateway user is created.
Procedure
- From the dashboard navigation, go to Object→Users and click on the Roles tab.
- Click Create.
- In the Create Pool form, enter the Role name, Path, and Assume Role Policy Document fields.
Click Create Role.
Figure 11.6. Create Role form

Save changes, by clicking Edit Pool.
A notification displays that the role was created successfully.
11.4.6. Deleting Ceph Object Gateway users on the dashboard
You can delete Ceph object gateway users on the Red Hat Ceph Storage once the credentials are set-up using the CLI.
Prerequisites
- A running Red Hat Ceph Storage cluster.
- Dashboard is installed.
- The Ceph Object Gateway is installed.
- Object gateway login credentials are added to the dashboard.
- A Ceph object gateway user is created.
Procedure
- From the dashboard navigation, go to Object→Users.
- Select the Username to delete, and click Delete from the action drop-down.
In the Delete user notification, select Yes, I am sure and click Delete User.
The user is removed from the Users table.
Figure 11.8. Delete Ceph object gateway user
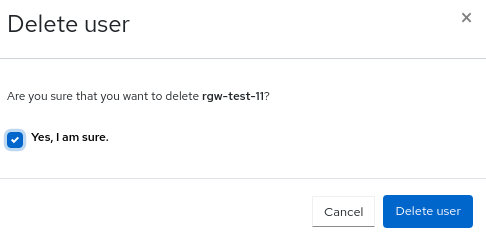
11.5. Managing Ceph Object Gateway buckets on the dashboard
As a storage administrator, the Red Hat Ceph Storage Dashboard allows you to view and manage Ceph Object Gateway buckets.
Prerequisites
- A running Red Hat Ceph Storage cluster.
- Dashboard is installed.
- The Ceph Object Gateway is installed.
- At least one Ceph Object Gateway user is created.
- Object gateway login credentials are added to the dashboard.
11.5.1. Creating Ceph object gateway buckets on the dashboard
You can create Ceph object gateway buckets on the Red Hat Ceph Storage once the credentials are set-up using the CLI.
Prerequisites
- A running Red Hat Ceph Storage cluster.
- Dashboard is installed.
- The Ceph Object Gateway is installed.
- Object gateway login credentials are added to the dashboard.
- Object gateway user is created and not suspended.
Procedure
- From the dashboard navigation, go to Object→Buckets.
Click Create.
The Create Bucket form displays.
- Enter a Name for the bucket.
- Select an Owner. The owner is a user that is not suspended.
Select a Placement target.
ImportantA bucket’s placement target cannot be changed after creation.
Optional: In the Locking section, select Enabled to enable locking for the bucket objects.
ImportantLocking can only be enabled while creating a bucket and cannot be changed after creation.
- Select the Mode, either Compliance or Governance.
- In the Days field, select the default retention period that is applied to new objects placed in this bucket.
Optional: In the Security section, select Security to encrypt objects in the bucket.
Set the configuration values for SSE-S3. Click the Encryption information icon and then Click here.
NoteWhen using
SSE-S3encryption type, Ceph manages the encryption keys that are stored in the vault by the user.- In the Update RGW Encryption Configurations dialog, ensure that SSE-S3 is selected as the Encryption Type.
- Fill the other required information.
Click Submit.
Figure 11.9. Encrypt objects in the bucket

In the Tags section, click Add to add bucket tags.
These tags are equivalent to the S3 PutBucketTagging. Enter the tag Key and tag Value to categorize your storage buckets.
Set the bucket policies in the Policies section.
Enter the Bucket policy. Use the Policy generator or Policy examples buttons to help create the bucket policies, as needed. Enter or modify the policy in JSON format.
Use the following links from within the form to help create your bucket policy. These links open a new tab in your browser.
Policy generator is an external tool from AWS to generate a bucket policy. For more information, see link::https://awspolicygen.s3.amazonaws.com/policygen.html[AWS Policy Generator].
NoteYou can use the policy generator with the S3 Bucket Policy type as a guideline for building your Ceph Object Gateway bucket policies.
Policy examples takes you to AWS documentation with examples of bucket policies.
For more information about managing bucket policies through the dashboard, see Managing Ceph Object Gateway bucket policies on the dashboard.
Set the Access Control Lists (ACL) grantee and permission information.
Expand Table 11.1. ACL user options Permission Bucket Object READGrantee can list the objects in the bucket.
Grantee can read the object.
WRITEGrantee can write or delete objects in the bucket.
N/A
FULL_CONTROLGrantee has full permissions for object in the bucket.
Grantee can read or write to the object ACL.
Click Create bucket.
A notification displays that the bucket was created successfully.
11.5.2. Editing Ceph object gateway buckets on the dashboard
You can edit Ceph object gateway buckets on the Red Hat Ceph Storage once the credentials are set-up using the CLI.
Prerequisites
- A running Red Hat Ceph Storage cluster.
- Dashboard is installed.
- The Ceph Object Gateway is installed.
- Object gateway login credentials are added to the dashboard.
- Object gateway user is created and not suspended.
- A Ceph Object Gateway bucket created.
Procedure
- From the dashboard navigation, go to Object>Buckets.
- On the navigation bar, click Object Gateway.
Select the bucket row that needs to be updated, and click Edit. The Edit Bucket displays.
Optional: Enable Versioning if you want to enable versioning state for all the objects in an existing bucket.
- To enable versioning, you must be the owner of the bucket.
- If Locking is enabled during bucket creation, you cannot disable the versioning.
- All objects added to the bucket will receive a unique version ID.
- If the versioning state has not been set on a bucket, then the bucket will not have a versioning state.
Optional: Select (Delete enabled) for Multi-Factor Authentication. Multi-Factor Authentication (MFA) ensures that users need to use a one-time password (OTP) when removing objects on certain buckets. Enter a value for Token Serial Number and Token PIN.
NoteThe buckets must be configured with versioning and MFA enabled which can be done through the S3 API.
- Optional: As needed, update the Tags and Policies. Updating the Policies includes updating the Bucket policy and Access Control Lists (ACL) grantee and permission information. For more information, see Creating Ceph object gateway buckets on the dashboard.
- Click Edit Bucket to save the changes. A notification displays that the bucket was updated successfully.
11.5.3. Deleting Ceph Object Gateway buckets on the dashboard
You can delete Ceph object gateway buckets on the Red Hat Ceph Storage once the credentials are set-up using the CLI.
Prerequisites
- A running Red Hat Ceph Storage cluster.
- Dashboard is installed.
- The Ceph Object Gateway is installed.
- Object Gateway login credentials are added to the dashboard.
- Object Gateway user is created and not suspended.
- A Ceph Object Gateway bucket created.
Procedure
- From the dashboard navigation, go to Object→Buckets.
- Select the bucket to be deleted, and click Delete from the action drop-down.
In the Delete Bucket notification, select Yes, I am sure and click Delete bucket.
Figure 11.10. Delete Ceph Object Gateway bucket
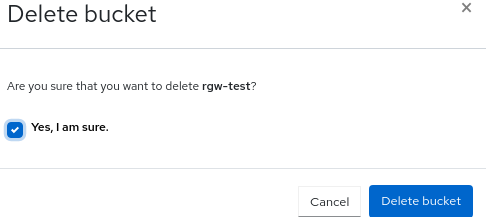
11.6. Monitoring multi-site object gateway configuration on the Ceph dashboard
The Red Hat Ceph Storage dashboard supports monitoring the users and buckets of one zone in another zone in a multi-site object gateway configuration. For example, if the users and buckets are created in a zone in the primary site, you can monitor those users and buckets in the secondary zone in the secondary site.
Prerequisites
- At least one running Red Hat Ceph Storage cluster deployed on both the sites.
- Dashboard is installed.
- The multi-site object gateway is configured on the primary and secondary sites.
- Object gateway login credentials of the primary and secondary sites are added to the dashboard.
- Object gateway users are created on the primary site.
- Object gateway buckets are created on the primary site.
Procedure
- From the dashboard navigation of the secondary site, go to Object→Buckets.
View the Object Gateway buckets on the secondary landing page that were created for the Object Gateway users on the primary site.
Figure 11.11. Multi-site Object Gateway monitoring
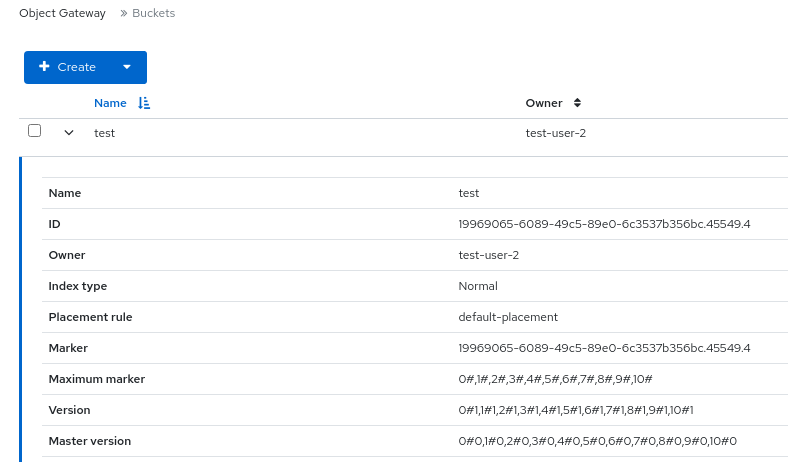
11.7. Viewing Ceph object gateway per-user and per-bucket performance counters on the dashboard
You can view the Ceph Object Gateway performance counters per user per bucket in the Grafana dashboard.
Prerequisites
- A running Red Hat Ceph Storage cluster.
- Dashboard is installed.
- Grafana is installed.
- The Ceph Object Gateway is installed.
- Object gateway login credentials are added to the dashboard.
- Object gateway user is created and not suspended.
Configure below parameters to Ceph Object Gateway service:
# ceph config set <rgw-service> <param> <value>
"rgw_bucket_counters_cache": "true"
"rgw_user_counters_cache": "true"
Procedure
Log in to the Grafana URL.
Syntax
https://DASHBOARD_URL:3000Example
https://dashboard_url:3000- Go to the 'Dashboard' tab and search for 'RGW S3 Analytics'.
To view per-bucket Ceph Object gateway operations, select the 'Bucket' panel:
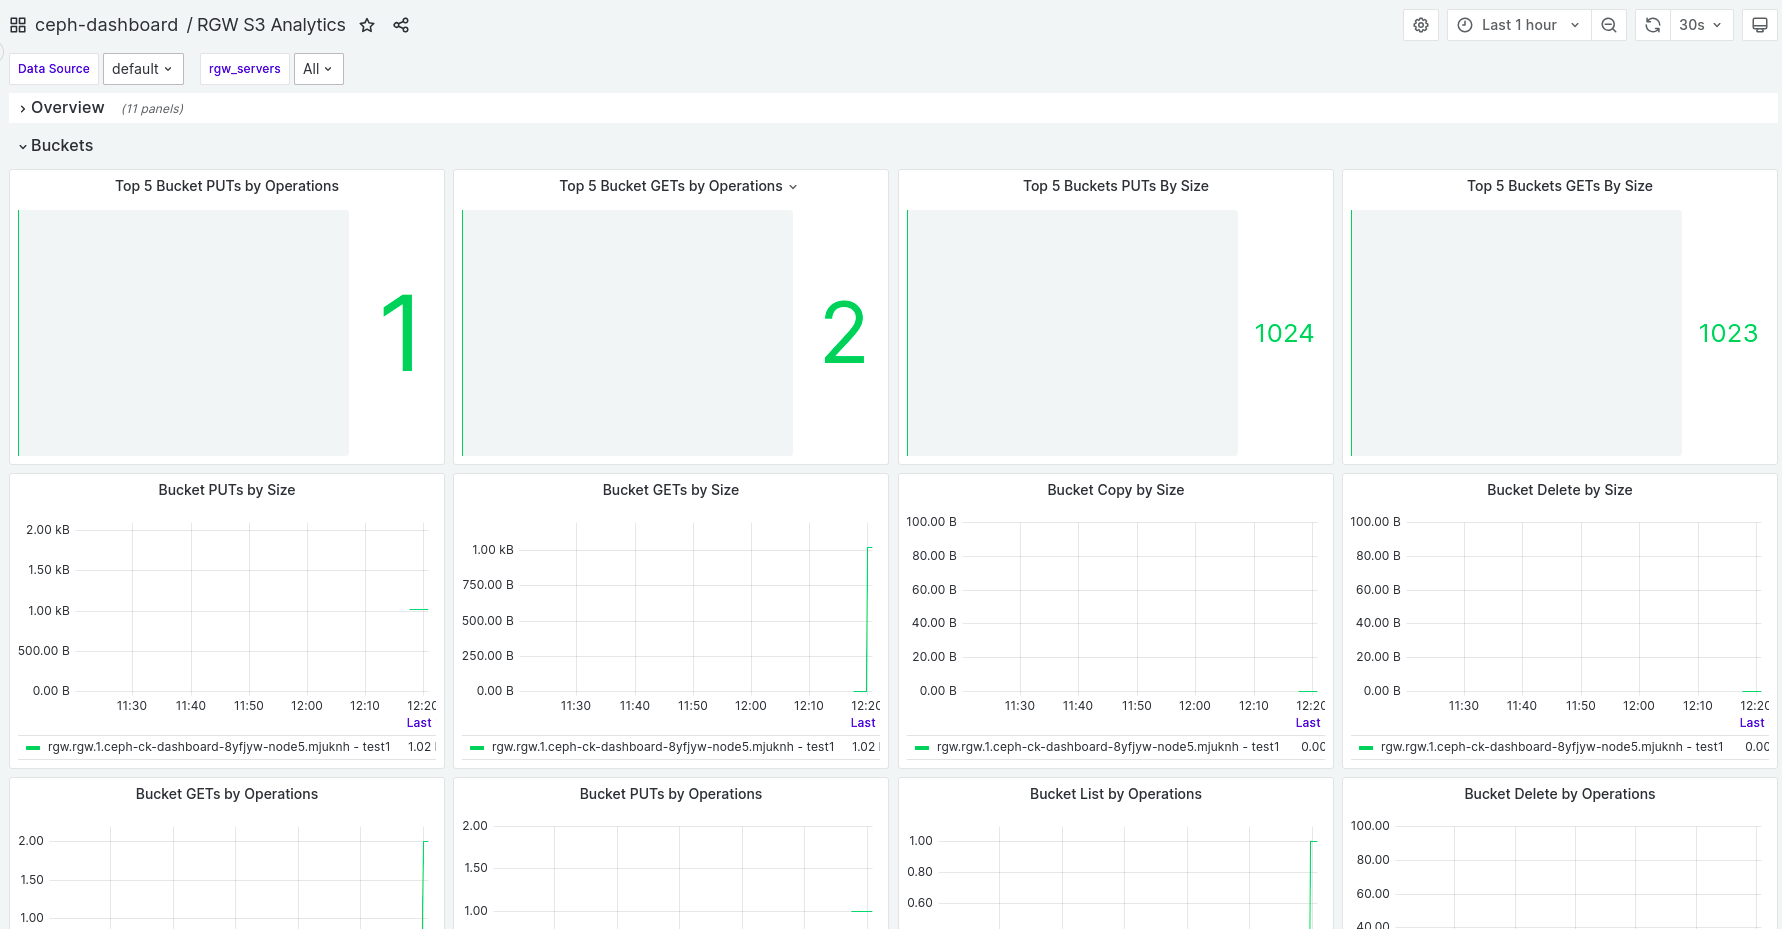
To view user-level Ceph Object gateway operations, select the 'User' panel:
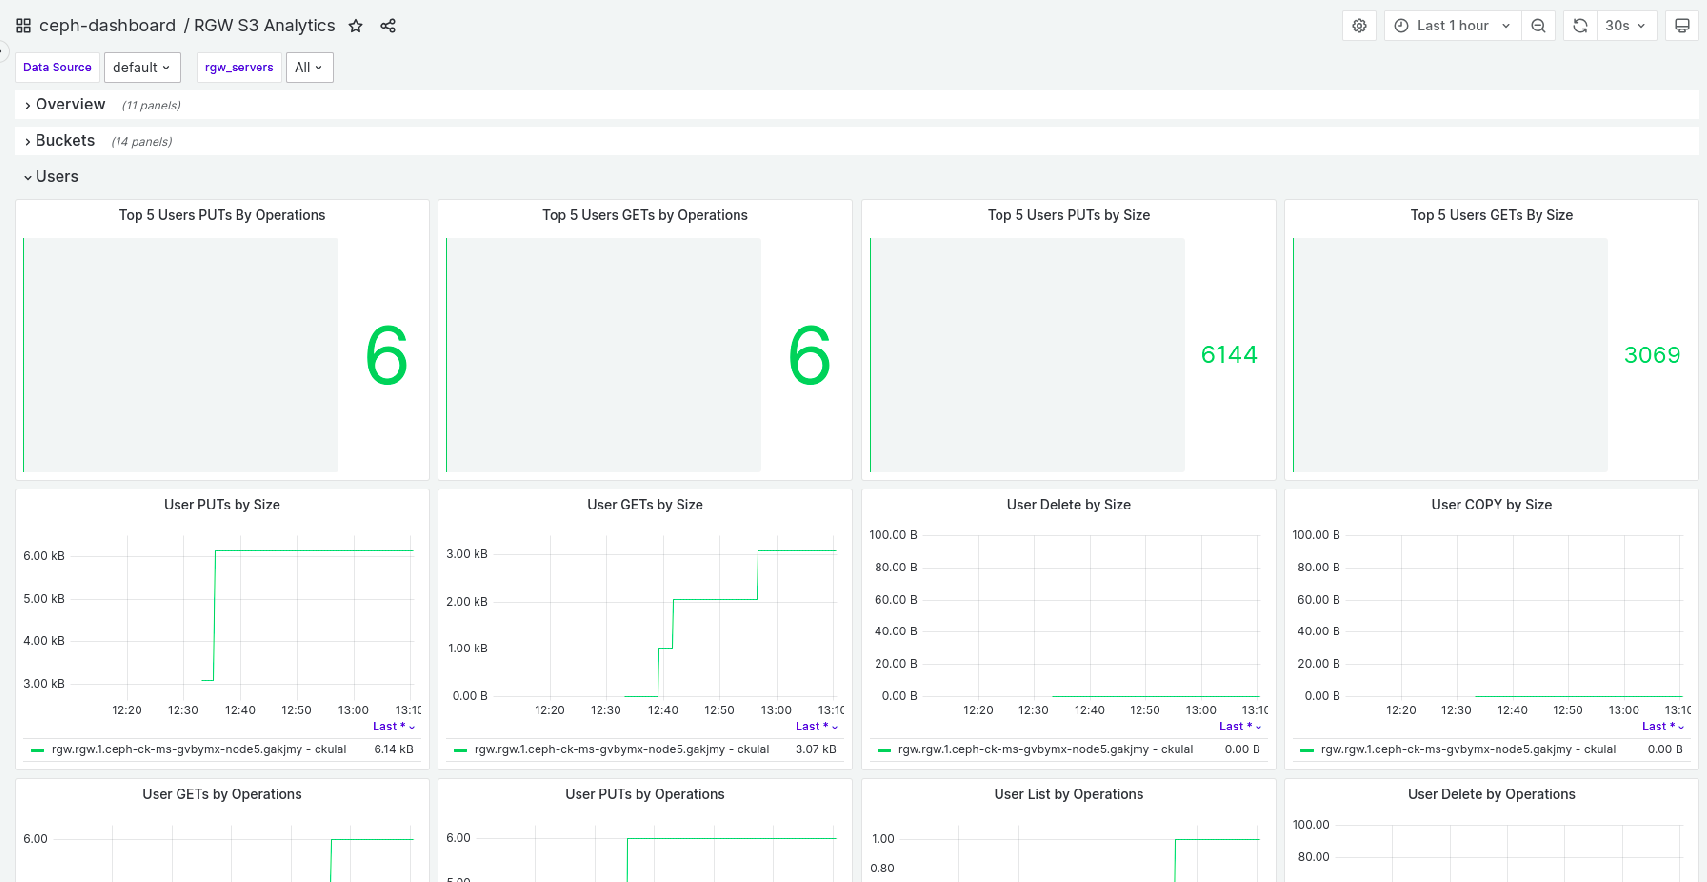
The output of per-bucket/per-user get operation count command increases by two for each 'get' operation run from client: s3cmd. This is a known issue.
11.8. Managing Ceph Object Gateway bucket policies on the dashboard
As a storage administrator, the Red Hat Ceph Storage Dashboard allows you to view and manage Ceph Object Gateway bucket policies.
Prerequisites
- A running Red Hat Ceph Storage cluster.
- Dashboard is installed.
- The Ceph Object Gateway is installed.
- At least one Ceph object gateway user is created.
- Ceph Object Gateway login credentials are added to the dashboard.
- At least one Ceph Object Gateway bucket. For more information about creating a bucket, see Creating Ceph Object Gateway buckets on the dashboard.
11.8.1. Creating and editing Ceph Object Gateway bucket policies on the dashboard
You can create and edit Ceph Object Gateway bucket policies on the Red Hat Ceph Storage dashboard.
Prerequisites
- A running Red Hat Ceph Storage cluster.
- Dashboard is installed.
- The Ceph Object Gateway is installed.
- At least one Ceph object gateway user is created.
- Ceph Object Gateway login credentials are added to the dashboard.
- At least one Ceph Object Gateway bucket. For more information about creating a bucket, see Creating Ceph Object Gateway buckets on the dashboard.
Procedure
- From the dashboard, go to Object → Buckets.
Create or modify a bucket policy for an existing bucket.
NoteTo create a bucket policy during bucket creation, click Create and fill in the bucket policy information in the Policies section of the Create Bucket form.
Select the bucket for which the bucket policy will be created or modified, and then click Edit.
- In the Create Bucket form, go to Policies.
Enter or modify the policy in JSON format.
Use the following links from within the form to help create your bucket policy. These links open a new tab in your browser.
Policy generator is an external tool from AWS to generate a bucket policy. For more information, see AWS Policy Generator.
NoteYou can use the policy generator with the
S3 Bucket Policytype as a guideline for building your Ceph Object Gateway bucket policies.- Policy examples takes you to AWS documentation with examples of bucket policies.
To save the bucket policy, click Edit Bucket.
NoteWhen creating a bucket policy during an initial bucket creation, click Create Bucket.
When the bucket policy is saved, the
Updated Object Gateway bucket `bucketname`notification is displayed.
11.8.2. Deleting Ceph Object Gateway bucket policies on the dashboard
You can delete Ceph Object Gateway bucket policies on the Red Hat Ceph Storage dashboard.
Prerequisites
- A running Red Hat Ceph Storage cluster.
- Dashboard is installed.
- The Ceph Object Gateway is installed.
- At least one Ceph object gateway user is created.
- Ceph Object Gateway login credentials are added to the dashboard.
- At least one Ceph Object Gateway bucket. For more information about creating a bucket, see Creating Ceph Object Gateway buckets on the dashboard.
Procedure
- From the dashboard, go to Object → Buckets.
- Select the bucket for which the bucket policy will be created or modified, and then click Edit.
- In the Edit Bucket form, go to Policies.
- Click Clear.
To complete the bucket policy deletion, click Edit Bucket.
When the bucket policy is deleted, the
Updated Object Gateway bucket `bucketname`notification is displayed.
11.9. Management of buckets of a multi-site object configuration on the Ceph dashboard
As a storage administrator, you can edit buckets of one zone in another zone on the Red Hat Ceph Storage Dashboard. However, you can delete buckets of secondary sites in the primary site. You cannot delete the buckets of master zones of primary sites in other sites. For example, If the buckets are created in a zone in the secondary site, you can edit and delete those buckets in the master zone in the primary site.
Prerequisites
- At least one running Red Hat Ceph Storage cluster deployed on both the sites.
- Dashboard is installed.
- The multi-site object gateway is configured on the primary and secondary sites.
- Object gateway login credentials of the primary and secondary sites are added to the dashboard.
- Object gateway users are created on the primary site.
- Object gateway buckets are created on the primary site.
-
At least
rgw-managerlevel of access on the Ceph dashboard.
11.9.1. Monitoring buckets of a multi-site object
Monitor the multi-site sync status of a bucket on the dashboard. You can view the source zones and sync status from Object→Multi-site on the Ceph Dashboard.
The multi-site sync status is divided into two sections:
- Primary Source Zone
- Displays the default realm, zonegroup, and the zone the Ceph Object Gateway is connected to.
- Source Zones
-
View both the metadata sync status and data sync information progress. When you click the status, a breakdown of the shard syncing is displayed. The sync status shows the Last Synced time stamp with the relative time of the last sync occurrence in relation to the current time. When the sync is complete, this shows as Up to Date. When a sync is not caught up the
statusshows asSyncing. However, theLast syncshows the number of days the sync is not caught up. By clickingSyncing, it displays the details about shards which are not synced.
11.9.2. Editing buckets of a multi-site Object Gateway configuration on the Ceph Dashboard
You can edit and update the details of the buckets of one zone in another zone on the Red Hat Ceph Storage Dashboard in a multi-site object gateway configuration. You can edit the owner, versioning, multi-factor authentication and locking features of the buckets with this feature of the dashboard.
Prerequisites
- At least one running Red Hat Ceph Storage cluster deployed on both the sites.
- Dashboard is installed.
- The multi-site object gateway is configured on the primary and secondary sites.
- Object gateway login credentials of the primary and secondary sites are added to the dashboard.
- Object gateway users are created on the primary site.
- Object gateway buckets are created on the primary site.
-
At least
rgw-managerlevel of access on the Ceph dashboard.
Procedure
From the dashboard navigation of the secondary site, go to Object→Buckets.
The Object Gateway buckets from the primary site are displayed.
- Select the bucket that you want to edit, and click Edit from the action drop-down.
In the Edit Bucket form, edit the required prameters, and click Edit Bucket.
A notification is displayed that the bucket is updated successfully.
Figure 11.12. Edit buckets in a multi-site

11.9.3. Deleting buckets of a multi-site Object Gateway configuration on the Ceph Dashboard
You can delete buckets of secondary sites in primary sites on the Red Hat Ceph Storage Dashboard in a multi-site Object Gateway configuration.
Red Hat does not recommend to delete buckets of primary site from secondary sites.
Prerequisites
- At least one running Red Hat Ceph Storage cluster deployed on both the sites.
- Dashboard is installed.
- The multi-site object gateway is configured on the primary and secondary sites.
- Object Gateway login credentials of the primary and secondary sites are added to the dashboard.
- Object Gateway users are created on the primary site.
- Object Gateway buckets are created on the primary site.
-
At least
rgw-managerlevel of access on the Ceph dashboard.
Procedure
- From the dashboard navigation of the primary site, go to Object→Buckets.
- Select the bucket of the secondary site to be deleted, and click Delete from the action drop-down.
In the Delete Bucket notification, select Yes, I am sure and click Delete bucket.
The bucket is deleted from the Buckets table.
11.10. Configuring a multi-site object gateway on the Ceph dashboard
You can configure Ceph Object Gateway multi-site on the Red Hat Ceph Storage Dashboard.
Prerequisites
- A running Red Hat Ceph Storage cluster deployed on both the sites.
- At least one Ceph Object Gateway service installed at both the sites.
Procedure
Enable the Ceph Object Gateway module for import/export on both the the primary and secondary sites.
- From the dashboard navigation of the secondary site, go to Object→Multi-site.
- In the In order to access the import/export feature, the rgw module must be enabled note, click Enable.
On the primary site dashboard, create a default realm, zonegroup, and zone.
- Click Create Realm.
- In the Create Realm form, provide a realm name, and select Default.
- Click Create Realm.
- Click Create Zone Group from the action drop-down.
- In the Create Zone Group form, provide a zone group name, the Ceph Object Gateway endpoints, and select Default.
- Click Create Zone Group.
- Click Create Zone from the action drop-down.
In the Create Zone form, provide a Zone Name, select Default, and provide the Ceph Object Gateway endpoints of the primary site. For the user, provide the access and secret key of the user with system privileges.
Note-
While creating a zone, Red Hat recommends to give access key and secret key of the dashboard default user,
dashboard. - Starting from Red Hat Ceph Storage 7.0z2, it is no longer mandatory to provide an access or secret key when creating a zone.
-
While creating a zone, Red Hat recommends to give access key and secret key of the dashboard default user,
Click Create Zone.
A warning is displayed to restart the Ceph Object Gateway service to complete the zone creation.
Restart the Ceph Object Gateway service.
- From the dashboard navigation of the secondary site, go to Administration→Services.
- Select the Ceph Object Gateway service row and expand the row.
- From the Daemons tab, select the hostname.
- Click Restart from the action drop-down.
From the dashboard navigataion, in Object→Overview you get an error that "The Object Gateway Service is not configured". This bug is a known issue. See BZ#2231072.
As a workaround, set the Ceph Object Gateway credentials on the command-line interface.
Syntax
ceph dashboard set-rgw-credentials RGW credentials configured- Go to Object→Overview to verify that you are able to access the Ceph Object Gateway on the dashboard.
Create a replication user on the primary site. You can use the following two options:
Create user using the CLI:
Example
[ceph: root@host01 /]# radosgw-admin user create --uid="uid" --display-name="displayname" --systemCreate user from the dashboard and modify the user from the CLI:
Example
[ceph: root@host01 /]# radosgw-admin user modify --uid="uid" --system
- From the dashboard navigation, go to Object→Users.
Expand the user row and from Keys, click Show.
Use the Copy to Clipboard to copy the access and secret keys.
These will be used in a later step.
From the primary site dashboard, go to Object→Multi-site.
- From the Topology Viewer, select the zone and click the Edit icon.
- From the Edit Zone form, paste the access key in the S3 access key field and the secret key in the S3 secret key field. Use the keys that were copied previously.
- Click Edit Zone.
Click Export.
- From the Export Multi-site Realm Token dialog, copy the token.
- From the secondary site, go to Object→Multi-site.
Import the token from the primary zone, by clicking Import.
- In the Import Multi-site Token dialog, in the Zone section, paste the token that was copied earlier, and provide a secondary zone name.
- In the Service section, select the placement and the port where the new Ceph Object Gateway service is going to be created.
Click Import.
A warning is displayed to restart the Ceph Object Gateway service.
Restart the Ceph Object Gateway service.
- From the dashboard navigation of the secondary site, go to Administration→Services.
- Select the Ceph Object Gateway service row and expand the row.
- From the Daemons tab, select the hostname.
Click Restart from the action drop-down.
Wait until the users are synced to the secondary site.
Verify that the sync is complete using the following commands:
Syntax
radosgw-admin sync status
radosgw-admin user list
Example
[ceph: root@host01 /]# radosgw-admin sync status
[ceph: root@host01 /]# radosgw-admin user list
In Object→Overview you get an error that "The Object Gateway Service is not configured". This bug is a known issue. See BZ#2231072.
As a workaround, set the Ceph Object Gateway credentials on the command-line interface.
Syntax
ceph dashboard set-rgw-credentials RGW credentials configured- Go to Object→Overview to verify that you are able to access the Ceph Object Gateway on the dashboard.
On the primary site, Object→Overview, in the Multi-Site Sync Status section, an error is displayed because on the secondary zone you can see that the endpoints and the hostname are not the IP address. This bug is a known issue while configuring multi-site. See BZ#2242994.
- As a workaround, from the secondary site dashboard, go to Object→Multi-site.
- Select the secondary zone and click the Edit icon.
- Edit the endpoints to reflect the IP address.
- Click Edit Zone.
On the primary site and secondary site dashboards, from Object→Overview, in the Multi-Site Sync Status section, the status displays.
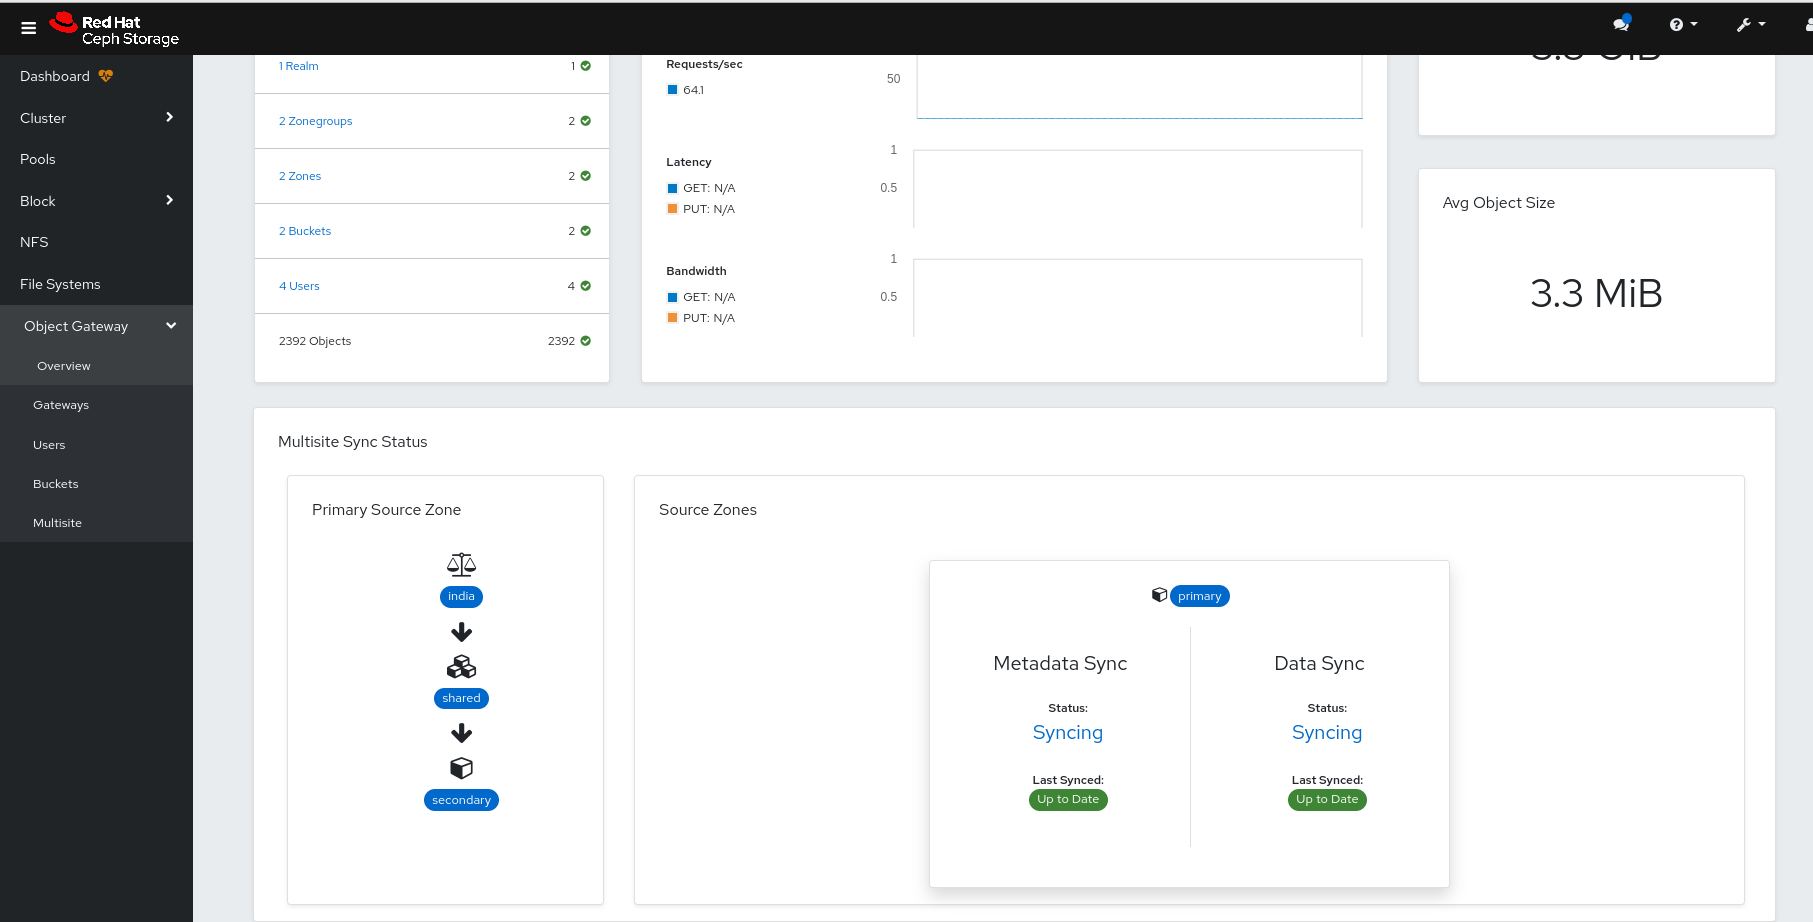
Verification
- Create a user on the primary site. You see that the user syncs to the secondary site.
Chapter 12. Managing file systems using the Ceph dashboard
As a storage administrator, you can create, edit, delete, and manage accesses of file systems on the Red Hat Ceph Storage dashboard.
12.1. Configuring CephFS volumes
As a storage administrator, you can configure Ceph File System (CephFS) volumes on the Red Hat Ceph Storage dashboard.
12.1.1. Creating CephFS volumes
You can create Ceph File System (CephFS) volumes on the Red Hat Ceph Storage dashboard.
Prerequisites
- A working Red Hat Ceph Storage cluster with MDS deployed.
Procedure
- From the dashboard navigation, go to File > File Systems.
- Click Create.
In the Create Volume window, set the following parameters:
- Name: Set the name of the volume.
- Placement (Optional): Select the placement of the volume. You can set it as either Hosts or Label.
Hosts/Label (Optional): If placement is selected as Hosts in the previous option, then select the appropriate host from the list. If placement is selected as Label in the previous option, then enter the label.
[IMPORTANT]: To identify the label that has been created for the hosts while using it as a placement, you can run the following command from the CLI:
[ceph: root@ceph-hk-ds-uoayxl-node1-installer /]# ceph orch host ls

HOST ADDR LABELS STATUS

host01 10.0.210.182 _admin,installer,mon,mgr
host02 10.0.96.72 mon,mgr
host03 10.0.99.37 mon,mds
host04 10.0.99.244 osd,mds
host05 10.0.98.118 osd,mds
host06 10.0.98.66 osd,nfs,mds
host07 10.0.98.23 nfs,mds
7 hosts in cluster
Click Create Volume.
- A notification displays that the volume was created successfully.
12.1.2. Editing CephFS volumes
You can edit Ceph File System (CephFS) volumes on the Red Hat Ceph Storage dashboard.
Prerequisites
- A working Red Hat Ceph Storage cluster with Ceph File System deployed.
Procedure
- From the dashboard navigation, go to File > File Systems.
- From the listed volumes, select the volume to be edited and click Edit.
In the Edit File System window, rename the volume as required and click Edit File System.
A notification displays that the volume was edited successfully.
12.1.3. Removing CephFS volumes
You can remove Ceph File System (CephFS) volumes on the Red Hat Ceph Storage dashboard.
Prerequisites
- A working Red Hat Ceph Storage cluster with Ceph File System deployed.
Procedure
- From the dashboard navigation, go to File > File Systems.
- From the listed volumes, select the volume to be removed and click Remove from the action drop-down.
In the Remove File System window, select Yes, I am sure and click Remove File System.
A notification displays that the volume was removed successfully.
12.2. Configuring CephFS subvolume groups
As a storage administrator, you can configure Ceph File System (CephFS) subvolume groups on the Red Hat Ceph Storage dashboard.
12.2.1. Creating CephFS subvolume groups
You can create subvolume groups to create subvolume on the dashboard. You can also use subvolume groups to apply policies across a set of subvolumes.
Prerequisites
- A working Red Hat Ceph Storage cluster with Ceph File System deployed.
Procedure
- From the dashboard navigation, go to File > File Systems.
- From the listed volumes, select the row for which you want to create subvolumes and expand the row.
- From the Subvolume groups tab, click 'Create' to create a subvolume group.
In the Create Subvolume group window, enter the following parameters:
- Name: Set the name of the subvolume group.
- Volume name: Validate that the correct name of the volume is selected.
- Size: Set the size of the subvolume group. If left blank or entered as 0, then, by default, the size will be set as infinite.
- Pool: Set the pool of the subvolume group. By default, data_pool_layout of the parent directory is selected.
- UID: Set the UID of the subvolume group.
- GID: Set the GID of the subvolume group.
- Mode: Set the permissions for the directory. By default, the mode is 755 which is rwxr-xr-x.
Click Create Subvolume group.
A notification displays that the subvolume group was created successfully.
12.2.2. Editing CephFS subvolume groups
You can edit the subvolume groups on the dashboard.
Prerequisites
- A working Red Hat Ceph Storage cluster with Ceph File System deployed.
Procedure
- From the dashboard navigation, go to File > File Systems.
- From the listed volumes, select the row for which you want to edit a subvolumes and expand the row.
- From the Subvolume groups tab, select the row containing the group that you want to edit.
- Click Edit to edit a subvolume group.
In the Edit Subvolume group window, edit the needed parameters and click Edit Subvolume group.
A notification displays that the subvolume group was edited successfully.
12.2.3. Removing CephFS subvolume groups
You can remove Ceph File System (CephFS) subvolume groups on the Red Hat Ceph Storage dashboard.
Ensure to remove the subvolume within the subvolume group before removing the subvolume group.
Prerequisites
- A working Red Hat Ceph Storage cluster with Ceph File System deployed.
Procedure
- From the dashboard navigation, go to File > File Systems.
- From the listed volumes, select the row for which you want to remove a subvolume and expand the row.
- Under the Subvolume groups tab, select the subvolume group you want to remove, and click Remove from the action drop-down.
In the Remove Subvolume group window, select 'Yes, I am sure', and click Remove Subvolume group.
A notification displays that the subvolume group was removed successfully.
12.3. Configuring CephFS subvolumes
As a storage administrator, you can configure Ceph File System (CephFS) subvolumes on the Red Hat Ceph Storage dashboard.
12.3.1. Creating CephFS subvolume
You can create Ceph File System (CephFS) subvolume on the Red Hat Ceph Storage dashboard.
Ensure to remove the subvolume within the subvolume group before removing the subvolume group.
Prerequisites
- A working Red Hat Ceph Storage cluster with Ceph File System deployed.
Procedure
- From the dashboard navigation, go to File > File Systems.
- From the listed volumes, select the row.
Under the Subvolume tab, select the Subvolume group in which you want to create the subvolume.
NoteIf you select the Default option, the subvolumes are not created under any subvolume groups.
- Click Create to create a subvolume.
In the Create Subvolume window, enter the following parameters:
- Name: Set the name of the subvolume group.
- Subvolume name: Set the name of the volume.
- Size: Set the size of the subvolume group. If left blank or entered as 0, then, by default, the size will be set as infinite.
- Pool: Set the pool of the subvolume group. By default, data_pool_layout of the parent directory is selected.
- UID: Set the UID of the subvolume group.
- GID: Set the GID of the subvolume group.
- Mode: Set the permissions for the directory. By default, the mode is 755 which is rwxr-xr-x.
- Isolated Namespace: If you want to create the subvolume in a separate RADOS namespace, select this option.
Click Create Subvolume.
A notification that the subvolume was created successfully is displayed.
12.3.2. Editing CephFS subvolume
You can edit Ceph File System (CephFS) subvolume on the Red Hat Ceph Storage dashboard.
You can only edit the size of the subvolumes on the dashboard.
Prerequisites
- A working Red Hat Ceph Storage cluster with Ceph File System deployed.
- A subvolume created.
Procedure
- From the dashboard navigation, go to File > File Systems.
- From the listed volumes, select the row.
- Under the Subvolume tab, select the subvolume you want to edit, and click Edit within the volume.
- Click Create to create a subvolume.
In the Edit Subvolume window, enter the following parameters:
- Name: Set the name of the subvolume group.
- Subvolume name: Set the name of the volume.
- Size: Set the size of the subvolume group. If left blank or entered as 0, then, by default, the size will be set as infinite.
- Pool: Set the pool of the subvolume group. By default, data_pool_layout of the parent directory is selected.
- UID: Set the UID of the subvolume group.
- GID: Set the GID of the subvolume group.
- Mode: Set the permissions for the directory. By default, the mode is 755 which is rwxr-xr-x.
Click Edit Subvolume.
A notification that the subvolume was created successfully is displayed.
12.3.3. Removing CephFS subvolume
You can remove Ceph File System (CephFS) subvolume on the Red Hat Ceph Storage dashboard.
Prerequisites
- A working Red Hat Ceph Storage cluster with Ceph File System deployed.
- A subvolume created.
Procedure
- From the dashboard navigation, go to File > File Systems.
- From the listed volumes, select the row.
- Navigate to Subvolume tab, select the subvolume you want to remove, and click Remove.
In the Remove Subvolume window, confirm whether you want to remove the selected subvolume and click Remove Subvolume.
A notification that the subvolume was removed successfully is displayed.
12.4. Managing CephFS snapshots
As a storage administrator, you can cretate Ceph File System (CephFS) volume and subvolume snapshots on the Red Hat Ceph Storage dashboard.
The Ceph File System (CephFS) snapshots create an immutable, point-in-time view of a Ceph File System. CephFS snapshots are asynchronous and are kept in a special hidden directory in the CephFS directory named .snap. You can specify snapshot creation for any directory within a Ceph File System. When specifying a directory, the snapshot also includes all the subdirectories beneath it.
CephFS snapshot feature is enabled by default on new Ceph File Systems, but it must be manually enabled on existing Ceph File Systems.
Each Ceph Metadata Server (MDS) cluster allocates the snap identifiers independently. Using snapshots for multiple Ceph File Systems that are sharing a single pool causes snapshot collisions, and results in missing file data.
12.4.1. Creating CephFS subvolume snapshots
As a storage administrator, you can create Ceph File System (CephFS) subvolume snapshot on the Red Hat Ceph Storage dashboard. You can create an immutable, point-in-time view of a Ceph File System (CephFS) by creating a snapshot.
Prerequisites
- A running Red Hat Ceph Storage cluster.
- A subvolume group with corresponding subvolumes.
Procedure
- Log into the dashboard.
- On the dashboard navigation menu, click File > File Systems.
Select the CephFS where you want to create the subvolune snapshot.
If there are no file systems available, create a new file system.
- Go to the Snapshots tab. There are three columns - Groups, Subvolumes, and Create.
- From the Groups and Subvolumes columns, select the group and the subvolume for which you want to create a snapshot.
Click Create in the third column. The Create snapshot form opens.
- Name: A default name (date and time of the creation of snapshot) is already added. You can edit this name and add a new name.
- Volume name: The volume name is the file system name. It is already added to the form as per your selection.
- Subvolume group: The subvolume group name is already added as per your selection. Alternatively, you select a different subvolume group from the dropdown list.
- Subvolume: The subvolume name is already added as per your selection. Alternatively, you can select a different subvolume from the dropdown list.
Click Create Snapshot.
A notification is displayed that the snapshot is created successfully.
Verification
- Navigate to the Snapshots tab, select the subvolume and subvoume group for which the snapshot is created.
12.4.2. Deleting CephFS subvolume snapshots
As a storage administrator, you can create Ceph File System (CephFS) subvolume snapshot on the Red Hat Ceph Storage dashboard. You can create an immutable, point-in-time view of a Ceph File System (CephFS) by creating a snapshot.
Prerequisites
- A running Red Hat Ceph Storage cluster.
- A subvolume group with corresponding subvolumes.
Procedure
- Log into the dashboard.
- On the dashboard navigation menu, click File > File Systems.
- Select the CephFS where you want to delete the subvolume snapshot.
- Go to the Snapshots tab.
- Select the snapshot you want to delete. You can list the snapshot by selecting the subvolume group and subvoume for which the snapshot is created.
- Check the box 'Yes, I am sure' to confirm you want to delete the snapshot.
Click Delete Snapshot.
A notification is displayed that the snapshot is deleted successfully.
12.4.3. Cloning CephFS subvolume snapshots
As a storage administrator, you can clone Ceph File System (CephFS) subvolume snapshot on the Red Hat Ceph Storage dashboard.
Prerequisites
- A running Red Hat Ceph Storage cluster.
- A subvolume snapshot.
Procedure
- Log into the dashboard.
- On the dashboard navigation menu, click File > File Systems.
- Select the CephFS where you want to clone the subvolume snapshot.
- Go to the Snapshots tab.
- Select the snapshot you want to clone. You can list the snapshot by selecting the subvolume group and subvoume for which the snapshot is created. Check the box 'Yes, I am sure' to confirm you want to delete the snapshot.
- Click the arrow next to the Delete button.
Click Clone and configure the following.
- Name: A default name (date and time of the creation of clone) is already added. You can change this name and add a new name.
- Group name: The subvolume group name is already added as per your selection. Alternatively, you select a different subvolume group from the dropdown list.
Click Create Clone.
A notification is displayed that the clone is created successfully.
- You can verify that the clone is created by going to the Snapshots tab, in the Subvolume column. Select the subvoume group for which the clone is created.
12.4.4. Creating CephFS volume snapshots
As a storage administrator, you can create Ceph File System (CephFS) volume snapshot on the IBM Storage Ceph dashboard. You can create an immutable, point-in-time view of a Ceph File System (CephFS) volume by creating a snapshot.
Prerequisites
- A running Red Hat Ceph Storage cluster.
- A subvolume group with corresponding subvolumes.
Procedure
- Log into the dashboard.
- On the dashboard navigation menu, click File > File Systems.
Select the CephFS where you want to create the subvolume snapshot.
If there are no file systems available, create a new file system.
- Go to the Directories tab.
- From the list of the subvolume and volumes, select the volume for which you want to create the snapshot.
Click Create in the Snapshot row. The Create Snapshot form opens.
- Name: A default name (date and time of the creation of snapshot) is already added. You can edit this name and add a new name.
Click Create Snapshot.
A notification is displayed that the snapshot is created successfully.
- You can verify that the snapshot is created from the Snapshots row in the Directories tab
12.4.5. Deleting CephFS volume snapshots
As a storage administrator, you can delete Ceph File System (CephFS) volume snapshot on the Red Hat Ceph Storage dashboard.
Prerequisites
- A running Red Hat Ceph Storage cluster.
- A volume snapshot.
Procedure
- Log into the dashboard.
- On the dashboard navigation menu, click File > File Systems.
- Select the CephFS where you want to delete the subvolume snapshot.
- Go to the Directories tab.
- Select the snapshot you want to delete. You can see list of snapshots in the Snapshot row.
- Click 'Delete'.
- Check the box Yes, I am sure to confirm you want to delete the snapshot.
Click Delete CephFS Snapshot.
A notification is displayed that the snapshot is deleted successfully.
12.5. Scheduling CephFS snapshots
As a storage administrator, you can schedule Ceph File System (CephFS) snapshots on the Red Hat Ceph Storage dashboard.
Scheduling Ceph File System (CephFS) snapshots ensures consistent reliable backups at regular intervals, reducing the risk of data loss. Scheduling snapshots also provides ease of management by reducing administrative overhead of manually managing backups.
A list of available snapshots for a particular file system, subvolume, or directory is found on the File > File Systems page. Use the snapshot list for creating scheduled backups.
12.5.1. Creating CephFS snapshot schedule
As a storage administrator, you can create Ceph File System (CephFS) snapshot schedules on the Red Hat Ceph Storage dashboard.
Create a policy for automatic creation of Ceph File System (CephFS) snapshot of a volume or a certain directory. You can also define how often you want to schedule it (for example: every hour, every day, every week, etc.)
You can specify the number of snapshots or a period for which you want to keep the snapshots. All the older snapshots are deleted when the number of snapshots exceeds or when the retention period is over
Prerequisites
- A running Red Hat Ceph Storage cluster.
Procedure
From the dashboard navigation, go to File > File Systems.
File system volumes are listed. Select the file system where you want to create the snapshot schedule.
Go to Snapshot schedules tab.
NoteThe Enable is available only if the
snapshot_scheduleris disabled on the cluster. .. Optional: Click Enable to enable thesnapshot_schedulermodule. .. After enabling the scheduler, wait for the dashboard to reload and navigate back to the Snapshot schedule page. .. Click 'Create'.+ The Create Snapshot schedule form opens.
Enter the directory name, start date, start time, and schedule.
- Directory: You can search by typing in the path of the directory or subvolume and select the directory from the suggested list where you want to create the snapshot schedule.
- Start date: Enter date on which you want the scheduler to start creating the snapshots. By default the current date is selected.
- Start time: Enter the time at which you want the scheduler to start creating the snapshots. By default the current time is added.
- Schedule: Enter the number of snapshots and the frequency at which you want to create the snapshots. Frequency can be hourly, daily, weekly, monthly, yearly or lastest snapshots.
- Optional: Click Add retention policy if you want to add retention policy to the schedule. You can add multiple retention policies. Enter the number of snapshots and the frequency at which you want to retain the snapshots. Frequency can be hourly, daily, weekly, monthly, yearly or lastest snapshots.
Click Create snapshot schedule.
A notification is displayed that the snapshot schedule is created successfully.
12.5.2. Editing CephFS snapshot schedule
As a storage administrator, you can edit Ceph File System (CephFS) snapshot schedules on the IBM Storage Ceph dashboard. You can only edit the retention policy of the snapshot schedule. You can add another retention policy or delete the existing policy.
Prerequisites
- A running Red Hat Ceph Storage cluster.
Procedure
- From the dashboard navigation, go to File > File Systems.
- Select the CephFS where you want to edit snapshot schedules and click Snapshot schedules.
- Select the snapshot schedule that you want to edit.
- Click 'Edit'. An Edit Snapshot schedule dialog box appears.
Optional: From the Edit Snapshot schedule dialog, add a schedule retention policy, by selecting Add retention policy.
Enter the number of snapshots and the frequency at which you want to retain the snapshots. Frequency can be one of the following. .. Weekly or lastest snapshots. For example, enter the number of snapshots as 10 and select 'latest snapshots' to retain last 10 snapshots irrespective of the frequency at which they were created. .. Daily .. Hourly .. Monthly .. Yearly
Click 'Edit snapshot schedule' to save.
A notification is displayed that the retention policy is created successfully.
Click the trash icon to delete the existing retention policy.
A notification is displayed that the retention policy is deleted successfully.
12.5.3. Deleting CephFS snapshot schedule
As a storage administrator, you can delete Ceph File System (CephFS) snapshot schedules on the IBM Storage Ceph dashboard.
Prerequisites
- A running Red Hat Ceph Storage cluster.
- A snapshot schedule.
Procedure
- From the dashboard navigation, go to File > File Systems.
- Select the CephFS where you want to edit snapshot schedules.
- Click 'Snapshot schedules'.
- Select the snapshot schedule that you want to delete.
- Click 'Edit' from the dropdown menu.
Click 'Delete'.
A Delete Snapshot schedule dialog box appears.
- Select Yes, I am sure to confirm if you want to delete the schedule.
Click 'Delete' snapshot schedule.
A notification is displayed that the snapshot schedule is deleted successfully.
12.5.4. Deactivating and activating CephFS snapshot schedule
As a storage administrator, you can deactivate and activate Ceph File System (CephFS) snapshot schedules on the IBM Storage Ceph dashboard. The snapshot schedule is activated by default and runs according to how it is configured. Deactivating excludes the snapshot from scheduling until it is activated again.
Prerequisites
- A running Red Hat Ceph Storage cluster.
- A snapshot schedule.
Procedure
- From the dashboard navigation, go to File > File Systems.
- Select the CephFS where you want to edit snapshot schedules.
- Click 'Snapshot schedules'.
- Select the snapshot schedule that you want to deactivate and click 'Deactivate' from the action drop-down.
- Select Yes, I am sure to confirm if you want to deactivate the schedule.
Click 'Deactivate snapshot schedule'.
A notification is displayed that the snapshot schedule is deactivated successfully.
- You can activate the snapshot schedule by clicking 'Activate' in the action drop-down.
Chapter 13. Managing block devices using the Ceph dashboard
As a storage administrator, you can manage and monitor block device images on the Red Hat Ceph Storage dashboard. The functionality is divided between generic image functions and mirroring functions. For example, you can create new images, view the state of images mirrored across clusters, and set IOPS limits on an image.
13.1. Managing block device images on the Ceph dashboard
As a storage administrator, you can create, edit, copy, purge, and delete images using the Red Hat Ceph Storage dashboard.
You can also create, clone, copy, rollback, and delete snapshots of the images using the Ceph dashboard.
The Block Device images table is paginated for use with 10000+ image storage clusters to reduce Block Device information retrieval costs.
13.1.1. Creating images on the Ceph dashboard
You can create block device images on the Red Hat Ceph Storage dashboard.
Prerequisites
- A running Red Hat Ceph Storage cluster.
- Dashboard is installed.
- A pool with the rbd application enabled is created.
Procedure
- From the dashboard navigation, go to Block→Images.
- From the Images tab, click Create.
- In the Create RBD form, fill in the form.
- Optional: Click Advanced to set advanced parameters, such as Striping and Quality of Service.
Click Create RBD.
A notification displays that the image was created successfully.
Figure 13.1. Create Block device image

13.1.2. Creating namespaces on the Ceph dashboard
You can create namespaces for the block device images on the Red Hat Ceph Storage dashboard.
Once the namespaces are created, you can give access to the users for those namespaces.
Prerequisites
- A running Red Hat Ceph Storage cluster.
- Dashboard is installed.
- A pool with the rbd application enabled is created.
Procedure
- From the dashboard navigation, go to Block→Images.
- From the Namespaces tab, click Create.
- In the Create Namespace dialog, select the pool and enter a name for the namespace.
Click Create.
A notification displays that the namespace was created successfully.
Figure 13.2. Create namespace
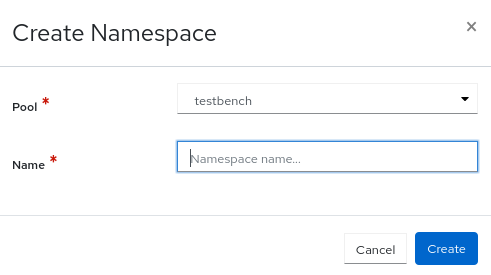
13.1.3. Editing images on the Ceph dashboard
You can edit block device images on the Red Hat Ceph Storage dashboard.
Prerequisites
- A running Red Hat Ceph Storage cluster.
- Dashboard is installed.
- A pool with the rbd application enabled is created.
- An image is created.
Procedure
- From the dashboard navigation, go to Block→Images.
- From the Images tab, select the image to edit, and click Edit.
In the Edit RBD form, edit the required parameters and click Edit RBD.
A notification displays that the image was updated successfully.
Figure 13.3. Edit Block device image
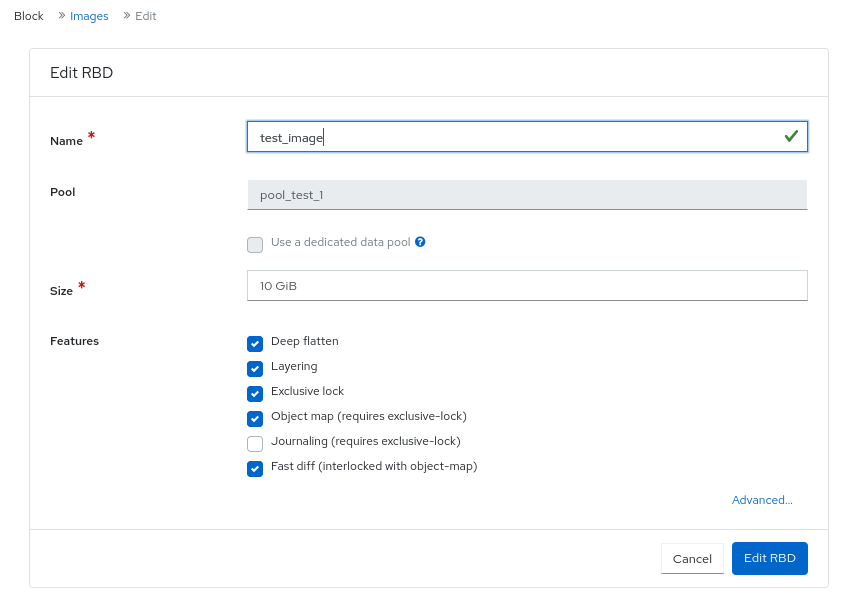
13.1.4. Copying images on the Ceph dashboard
You can copy block device images on the Red Hat Ceph Storage dashboard.
Prerequisites
- A running Red Hat Ceph Storage cluster.
- Dashboard is installed.
- A pool with the rbd application enabled is created.
- An image is created.
Procedure
- From the dashboard navigation, go to Block→Images.
- From the Images tab, select the image to copy, and click Copy from the action drop-down.
In the Copy RBD form, set the required parameters and click Copy RBD.
A notification displays that the image was copied successfully.
Figure 13.4. Copy Block device image
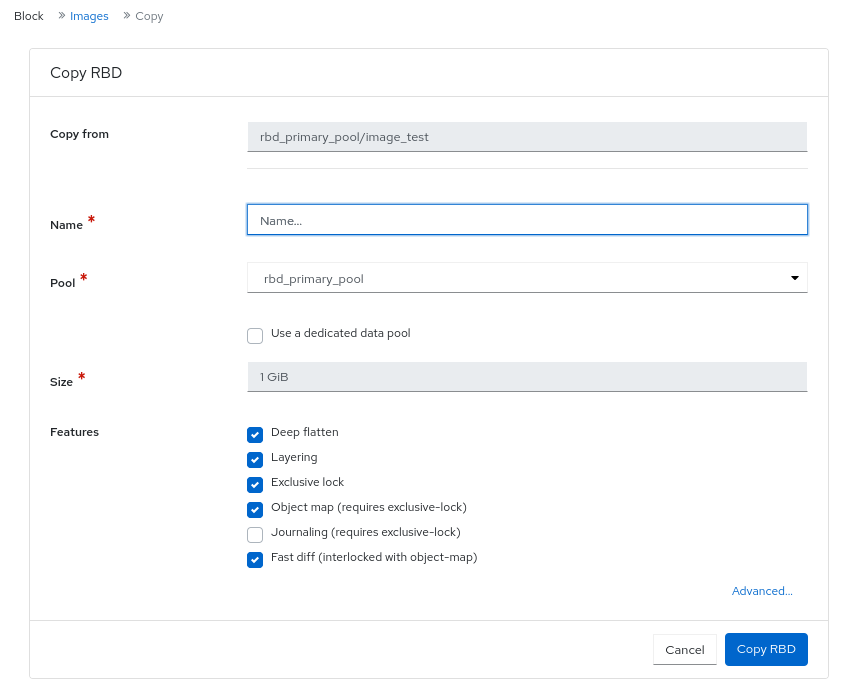
13.1.5. Moving images to trash on the Ceph dashboard
You can move the block device images to trash before it is deleted on the Red Hat Ceph Storage dashboard.
Prerequisites
- A running Red Hat Ceph Storage cluster.
- Dashboard is installed.
- A pool with the rbd application enabled is created.
- An image is created.
Procedure
- From the dashboard navigation, go to Block→Images.
- From the Images tab, select the image to move to trash, and click Move to Trash from the action drop-down.
In the Move an image to trash dialog, change the Protection expires at field and click Move.
A notification displays that the image was moved to trash successfully.
Figure 13.5. Moving images to trash
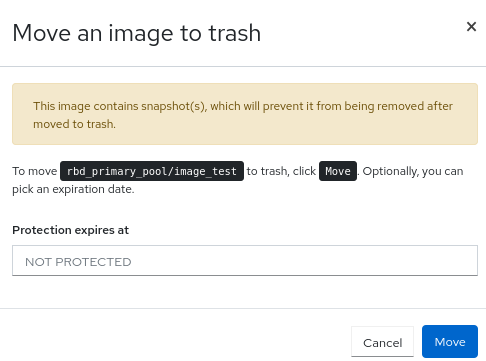
13.1.6. Purging trash on the Ceph dashboard
You can purge trash using the Red Hat Ceph Storage dashboard.
Prerequisites
- A running Red Hat Ceph Storage cluster.
- Dashboard is installed.
- A pool with the rbd application enabled is created.
- An image is trashed.
Procedure
- From the dashboard navigation, go to Block→Images.
- From the Trash tab, click Purge Trash.
In the Purge Trash dialog, select the pool, and click Purge Trash.
A notification displays that the pools in the trash were purged successfully.
Figure 13.6. Purge trash
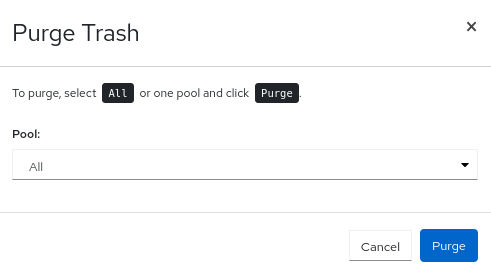
13.1.7. Restoring images from trash on the Ceph dashboard
You can restore the images that were trashed and has an expiry date on the Red Hat Ceph Storage Dashboard.
Prerequisites
- A running Red Hat Ceph Storage cluster.
- Dashboard is installed.
- A pool with the rbd application enabled is created.
- An image is trashed.
Procedure
- From the dashboard navigation, go to Block→Images.
- From the Trash tab, select the row of the image to restore.
- Click Restore in the action drop-down.
In the Restore Image dialog, enter the new name of the image and click Restore.
A notification displays that the image was restored successfully.
Figure 13.7. Restore images from trash

13.1.8. Deleting images on the Ceph Dashboard
You can delete the images from the cluster on the Ceph Dashboard.
Prerequisites
- A running Red Hat Ceph Storage cluster.
- Dashboard is installed.
- A pool with the rbd application enabled is created.
- An image is created.
Procedure
- From the dashboard navigation, go to Block→Images.
- Select the row to be deleted and click Delete from the action drop-down.
In the Delete RBD notification, select Yes, I am sure and click Delete RBD.
A notification displays that the image was deleted successfully.
Figure 13.8. Deleting images
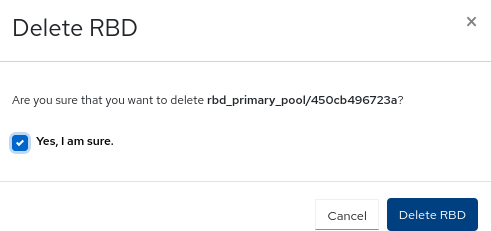
13.1.9. Deleting namespaces on the Ceph dashboard.
You can delete the namespaces of the images on the Red Hat Ceph Storage Dashboard.
Prerequisites
- A running Red Hat Ceph Storage cluster.
- Dashboard is installed.
- A pool with the rbd application enabled is created.
- A namespace is created in the pool.
Procedure
- From the dashboard navigation, go to Block→Images.
- From the Namespaces tab, select the namespace and click Delete from the action drop-down.
In the Delete Namespace notification, select Yes, I am sure and click Delete Namespace.
A notification displays that the namespace was deleted successfully.
Figure 13.9. Deleting namespaces
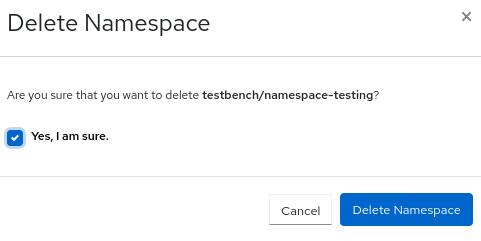
13.1.10. Creating snapshots of images on the Ceph dashboard
You can take snapshots of the Ceph block device images on the Red Hat Ceph Storage Dashboard.
Prerequisites
- A running Red Hat Ceph Storage cluster.
- Dashboard is installed.
- A pool with the rbd application enabled is created.
- An image is created.
Procedure
- From the dashboard navigation, go to Block→Images.
- From the Images tab, expand an image row.
- In the Snapshots tab, click Create.
In the Create RBD Snapshot dialog, enter the snapshot name and click Create RBD Snapshot.
A notification displays that the snapshot was created successfully.
Figure 13.10. Creating snapshot of images
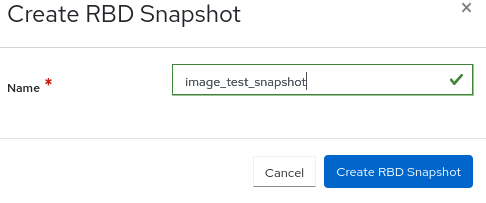
13.1.11. Renaming snapshots of images on the Ceph dashboard
You can rename the snapshots of the Ceph block device images on the Red Hat Ceph Storage Dashboard.
Prerequisites
- A running Red Hat Ceph Storage cluster.
- Dashboard is installed.
- A pool with the rbd application enabled is created.
- An image is created.
- A snapshot of the image is created.
Procedure
- From the dashboard navigation, go to Block→Images.
- From the Images tab, expand an image row.
- In the Snapshots tab, click Rename.
- In the Rename RBD Snapshot dialog, enter the new name and click Rename RBD Snapshot.
13.1.12. Protecting snapshots of images on the Ceph dashboard
You can protect the snapshots of the Ceph block device images on the Red Hat Ceph Storage Dashboard.
This is required when you need to clone the snapshots.
Prerequisites
- A running Red Hat Ceph Storage cluster.
- Dashboard is installed.
- A pool with the rbd application enabled is created.
- An image is created.
- A snapshot of the image is created.
Procedure
- From the dashboard navigation, go to Block→Images.
- From the Images tab, expand an image row and click on the Snapshots tab.
Select the snapshot to protect, and click Protect from the action drop-down.
The snapshot updates and the State changes from Unprotected to Protected.
13.1.13. Cloning snapshots of images on the Ceph dashboard
You can clone the snapshots of images on the Red Hat Ceph Storage Dashboard.
Prerequisites
- A running Red Hat Ceph Storage cluster.
- Dashboard is installed.
- A pool with the rbd application enabled is created.
- An image is created.
- A snapshot of the image is created and protected.
Procedure
- From the dashboard navigation, go to Block→Images.
- From the Images tab, expand an image row.
- In the Snapshots tab, select the snapshot to clone and click Clone from the action drop-down.
In the Clone RBD form, fill in the required details and click Clone RBD.
A notification displays that the snapshots was cloned successfully and the new image displays in the Images table.
13.1.14. Copying snapshots of images on the Ceph dashboard
You can copy the snapshots of images on the Red Hat Ceph Storage Dashboard.
Prerequisites
- A running Red Hat Ceph Storage cluster.
- Dashboard is installed.
- A pool with the rbd application enabled is created.
- An image is created.
- A snapshot of the image is created.
Procedure
- From the dashboard navigation, go to Block→Images.
- From the Images tab, expand an image row.
- In the Snapshots tab, select the snapshot to clone and click Copy from the action drop-down.
In the Copy RBD form, fill in the required details and click Copy RBD.
A notification displays that the snapshots was cloned successfully and the new image displays in the Images table.
13.1.15. Unprotecting snapshots of images on the Ceph dashboard
You can unprotect the snapshots of the Ceph block device images on the Red Hat Ceph Storage Dashboard.
This is required when you need to delete the snapshots.
Prerequisites
- A running Red Hat Ceph Storage cluster.
- Dashboard is installed.
- A pool with the rbd application enabled is created.
- An image is created.
- A snapshot of the image is created and protected.
Procedure
- From the dashboard navigation, go to Block→Images.
- From the Images tab, expand an image row and click on the Snapshots tab.
Select the protected snapshot, and click Unprotect from the action drop-down.
The snapshot updates and the State changes from Protected to Unprotected*.
13.1.16. Rolling back snapshots of images on the Ceph dashboard
You can rollback the snapshots of the Ceph block device images on the Red Hat Ceph Storage Dashboard. Rolling back an image to a snapshot means overwriting the current version of the image with data from a snapshot. The time it takes to execute a rollback increases with the size of the image. It is faster to clone from a snapshot than to rollback an image to a snapshot, and it is the preferred method of returning to a pre-existing state.
Prerequisites
- A running Red Hat Ceph Storage cluster.
- Dashboard is installed.
- A pool with the rbd application enabled is created.
- An image is created.
- A snapshot of the image is created.
Procedure
- From the dashboard navigation, go to Block→Images.
- From the Images tab, expand an image row and click on the Snapshots tab.
- Select the snapshot to rollback, and click Rollback from the action drop-down.
In the RBD snapshot rollback dialog, click Rollback.
Figure 13.11. Rolling back snapshot of images
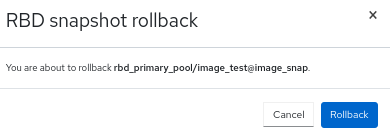
13.1.17. Deleting snapshots of images on the Ceph dashboard
You can delete the snapshots of the Ceph block device images on the Red Hat Ceph Storage Dashboard.
Prerequisites
- A running Red Hat Ceph Storage cluster.
- Dashboard is installed.
- A pool with the rbd application enabled is created.
- An image is created.
- A snapshot of the image is created and is unprotected.
Procedure
- From the dashboard navigation, go to Block→Images.
- From the Images tab, expand an image row.
- In the Snapshots tab, select the snapshot to delete and click Delete from the action drop-down.
In the Delete RBD Snapshot dialog, select Yes, I am sure and click Delete RBD Snapshot.
A notification displays that the snapshot was created successfully.
13.2. Managing mirroring functions on the Ceph dashboard
As a storage administrator, you can manage and monitor mirroring functions of the Block devices on the Red Hat Ceph Storage Dashboard.
You can add another layer of redundancy to Ceph block devices by mirroring data images between storage clusters. Understanding and using Ceph block device mirroring can provide you protection against data loss, such as a site failure. There are two configurations for mirroring Ceph block devices, one-way mirroring or two-way mirroring, and you can configure mirroring on pools and individual images.
13.2.1. Mirroring view on the Ceph dashboard
You can view the Block device mirroring on the Red Hat Ceph Storage Dashboard.
You can view the daemons, the site details, the pools, and the images that are configured for block device mirroring.
Prerequisites
- A running Red Hat Ceph Storage cluster.
- Dashboard is installed.
- Mirroring is configured.
Procedure
From the dashboard navigation, go to Block→Mirroring.
Figure 13.12. View mirroring of Ceph Block Devices
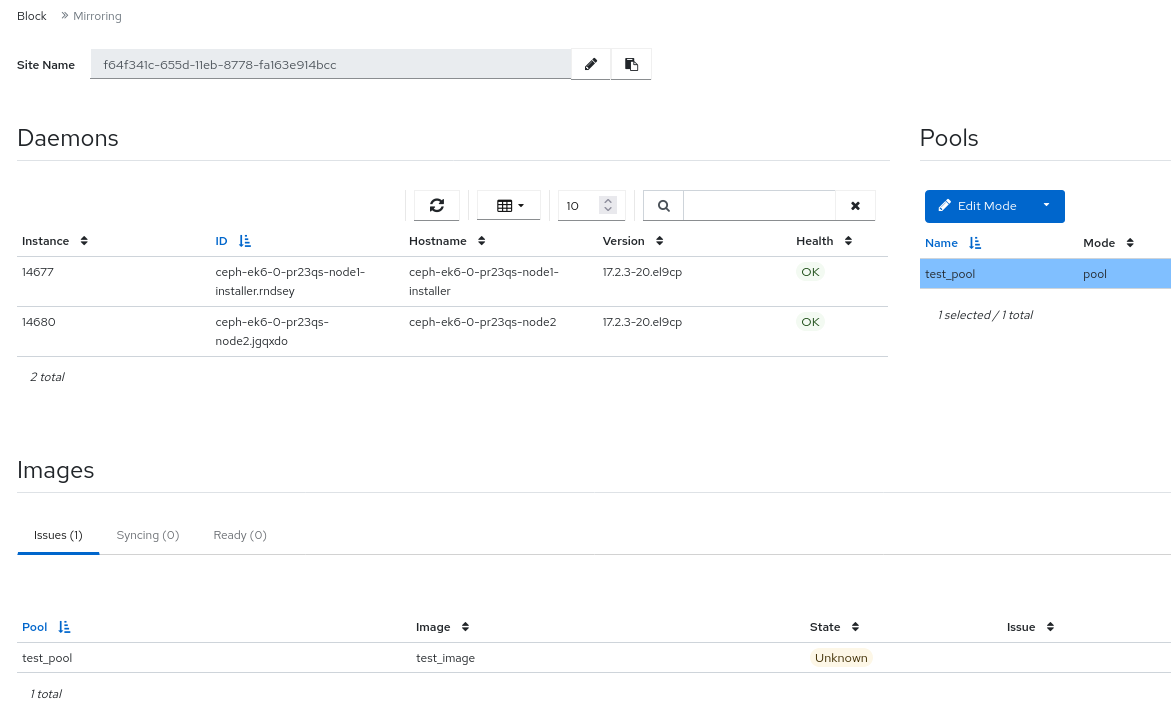
13.2.2. Editing mode of pools on the Ceph dashboard
You can edit mode of the overall state of mirroring functions, which includes pools and images on the Red Hat Ceph Storage Dashboard.
Prerequisites
- A running Red Hat Ceph Storage cluster.
- Dashboard is installed.
- A pool with the rbd application enabled is created.
- An image is created.
- Mirroring is configured.
Procedure
From the dashboard navigation, go to Block→Mirroring.
- In the Pools table, select the pool to edit and click Edit Mode.
In the Edit Mode dialog, select the mode and click Update.
A notification displays that the mode was updated successfully and the Mode updates in the Pools table.
13.2.3. Adding peer in mirroring on the Ceph dashboard
You can add storage cluster peer for the rbd-daemon mirror to discover its peer storage cluster on the Red Hat Ceph Storage Dashboard.
Prerequisites
- Two healthy running Red Hat Ceph Storage clusters.
- Dashboard is installed on both the clusters.
- Pools created with the same name.
-
rbdapplication enabled on both the clusters.
Ensure that mirroring is enabled for the pool in which images are created.
Procedure
Site A
- From the dashboard navigation, go to Block → Mirroring and click Create Bootstrap Token.
- From the Navigation menu, click the Block drop-down menu, and click Mirroring.
Click Create Bootstrap Token and configure the following in the window:
Figure 13.13. Create bootstrap token
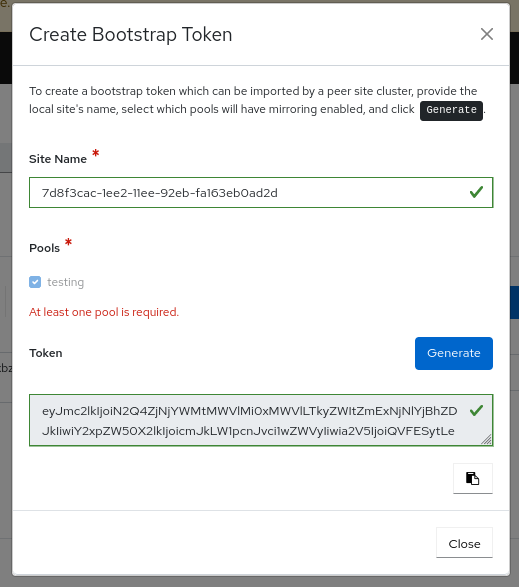
- For the provided site name, select the pools to be mirrored.
- For the selected pools, generate a new bootstrap token by clicking Generate.
- Click Copy to Clipboard.
- Click Close.
Enable the pool mirror mode.
- Select the pool.
- Click Edit Mode.
- In the Edit pool mirror mode dialog, select Image from the Mode list.
Click Update.
A notification displays that the pool was updated successfully.
Site B
From the dashboard navigation, go to Block → Mirroring and click Import Bootstrap Token from the action drop-down.
NoteEnsure that mirroring mode is enabled for the specific pool for which you are importing the bootstrap token.
In the Import Bootstrap Token dialog, select the direction, and paste the token copied earlier, from site A.
Figure 13.14. Import bootstrap token
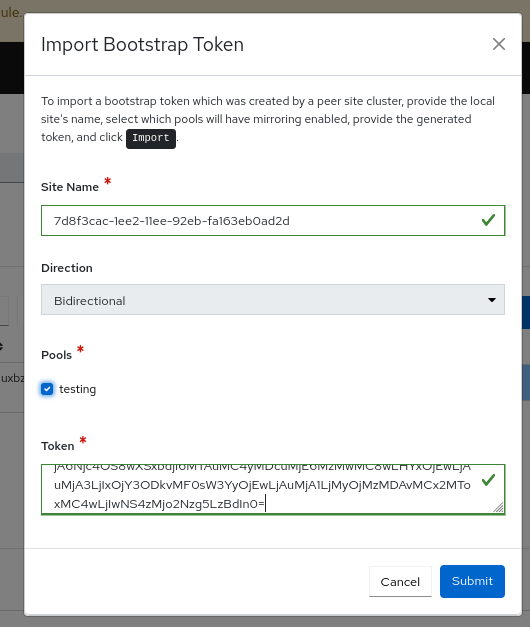
Click Submit.
The peer is added and the images are mirrored in the cluster at site B.
- On the Block → Mirroring page, in the Pool table, verify the health of the pool is in the OK state.
Site A
Create an image with Mirroring enabled.
- From the dashboard navigation, go to Block → Images.
- On the Images tab, click Create.
- In the Create RBD form, fill in the Name and Size.
Select Mirroring.
NoteSelect mirroring with either Journal or Snapshot.
Click Create RBD.
Figure 13.15. Create mirroring image
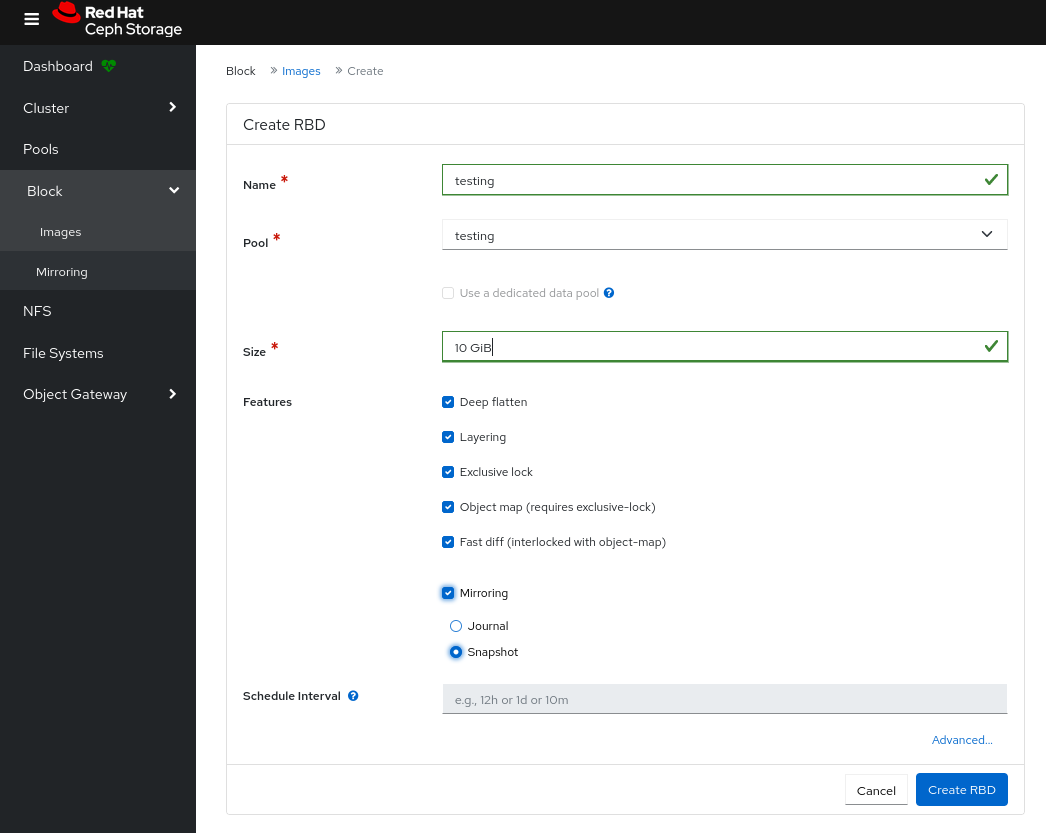
Verify the image is available at both the sites.
- From the Images table, verify that the image in site A is set to primary and that the image in site B is set to secondary.
13.2.4. Editing peer in mirroring on the Ceph dashboard
You can edit storage cluster peer for the rbd-daemon mirror to discover its peer storage cluster in the Red Hat Ceph Storage Dashboard.
Prerequisites
- A running Red Hat Ceph Storage cluster.
- Dashboard is installed.
- A pool with the rbd application enabled is created.
- An image is created.
- Mirroring is configured.
- A peer is added.
Procedure
From the dashboard navigation, go to Block→Mirroring.
From the Pools table, select the pool to edit and click Edit Peer from the action drop-down.
In the Edit pool mirror peer dialog, edit the parameters, and click Submit.
A notification displays that the peer was updated successfully.
Figure 13.16. Editing peer in mirroring
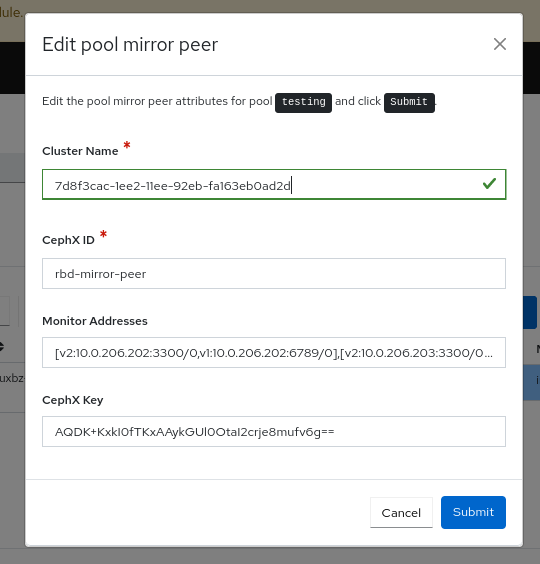
13.2.5. Deleting peer in mirroring on the Ceph dashboard
You can edit storage cluster peer for the`rbd-daemon` mirror to discover its peer storage cluster in the Red Hat Ceph Storage Dashboard.
Prerequisites
- A running Red Hat Ceph Storage cluster.
- Dashboard is installed.
- A pool with the rbd application enabled is created.
- An image is created.
- Mirroring is configured.
- A peer is added.
Procedure
- From the dashboard navigation, go to Block→Mirroring.
- From the Pools table, select the pool to edit and click Delete Peer from the action drop-down.
In the Delete mirror peer dialog, select Yes, I am sure and click Delete mirror peer.
A notification displays that the peer deleted successfully.
Figure 13.17. Delete peer in mirroring

Chapter 14. Activating and deactivating telemetry
Activate the telemetry module to help Ceph developers understand how Ceph is used and what problems users might be experiencing. This helps improve the dashboard experience. Activating the telemetry module sends anonymous data about the cluster back to the Ceph developers.
View the telemetry data that is sent to the Ceph developers on the public telemetry dashboard. This allows the community to easily see summary statistics on how many clusters are reporting, their total capacity and OSD count, and version distribution trends.
The telemetry report is broken down into several channels, each with a different type of information. Assuming telemetry has been enabled, you can turn on and off the individual channels. If telemetry is off, the per-channel setting has no effect.
- Basic
- Provides basic information about the cluster.
- Crash
- Provides information about daemon crashes.
- Device
- Provides information about device metrics.
- Ident
- Provides user-provided identifying information about the cluster.
- Perf
- Provides various performance metrics of the cluster.
The data reports contain information that help the developers gain a better understanding of the way Ceph is used. The data includes counters and statistics on how the cluster has been deployed, the version of Ceph, the distribution of the hosts, and other parameters.
The data reports do not contain any sensitive data like pool names, object names, object contents, hostnames, or device serial numbers.
Telemetry can also be managed by using an API. For more information, see the Telemetry chapter in the Red Hat Ceph Storage Developer Guide.
Procedure
Activate the telemetry module in one of the following ways:
From the banner within the Ceph dashboard.

- Go to Settings→Telemetry configuration.
Select each channel that telemetry should be enabled on.
NoteFor detailed information about each channel type, click More Info next to the channels.
- Complete the Contact Information for the cluster. Enter the contact, Ceph cluster description, and organization.
Optional: Complete the Advanced Settings field options.
- Interval
- Set the interval by hour. The module compiles and sends a new report per this hour interval. The default interval is 24 hours.
- Proxy
Use this to configure an HTTP or HTTPs proxy server if the cluster cannot directly connect to the configured telemetry endpoint. Add the server in one of the following formats:
https://10.0.0.1:8080orhttps://ceph:telemetry@10.0.01:8080The default endpoint is
telemetry.ceph.com.
- Click Next. This displays the Telemetry report preview before enabling telemetry.
Review the Report preview.
NoteThe report can be downloaded and saved locally or copied to the clipboard.
- Select I agree to my telemetry data being submitted under the Community Data License Agreement.
Enable the telemetry module by clicking Update.
The following message is displayed, confirming the telemetry activation:
The Telemetry module has been configured and activated successfully
14.1. Deactivating telemetry
To deactivate the telemetry module, go to Settings→Telemetry configuration and click Deactivate.