Administration Guide
Administering Red Hat CodeReady Workspaces 2.0
Abstract
Chapter 1. Customizing the devfile and plug-in registries
CodeReady Workspaces 2.0 introduces two registries: the plug-in registry and the devfile registry. They are static websites where the metadata of CodeReady Workspaces plug-ins and CodeReady Workspaces devfiles is published.
The plug-in registry makes it possible to share a plug-in definition across all the users of the same instance of CodeReady Workspaces. Only plug-ins that are published in a registry can be used in a devfile.
The devfile registry holds the definitions of the CodeReady Workspaces stacks. These are available on the CodeReady Workspaces user dashboard when selecting Create Workspace. It contains the list of CodeReady Workspaces technological stack samples with example projects.
The devfile and plug-in registries run in two separate pods and are deployed when the CodeReady Workspaces server is deployed (that is the default behavior of the Helm chart or the CodeReady Workspaces Operator). The metadata of the plug-ins and devfiles are versioned on GitHub and follow the CodeReady Workspaces server life cycle.
In this document, the following two ways to customize the default registries that are deployed with CodeReady Workspaces (to modify the plug-ins or devfile metadata) are described:
- Building a custom image of the registries
- Running the default images but modifying them at runtime
1.1. Building and running a custom registry image
This section describes the building of registries and updating a running CodeReady Workspaces server to point to the registries.
1.1.1. Building a custom devfile registry
This section describes how to build a custom devfiles registry. Following operations are covered:
- Getting a copy of the source code necessary to build a devfiles registry.
- Adding a new devfile.
- Building the devfiles registry.
Procedure
Clone the devfile registry repository:
git clone git@github.com:redhat-developer/codeready-workspaces.git
cd codeready-workspaces/dependencies/che-devfile-registry
$ git clone git@github.com:redhat-developer/codeready-workspaces.git
$ cd codeready-workspaces/dependencies/che-devfile-registry
Copy to Clipboard Copied! Toggle word wrap Toggle overflow In the
./che-devfile-registry/devfiles/directory, create a subdirectory<devfile-name>/and add thedevfile.yamlandmeta.yamlfiles.File organization for a devfile
./che-devfile-registry/devfiles/
└── <devfile-name>
    ├── devfile.yaml
    └── meta.yaml
./che-devfile-registry/devfiles/ └── <devfile-name> ├── devfile.yaml └── meta.yamlCopy to Clipboard Copied! Toggle word wrap Toggle overflow -
Add valid content in the
devfile.yamlfile. For a detailed description of the devfile format, see the Making a workspace portable using a Devfile section. Ensure that the
meta.yamlfile conforms to the following structure:Expand Table 1.1. Parameters for a devfile meta.yaml Attribute Description descriptionDescription as it appears on the user dashboard.
displayNameName as it appears on the user dashboard.
globalMemoryLimitThe sum of the expected memory consumed by all the components launched by the devfile. This number will be visible on the user dashboard. It is informative and is not taken into account by the CodeReady Workspaces server.
iconLink to an
.svgfile that is displayed on the user dashboard.tagsList of tags. Tags usually include the tools included in the stack.
Example devfile
meta.yamldisplayName: Rust description: Rust Stack with Rust 1.39 tags: ["Rust"] icon: https://www.eclipse.org/che/images/logo-eclipseche.svg globalMemoryLimit: 1686Mi
displayName: Rust description: Rust Stack with Rust 1.39 tags: ["Rust"] icon: https://www.eclipse.org/che/images/logo-eclipseche.svg globalMemoryLimit: 1686MiCopy to Clipboard Copied! Toggle word wrap Toggle overflow Build the containers for the custom devfile registry:
docker build -t my-devfile-registry .
$ docker build -t my-devfile-registry .Copy to Clipboard Copied! Toggle word wrap Toggle overflow
1.1.2. Building a custom plug-in registry
This section describes how to build a custom plug-in registry. Following operations are covered:
- Getting a copy of the source code necessary to build a custom plug-in registry.
- Adding a new plug-in.
- Building the custom plug-in registry.
Procedure
Clone the plug-in registry repository:
git clone git@github.com:redhat-developer/codeready-workspaces.git
cd codeready-workspaces/dependencies/che-plugin-registry
$ git clone git@github.com:redhat-developer/codeready-workspaces.git
$ cd codeready-workspaces/dependencies/che-plugin-registry
Copy to Clipboard Copied! Toggle word wrap Toggle overflow In the
./che-plugin-registry/v3/plugins/directory, create new directories<publisher>/<plugin-name>/<plugin-version>/and ameta.yamlfile in the last directory.File organization for a plugin
Copy to Clipboard Copied! Toggle word wrap Toggle overflow -
Add valid content to the
meta.yamlfile. See the “Using a Visual Studio Code extension in CodeReady Workspaces” section or the README.md file in theeclipse/che-plugin-registryrepository for a detailed description of themeta.yamlfile format. Create a file named
latest.txtwith content the name of the latest<plugin-version>directory.ExampleCopy to Clipboard Copied! Toggle word wrap Toggle overflow Build the containers for the custom plug-in registry:
docker build -t my-devfile-registry .
$ docker build -t my-devfile-registry .Copy to Clipboard Copied! Toggle word wrap Toggle overflow
1.1.3. Deploying the registries
Prerequisites
The my-plug-in-registry and my-devfile-registry images used in this section are built using the docker command. This section assumes that these images are available on the OpenShift cluster where CodeReady Workspaces is deployed.
This is true on Minikube, for example, if before running the docker build commands, the user executed the eval $\{minikube docker-env} command (or, the eval $\{minishift docker-env} command for Minishift).
Otherwise, these images can be pushed to a container registry (public, such as quay.io, or the DockerHub, or a private registry).
1.1.3.1. Deploying registries in OpenShift
Procedure
A Helm chart for the plug-in registry is available in the /kubernetes/che-plugin-registry/ directory of the GitHub repository.
To deploy the plug-in registry using the Helm chart, run the following command:
Copy to Clipboard Copied! Toggle word wrap Toggle overflow The devfile registry also has a Helm chart in the
deploy/kubernetes/che-devfile-registry/directory of the GitHub repository. To deploy it, run the command:Copy to Clipboard Copied! Toggle word wrap Toggle overflow The Helm chart creates a pod, a service, and an Ingress. To get them, use
app=che-plugin-registry(orapp=che-plugin-registryfor the devfile registry).Copy to Clipboard Copied! Toggle word wrap Toggle overflow To verify that the new plug-in is correctly published to the plug-in registry, make a request to the registry path
/v3/plugins/index.json(or/devfiles/index.jsonfor the devfile registry).Copy to Clipboard Copied! Toggle word wrap Toggle overflow Verify that the CodeReady Workspaces server points to the URL of the registry. To do this, compare the value of the
CHE_WORKSPACE_PLUGIN__REGISTRY__URLparameter in theworkspacesConfigMap (orCHE_WORKSPACE_DEVFILE__REGISTRY__URLfor the devfile registry):oc get \ -o "custom-columns=URL:.data['CHE_WORKSPACE_PLUGIN__REGISTRY__URL']" \ --no-headers cm/che URL http://che-plugin-registry-che.192.168.99.100.mycluster.mycompany.com/v3
$ oc get \
  -o "custom-columns=URL:.data['CHE_WORKSPACE_PLUGIN__REGISTRY__URL']" \
  --no-headers cm/che
URL
http://che-plugin-registry-che.192.168.99.100.mycluster.mycompany.com/v3
Copy to Clipboard Copied! Toggle word wrap Toggle overflow with the URL of the Ingress:
oc get -o 'custom-columns=URL:.spec.rules[0].host' \
  -l app=che-plugin-registry ingress --no-headers
che-plugin-registry-che.192.168.99.100.mycluster.mycompany.com
$ oc get -o 'custom-columns=URL:.spec.rules[0].host' \
  -l app=che-plugin-registry ingress --no-headers
che-plugin-registry-che.192.168.99.100.mycluster.mycompany.com
Copy to Clipboard Copied! Toggle word wrap Toggle overflow If they do not match, update the ConfigMap and restart the CodeReady Workspaces server.
oc edit cm/che
(...)
oc scale --replicas=0 deployment/che
oc scale --replicas=1 deployment/che
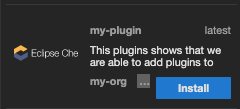
$ oc edit cm/che
(...)
$ oc scale --replicas=0 deployment/che
$ oc scale --replicas=1 deployment/che
Copy to Clipboard Copied! Toggle word wrap Toggle overflow When the new registries are deployed and the CodeReady Workspaces server is configured to use them, the new plug-ins are available in the Plugin view of a workspace.
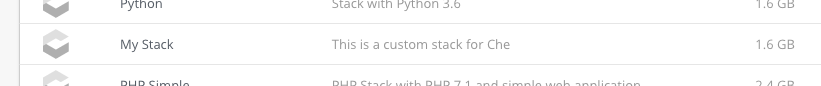
The new stacks are displayed in the New Workspace tab of the user dashboard.
1.1.3.2. Deploying registries in OpenShift
Procedure
An OpenShift template to deploy the plug-in registry is available in the openshift/ directory of the GitHub repository.
To deploy the plug-in registry using the OpenShift template, run the following command:
Copy to Clipboard Copied! Toggle word wrap Toggle overflow - 1
- The default CodeReady Workspaces namespace is
workspaces.
The devfile registry has an OpenShift template in the
deploy/openshift/directory of the GitHub repository. To deploy it, run the command:Copy to Clipboard Copied! Toggle word wrap Toggle overflow - 1
- The default CodeReady Workspaces namespace is
workspaces.
- Check if the registries are deployed successfully on OpenShift. The steps to check are similar to the OpenShift steps. For details, see the Section 1.1.3.1, “Deploying registries in OpenShift” section. The only difference is that, on OpenShift, Ingresses are replaced with routes.
1.2. Including the plug-in binaries in the registry image
The plug-in registry only hosts CodeReady Workspaces plug-in metadata. The binaries are usually referred through a link in the meta.yaml file. In some cases, such as offline environments, it may be necessary to make the binaries available inside the registry image.
This section describes how to modify a plug-in meta.yaml file to point to a local file inside the container and rebuild a new registry that contains the modified plug-in meta.yaml file and the binary. In the following example, the Java plug-in that refers to two remote VS Code extensions binaries is considered.
Procedure
Download the binaries locally.
Copy to Clipboard Copied! Toggle word wrap Toggle overflow
Retrieve the plug-in-registry URL.
FIXME
FIXMECopy to Clipboard Copied! Toggle word wrap Toggle overflow Update the URLs in the
meta.yamlfile, so that they point to the VS Code extension binaries that are saved in the registry container:Copy to Clipboard Copied! Toggle word wrap Toggle overflow - Build and deploy the plug-in registry using the instructions in the Building and running a custom registry image section.
1.3. Editing a devfile and plug-in at runtime
An alternative to building a custom registry image is to:
- Start a registry
- Modify its content at runtime
This approach is simpler and faster. But the modifications are lost as soon as the container is deleted.
1.3.1. Adding a plug-in at runtime
Procedure
To add a plug-in:
Get the name of the OpenShift pod that hosts the plug-in registry container. To do this, filter the
app=che-plugin-registrylabel:PLUGIN_REG_POD=$(oc get -o custom-columns=NAME:.metadata.name \ --no-headers -l app=che-plugin-registry pod)
$ PLUGIN_REG_POD=$(oc get -o custom-columns=NAME:.metadata.name \
 --no-headers -l app=che-plugin-registry pod)
Copy to Clipboard Copied! Toggle word wrap Toggle overflow Create the new plug-in directory in the plug-in registry container, if it does not exist:
ORG="my-org"
PLUGIN="my-plug-in"
VERSION="1.0.1"
oc exec ${PLUGIN_REG_POD} -i -t -- \
  mkdir -p /var/www/html/v3/plugins/${ORG}/${PLUGIN}/${VERSION}
$ ORG="my-org" $ PLUGIN="my-plug-in" $ VERSION="1.0.1" $ oc exec ${PLUGIN_REG_POD} -i -t -- \ mkdir -p /var/www/html/v3/plugins/${ORG}/${PLUGIN}/${VERSION}Copy to Clipboard Copied! Toggle word wrap Toggle overflow Copy the
meta.yamlfile in the container:LOCAL_META="${PWD}/meta.yaml" $ oc cp "${LOCAL_META}" \ ${PLUGIN_REG_POD}:/var/www/html/v3/plugins/${ORG}/${PLUGIN}/${VERSION}LOCAL_META="${PWD}/meta.yaml" $ oc cp "${LOCAL_META}" \ ${PLUGIN_REG_POD}:/var/www/html/v3/plugins/${ORG}/${PLUGIN}/${VERSION}Copy to Clipboard Copied! Toggle word wrap Toggle overflow Update the
index.jsonfile of the registry:oc exec ${PLUGIN_REG_POD} -i -t -- \ /var/www/html/index_v2.sh v3 > /var/www/html/v3/plugins/index.json$ oc exec ${PLUGIN_REG_POD} -i -t -- \ /var/www/html/index_v2.sh v3 > /var/www/html/v3/plugins/index.jsonCopy to Clipboard Copied! Toggle word wrap Toggle overflow - The new plug-in can now be used from a CodeReady Workspaces instance.
1.3.2. Adding a devfile at runtime
Procedure
To add a devfile:
Get the name of the OpenShift pod that hosts the devfile registry container. To do this, filter the
app=che-devfile-registrylabel:DEVFILE_REG_POD=$(oc get -o custom-columns=NAME:.metadata.name \ --no-headers -l app=che-devfile-registry pod)
$ DEVFILE_REG_POD=$(oc get -o custom-columns=NAME:.metadata.name \
  --no-headers -l app=che-devfile-registry pod)
Copy to Clipboard Copied! Toggle word wrap Toggle overflow Create the new devfile directory in the devfile registry container, if it does not exist.
STACK="my-stack"
oc exec $\{DEVFILE_REG_POD} -i -t -- \
  mkdir -p /var/www/html/devfiles/$\{STACK}
$ STACK="my-stack" $ oc exec $\{DEVFILE_REG_POD} -i -t -- \ mkdir -p /var/www/html/devfiles/$\{STACK}Copy to Clipboard Copied! Toggle word wrap Toggle overflow Copy the
devfile.yamlfile and themeta.yamlfile to the container.Copy to Clipboard Copied! Toggle word wrap Toggle overflow Update the
index.jsonfile of the registry.oc exec $\{DEVFILE_REG_POD} -i -t -- \ /var/www/html/index.sh > /var/www/html/devfiles/index.json$ oc exec $\{DEVFILE_REG_POD} -i -t -- \ /var/www/html/index.sh > /var/www/html/devfiles/index.jsonCopy to Clipboard Copied! Toggle word wrap Toggle overflow
Chapter 2. Retrieving CodeReady Workspaces logs
This is a catalog of the location and instructions to retrieve application logs (for administrators and for users).
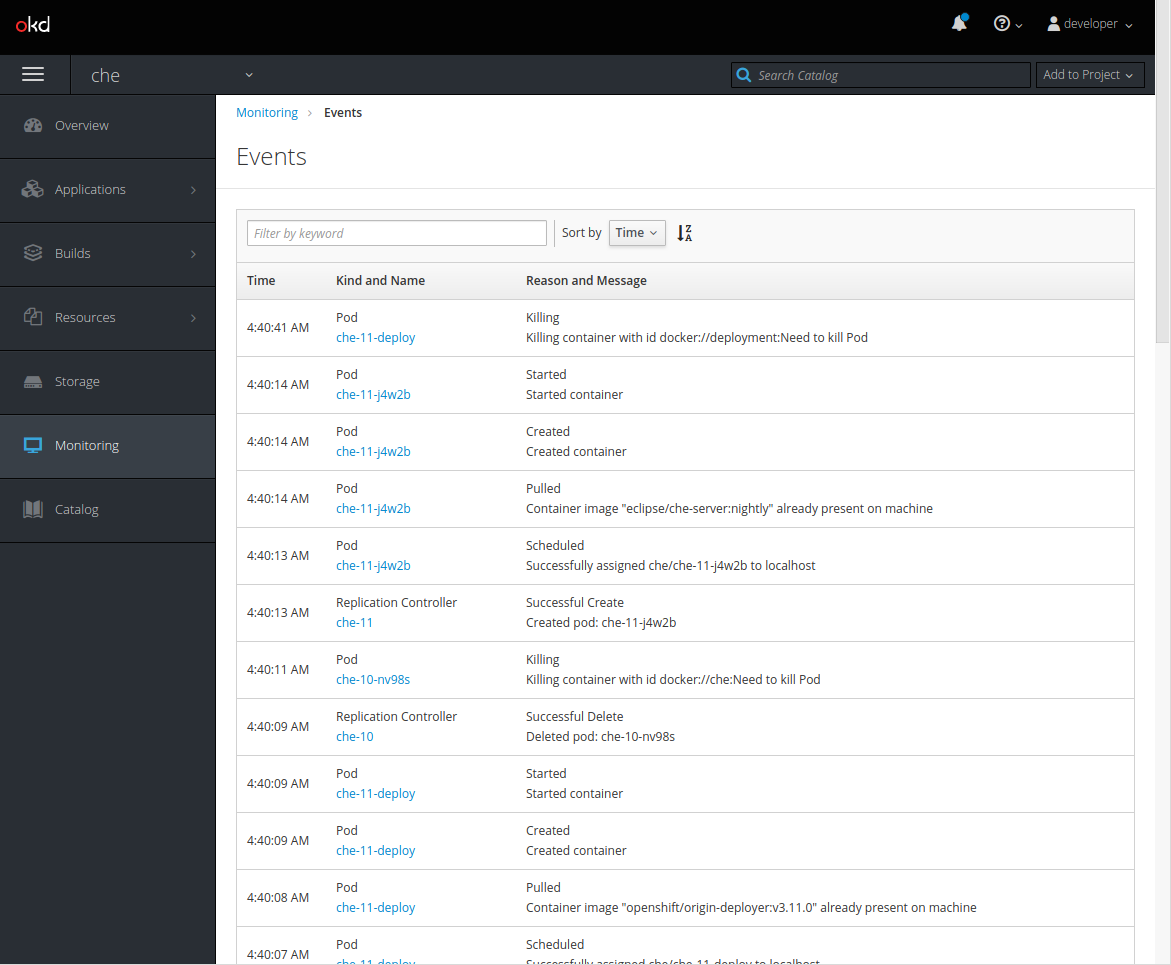
2.1. Viewing OpenShift events
This section describes how to view the Kubenertes events.
Prerequisites
- A running OpenShift Web Console.
Procedure
- In the OpenShift Web Console, click the Monitoring tab in the left panel.
- To view the list of all events, click the View Details button in the top-right corner.
The details of the events will be displayed.
Additional resources
- For a list of OpenShift events, see Comprehensive List of Events in OpenShift documentation.
2.2. Viewing CodeReady Workspaces server logs
This section describes how to view the CodeReady Workspaces server logs on the console and on the command line.
2.2.1. Viewing the CodeReady Workspaces server logs in the web console
This section describes how to view the CodeReady Workspaces server logs in the OpenShift web console.
Procedure
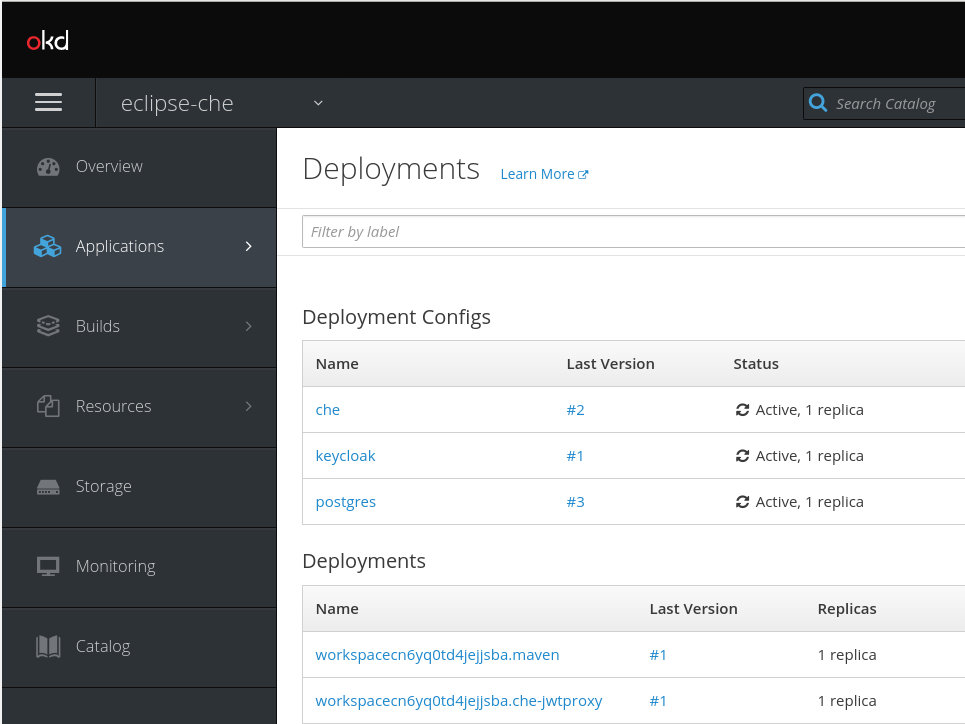
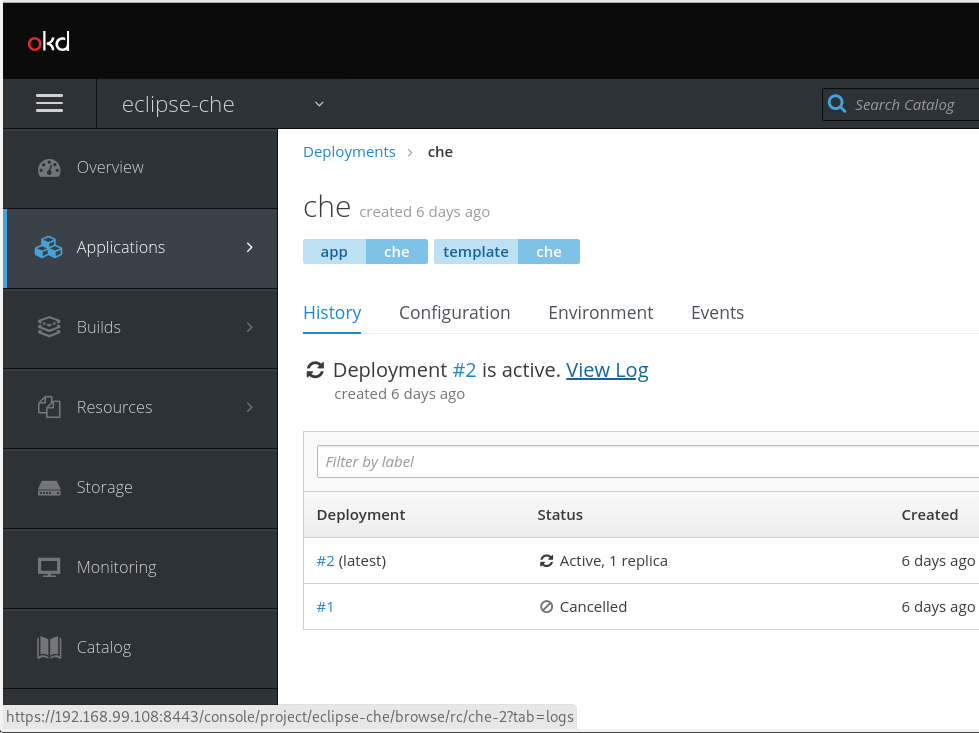
- In the OpenShift Web Console, click Applications > Deployments.
In the Filter by label search field, type
workspacesto see the CodeReady Workspaces server log.Click the View log link for the active CodeReady Workspaces deployment.
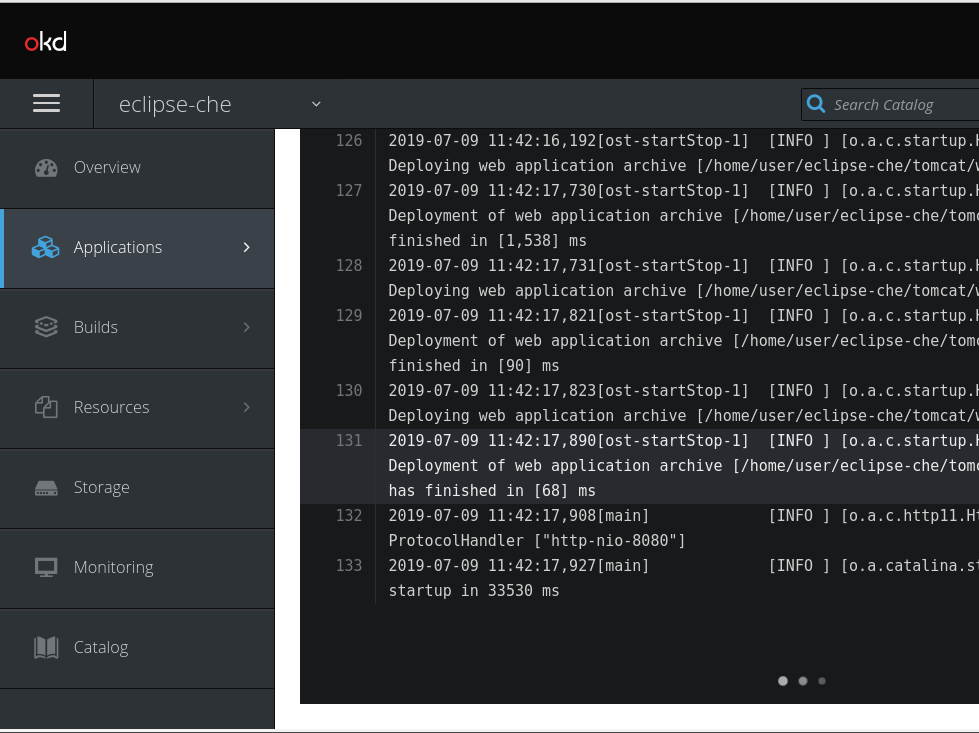
The following log is displayed.
- Search the log for CodeReady Workspaces-server related diagnostics, error information, and information reported by other server components.
2.2.2. Viewing the CodeReady Workspaces server logs on the command line
This section describes how to view the CodeReady Workspaces server logs on the command line.
Procedure
In the terminal, run the following command to get the pods:
oc get pods
$ oc get podsCopy to Clipboard Copied! Toggle word wrap Toggle overflow Exampleoc get pods NAME READY STATUS RESTARTS AGE che-11-j4w2b 1/1 Running 0 3m
$ oc get pods
NAME            READY  STATUS   RESTARTS  AGE
che-11-j4w2b    1/1    Running  0         3m
Copy to Clipboard Copied! Toggle word wrap Toggle overflow To get the logs for a deployment, run the following command:
oc logs <name-of-pod>
$ oc logs <name-of-pod>Copy to Clipboard Copied! Toggle word wrap Toggle overflow Exampleoc logs che-11-j4w2b
$ oc logs che-11-j4w2bCopy to Clipboard Copied! Toggle word wrap Toggle overflow
2.3. Viewing external service logs
This section describes how the view the logs from external services related to CodeReady Workspaces server.
2.3.1. Viewing Keycloak logs
The Keycloak OpenID provider consists of two parts: Server and IDE. It writes its diagnostics or error information to several logs.
2.3.1.1. Viewing the Keycloak server logs
This section describes how to view the Keycloak OpenID provider server logs.
Procedure
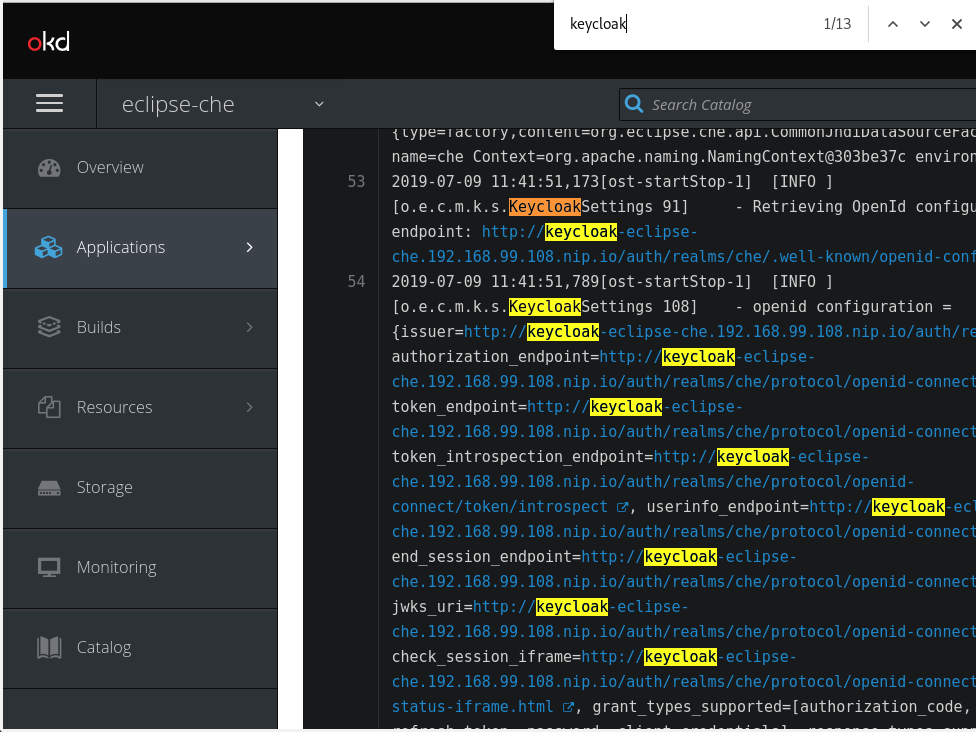
- In the OpenShift Web Console, click Deployments.
-
In the Filter by label search field, type
keycloakto see the Keycloak logs. -
In the Deployment Configs section, click on the
keycloaklink to open it. - In the History tab, click the View log link for the active Keycloak deployment.
- The Keycloak logs are displayed.
To view the Keycloak IDE server diagnostics or error related messages, search for
keycloakin the log.
Additional resources
- See the Section 2.2, “Viewing CodeReady Workspaces server logs” for diagnostics and error messages related to the Keycloak IDE Server.
2.3.1.2. Viewing the Keycloak client logs on Firefox
This section describes how to view the Keycloak IDE client diagnostics or error information in the Firefox WebConsole.
Procedure
- Click Menu > WebDeveloper > WebConsole.
2.3.1.3. Viewing the Keycloak client logs on Google Chrome
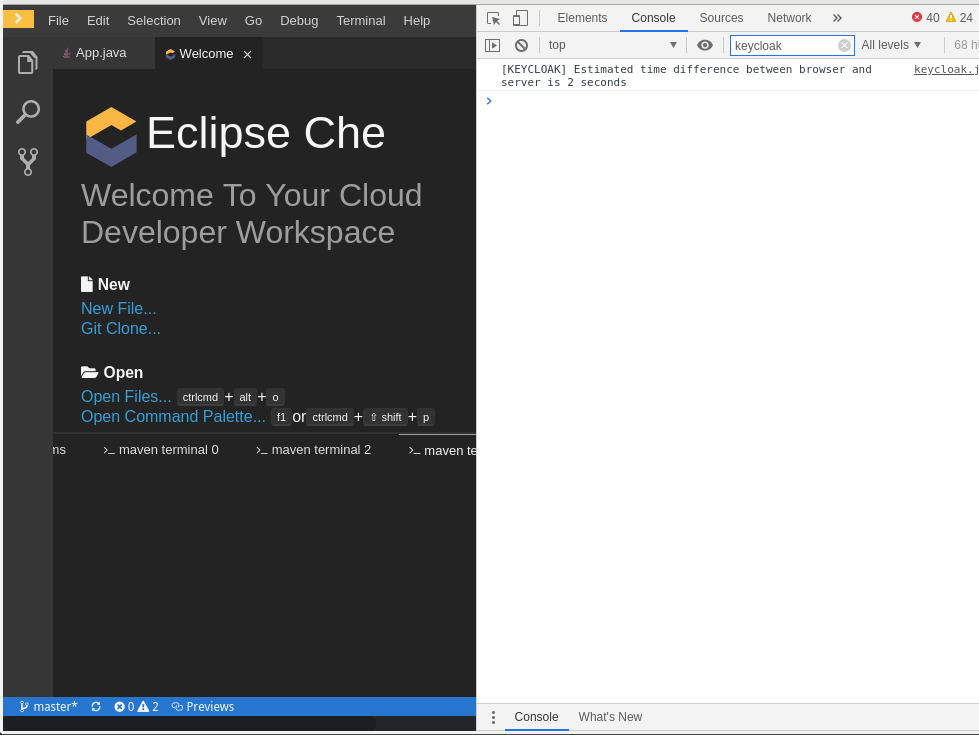
This section describes how to view the Keycloak IDE client diagnostics or error information in the Google Chrome Console tab.
Procedure
- Click on Menu > More Tools > Developer Tools.
Click on the Console tab.
2.3.2. Viewing the PostgreSQL server logs
This section describes how to view the PostgreSQL server logs.
Procedure
- In the OpenShift Web Console, click Deployments.
-
In the Find by label search field, type
postgresto see the PostgreSQL logs. Click postgres deployment to open it. - Click the View log link for the active PostgreSQL deployment.
- The logs are displayed.
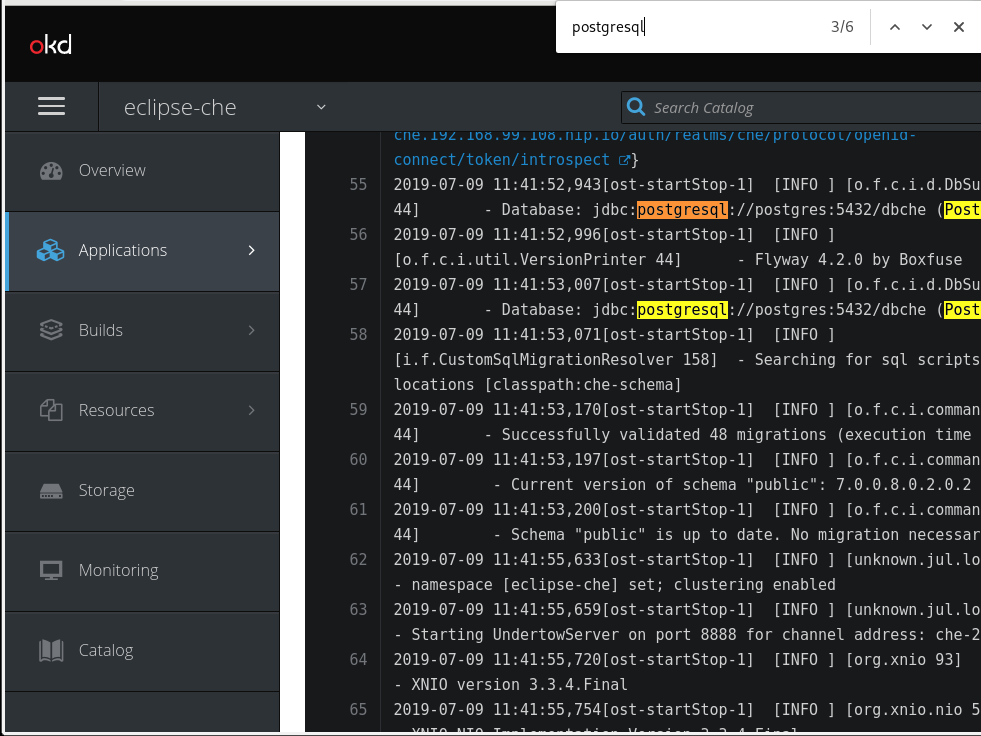
To see PostgreSQL server diagnostics or error related messages, search
postgresqlthrough the log.
Additional resources
- Some diagnostics or error messages related to the PostgreSQL server can be found in the active CodeReady Workspaces deployment log. For details to access the active CodeReady Workspaces deployments logs, see the Section 2.2, “Viewing CodeReady Workspaces server logs” section.
2.4. Viewing workspaces logs
This section describes how to view workspaces logs.
2.4.1. Viewing Che-Theia IDE logs
This section describes how to view Che-Theia IDE logs, on the command line and in the OpenShift web console.
2.4.1.1. Viewing Che-Theia IDE logs on the command line
This section describes how to view Che-Theia IDE logs on the command line.
Procedure
Run the following command to get the list of all the pods:
oc get pods
$ oc get podsCopy to Clipboard Copied! Toggle word wrap Toggle overflow Exampleoc get pods NAME READY STATUS RESTARTS AGE che-9-xz6g8 1/1 Running 1 15h workspace0zqb2ew3py4srthh.go-cli-549cdcf69-9n4w2 4/4 Running 0 1h
$ oc get pods
NAME                                              READY  STATUS   RESTARTS  AGE
che-9-xz6g8                                       1/1    Running  1         15h
workspace0zqb2ew3py4srthh.go-cli-549cdcf69-9n4w2  4/4    Running  0         1h
Copy to Clipboard Copied! Toggle word wrap Toggle overflow Run the following command to get the list of all the containers in the particular pod:
oc get pods <name-of-pod> -o
$ oc get pods <name-of-pod> -oCopy to Clipboard Copied! Toggle word wrap Toggle overflow Exampleoc get pods workspace0zqb2ew3py4srthh.go-cli-549cdcf69-9n4w2 -o jsonpath='\{.spec.containers[*].name}' go-cli che-machine-exechr7 theia-idexzb vscode-gox3r$ oc get pods workspace0zqb2ew3py4srthh.go-cli-549cdcf69-9n4w2 -o jsonpath='\{.spec.containers[*].name}' > go-cli che-machine-exechr7 theia-idexzb vscode-gox3rCopy to Clipboard Copied! Toggle word wrap Toggle overflow Get logs from the
theia/idecontainer:oc logs -f <name-of-container> -c
$ oc logs -f <name-of-container> -cCopy to Clipboard Copied! Toggle word wrap Toggle overflow Exampleoc logs -f workspace0zqb2ew3py4srthh.go-cli-549cdcf69-9n4w2 -c theia-idexzb
$ oc logs -f workspace0zqb2ew3py4srthh.go-cli-549cdcf69-9n4w2 -c
theia-idexzb
Copy to Clipboard Copied! Toggle word wrap Toggle overflow
2.4.1.2. Viewing Che-Theia IDE logs in the web console
This section describes how to view Che-Theia IDE logs in the OpenShift web console.
Procedure
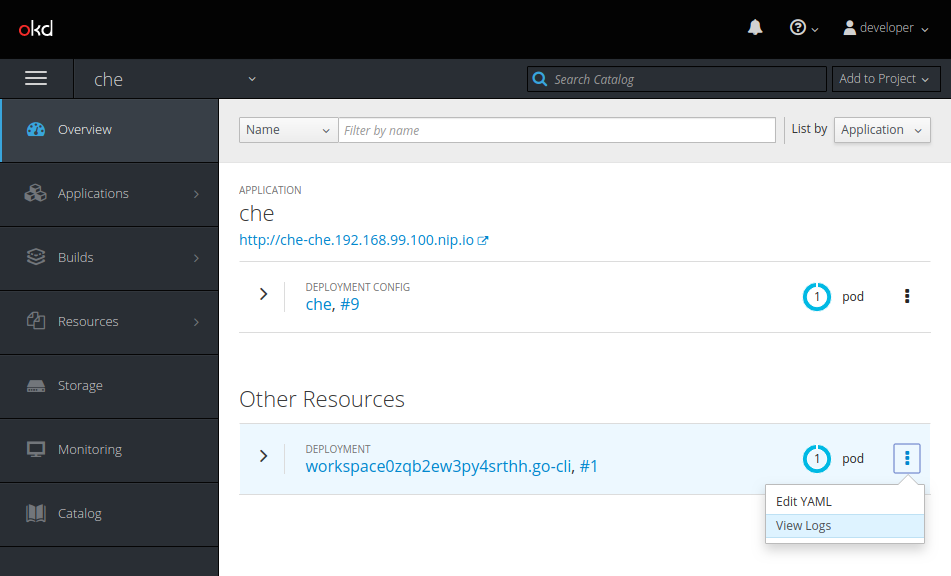
To view Che-Theia IDE logs on the console:
- In the OpenShift Web Console, click Overview.
Search for the particular deployment, click on the context menu on the right side of the deployment, and click View Logs.
In the drop-down list, click theia-ide.

2.4.2. Viewing logs from language servers and debug adapters
2.4.2.1. Checking important logs
This section describes how to check important logs.
Procedure
- In the OpenShift web console, click Applications → Pods to see a list of all the active workspaces.
- Click on the name of the running pod where the workspace is running. The pod screen contains the list of all containers with additional information.
Choose a container and click on the container name.
TipThe most important logs are the
theia-idecontainer and the plug-ins container logs.On the container screen, navigate to the Logs section.
ExampleThe following is an output log of the sidecar container running the Java plug-in.

2.4.2.2. Detecting memory problems
This section describes how to detect memory problems related to a plug-in running out of memory. The following are the two most common problems related to a plug-in running out of memory:
- The plug-in container runs out of memory
-
This can happen during plug-in initialization when the container does not have enough RAM to execute the entrypoint of the image. The user can detect this in the logs of the plug-in container. In this case, the logs should contain
OOMKilled, which implies that the processes in the container requested more memory than is available in the container. - A process inside the container runs out of memory without the container noticing this
For example, the Java language server (Eclipse JDT Language Server, started by the vscode-java extension) throws an OutOfMemoryException. This can happen any time after the container is initialized, for example, when a plug-in starts a language server or when a process runs out of memory because of the size of the project it has to handle.
To detect this problem, check the logs of the main process, which should run in the container. For example, to check the log file of Eclipse JDT Language Server for details, see the relevant plug-in-specific sections.
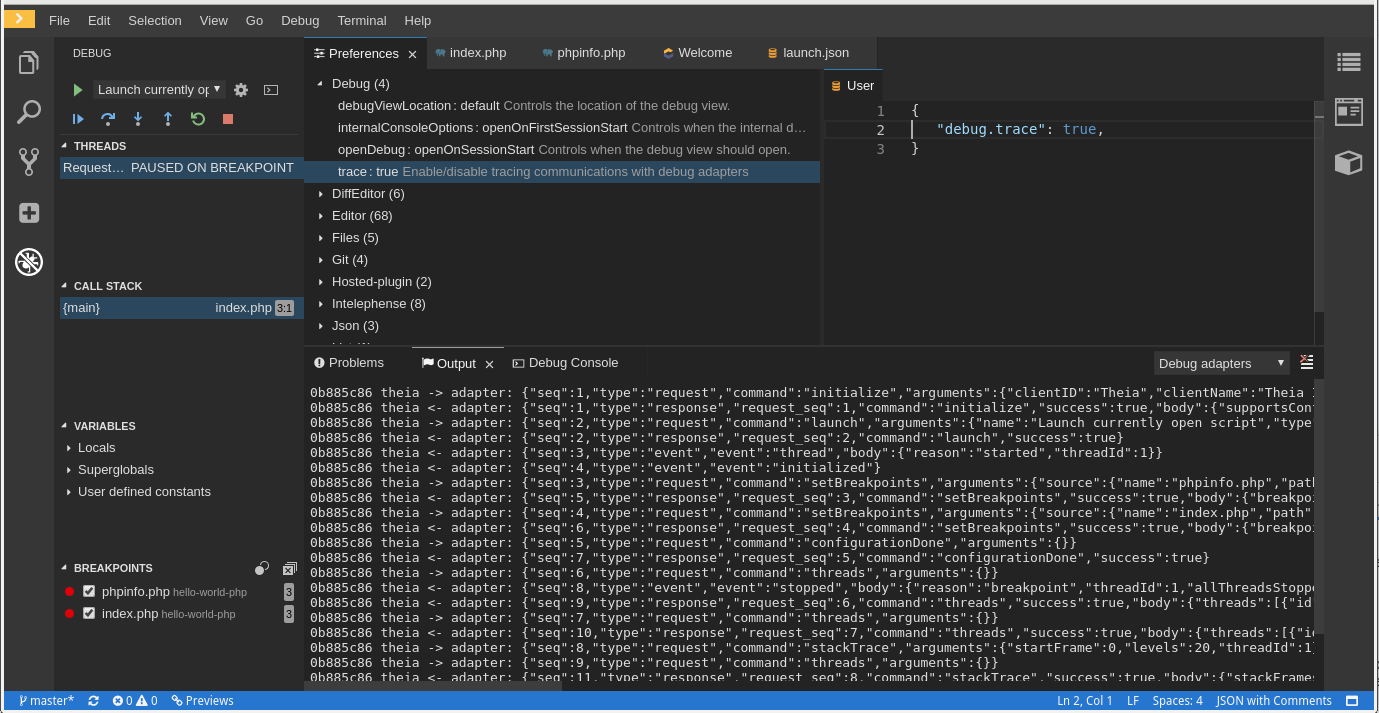
2.4.2.3. Logging the client-server traffic for debug adapters
This section describes how to log the exchange between Che-Theia and a debug adapter into the Output view.
Prerequisites
- A debug session must be started for the Debug adapters option to appear in the list.
Procedure
- Click File → Settings and then open Preferences.
- Expand the Debug section in the Preferences view.
-
Set the trace preference value to
true(default isfalse). - All the communication events are now logged.
To watch these events, click View → Output and select Debug adapters from the drop-down list at the top-right corner of the Output view.
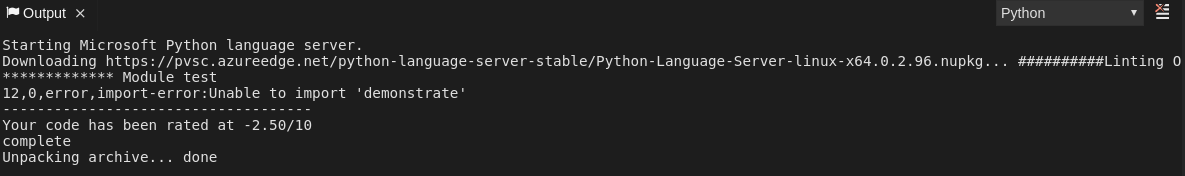
2.4.2.4. Viewing logs for Python
This section describes how to view logs for the Python language server.
Procedure
Navigate to the Output view and select Python in the drop-down list.
2.4.2.5. Viewing logs for Go
This section describes how to view logs for the Go language server.
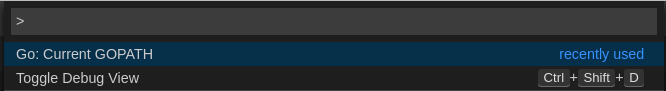
2.4.2.5.1. Finding the gopath
This section describes how to find where the GOPATH variable points to.
Procedure
Execute the
Go: Current GOPATHcommand.

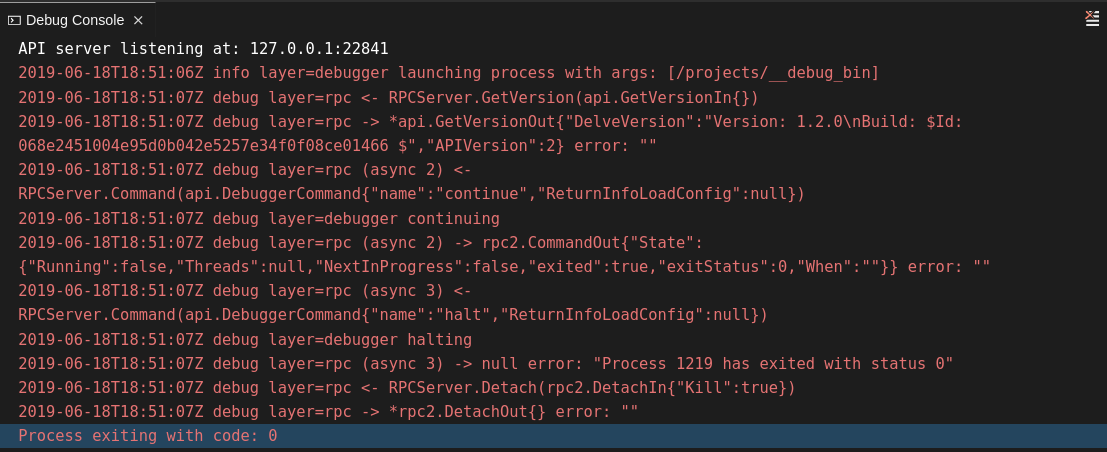
2.4.2.5.2. Viewing the Debug Console log for Go
This section describes how to view the log output from the Go debugger.
Procedure
Set the
showLogattribute totruein the debug configuration.Copy to Clipboard Copied! Toggle word wrap Toggle overflow To enable debugging output for a component, add the package to the comma-separated list value of the
logOutputattribute:Copy to Clipboard Copied! Toggle word wrap Toggle overflow The debug console prints the additional information in the debug console.
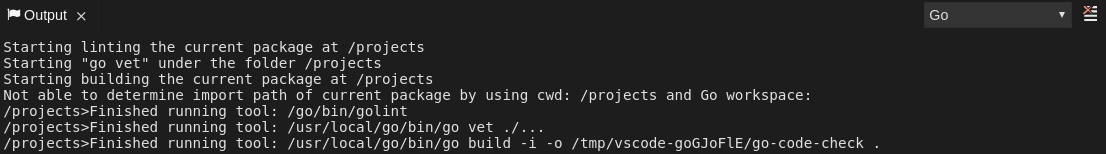
2.4.2.5.3. Viewing the Go logs output in the Output panel
This section describes how to view the Go logs output in the Output panel.
Procedure
- Navigate to the Output view.
Select Go in the drop-down list.
2.4.2.6. Viewing logs for the NodeDebug NodeDebug2 adapter
There are no specific diagnostics other than the general ones.
2.4.2.7. Viewing logs for Typescript
2.4.2.7.1. Enabling the label switched protocol (LSP) tracing
Procedure
-
To enable the tracing of messages sent to the Typescript (TS) server, in the Preferences view, set the
typescript.tsserver.traceattribute toverbose. Use this to diagnose the TS server issues. -
To enable logging of the TS server to a file, set the
typescript.tsserver.logattribute toverbose. Use this log to diagnose the TS server issues. The log contains the file paths.
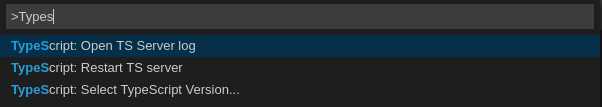
2.4.2.7.2. Viewing the Typescript language server log
This section describes how to view the Typescript language server log.
Procedure
To get the path to the log file, see the Typescript Output console:
To open log file, use the Open TS Server log command.

2.4.2.7.3. Viewing the Typescript logs output in the Output panel
This section describes how to view the Typescript logs output in the Output panel.
Procedure
- Navigate to the Output view
Select TypeScript in the drop-down list.

2.4.2.8. Viewing logs for Java
Other than the general diagnostics, there are Language Support for Java (Eclipse JDT Language Server) plug-in actions that the user can perform.
2.4.2.8.1. Verifying the state of the Eclipse JDT Language Server
Procedure
Check if the container running the Eclipse JDT Language Server plug-in is running the Eclipse JDT Language Server main process.
-
Open a terminal in the container that is running the Eclipse JDT Language Server plug-in (an example name for the container:
vscode-javaxxx). Inside the terminal, run the
ps aux | grep jdtcommand to check if the Eclipse JDT Language Server process is running in the container. If the process is running, the output should be:usr/lib/jvm/default-jvm/bin/java --add-modules=ALL-SYSTEM --add-opens java.base/java.util
usr/lib/jvm/default-jvm/bin/java --add-modules=ALL-SYSTEM --add-opens java.base/java.utilCopy to Clipboard Copied! Toggle word wrap Toggle overflow This message also shows the VSCode java extension used. If it is not running, the language server has not been started inside the container.
- Check all logs described in Section 2.4.2.1, “Checking important logs”
2.4.2.8.2. Verifying the Eclipse JDT Language Server features
Procedure
If the Eclipse JDT Language Server process is running, check if the language server features are working:
- Open a Java file and use the hover or autocomplete functionality. In case of an erroneous file, the user sees Java in the Outline view or in the Problems view.
2.4.2.8.3. Viewing the Java language server log
Procedure
The Eclipse JDT Language Server has its own workspace where it logs errors, information about executed commands, and events.
- To open this log file, open a terminal in the container that is running the Eclipse JDT Language Server plug-in. You can also view the log file by running the Java: Open Java Language Server log file command.
-
Run
cat <PATH_TO_LOG_FILE>wherePATH_TO_LOG_FILEis/home/theia/.theia/workspace-storage/<workspace_name>/redhat.java/jdt_ws/.metadata/.log.
2.4.2.8.4. Logging the Java language server protocol (LSP) messages
Procedure
To log the LSP messages to the VS Code Output view, enable tracing by setting the java.trace.server attribute to verbose.
Additional resources
For troubleshooting instructions, see the VS Code Java Github repository.
2.4.2.9. Viewing logs for Intelephense
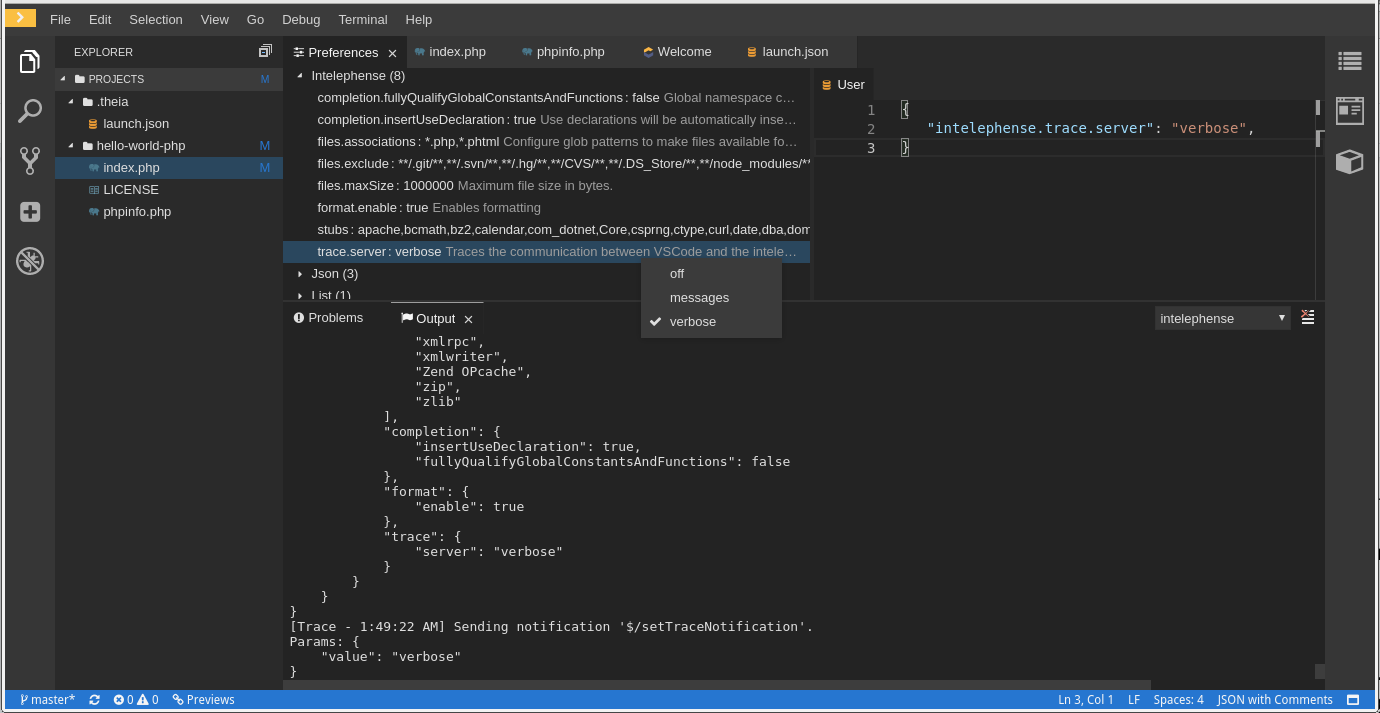
2.4.2.9.1. Logging the Intelephense client-server communication
Procedure
To configure the PHP Intelephense language support to log the client-server interexchange in the Output view:
- Click File → Settings.
- Open the Preferences view.
-
Expand the Intelephense section and set the
trace.server.verbosepreference value toverboseto see all the communication events (the default value isoff).
2.4.2.9.2. Viewing Intelephense events in the Output panel
This procedure describes how to view Intelephense events in the Output panel.
Procedure
- Click View → Output
Select Intelephense in the drop-down list for the Output view.
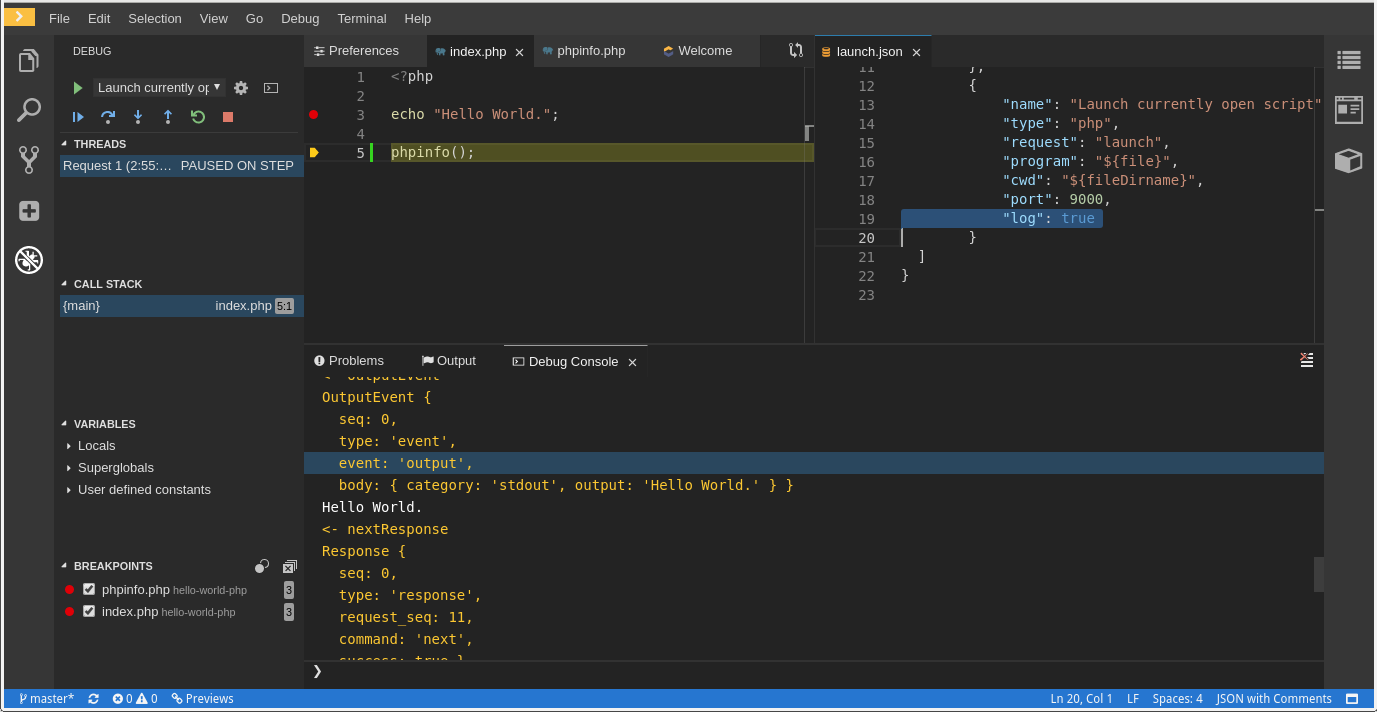
2.4.2.10. Viewing logs for PHP-Debug
This procedure describes how to configure the PHP Debug plug-in to log the PHP Debug plug-in diagnostic messages into the Debug Console view. Configure this before the start of the debug session.
Procedure
-
In the
launch.jsonfile, add the"log": trueattribute to the selected launch configuration. - Start the debug session.
The diagnostic messages are printed into the Debug Console view along with the application output.
2.4.2.11. Viewing logs for XML
Other than the general diagnostics, there are XML plug-in specific actions that the user can perform.
2.4.2.11.1. Verifying the state of the XML language server
Procedure
-
Open a terminal in the container named
vscode-xml-<xxx>. Run
ps aux | grep javato verify that the XML language server has started. The output should be:java ***/org.eclipse.ls4xml-uber.jar`
java ***/org.eclipse.ls4xml-uber.jar`Copy to Clipboard Copied! Toggle word wrap Toggle overflow If not, see Section 2.4.2.1, “Checking important logs”.
2.4.2.11.2. Checking XML language server feature flags
Procedure
Check if the features are enabled. The XML plug-in provides multiple settings that can enable and disable features:
-
xml.format.enabled: Enable the formatter -
xml.validation.enabled: Enable the validation -
xml.documentSymbols.enabled: Enable the document symbols
-
-
To diagnose whether the XML language server is working, create a simple XML element, such as
<hello></hello>, and confirm that it appears in the Outline panel on the right. -
If the document symbols do not show, ensure that the
xml.documentSymbols.enabledattribute is set totrue. If it istrue, and there are no symbols, the language server may not be hooked to the editor. If there are document symbols, then the language server is connected to the editor. -
Ensure that the features that the user needs, are set to
truein the settings (they are set totrueby default). If any of the features are not working, or not working as expected, file an issue against the Language Server.
2.4.2.11.3. Enabling XML Language Server Protocol (LSP) tracing
Procedure
To log LSP messages to the VS Code Output view, enable tracing by setting the xml.trace.server attribute to verbose.
2.4.2.11.4. Viewing the XML language server log
Procedure
The log from the language server can be found in the plug-in sidecar at /home/theia/.theia/workspace-storage/<workspace_name>/redhat.vscode-xml/lsp4xml.log.
2.4.2.12. Viewing logs for YAML
This section describes the YAML plug-in specific actions that the user can perform, in addition to the general diagnostics ones.
2.4.2.12.1. Verifying the state of the YAML language server
This section describes how to verify the state of the YAML language server.
Procedure
Check if the container running the YAML plug-in is running the YAML language server.
-
In the editor, open a terminal in the container that is running the YAML plug-in (an example name of the container:
vscode-yaml-<xxx>). -
In the terminal, run the
ps aux | grep nodecommand. This command searches all the node processes running in the current container. Verify that a command
node **/server.jsis running.
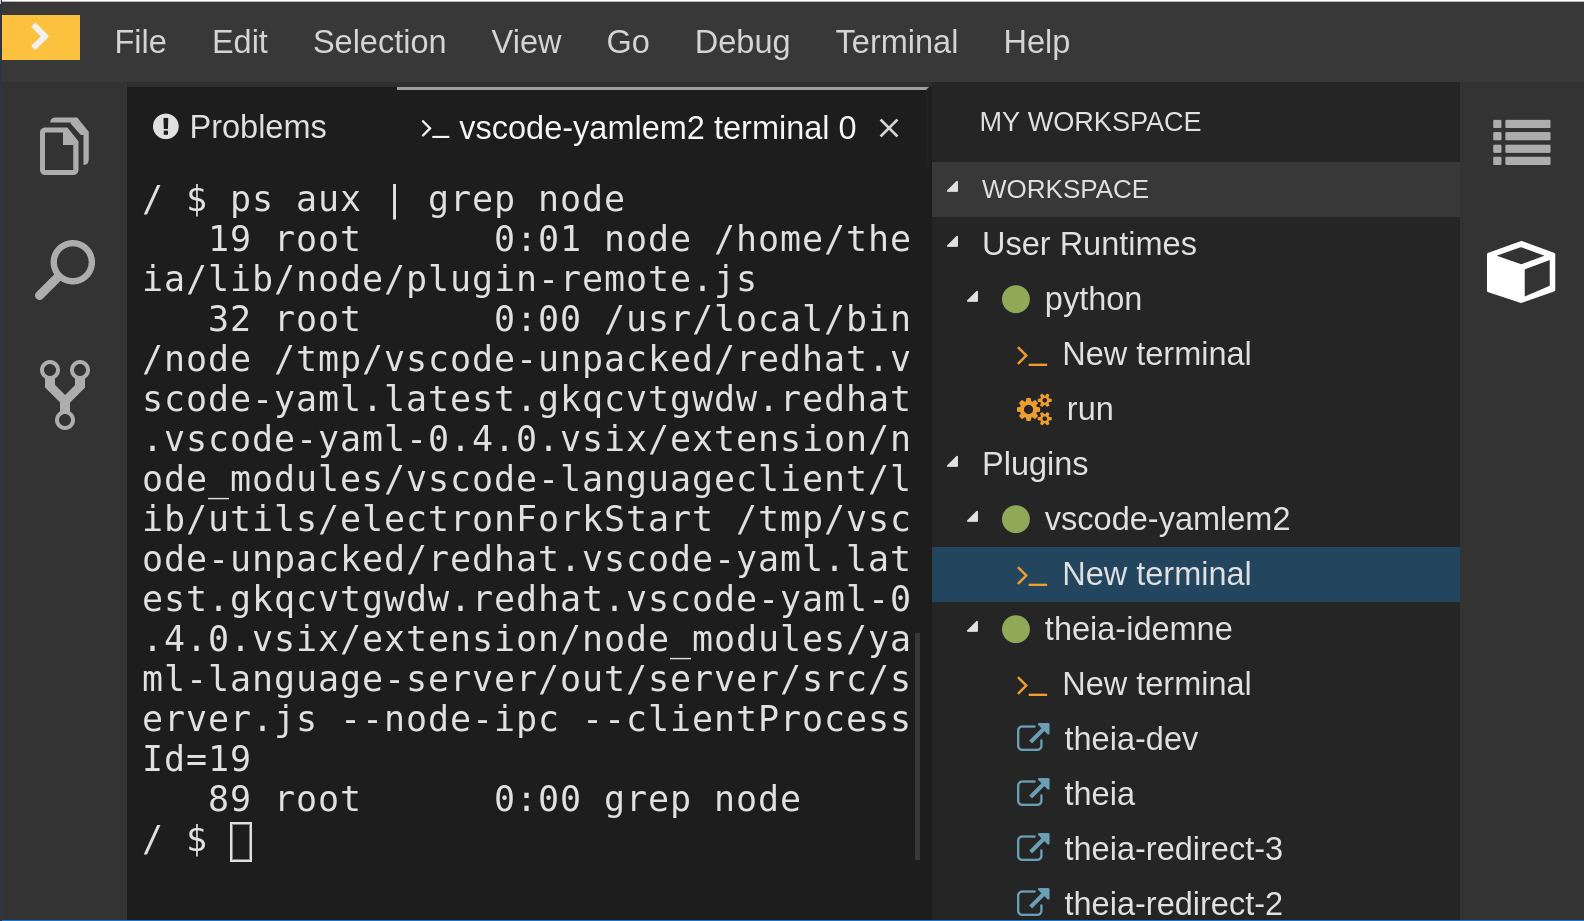
The node **/server.js running in the container indicates that the language server is running. If it is not running, the language server has not started inside the container. In this case, see Section 2.4.2.1, “Checking important logs”.
2.4.2.12.2. Checking the YAML language server feature flags
Procedure
To check the feature flags:
Check if the features are enabled. The YAML plug-in provides multiple settings that can enable and disable features, such as:
-
yaml.format.enable: Enables the formatter -
yaml.validate: Enables validation -
yaml.hover: Enables the hover function -
yaml.completion: Enables the completion function
-
-
To check if the plug-in is working, type the simplest YAML, such as
hello: world, and then open the Outline panel on the right side of the editor. - Verify if there are any document symbols. If yes, the language server is connected to the editor.
-
If any feature is not working, make sure that the settings listed above are set to
true(they are set totrueby default). If a feature is not working, file an issue against the Language Server.
2.4.2.12.3. Enabling YAML Language Server Protocol (LSP) tracing
Procedure
To log LSP messages to the VS Code Output view, enable tracing by setting the yaml.trace.server attribute to verbose.
2.4.2.13. Viewing logs for Dotnet with Omnisharp-Theia plug-in
2.4.2.13.1. Omnisharp-Theia plug-in
CodeReady Workspaces uses the Omnisharp-Theia plug-in as a remote plug-in. It is located at github.com/redhat-developer/omnisharp-theia-plugin. In case of an issue, report it, or contribute your fix in the repository.
This plug-in registers omnisharp-roslyn as a language server and provides project dependencies and language syntax for C# applications.
The language server runs on .Net SDK 2.2.105.
2.4.2.13.2. Verifying the state of the Omnisharp-Theia plug-in language server
Procedure
To check if the container running the Omnisharp-Theia plug-in is running OmniSharp, execute the ps aux | grep OmniSharp.exe command. If the process is running, the following is an example output:
/tmp/theia-unpacked/redhat-developer.che-omnisharp-plugin.0.0.1.zcpaqpczwb.omnisharp_theia_plugin.theia/server/bin/mono
/tmp/theia-unpacked/redhat-developer.che-omnisharp-plugin.0.0.1.zcpaqpczwb.omnisharp_theia_plugin.theia/server/omnisharp/OmniSharp.exe
/tmp/theia-unpacked/redhat-developer.che-omnisharp-plugin.0.0.1.zcpaqpczwb.omnisharp_theia_plugin.theia/server/bin/mono
/tmp/theia-unpacked/redhat-developer.che-omnisharp-plugin.0.0.1.zcpaqpczwb.omnisharp_theia_plugin.theia/server/omnisharp/OmniSharp.exeIf the output is different, the language server has not started inside the container. Check the logs described in Section 2.4.2.1, “Checking important logs”.
2.4.2.13.3. Checking Omnisharp Che-Theia plug-in language server features
Procedure
-
If the OmniSharp.exe process is running, check if the language server features are working by opening a
.csfile and trying the hover or completion features, or opening the Problems or Outline view.
2.4.2.13.4. Viewing Omnisharp-Theia plug-in logs in the Output panel
Procedure
If Omnisharp.exe is running, it logs all information in the Output panel. To view the logs, open the Output view and select C# from the drop-down list.
2.4.2.14. Viewing logs for Dotnet with NetcoredebugOutput plug-in
2.4.2.14.1. NetcoredebugOutput plug-in
The NetcoredebugOutput plug-in provides netcoredbg, which implements the VS Code Debug Adapter protocol and allows users to debug .NET applications under the .NET Core runtime.
Dotnet SDK v.2.2.105 is installed in the container where the Netcoredbg plug-in is running.
2.4.2.14.2. Verifying the state of the NetcoredebugOutput plug-in
Procedure
To test the plug-in initialization:
Check if there is a netcoredbg debug configuration in the
launch.jsonfile. The following is an example debug configuration:Copy to Clipboard Copied! Toggle word wrap Toggle overflow -
To test if it exists, test the autocompletion feature within the braces of the
configurationsection of thelaunch.jsonfile. If you can findnetcoredbg, the Che-Theia plug-in is correctly initialized. If not, see Section 2.4.2.1, “Checking important logs”.
2.4.2.14.3. Viewing NetcoredebugOutput plug-in logs in the Output panel
This section describes how to view NetcoredebugOutput plug-in logs in the Output panel.
Procedure
Open the Debug console.

2.4.2.15. Viewing logs for Camel
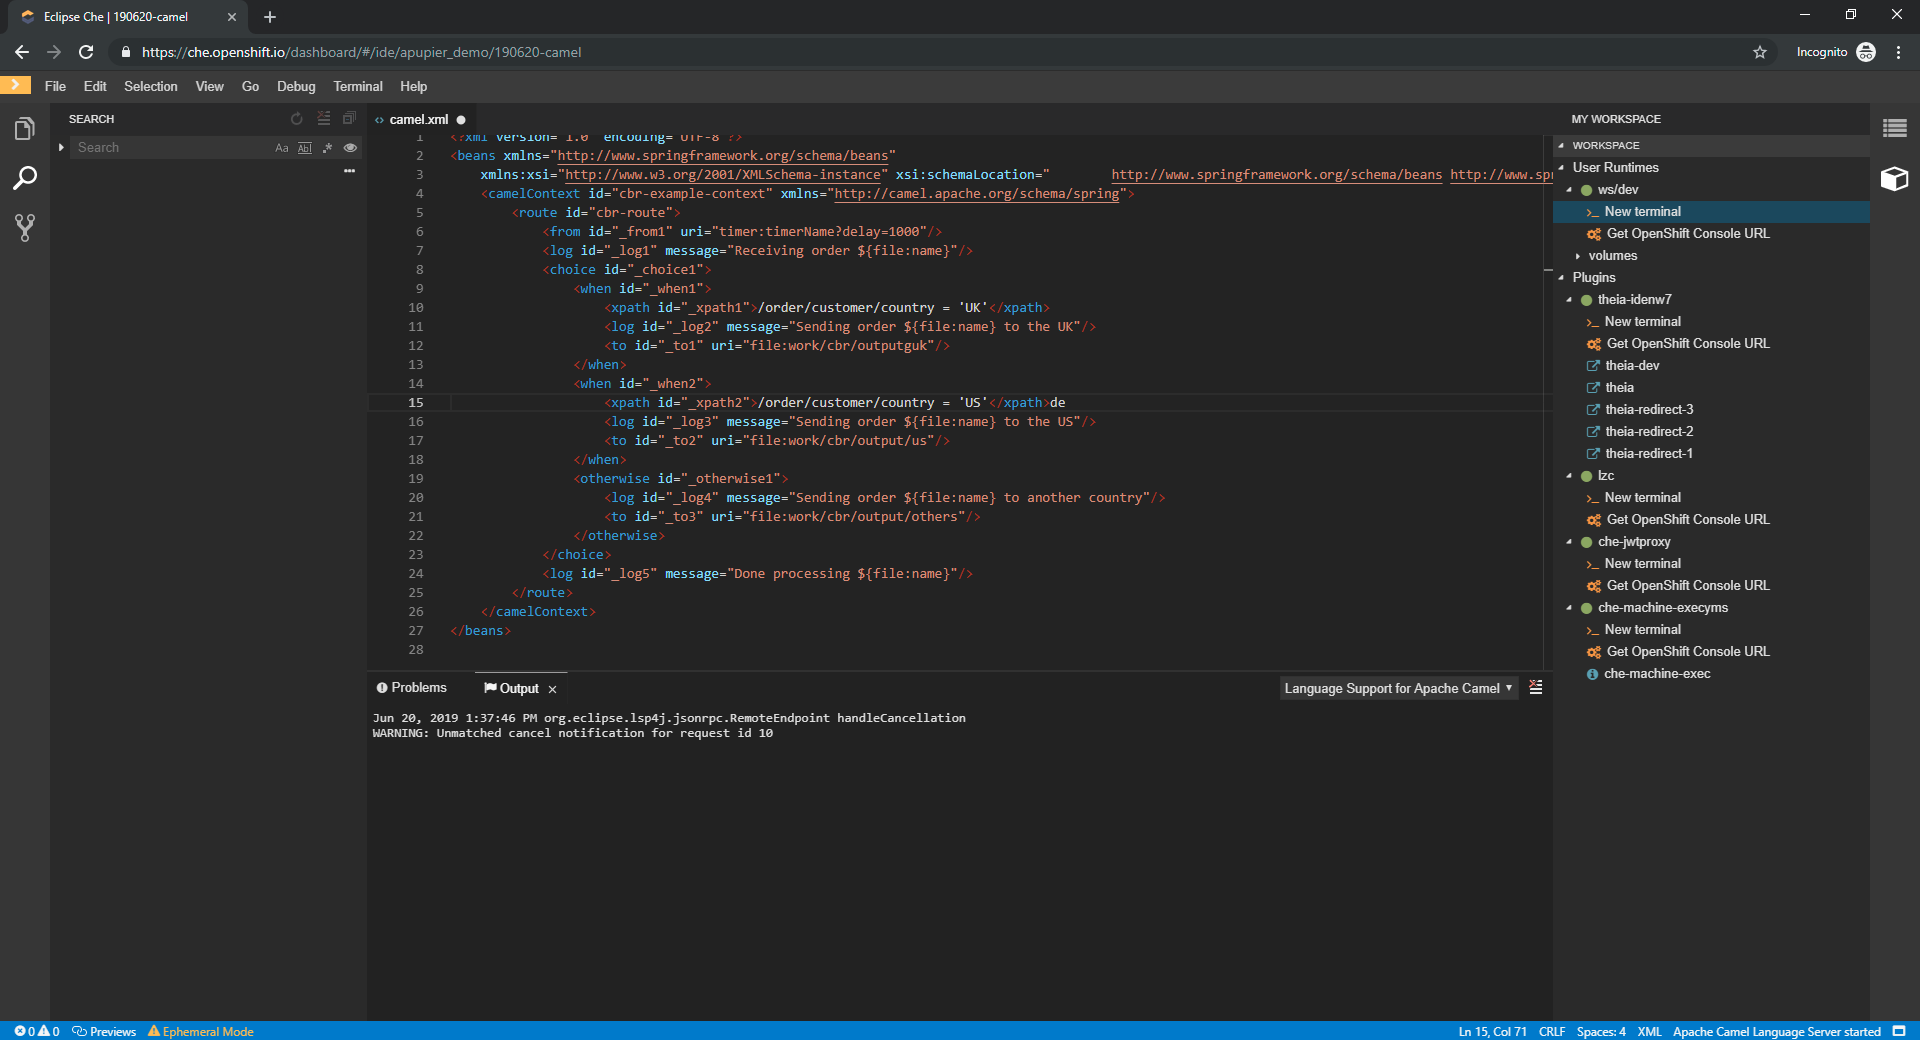
2.4.2.15.1. Verifying the state of the Camel language server
Procedure
The user can inspect the log output of the sidecar container running the Camel tooling; the Camel tooling container is named: vscode-apache-camel<xxx>.
To verify the state of the language server:
-
Open a terminal inside the
vscode-apache-camel<xxx>container. Run the
ps aux | grep javacommand. The following is an example language server process:java -jar /tmp/vscode-unpacked/camel-tooling.vscode-apache-camel.latest.euqhbmepxd.camel-tooling.vscode-apache-camel-0.0.14.vsix/extension/jars/language-server.jar
java -jar /tmp/vscode-unpacked/camel-tooling.vscode-apache-camel.latest.euqhbmepxd.camel-tooling.vscode-apache-camel-0.0.14.vsix/extension/jars/language-server.jarCopy to Clipboard Copied! Toggle word wrap Toggle overflow - If you cannot find it, see Section 2.4.2.1, “Checking important logs”.
2.4.2.15.2. Viewing Camel logs in the Output panel
The Camel language server is a SpringBoot application that writes its log to the $\{java.io.tmpdir}/log-camel-lsp.out file. Typically, $\{java.io.tmpdir} points to the /tmp directory, so the filename is /tmp/log-camel-lsp.out.
Procedure
The Camel language server logs are printed in the Output channel named Language Support for Apache Camel.
The output channel is created only at the first created log entry on the client side. It may be absent when everything is going well.
2.5. Viewing the plug-in broker logs
This section describes how to view the plug-in broker logs.
The logs from the plug-in broker are not persisted. As the Pod itself is deleted very quickly, events will in most cases be unavailable.
Procedure
- Logs are displayed to the user while the workspace is starting.
Chapter 3. Monitoring CodeReady Workspaces
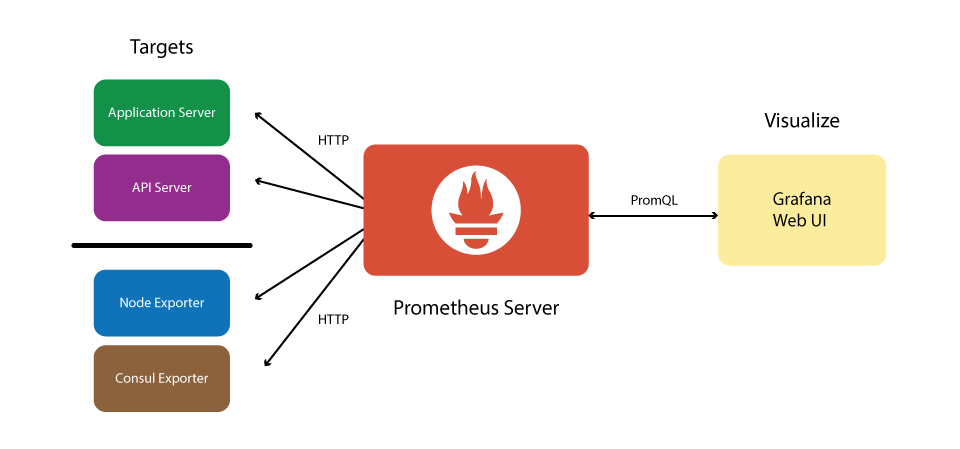
CodeReady Workspaces can expose certain data as metrics, that can be processed by Prometheus and Grafana stack. Prometheus is a monitoring system, that maintains the collection of metrics - time series key-value data which can represent consumption of resources like CPU and memory, amount of processed HTTP queries and their execution time, and CodeReady Workspaces specific resources, such as number of users and workspaces, the start and shutdown of workspaces, information about JsonRPC stack.
Prometheus is powered with a special query language, that allows manipulating the collected data, and perform various binary, vector and aggregation operations with it, to help create a more refined view on data.
While Prometheus is the central piece, responsible for scraping and storing the metrics, while Grafana offers a front-end "facade" with tools to create a various visual representation in the form of dashboards with various panels and graph types.
Note that this monitoring stack is not an official production-ready solution, but rather has an introduction purpose.
Figure 3.1. The structure of CodeReady Workspaces monitoring stack
3.1. Enabling CodeReady Workspaces metrics collections
Prerequisites
- Installed Prometheus 2.9.1 or above. See more https://prometheus.io/docs/introduction/first_steps/.
- Installed Grafana 6.0 or above. See more at https://grafana.com/docs/installation/
Procedure
-
Set the
CHE_METRICS_ENABLED=trueenvironment variable -
Expose the
8087port as a service on the che-master host -
Configure Prometheus to scrape metrics from the
8087port - Configure a Prometheus data source on Grafana
- Deploy CodeReady Workspaces-specific dashboards on Grafana
3.2. Collecting CodeReady Workspaces metrics with Prometheus
Prometheus is a monitoring system that collects metrics in real time and stores them in a time series database.
Prometheus comes with a console accessible at the 9090 port of the application pod. By default, a template provides an existing service and a route to access it. It can be used to query and view metrics.
3.2.1. Prometheus terminology
Prometheus offers:
- counter
- the simplest numerical type of metric whose value can be only increased. A typical example is counting the amount of HTTP requests that go through the system.
- gauge
- numerical value that can be increased or decreased. Best suited for representing values of objects.
- histogram
- a more complex metric that is suited for performing observations. Metrics are collected and grouped in configurable buckets, which allwos to present the results, for instance, in a form of a heatmap.
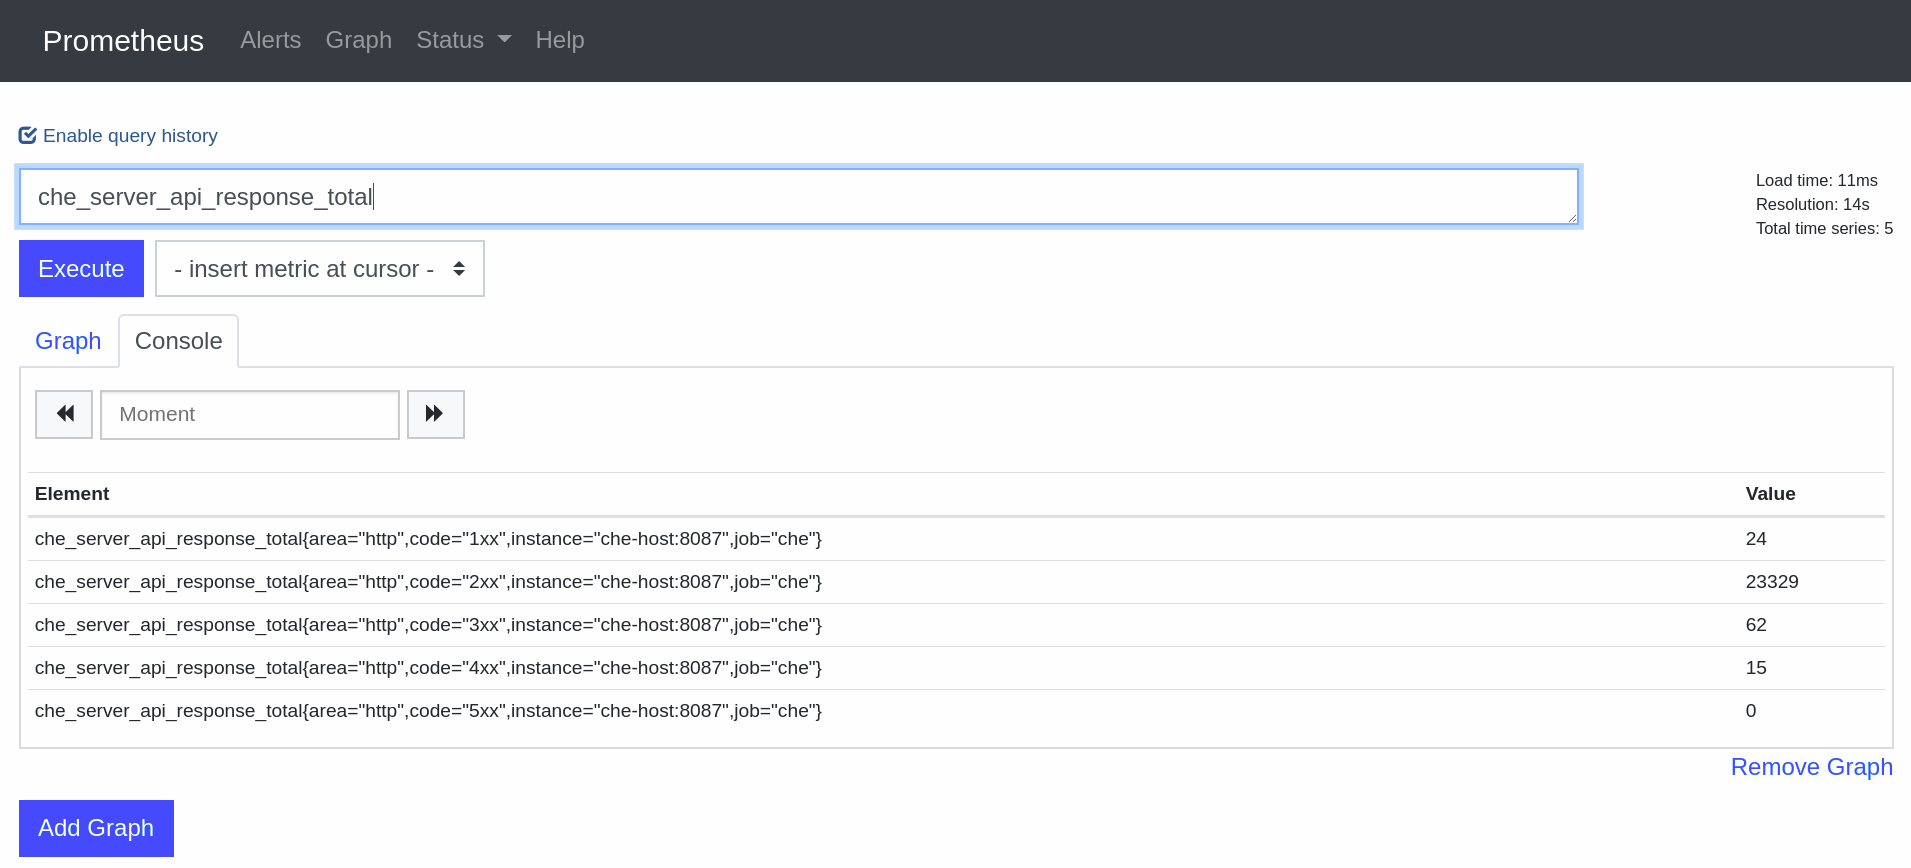
3.2.2. Configuring Prometheus
Prometheus configuration
3.3. Viewing CodeReady Workspaces metrics on Grafana dashboards
Grafana is used for informative representation of Prometheus metrics. Providing visibility for OpenShift, Grafana’s deployment configuration and ConfigMaps are located in the che-monitoring.yaml configuration file.
3.3.1. Configuring and deploying Grafana
Grafana is run on port 3000 with a corresponding service and route.
Three ConfigMaps are used to configure Grafana:
-
grafana-datasources— configuration for Grafana datasource, a Prometheus endpoint -
grafana-dashboards— configuration of Grafana dashboards and panels -
grafana-dashboard-provider— configuration of the Grafana dashboard provider API object, which tells Grafana where to look in the file system for pre-provisioned dashboards
3.3.2. Grafana dashboards overview
CodeReady Workspaces provides several types of dashboards.
3.3.2.1. CodeReady Workspaces server dashboard
Use case: CodeReady Workspaces server-specific metrics related to CodeReady Workspaces components, such as workspaces or users.
Figure 3.2. The General panel
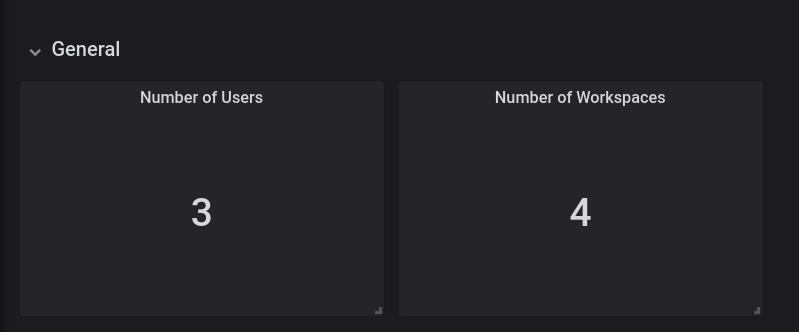
The General panel contains basic information, such as the total number of users and workspaces in the CodeReady Workspaces database.
Figure 3.3. The Workspaces panel
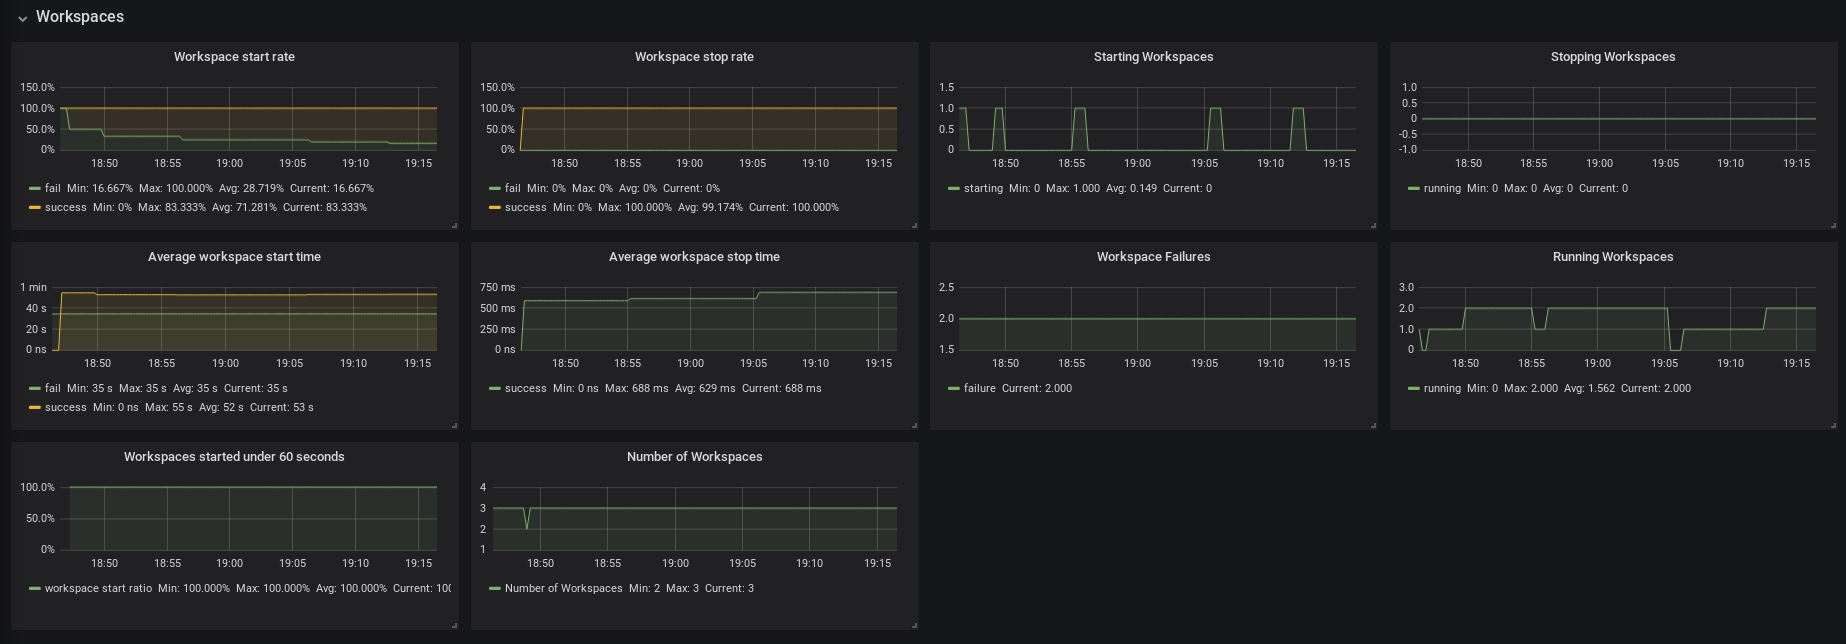
- Workspace start rate — the ratio between successful and failed started workspaces
- Workspace stop rate — the ratio between successful and failed stopped workspaces
- Workspace Failures — the number of workspace failures shown on the graph
- Starting Workspaces — the gauge that shows the number of currently starting workspaces
- Average Workspace Start Time — 1-hour average of workspace starts or fails
- Average Workspace Stop Time — 1-hour average of workspace stops
- Running Workspaces — the gauge that shows the number of currently running workspaces
- Stopping Workspaces — the gauge that shows the number of currently stopping workspaces
- Workspaces started under 60 seconds — the percentage of workspaces started under 60 seconds
- Number of Workspaces — the number of workspaces created over time
Figure 3.4. The Users panel
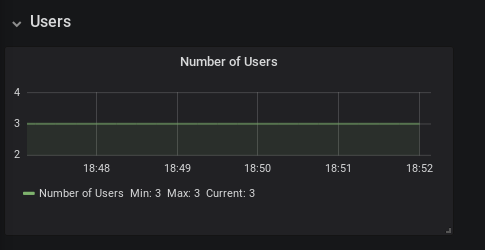
- Number of Users — the number of users known to CodeReady Workspaces over time
Figure 3.5. The Tomcat panel
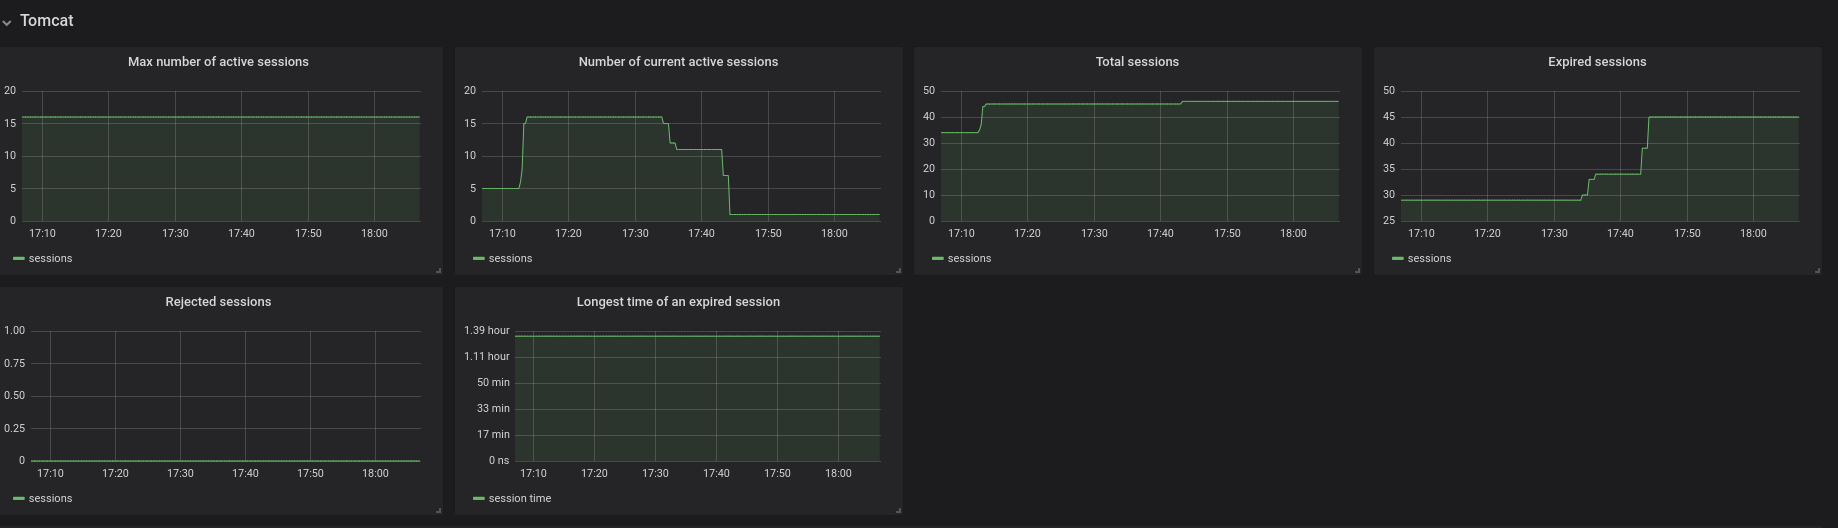
- Max number of active sessions — the max number of active sessions that have been active at the same time
- Number of current active sessions — the number of currently active sessions
- Total sessions — the total number of sessions
- Expired sessions — the number of sessions that have expired
- Rejected sessions — the number of sessions that were not created because the maximum number of active sessions was reached
- Longest time of an expired session — the longest time (in seconds) that an expired session had been alive
Figure 3.6. The Request panel
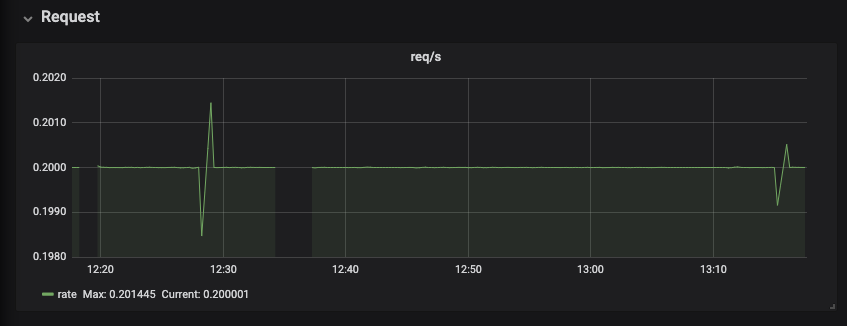
The Requests panel displays HTTP requests in a graph that shows the average number of requests per minute.
Figure 3.7. The Executors panel, part 1
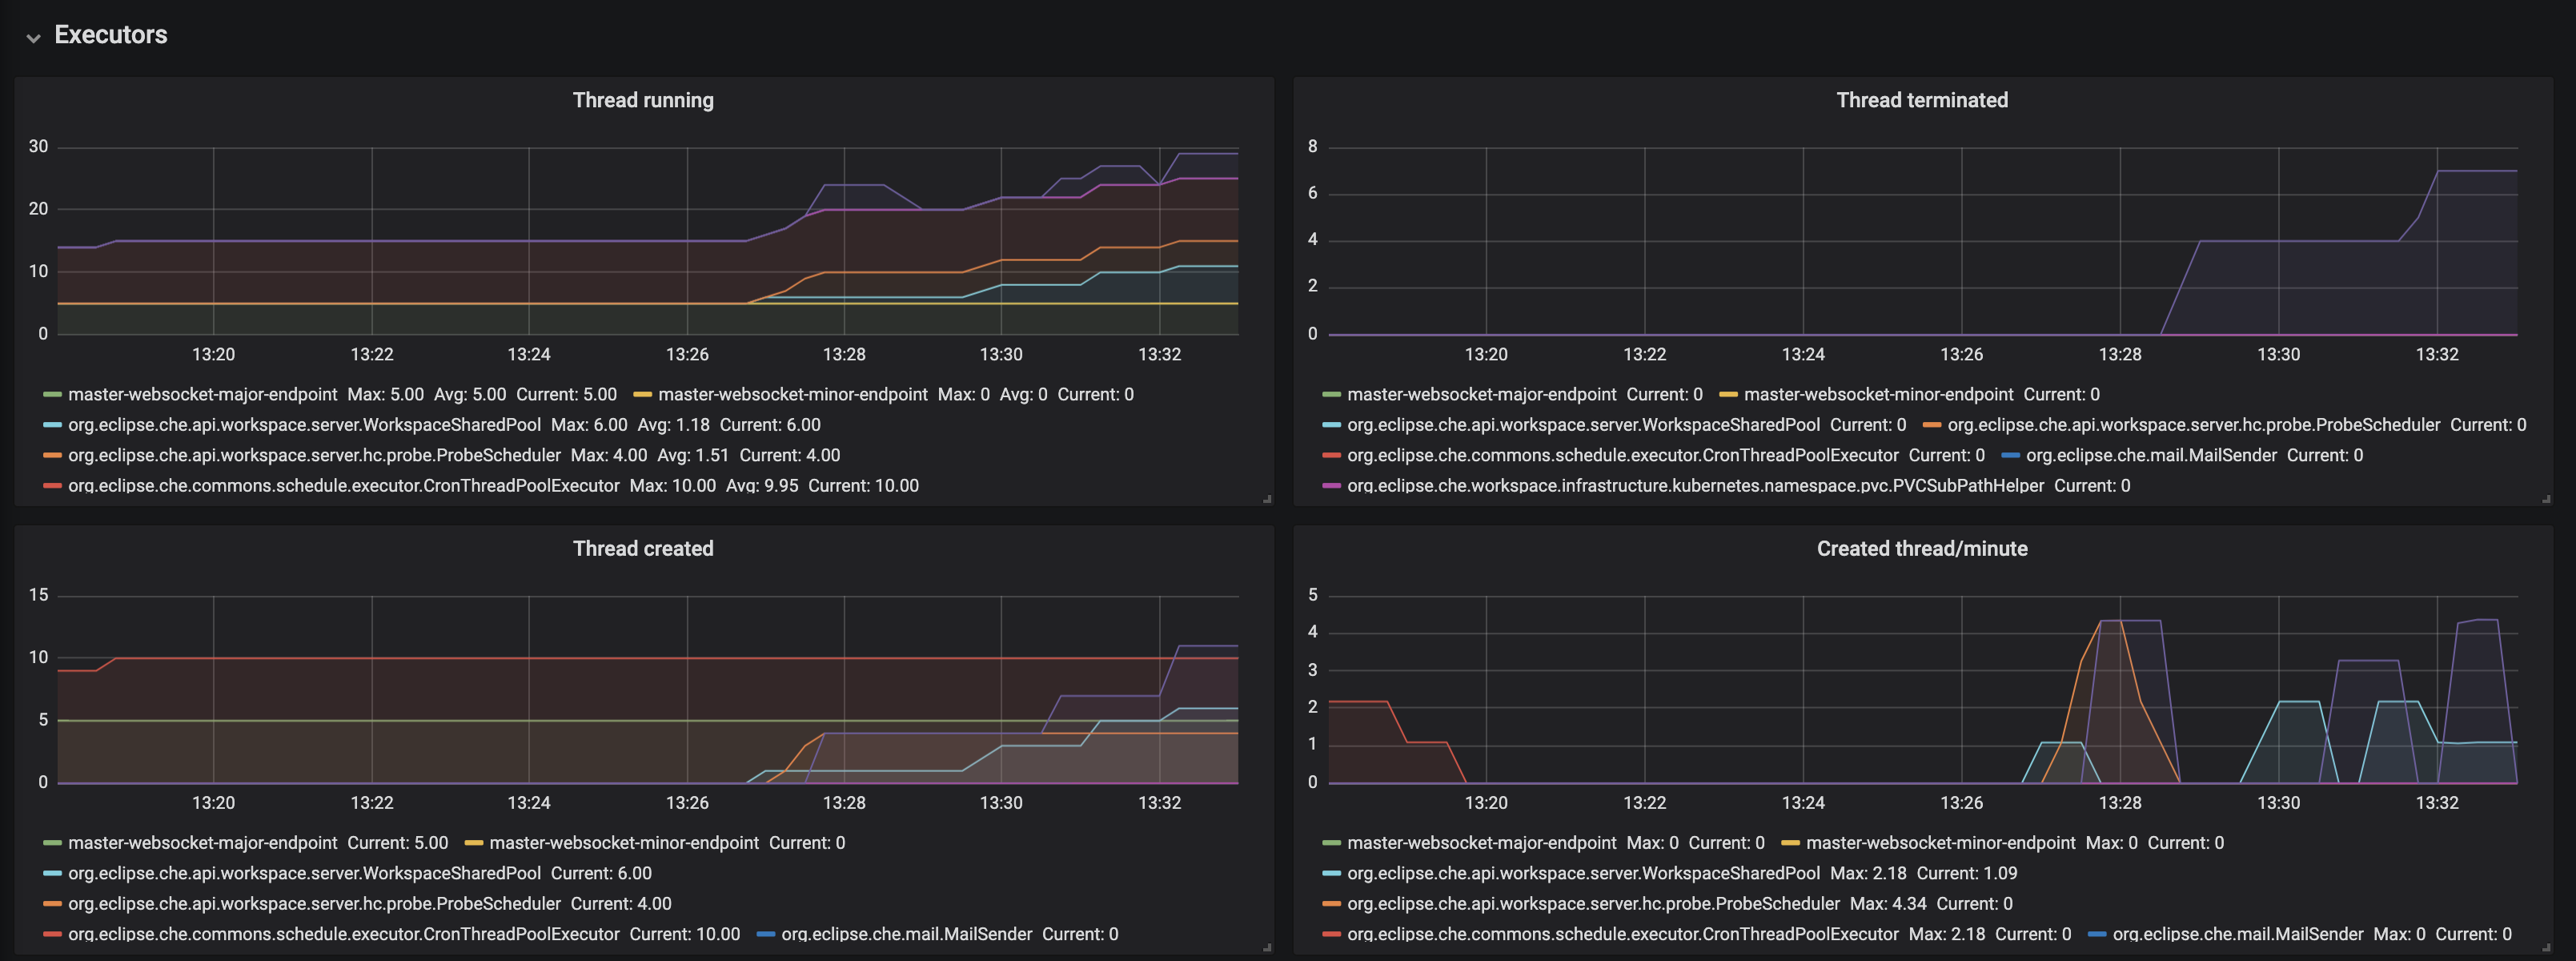
- Threads running - the number of threads that are not terminated aka alive. May include threads that are in a waiting or blocked state.
- Threads terminated - the number of threads that was finished its execution.
- Threads created - number of threads created by thread factory for given executor service.
- Created thread/minute - Speed of thread creating for the given executor service.
Figure 3.8. The Executors panel, part 2
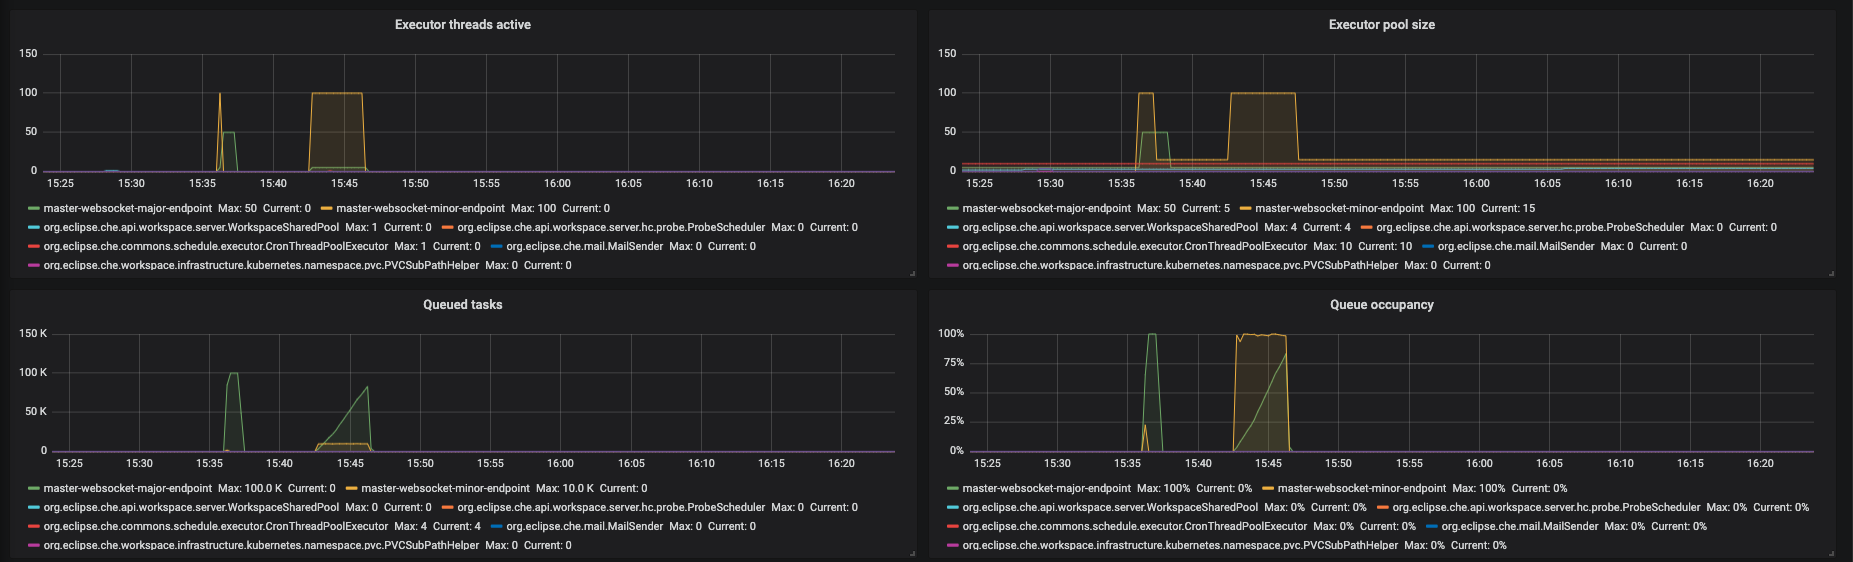
- Executor threads active - number of threads that actively execute tasks.
- Executor pool size - number of threads that actively execute tasks.
- Queued task - the approximate number of tasks that are queued for execution
- Queued occupancy - the percent of the queue used by the tasks that is waining for execution.
Figure 3.9. The Executors panel, part 3
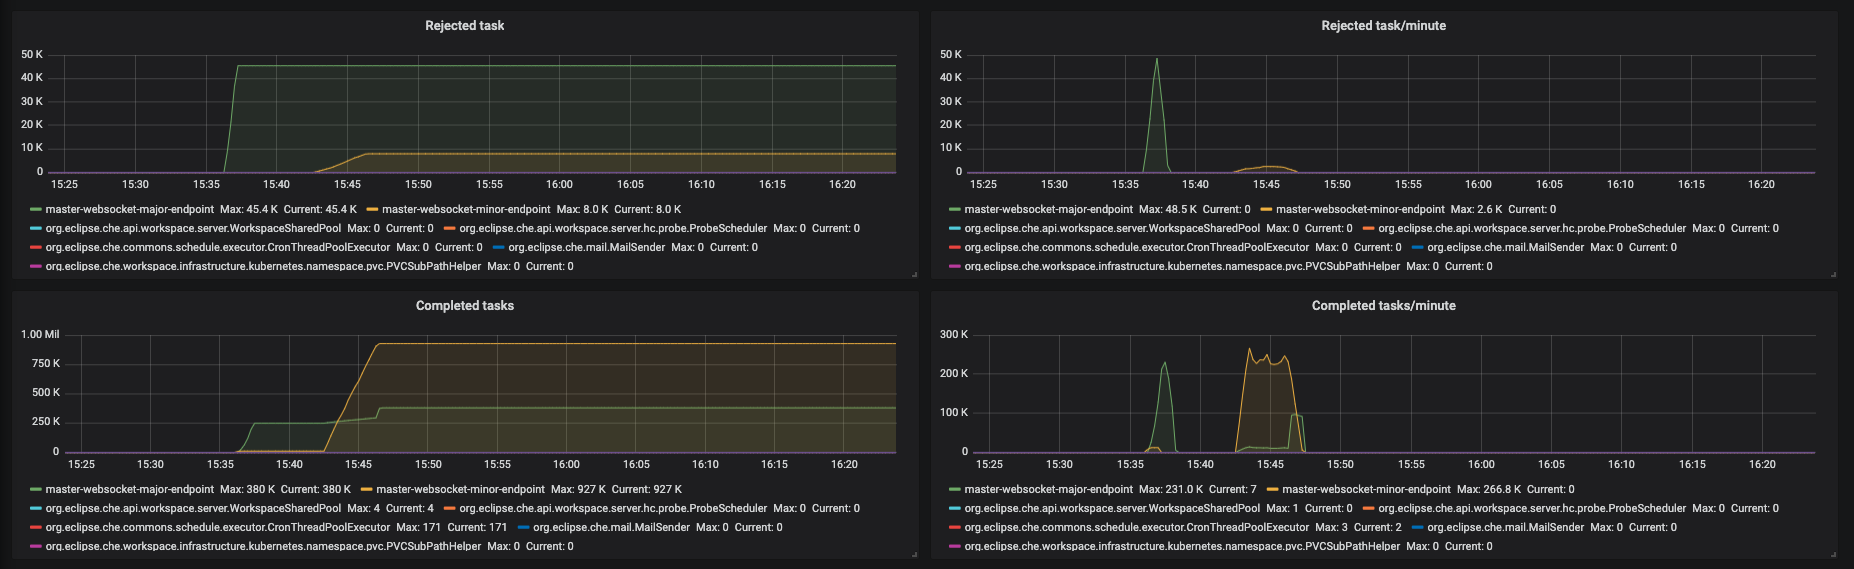
- Rejected task - the number of tasks that were rejected from execution.
- Rejected task/minute - the speed of task rejections
- Completed tasks - the number of completed tasks
- Completed tasks/minute - the speed of task execution
Figure 3.10. The Executors panel, part 4
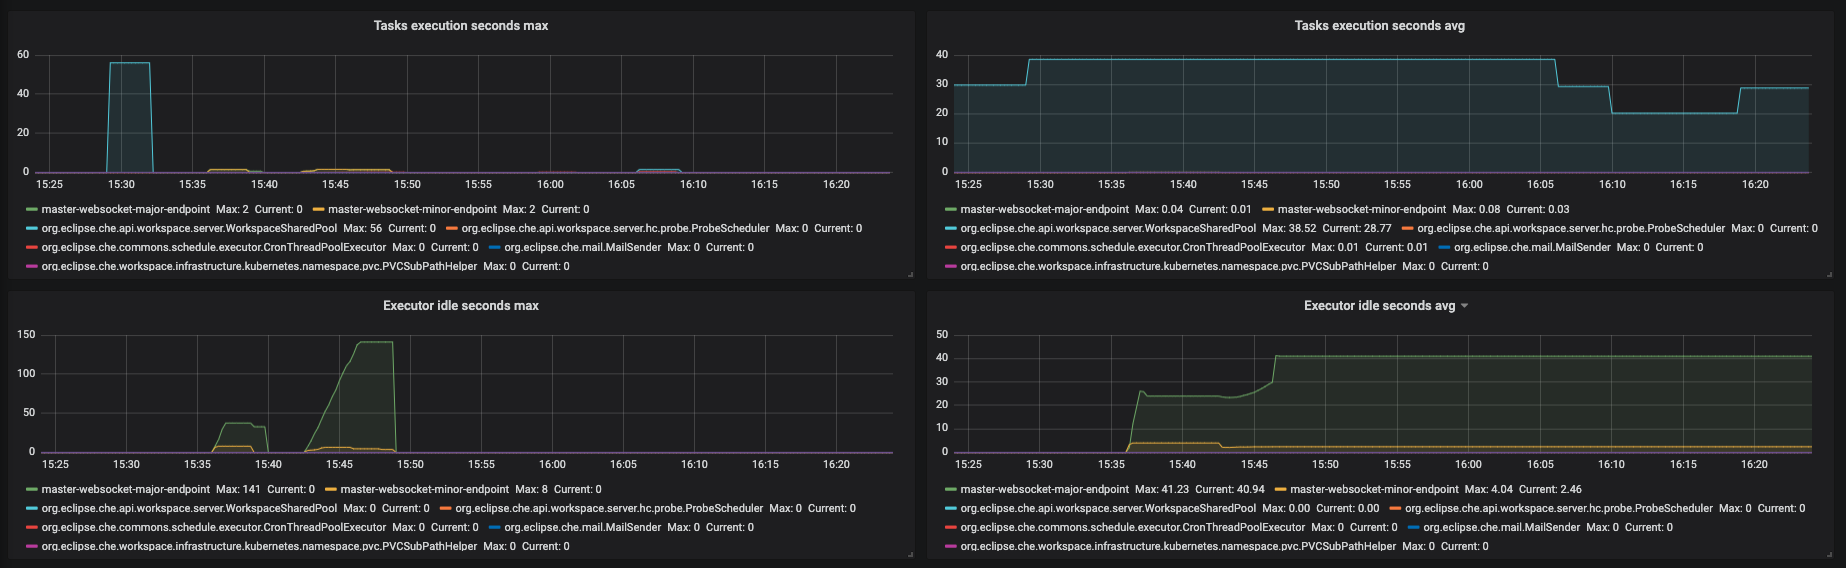
- Task execution seconds max - 5min moving maximum of task execution
- Tasks execution seconds avg - 1h moving average of task execution
- Executor idle seconds max - 5min moving maximum of executor idle state.
- Executor idle seconds avg - 1h moving average of executor idle state.
Figure 3.11. The Traces panel, part 1
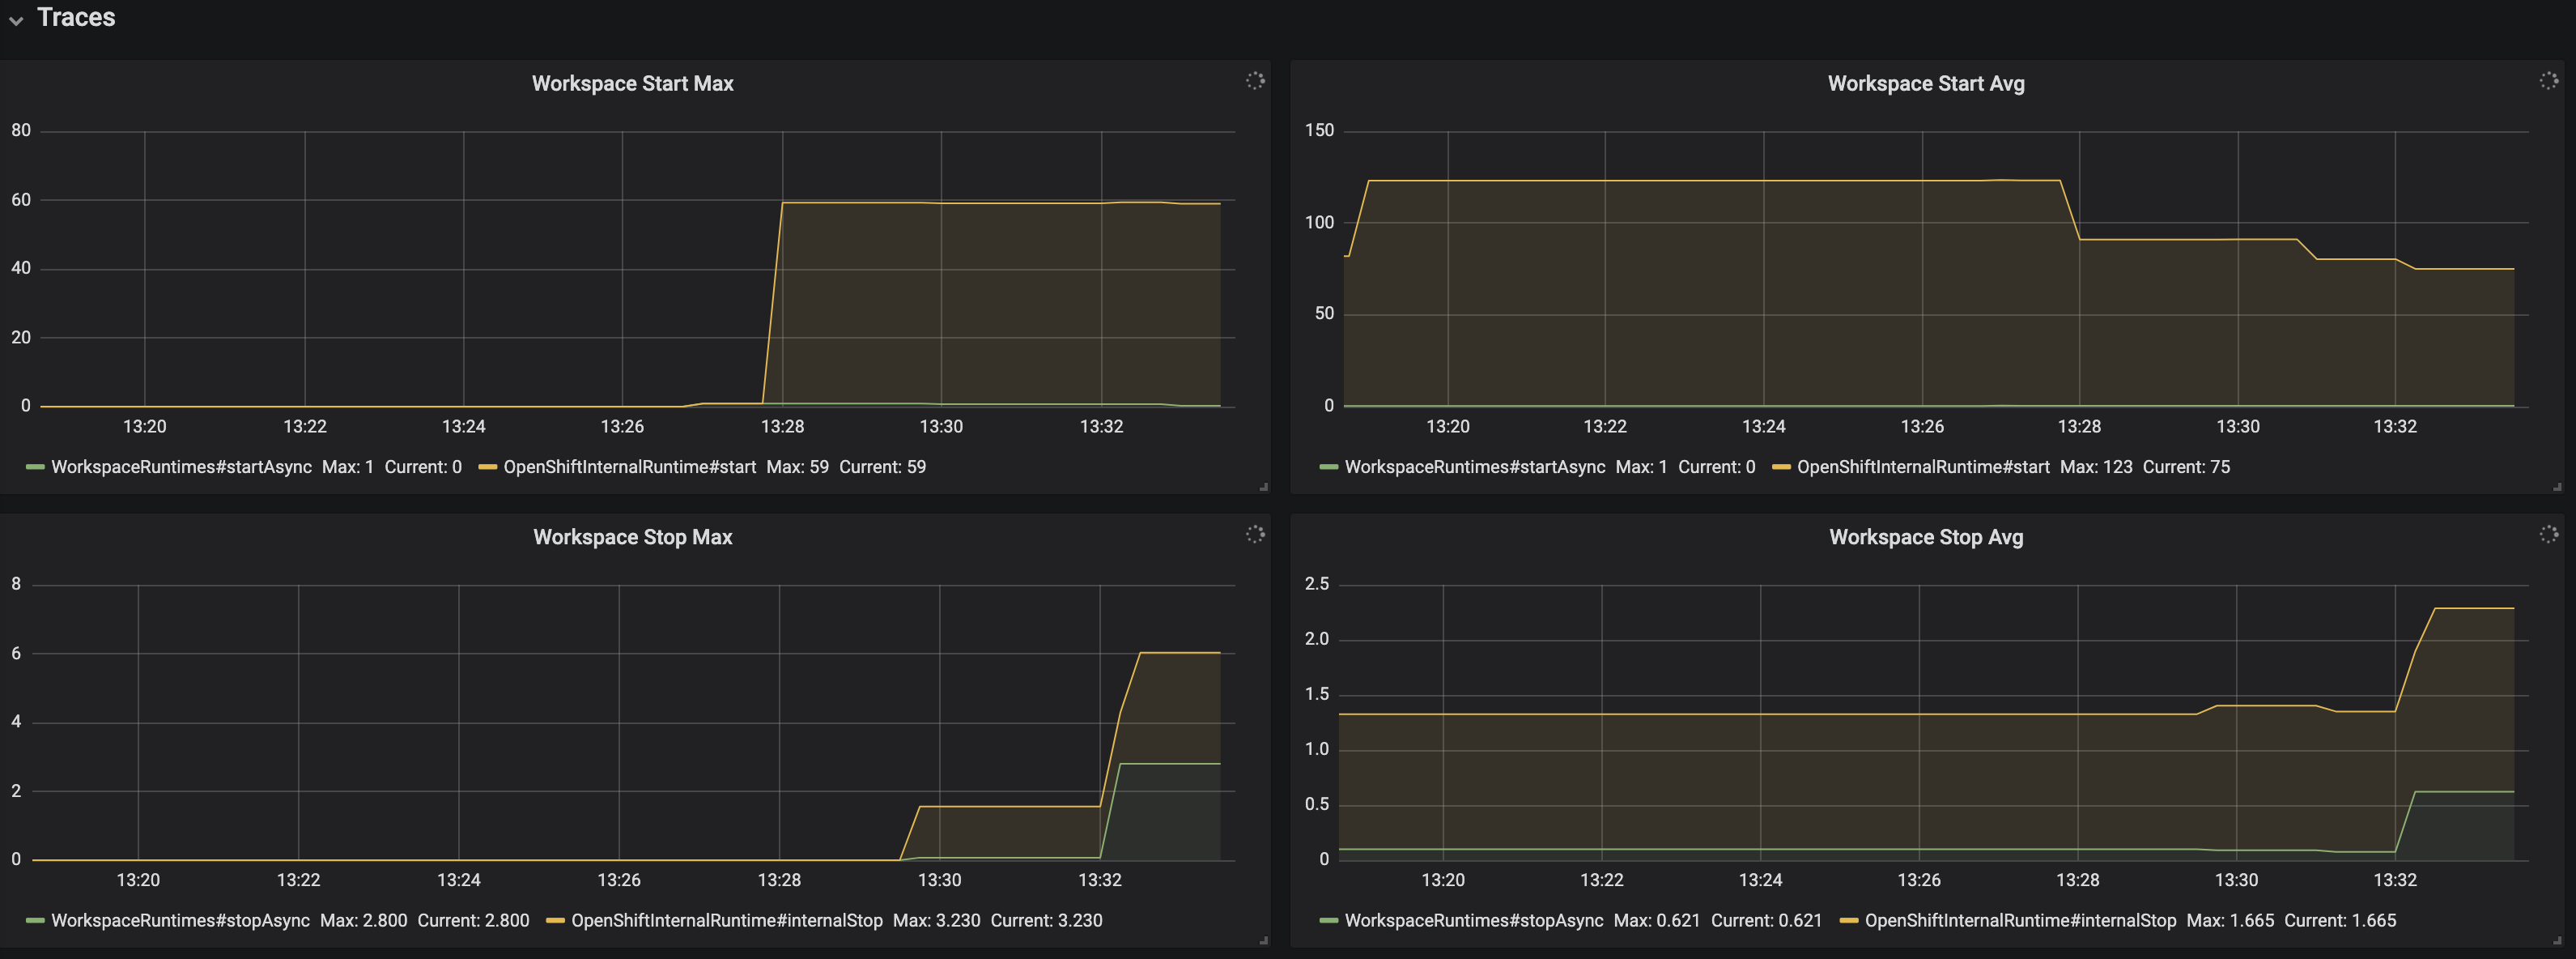
- Workspace start Max - maximum workspace start time
- Workspace start Avg - 1h moving average of the workspace start time components
- Workspace stop Max - maximum of workspace stop time
- Workspace stop Avg - 1h moving average of the workspace stop time components
Figure 3.12. The Traces panel, part 2

- OpenShiftInternalRuntime#start Max - maximum time of OpenShiftInternalRuntime#start operation
- OpenShiftInternalRuntime#start Avg - 1h moving average time of OpenShiftInternalRuntime#start operation
- Plugin Brokering Execution Max - maximum time of PluginBrokerManager#getTooling operation
- Plugin Brokering Execution Avg - 1h moving average of PluginBrokerManager#getTooling operation
Figure 3.13. The Traces panel, part 3
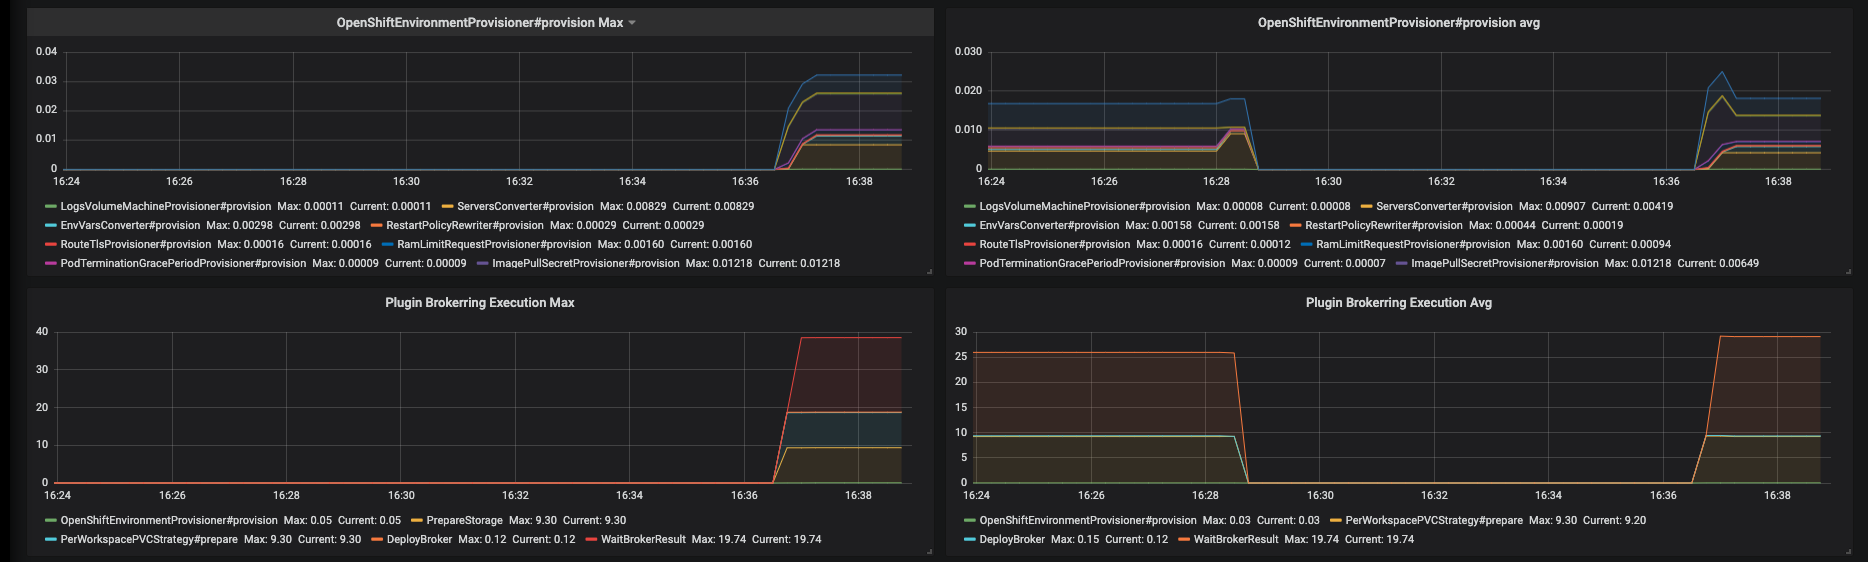
- OpenShiftEnvironmentProvisioner#provision Max - maximum time of OpenShiftEnvironmentProvisioner#provision operation
- OpenShiftEnvironmentProvisioner#provision Avg -1h moving average of OpenShiftEnvironmentProvisioner#provision operation
- Plugin Brokering Execution Max - maximum time of PluginBrokerManager#getTooling components execution time
- Plugin Brokering Execution Avg - 1h moving average of time of PluginBrokerManager#getTooling components execution time
Figure 3.14. The Traces panel, part 4
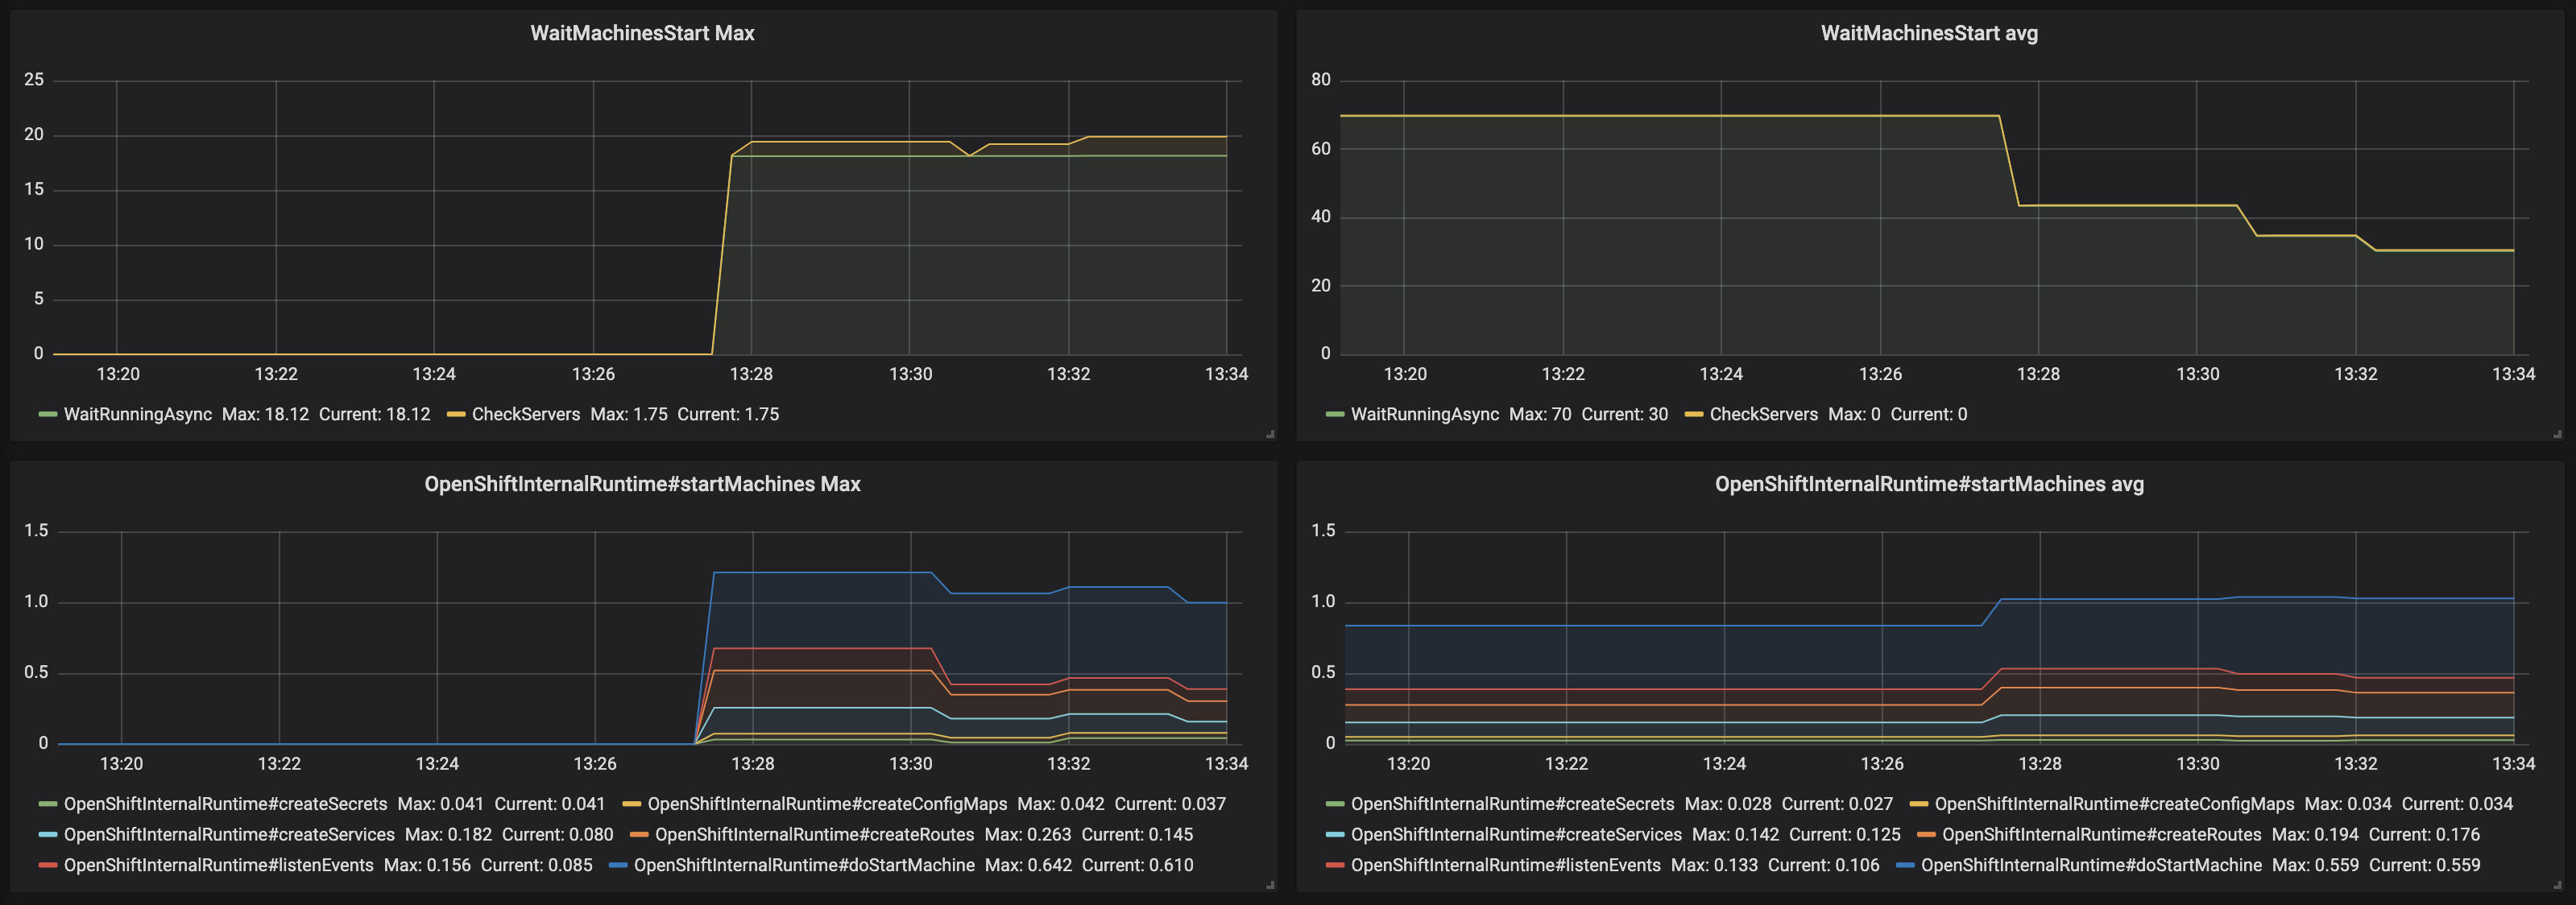
- WaitMachinesStart Max - maximim time of WaitMachinesStart operations
- WaitMachinesStart Avg - 1h moving average time of WaitMachinesStart operations
- OpenShiftInternalRuntime#startMachines Max - maximim time of OpenShiftInternalRuntime#startMachines operations
- OpenShiftInternalRuntime#startMachines Avg - 1h moving average of the time of OpenShiftInternalRuntime#startMachines operations
Figure 3.15. The Workspace detailed panel
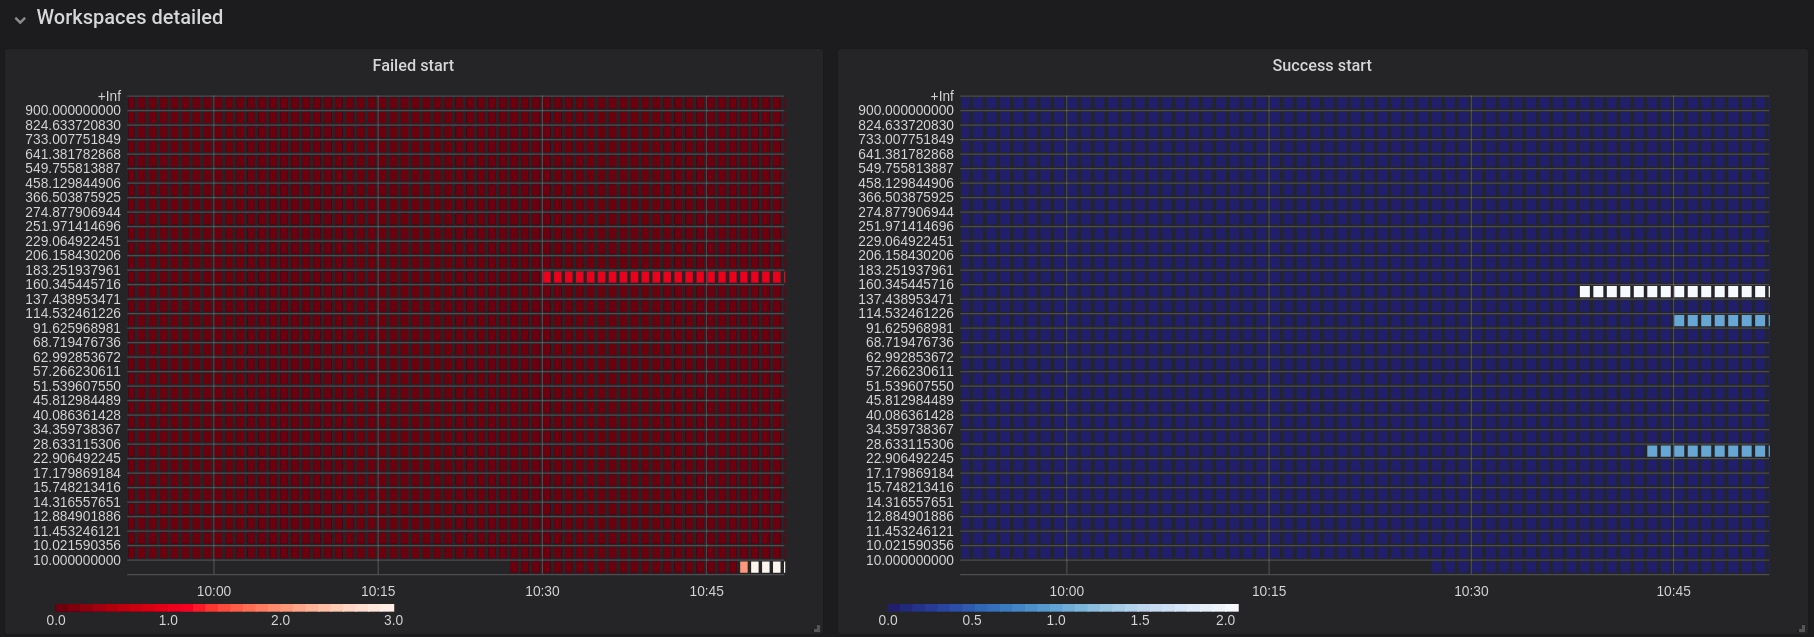
The Workspace Detailed panel contains heat maps, which illustrate the average time of workspace starts or fails. The row shows some period of time.
3.3.2.2. CodeReady Workspaces server JVM dashboard
Use case: JVM metrics of the CodeReady Workspaces server, such as JVM memory or classloading.
Figure 3.16. CodeReady Workspaces server JVM dashboard
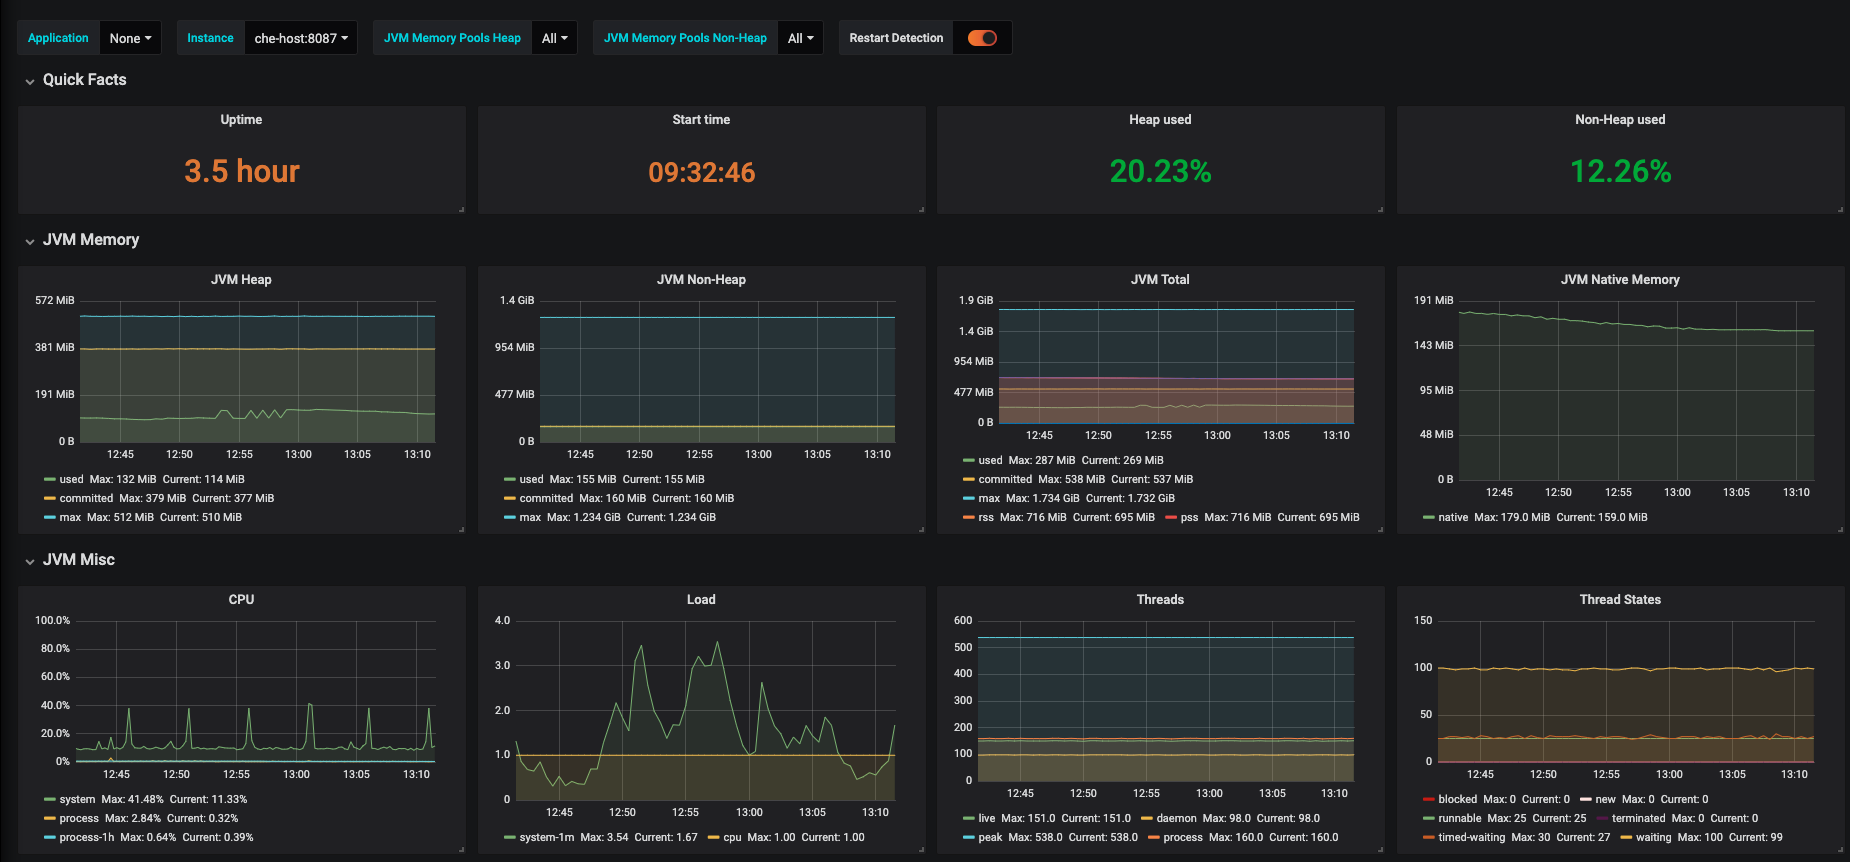
Figure 3.17. Quick Facts

Figure 3.18. JVM Memory
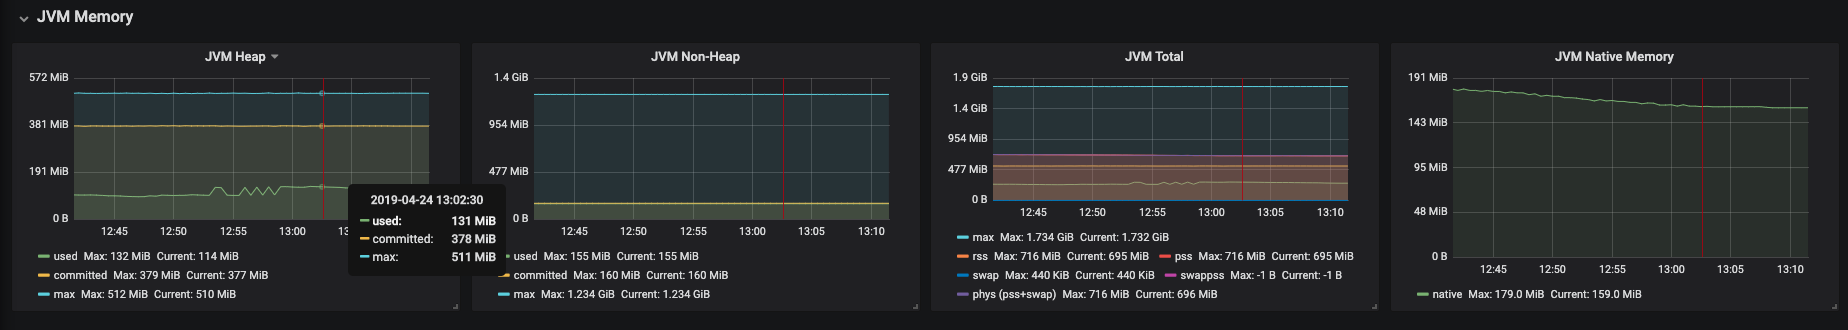
Figure 3.19. JVM Misc
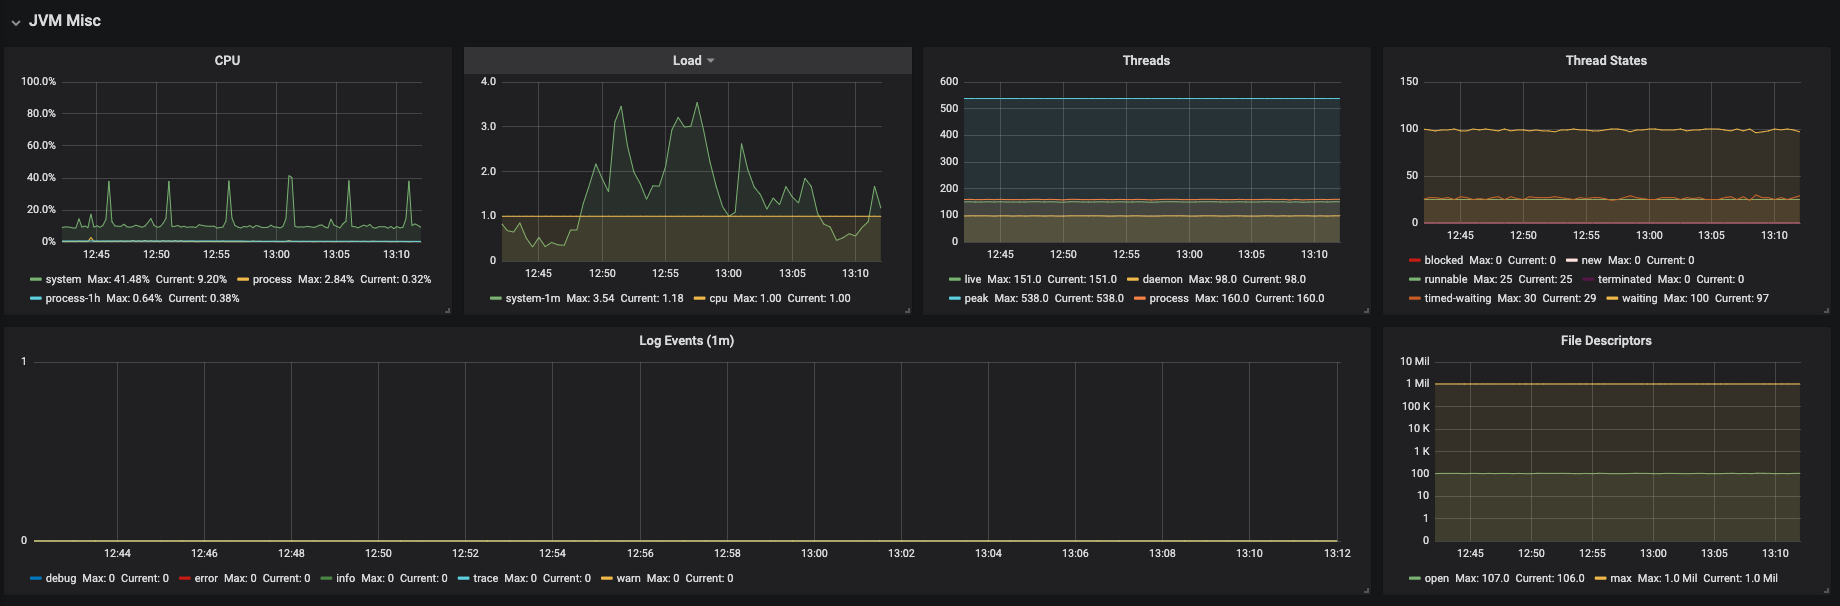
Figure 3.20. JVM Memory Pools (heap)
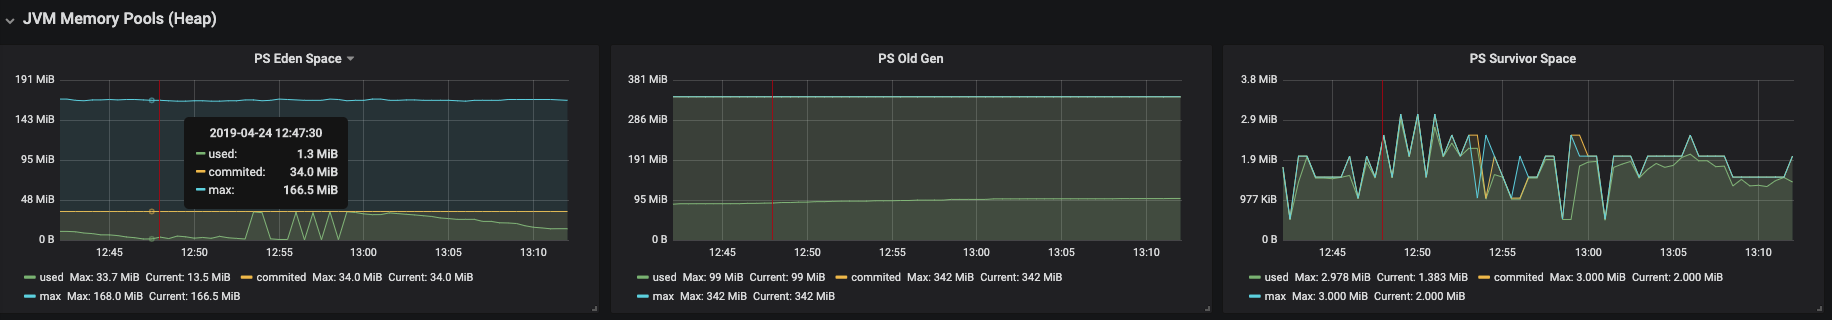
Figure 3.21. JVM Memory Pools (Non-Heap)
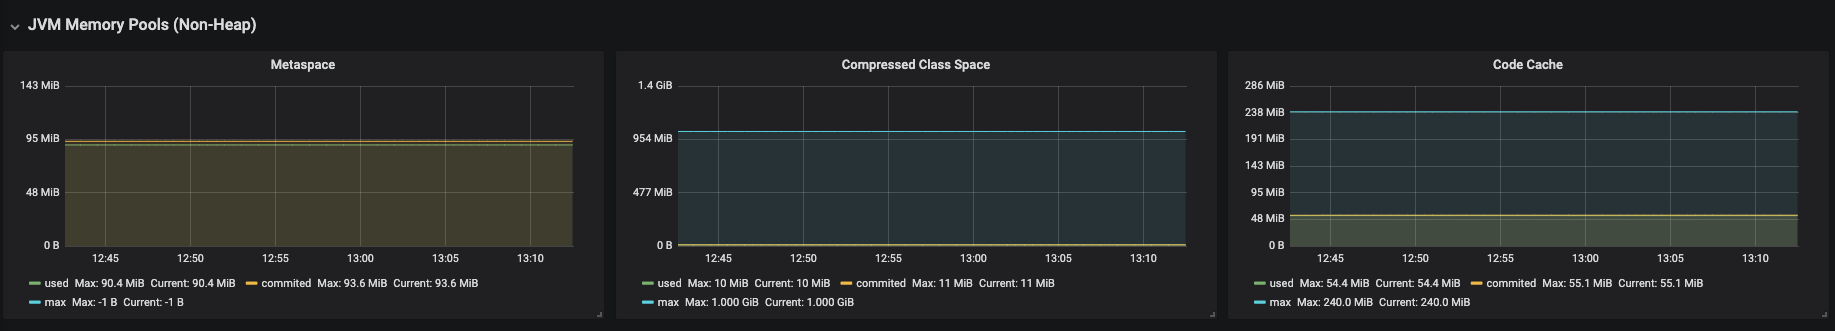
Figure 3.22. Garbage Collection
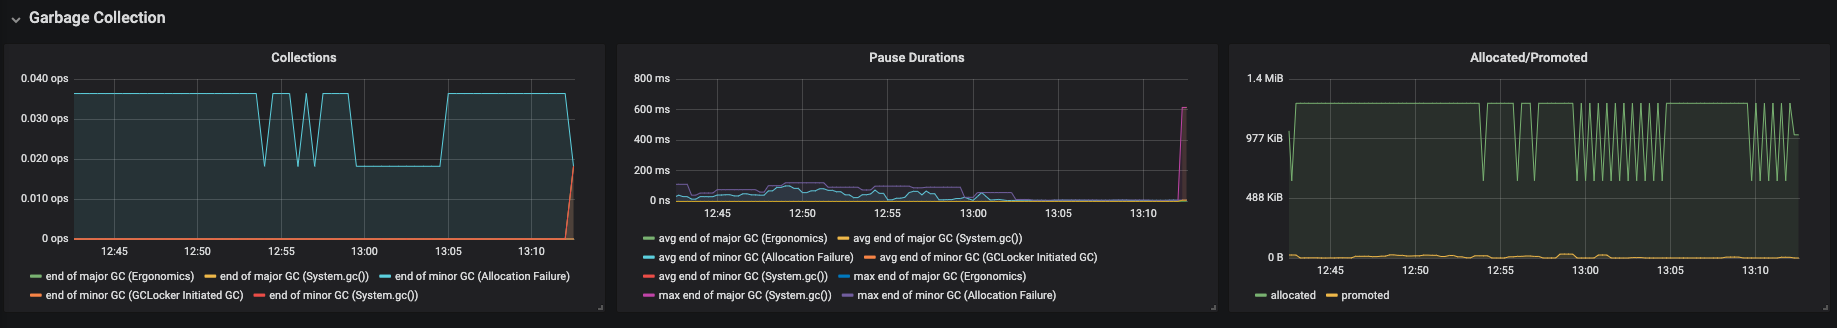
Figure 3.23. Classloading
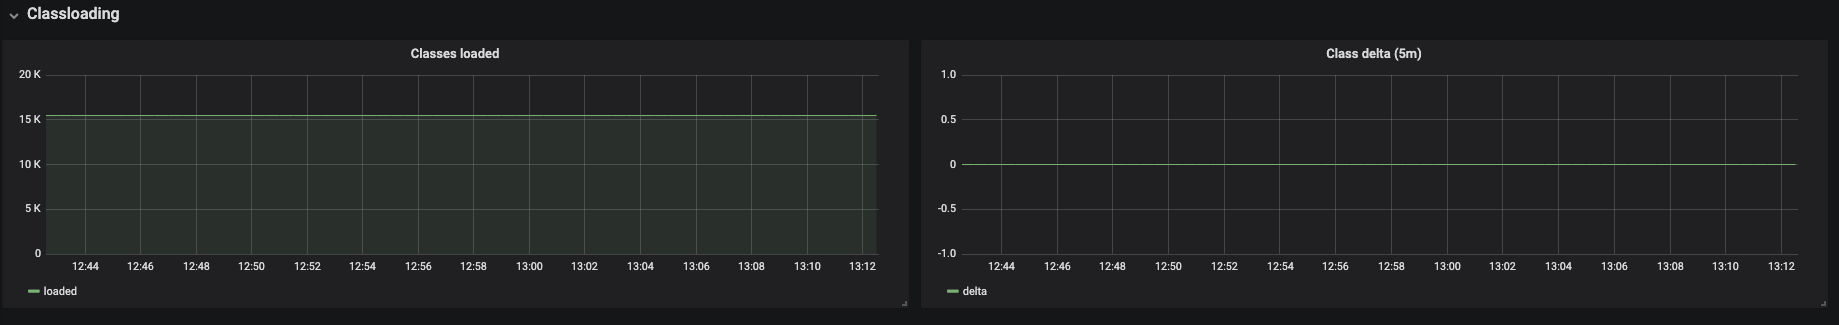
Figure 3.24. Buffer Pools

3.4. Developing Grafana dashboards
Grafana offers the possibility to add custom panels.
Procedure
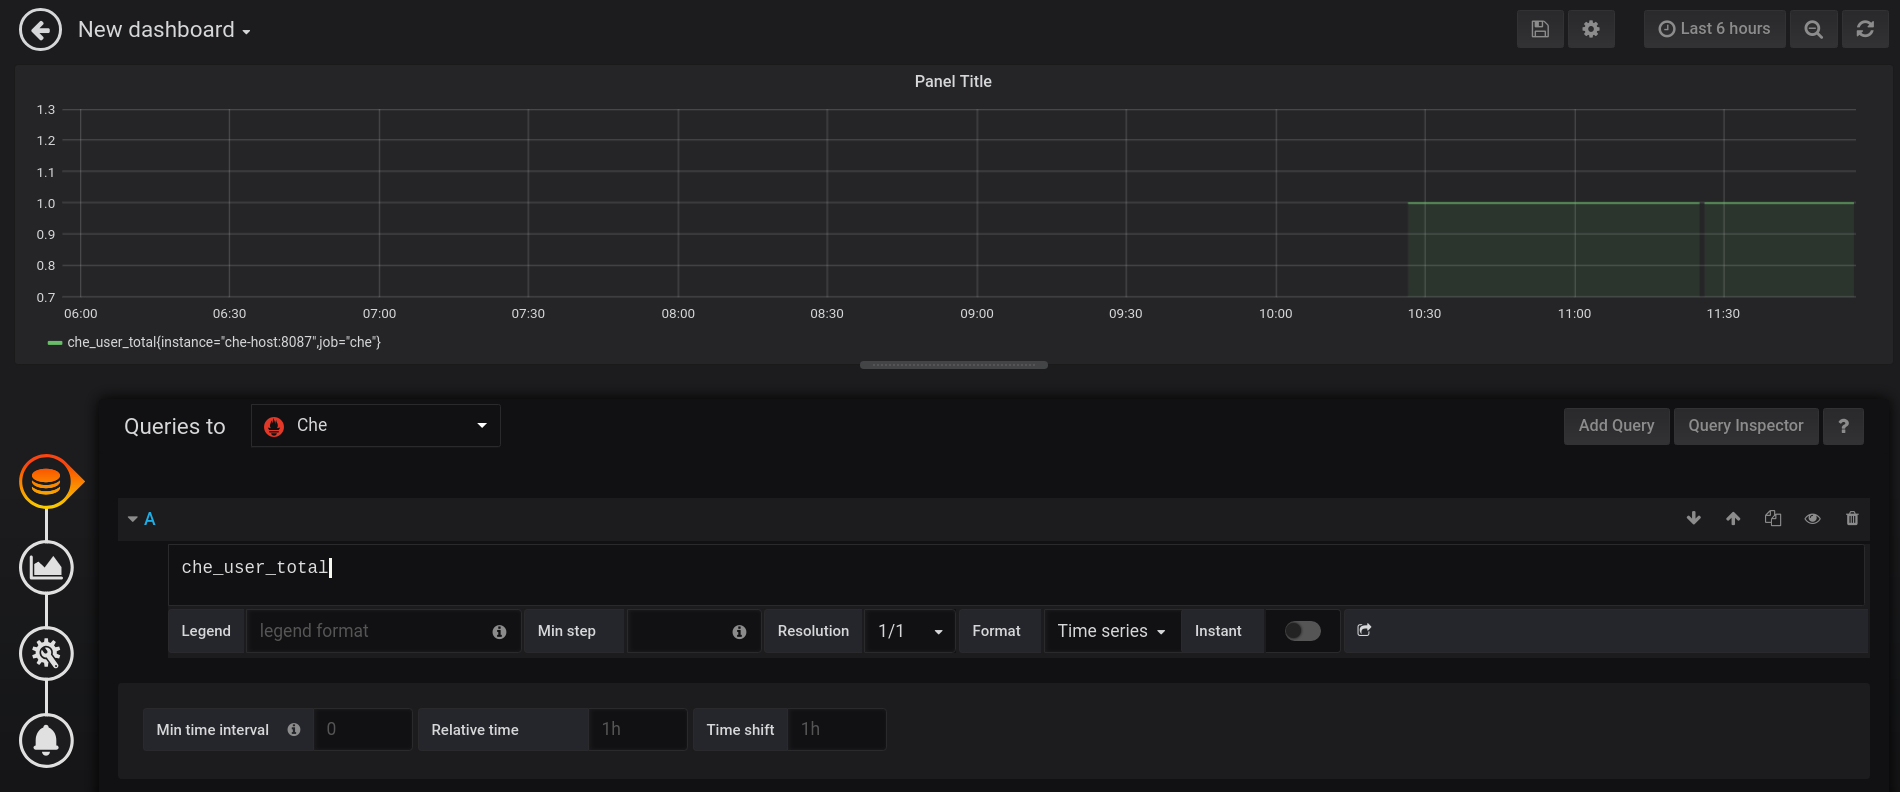
To add a custom panel, use the New dashboard view.
In the first section, define Queries to. Use the Prometheus Query Language to construct a specific metric, as well as to modify it with various aggregation operators.
Figure 3.25. New Grafana dashboard: Queries to
In the Visualisation section, choose a metric to be shown in the following visual in the form of a graph, gauge, heatmap, or others.
Figure 3.26. New Grafana dashboard: Visualization
- Save changes to the dashboard by clicking the button, and copy and paste the JSON code to the deployment.
Load changes in the configuration of a running Grafana deployment. First remove the deployment:
oc process -f che-monitoring.yaml | oc delete -f -
$ oc process -f che-monitoring.yaml | oc delete -f -Copy to Clipboard Copied! Toggle word wrap Toggle overflow Then redeploy your Grafana with the new configuration:
oc process -f che-monitoring.yaml | oc apply -f - | oc rollout latest grafana
$ oc process -f che-monitoring.yaml | oc apply -f - | oc rollout latest grafanaCopy to Clipboard Copied! Toggle word wrap Toggle overflow

3.5. Extending CodeReady Workspaces monitoring metrics
There are two major modules for metrics:
-
che-core-metrics-core— contains core metrics module -
che-core-api-metrics— contains metrics that are dependent on core CodeReady Workspaces components, such as workspace or user managers
Procedure
To create a metric or a group of metrics, you need a class that extends the MeterBinder class. This allows to register the created metric in the overriden bindTo(MeterRegistry registry) method.
The following is an example of a metric that has a function that supplies the value for it:
Example metric
Alternatively, the metric can be stored with a reference and updated manually in some other place in the code.
Additional resources
For more information about the types of metrics and naming conventions, visit Prometheus documentation:
Chapter 4. Tracing CodeReady Workspaces
Tracing helps gather timing data to troubleshoot latency problems in microservice architectures and helps to understand a complete transaction or workflow as it propagates through a distributed system. Every transaction may reflect performance anomalies in an early phase when new services are being introduced by independent teams.
Tracing the CodeReady Workspaces application may help analyse the execution of various operations, such as workspace creations, workspace startup, breaking down the duration of sub-operations executions, helping finding bottlenecks and improve the overall state of the platform.
Tracers live in applications. They record timing and metadata about operations that take place. They often instrument libraries, so that their use is transparent to users. For example, an instrumented web server records when it received a request and when it sent a response. The trace data collected is called a span. A span has a context that contains information such as trace and span identifiers and other kinds of data that can be propagated down the line.
4.1. Tracing API
CodeReady Workspaces utilizes Opentracing API - a vendor-neutral framework for instrumentation. This means that if a developer wants to try a different tracing backend, then instead of repeating the whole instrumentation process for the new distributed tracing system, the developer can simply change the configuration of the tracer backend.
4.2. Tracing backend
By default, CodeReady Workspaces uses Jaeger as the tracing backend. Jaeger was inspired by Dapper and OpenZipkin, and it is a distributed tracing system released as open source by Uber Technologies. Jaeger extends a more complex architecture for a larger scale of requests and performance.
4.3. Enabling CodeReady Workspaces metrics collections
Prerequisites
- Installed Jaeger v1.12.0 or above. See instructions at Get up and running with Jaeger in your local environment.
Procedure
Enable the following environment variables for CodeReady Workspaces deployment:
Copy to Clipboard Copied! Toggle word wrap Toggle overflow
Additional resources
- List of all Jaeger client environment variables
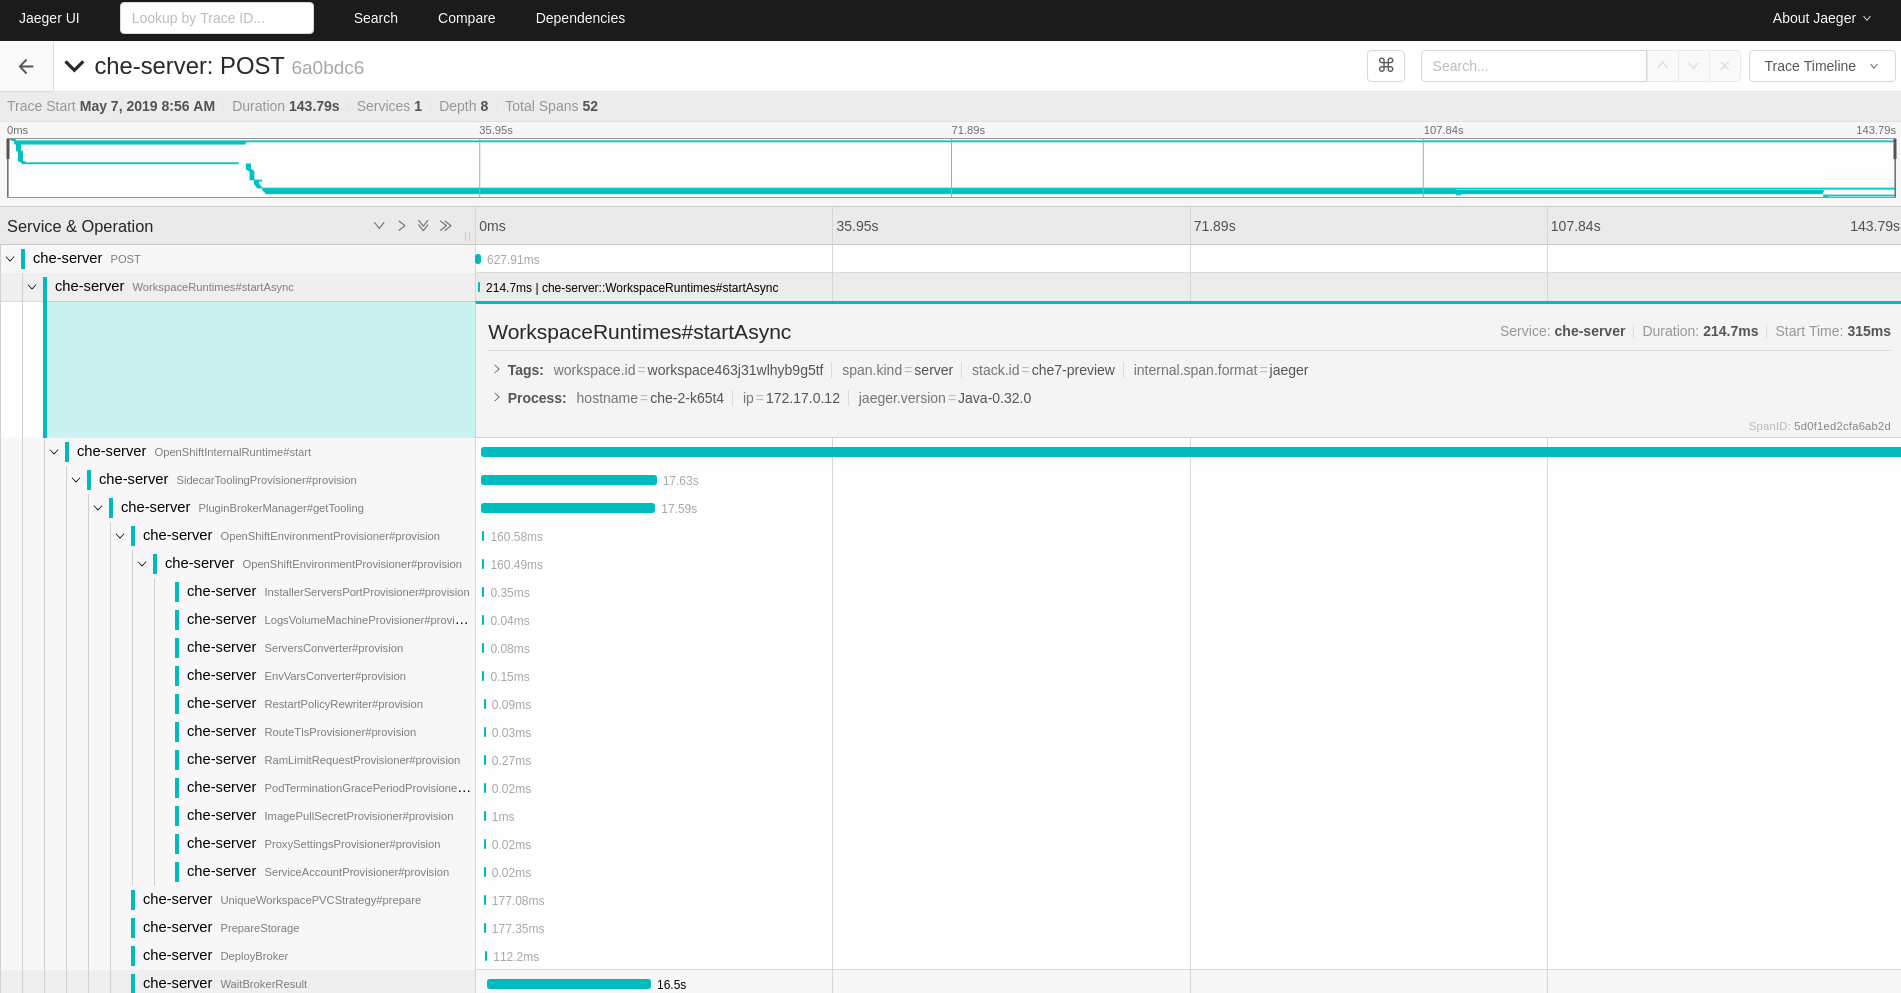
4.4. Viewing CodeReady Workspaces traces in Jaeger UI
This section demonstrates how to utilize the Jaeger UI to overview traces of CodeReady Workspaces operations.
Procedure
In this example, the CodeReady Workspaces instance has been running for some time and one workspace start has occured.
To inspect the trace of the workspace start:
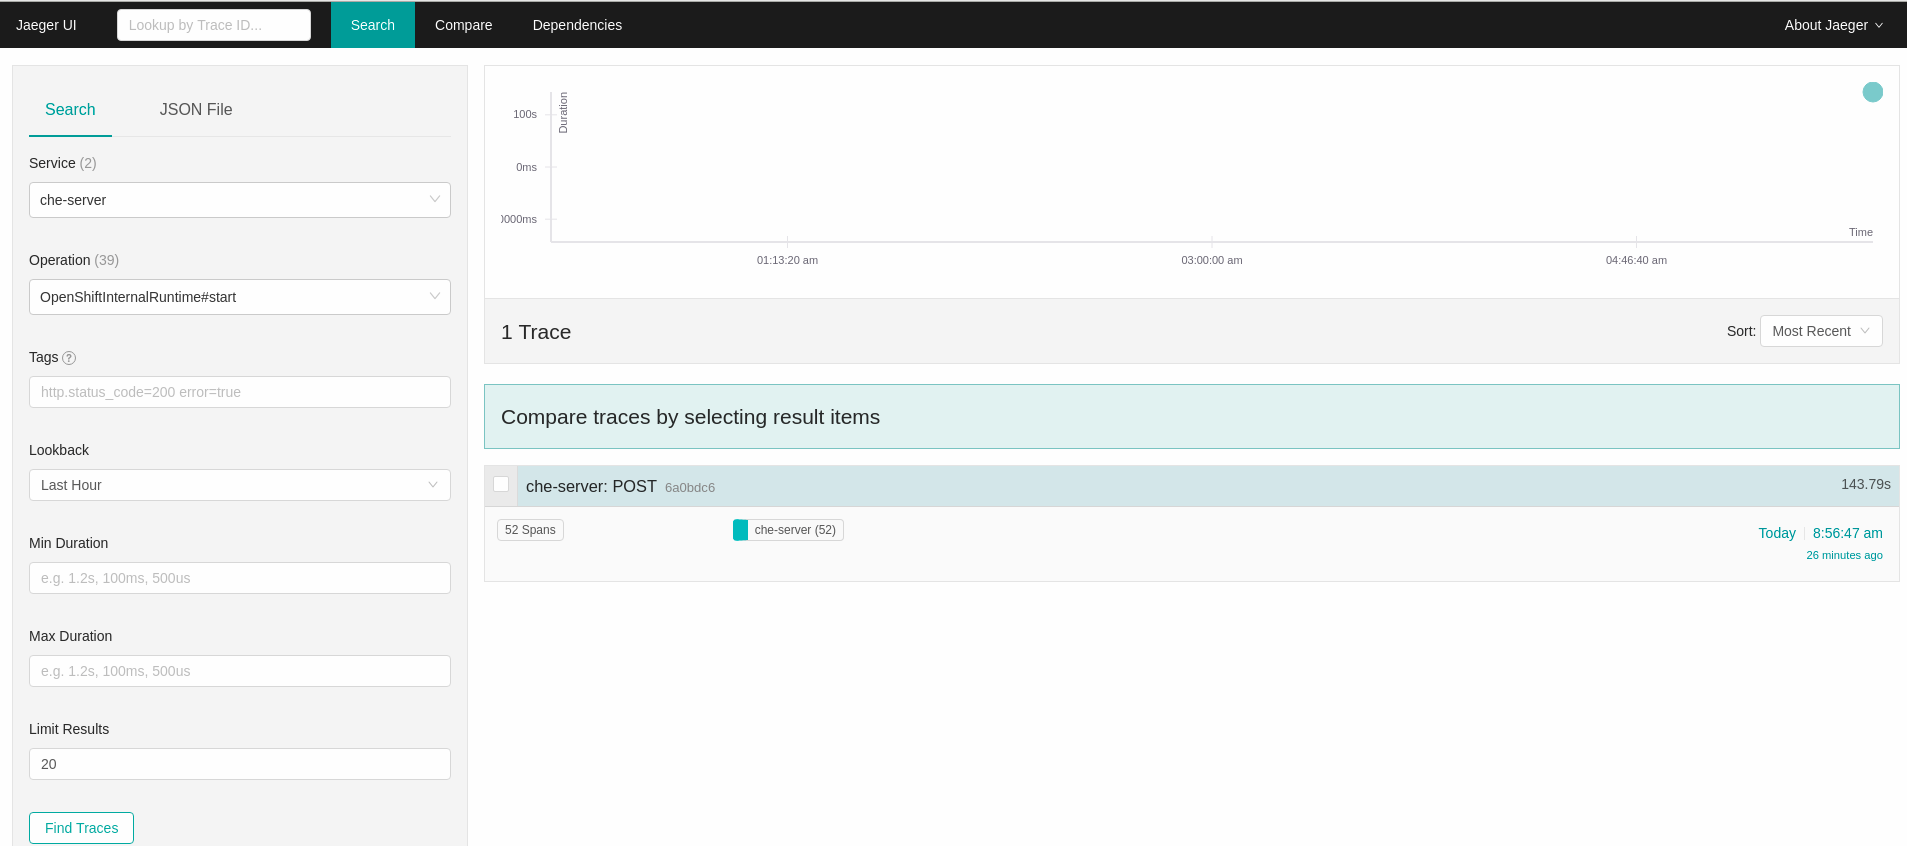
In the Search panel on the left, filter spans by the operation name (span name), tags, or time and duration.
Figure 4.1. Using Jaeger UI to trace CodeReady Workspaces
Select the trace to expand it and show the tree of nested spans, as well as additional information about the highlighted span, such as tags or durations.
Figure 4.2. Expanded tracing tree
4.5. CodeReady Workspaces tracing codebase overview and extension guide
The core of the tracing implementation for CodeReady Workspaces is in the che-core-tracing-core and che-core-tracing-web modules.
All HTTP requests to the tracing API have their own trace. This is done by TracingFilter from the OpenTracing library, which is bound for the whole server application. Adding a @Traced annotation to methods causes the TracingInterceptor to add tracing spans for them.
4.5.1. Tagging
Spans may contain standard tags, such as operation name, span origin, error, as well as others that may help users with querying and filtering spans. Workspace-related operations (such as starting or stopping workspaces) have additional tags, including userId, workspaceId, and stackId. Spans created by TracingFilter also have an HTTP status code tag.
Declaring tags in a traced method is done statically by setting fields from the TracingTags class:
TracingTags.WORKSPACE_ID.set(workspace.getId());
TracingTags.WORKSPACE_ID.set(workspace.getId());
TracingTags is a class where all commonly used tags are declared, as respective AnnotationAware tag implementations.
Additional resources
For more information about how to use Jaeger UI, visit Jaeger documentation: Jaeger Getting Started Guide.
Chapter 5. Securing CodeReady Workspaces
This section describes all aspects of user authentication, types of authentication, and permissions models on the CodeReady Workspaces server and its workspaces.
5.1. Authenticating users
This document covers all aspects of user authentication in Red Hat CodeReady Workspaces, both on the CodeReady Workspaces server and in workspaces. This includes securing all REST API endpoints, WebSocket or JSON RPC connections, and some web resources.
All authentication types use the JWT open standard as a container for transferring user identity information. In addition, CodeReady Workspaces server authentication is based on the OpenID Connect protocol implementation, which is provided by default by Keycloak.
Authentication in workspaces implies the issuance of self-signed per-workspace JWT tokens and their verification on a dedicated service based on JWTProxy.
5.1.1. Authenticating to the CodeReady Workspaces server
5.1.1.1. Authenticating to the CodeReady Workspaces server using OpenID
OpenID authentication on the CodeReady Workspaces server implies the presence of an external OpenID Connect provider and has the following main steps:
- Authenticate the user through a JWT token that is retrieved from an HTTP request or, in case of a missing or invalid token, redirect the user to the Keycloak login page.
- Send authentication tokens in an Authorization header. In limited cases, when it is not possible to use the Authorization header, the token can be sent in the token query parameter. Example: OAuth authentication initialization.
-
Compose an internal
subjectobject that represents the current user inside the CodeReady Workspaces server code.
The only supported and tested OpenID provider is Keycloak.
Procedure
To authenticate to the CodeReady Workspaces server using OpenID authentication:
-
Request the OpenID settings service where clients can find all the necessary URLs and properties of the OpenId provider, such as
jwks.endpoint,token.endpoint,logout.endpoint,realm.name, orclient_idreturned in the JSON format. The service URL is
<che.host>:<che.port>/api/keycloak/settings, and it is only available in the CodeReady Workspaces multi-user mode. The presence of the service in the URL confirms that the authentication is enabled in the current deployment.Example output:
Copy to Clipboard Copied! Toggle word wrap Toggle overflow The service allows downloading the JavaScript client library to interact with the provider using the
<che.host>:<che.port>/api/keycloak/OIDCKeycloak.jsURL.-
Redirect the user to the appropriate provider’s login page with all the necessary parameters, including
client_idand the return redirection path. This can be done with any client library (JS or Java). -
When the user is logged in to the provider, the client side-code is obtained, and the JWT token has validated the token, the creation of the
subjectbegins.
The verification of the token signature occurs in two main steps:
Authentication: The token is extracted from the Authorization header or from the
tokenquery parameter and is parsed using the public key retrieved from the provider. In case of expired, invalid, or malformed tokens, a403error is sent to the user. The use of the query parameter should be minimised because its support may be limited or removed in future versions.If the validation is successful, the parsed form of the token is passed to the environment initialization step:
Environment initialization: The filter extracts data from the JWT token claims, creates the user in the local database if it is not yet present, and constructs the
subjectobject and sets it into the per-request EnvironmentContext object, which is statically accessible everywhere.If the request was made using only a machine token, the following single authentication filter is used:
org.eclipse.che.multiuser.machine.authentication.server.MachineLoginFilter: The filter finds the user that the
userIdtoken belongs to, retrieves the user instance, and sets the principal to the session. The CodeReady Workspaces server-to-server requests are performed using a dedicated request factory that signs every request with the current subject token obtained from theEnvironmentContextobject.
Providing user-specific data
Since Keycloak may store user-specific information (first and last name, phone number, job title), there is a special implementation of the ProfileDao that can provide this data to consumers. The implementation is read-only, so users cannot perform create and update operations.
5.1.1.1.1. Obtaining the token from credentials through Keycloak
Clients that cannot run JavaScript or other clients (such as command-line clients or Selenium tests) must request the authorization token directly from Keycloak.
To obtain the token, send a request to the token endpoint with the username and password credentials. This request can be schematically described as the following cURL request:
curl --data "grant_type=password&client_id=<client_name>&username=<username>&password=<password>" \
  http://<keyckloak_host>:5050/auth/realms/<realm_name>/protocol/openid-connect/token
$ curl --data "grant_type=password&client_id=<client_name>&username=<username>&password=<password>" \
  http://<keyckloak_host>:5050/auth/realms/<realm_name>/protocol/openid-connect/token
The CodeReady Workspaces dashboard uses a customized Keycloak login page and an authentication mechanism based on grant_type=authorization_code. It is a two-step authentication process:
- Logging in and obtaining the authorization code.
- Obtaining the token using this authorization code.
5.1.1.1.2. Obtaining the token from the OpenShift token through Keycloak
When CodeReady Workspaces has been installed on OpenShift using the Operator, and the OpenShift OAuth integration has been enabled (it is by default), then the CodeReady Workspaces authentication token of a user can also be retrieved from the user OpenShift token.
To do this, send a request to the token endpoint that can be schematically described as the following cURL request:
The default values for <openshift_identity_provider_name> are:
-
On OpenShift 3.11:
openshift-v3 -
On OpenShift 4.x:
openshift-v4
<user_openshift_token> is the token retrieved by the end-user with the command:
oc whoami --show-token
$ oc whoami --show-tokenBefore using this token exchange feature for an end user, the end user should have logged in at least once interactively to the CodeReady Workspaces Dashboard through the OpenShift login page. This is required to properly link OpenShift and Keycloak user accounts, and set the required user profile information (email, first and last names).
5.1.1.2. Authenticating to the CodeReady Workspaces server using other authentication implementations
This procedure describes how to use an OIDC authentication implementation other than Keycloak.
Procedure
-
Update the authentication configuration parameters that are stored in the
multiuser.propertiesfile (such as client ID, authentication URL, realm name). -
Write a single filter or a chain of filters to validate tokens, create the user in the CodeReady Workspaces dashboard, and compose the
subjectobject. - If the new authorization provider supports the OpenID protocol, use the OIDC JS client library available at the settings endpoint because it is decoupled from specific implementations.
- If the selected provider stores additional data about the user (first and last name, job title), it is recommended to write a provider-specific ProfileDao implementation that provides this information.
5.1.1.3. Authenticating to the CodeReady Workspaces server using OAuth
For easy user interaction with third-party services, the CodeReady Workspaces server supports OAuth authentication. OAuth tokens are also used for GitHub-related plug-ins.
OAuth authentication has two main flows: internal and external, which is based on the Keycloak brokering mechanism. The following are the two main OAuth API implementations:
- org.eclipse.che.security.oauth.EmbeddedOAuthAPI, for the internal flow.
- org.eclipse.che.multiuser.keycloak.server.oauth2.DelegatedOAuthAPI, for the external flow.
Use the che.oauth.service_mode=<embedded|delegated> configuration property to switch between the two implementations. The main REST endpoint in the OAuth API is org.eclipse.che.security.oauth.OAuthAuthenticationService, which contains:
- An authenticate method to start the OAuth authentication flow
- A callback method to process callbacks from the provider
- A token to retrieve the current user’s OAuth token
These methods refer to the currently activated embedded or delegated OAuthAPI that does the underlying operations, including finding the appropriate authenticator, initializing the login process, and user forwarding.
5.1.1.4. Using Swagger or REST clients to execute queries
The user’s Keycloak token is used to execute queries to the secured API on the user’s behalf through REST clients. A valid token must be attached as the Request header or the ?token=$token query parameter.
Access the CodeReady Workspaces Swagger interface at http://che_host:8080/swagger. The user must be signed in through Keycloak, so that the access token is included in the Request header.
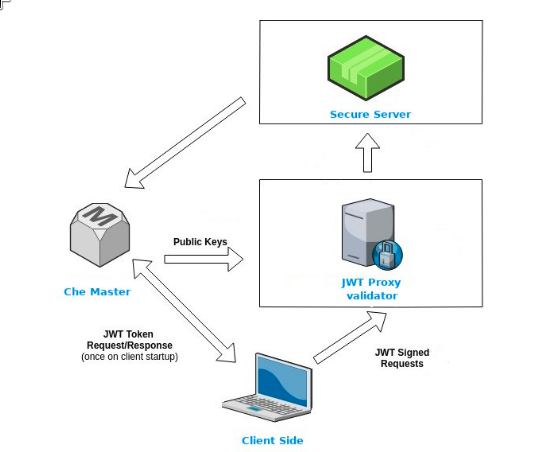
5.1.2. Authenticating in a workspace
Workspace containers may contain services that must be protected with authentication. Such protected services are called secure. For this purpose, a machine authentication mechanism should be used. Machine tokens avoid the need to pass Keycloak tokens to workspace containers (which can be insecure). Also, Keycloak tokens may have a relatively shorter lifetime and require periodic renewals or refreshes, which is difficult to manage and keep in sync with the same user session tokens on clients.
Figure 5.1. Authentication inside a workspace
5.1.2.1. Creating secure servers
To create secure servers in workspaces, set the secure attribute of the endpoint to true in the dockerimage type component in the devfile.
5.1.2.2. Workspace JWT token
Workspace tokens are JSON web tokens (JWT) that contain the following information in their claims:
-
uid: The ID of the user who owns this token -
uname: The name of the user who owns this token -
wsid: The ID of a workspace which can be queried with this token
Every user is provided with a unique personal token for each workspace. The structure of a token and the signature are different than they are in Keycloak. The following is an example token view:
The SHA-256 cipher with the RSA algorithm is used for signing machine tokens. It is not configurable. Also, there is no public service that distributes the public part of the key pair with which the token is signed.
5.1.2.3. Machine token validation
The validation of machine tokens is performed using a dedicated per-workspace service with JWTProxy running on it in a separate pod. When the workspace starts, this service receives the public part of the SHA key from the CodeReady Workspaces server. A separate verification endpoint is created for each secure server. When traffic comes to that endpoint, JWTProxy tries to extract the token from the cookies or headers and validates it using the public-key part.
To query the CodeReady Workspaces server, a workspace server can use the machine token provided in the CHE_MACHINE_TOKEN environment variable. This token is the user’s who starts the workspace. The scope of such requests is restricted to the current workspace only. The list of allowed operations is also strictly limited.
5.2. Authorizing users
User authorization in CodeReady Workspaces is based on the permissions model. Permissions are used to control the allowed actions of users and establish a security model. Every request is verified for the presence of the required permission in the current user subject after it passes authentication. You can control resources managed by CodeReady Workspaces and allow certain actions by assigning permissions to users.
Permissions can be applied to the following entities:
- Workspace
- Organization
- System
All permissions can be managed using the provided REST API. The APIs are documented using Swagger at [{host}/swagger/#!/permissions].
5.2.1. workspace permissions
The user who creates a workspace is the workspace owner. By default, the workspace owner has the following permissions: read, use, run, configure, setPermissions, and delete. Workspace owners can invite users into the workspace and control workspace permissions for other users.
The following permissions are associated with workspaces:
| Permission | Description |
|---|---|
| read | Allows reading the workspace configuration. |
| use | Allows using a workspace and interacting with it. |
| run | Allows starting and stopping a workspace. |
| configure | Allows defining and changing the workspace configuration. |
| setPermissions | Allows updating the workspace permissions for other users. |
| delete | Allows deleting the workspace. |
5.2.2. CodeReady Workspaces organization permissions
An CodeReady Workspaces organization is a named set of users. The following permissions are applicable to organizations:
| Permission | Description |
|---|---|
| update | Allows editing of the organization settings and information. |
| delete | Allows deleting an organization. |
| manageSuborganizations | Allows creating and managing sub-organizations. |
| manageResources | Allows redistribution of an organization’s resources and defining the resource limits. |
| manageWorkspaces | Allows creating and managing all the organization’s workspaces. |
| setPermissions | Allows adding and removing users and updating their permissions. |
5.2.3. CodeReady Workspaces system permissions
CodeReady Workspaces system permissions control aspects of the whole CodeReady Workspaces installation. The following permissions are applicable to the system:
| Permission | Description |
|---|---|
| manageSystem | Allows control of the system, workspaces, and organizations. |
| setPermissions | Allows updating the permissions for users on the system. |
| manageUsers | Allows creating and managing users. |
| monitorSystem | Allows accessing endpoints used for monitoring the state of the server. |
All system permissions are granted to the administrative user who is configured in the CHE_SYSTEM_ADMIN__NAME property (the default is admin). The system permissions are granted when the CodeReady Workspaces server starts. If the user is not present in the CodeReady Workspaces user database, it happens after the first user’s login.
5.2.4. manageSystem permission
Users with the manageSystem permission have access to the following services:
| Path | HTTP Method | Description |
|---|---|---|
| /resource/free/ | GET | Get free resource limits. |
| /resource/free/{accountId} | GET | Get free resource limits for the given account. |
| /resource/free/{accountId} | POST | Edit free resource limit for the given account. |
| /resource/free/{accountId} | DELETE | Remove free resource limit for the given account. |
| /installer/ | POST | Add installer to the registry. |
| /installer/{key} | PUT | Update installer in the registry. |
| /installer/{key} | DELETE | Remove installer from the registry. |
| /logger/ | GET | Get logging configurations in the CodeReady Workspaces server. |
| /logger/{name} | GET | Get configurations of logger by its name in the CodeReady Workspaces server. |
| /logger/{name} | PUT | Create logger in the CodeReady Workspaces server. |
| /logger/{name} | POST | Edit logger in the CodeReady Workspaces server. |
| /resource/{accountId}/details | GET | Get detailed information about resources for the given account. |
| /system/stop | POST | Shutdown all system services, prepare CodeReady Workspaces to stop. |
5.2.5. monitorSystem permission
Users with the monitorSystem permission have access to the following services.
| Path | HTTP Method | Description |
|---|---|---|
| /activity | GET | Get workspaces in a certain state for a certain amount of time. |
5.2.6. Listing CodeReady Workspaces permissions
To list CodeReady Workspaces permissions that apply to a specific resource, perform the GET /permissions request.
To list the permissions that apply to a user, perform the GET /permissions/{domain} request.
To list the permissions that apply to all users, perform the GET /permissions/{domain}/all request. The user must have manageSystem permissions to see this information.
The suitable domain values are:
- system
- organization
- workspace
The domain is optional. If no domain is specified, the API returns all possible permissions for all the domains.
5.2.7. Assigning CodeReady Workspaces permissions
To assign permissions to a resource, perform the POST /permissions request. The suitable domain values are:
- system
- organization
- workspace
The following is a message body that requests permissions for a user with a userID to a workspace with a workspaceID:
Requesting CodeReady Workspaces user permissions
5.2.8. Sharing CodeReady Workspaces permissions
A user with setPermissions privileges can share a workspace and grant read, use, run, configure, or setPermissions privileges for other users.
Procedure
To share workspace permissions:
- Select a workspace in the user dashboard.
- Navigate to the Share tab and enter the email IDs of the users. Use commas or spaces as separators for multiple emails.
Chapter 6. Removing user data
To remove all user data, see the CodeReady Workspaces 2.0 Installation Guide.