Connectivity Link observability guide
Observe and monitor Gateways, APIs, and applications on OpenShift
Abstract
Preface
Providing feedback on Red Hat documentation
Red Hat appreciates your feedback on product documentation.
To propose improvements, open a Jira issue and describe your suggested changes. Provide as much detail as possible to help the documentation team to address your request quickly.
Prerequisite
- You have a Red Hat Customer Portal account. This account enables you to log in to the Red Hat Jira Software instance. If you do not have an account, you will be prompted to create one.
Procedure
- Click the following link: Create issue.
- In the Summary text box, enter a brief description of the issue.
In the Description text box, provide the following information:
- The URL of the page where you found the issue.
- A detailed description of the issue. You can leave the information in other fields at their default values.
- In the Reporter field, enter your Jira user name.
- Click Create to submit the Jira issue to the documentation team.
Thank you for taking the time to provide feedback.
Chapter 1. Connectivity Link observability
You can use the Connectivity Link observability features to observe and monitor your Gateways, applications, and APIs on OpenShift.
1.1. Connectivity Link observability features
Connectivity Link uses metrics exposed by Connectivity Link components, Gateway API state metrics, and standard metrics exposed by Envoy to build a set template dashboards and alerts.
You can download and use these Kuadrant community-based templates to integrate with Grafana, Prometheus, and Alertmanager deployments, or use these templates as starting points to modify for your specific needs.
Figure 1.1. Platform engineer Grafana dashboard
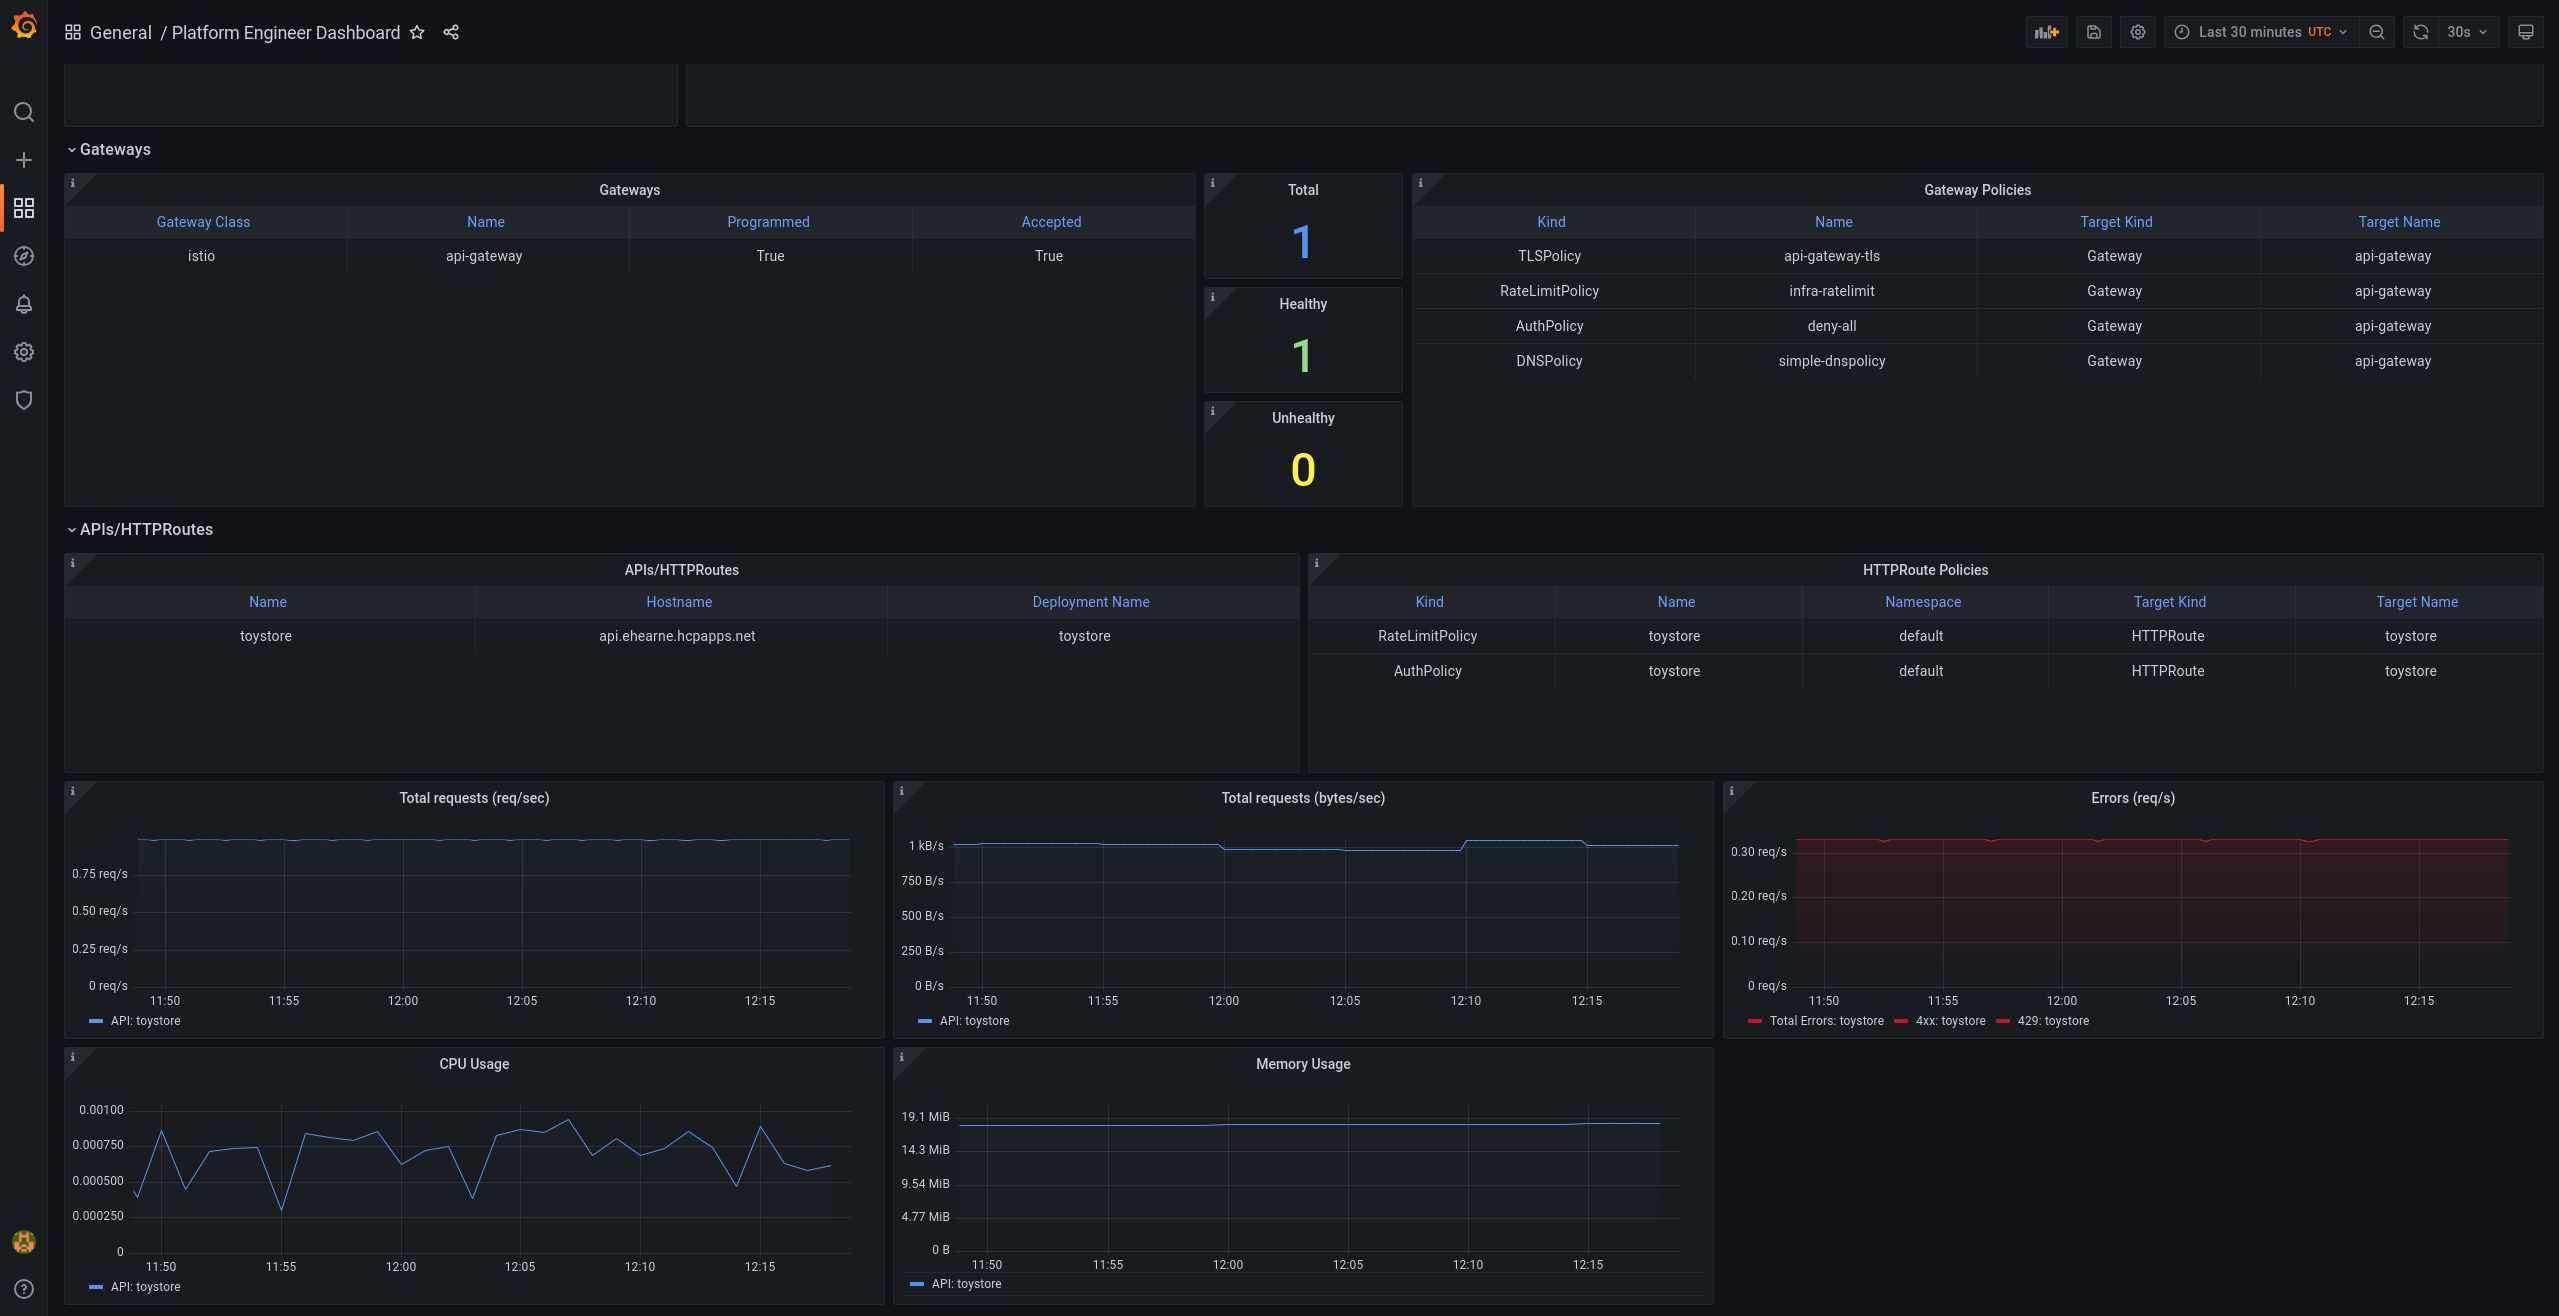
The platform engineer dashboard displays details such as the following:
- Policy compliance and governance.
- Resource consumption.
- Error rates.
- Request latency and throughput.
- Multi-window, multi-burn alert templates for API error rates and latency.
- Multicluster split.
Figure 1.2. Application developer Grafana dashboard
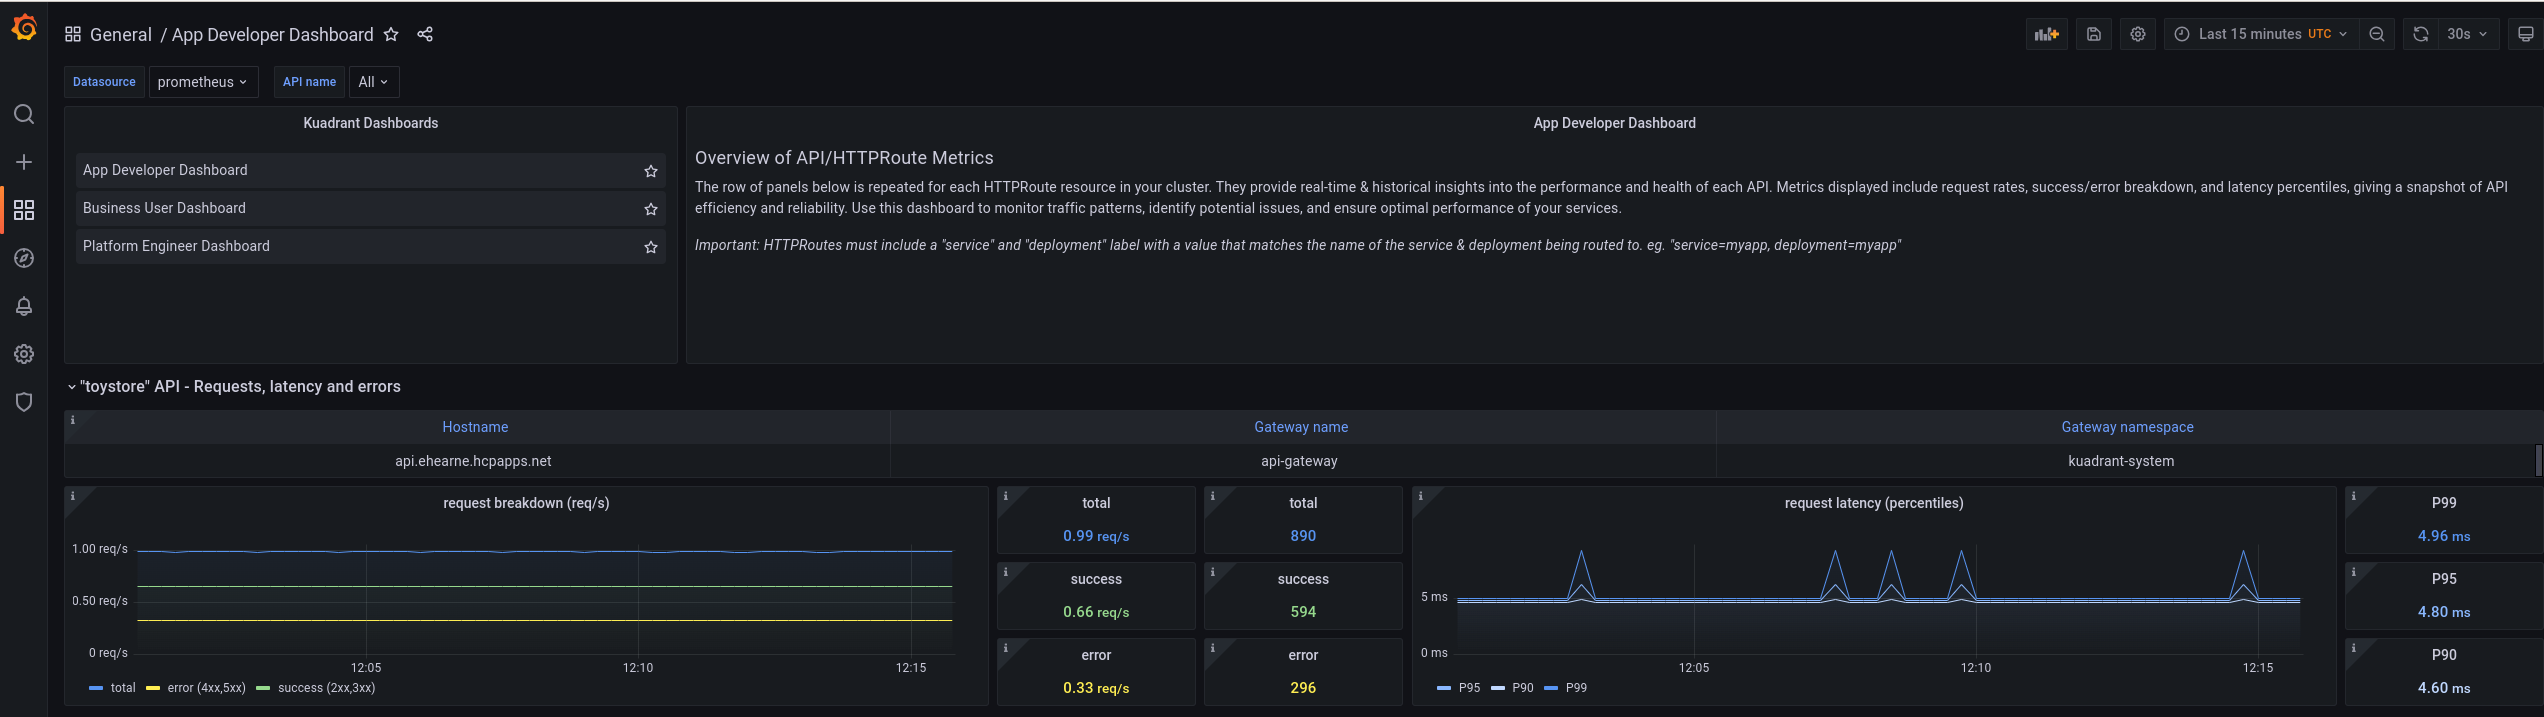
The application developer dashboard is less focused on policies than the platform engineer dashboard and is more focused on APIs and applications. For example, this includes details such as request latency and throughput per API, and total requests and error rates by API path.
Figure 1.3. Business user Grafana dashboard
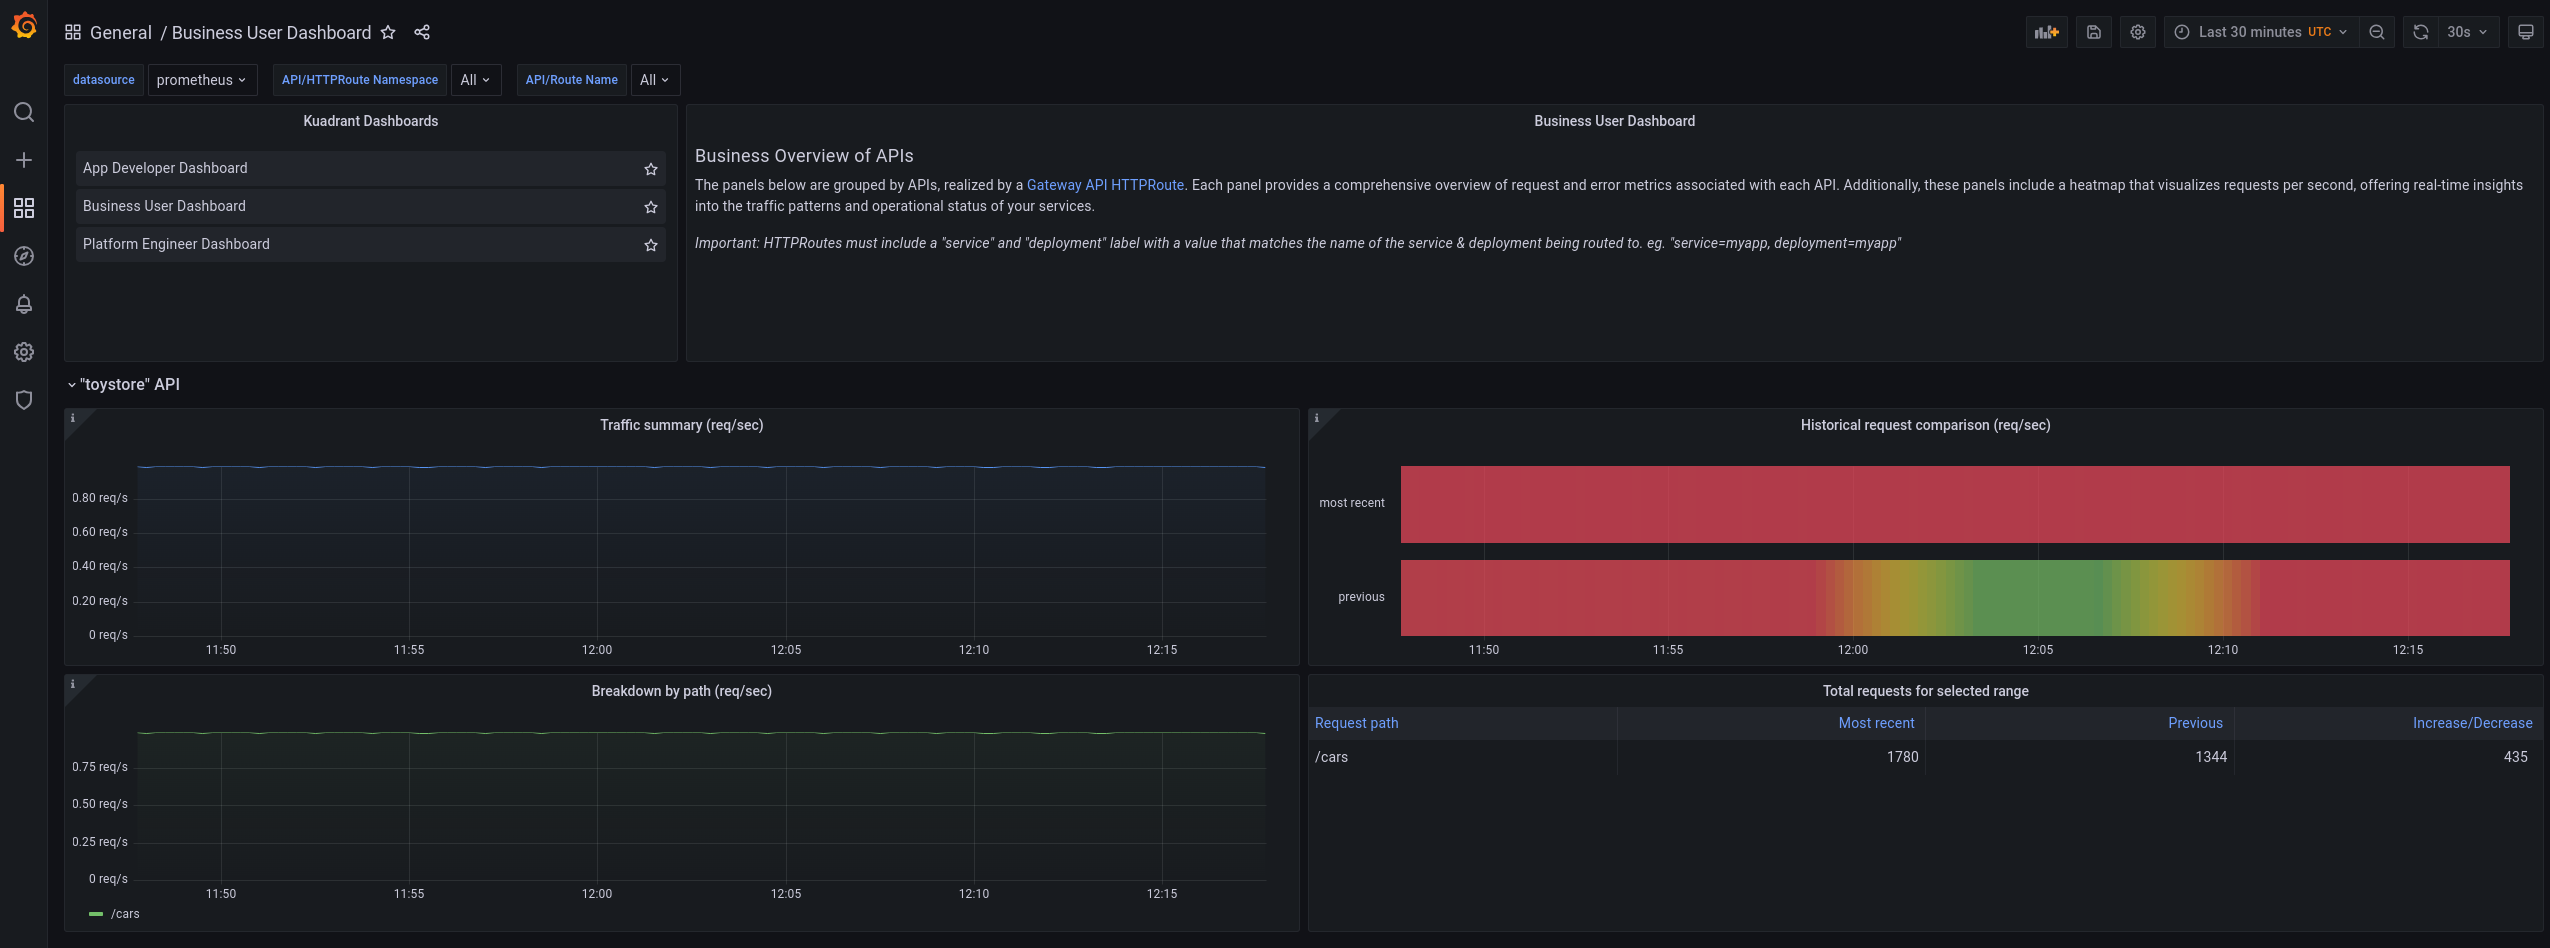
The business user dashboard includes details such as the following:
- Requests per second per API.
- Increase or decrease in rates of API usage over specified times.
Chapter 2. Configuring observability metrics
The Connectivity Link example dashboards and alerts use metrics exported by Connectivity Link, Gateway API, and OpenShift components to provide insight into your Gateways, applications, and APIs. This section explains how to configure these metrics and set up these dashboards and alerts on your OpenShift cluster.
The example dashboards and alerts for observing Connectivity Link functionality use low-level CPU and network metrics from the user monitoring stack in OpenShift and resource state metrics from Gateway API and Connectivity Link resources. The user monitoring stack in OpenShift is based on the Prometheus open source project.
You must perform these steps on each OpenShift cluster that you want to use Connectivity Link on.
Prerequisites
- You have Connectivity Link installed as described in Installing Connectivity Link on OpenShift.
- You have monitoring for user-defined projects set up as described in the OpenShift monitoring documentation.
- You have Grafana installed and configured on your OpenShift cluster. For a community-based example, see Installing Grafana on OpenShift for Kuadrant Observability.
- You have cloned the Kuadrant Operator GitHub repository.
Procedure
Verify that user workload monitoring is configured correctly in your OpenShift cluster as follows:
kubectl get configmap cluster-monitoring-config -n openshift-monitoring -o jsonpath='{.data.config\.yaml}'|grep enableUserWorkloadkubectl get configmap cluster-monitoring-config -n openshift-monitoring -o jsonpath='{.data.config\.yaml}'|grep enableUserWorkloadCopy to Clipboard Copied! Toggle word wrap Toggle overflow The expected output is
enableUserWorkload: true.Install the Connectivity Link, Gateway, and Grafana component metrics and configuration as follows:
kubectl apply -k https://github.com/Kuadrant/kuadrant-operator/config/install/configure/observability?ref=v1.1.0
kubectl apply -k https://github.com/Kuadrant/kuadrant-operator/config/install/configure/observability?ref=v1.1.0Copy to Clipboard Copied! Toggle word wrap Toggle overflow From the root directory of your Kuadrant Operator repository, configure the OpenShift
thanos-queryinstance as a data source in Grafana as follows:TOKEN="Bearer $(oc whoami -t)" HOST="$(kubectl -n openshift-monitoring get route thanos-querier -o jsonpath='https://{.status.ingress[].host}')" echo "TOKEN=$TOKEN" > config/observability/openshift/grafana/datasource.env echo "HOST=$HOST" >> config/observability/openshift/grafana/datasource.env kubectl apply -k config/observability/openshift/grafanaTOKEN="Bearer $(oc whoami -t)" HOST="$(kubectl -n openshift-monitoring get route thanos-querier -o jsonpath='https://{.status.ingress[].host}')" echo "TOKEN=$TOKEN" > config/observability/openshift/grafana/datasource.env echo "HOST=$HOST" >> config/observability/openshift/grafana/datasource.env kubectl apply -k config/observability/openshift/grafanaCopy to Clipboard Copied! Toggle word wrap Toggle overflow Configure the example Grafana dashboards as follows:
kubectl apply -k https://github.com/Kuadrant/kuadrant-operator/examples/dashboards?ref=v1.1.0
kubectl apply -k https://github.com/Kuadrant/kuadrant-operator/examples/dashboards?ref=v1.1.0Copy to Clipboard Copied! Toggle word wrap Toggle overflow
Additional resources
- For information on how to configure metrics in OpenShift Service Mesh, see the OpenShift Service Mesh metrics documentation.
- For reference information on component metrics, see the Kuadrant metrics documentation.
Chapter 3. Enabling observability in Connectivity Link
Enabling observability for Connectivity Link components configures integration between Connectivity Link components, including any Gateways, and the Prometheus Operator installed in your OpenShift cluster when user monitoring is enabled.
This feature works by creating a set of ServiceMonitors and PodMonitors, which instruct Prometheus to scrape metrics from Connectivity Link and Gateway components. These scraped metrics are then used in the Connectivity Link example dashboards and alerts.
You must perform these steps on each OpenShift cluster that you want to use Connectivity Link on.
Prerequisites
- You have configured metrics as described in Chapter 2, Configuring observability metrics.
Procedure
To enable observability for Kuadrant and any Gateways, set
enable: truein theobservabilitysection in yourKuadrantcustom resource as follows:Copy to Clipboard Copied! Toggle word wrap Toggle overflow When enabled, Connectivity Link creates ServiceMonitors and PodMonitors for its components in the Connectivity Link Operator namespace. A single set of monitors is also created in each Gateway namespace to scrape metrics from any Gateways, and in the corresponding Gateway system namespace, in this case, the
istio-systemnamespace.Check the created monitors as follows:
kubectl get servicemonitor,podmonitor -A -l kuadrant.io/observability=true
kubectl get servicemonitor,podmonitor -A -l kuadrant.io/observability=trueCopy to Clipboard Copied! Toggle word wrap Toggle overflow NoteYou can make changes to monitors after they are created if needed. Monitors are only ever created or deleted, and not updated or reverted. If you decide the default monitors are not suitable, you can set
enable: falseand create your ownServiceMonitororPodMonitordefinitions, or configure Prometheus directly.
Chapter 4. Configuring observability dashboards and alerts
Connectivity Link provides starting points for monitoring your Connectivity Link deployment by using example dashboards and alerts, which are ready-to-use and customizable to fit your environment.
The Connectivity Link example dashboards are uploaded to the Grafana dashboards website. You can import the following dashboards into your Grafana deployment on OpenShift:
| Name | Dashboard ID |
|---|---|
| 21538 | |
| 20982 | |
| 20981 |
This section explains how to enable the example dashboards and alerts and provides links additional resources for more information.
You must perform these steps on each OpenShift cluster that you want to use Connectivity Link on.
Prerequisites
- You have configured observability as described in Chapter 3, Enabling observability in Connectivity Link.
4.1. Configuring Grafana dashboards
You can import dashboards in the Grafana user interface, or automatically by using custom resources in OpenShift:
- Importing dashboards in Grafana
Click Dashboards > New > Import, and use one of the following options:
- Upload a dashboard JSON file.
- Enter a dashboard ID obtained from the Grafana dashboards website.
Enter JSON content directly.
For more information, see the Grafana documentation on how to import dashboards.
- Importing dashboards automatically in OpenShift
You can automate dashboard provisioning in Grafana by adding JSON files to a
ConfigMap, which must be mounted at/etc/grafana/provisioning/dashboards.TipAlternatively, to avoid adding
ConfigMapvolume mounts in your Grafana deployment, you can use aGrafanaDashboardresource to reference aConfigMap. For an example, see Dashboard from ConfigMap in the Grafana documentation.Data sources are configured as template variables, automatically integrating with your existing data sources. The metrics for these dashboards are sourced from Prometheus.
For some example dashboard panels to work correctly, HTTPRoutes in Connectivity Link must include a service and deployment label with a value that matches the name of the service and deployment being routed to, for example, service=my-app and deployment=my-app. This allows low-level Istio and Envoy metrics to be joined with Gateway API state metrics.
Additional resources
4.2. Configuring Prometheus alerts
You can integrate the Kuadrant example alerts into Prometheus as PrometheusRule resources, and then adjust the alert thresholds to suit your specific operational needs.
Service Level Objective (SLO) alerts generated by using the Sloth GitHub project are also included. You can use these alerts to integrate with the SLO Grafana dashboard, which uses generated labels to comprehensively overview your SLOs.
For details on how to configure Prometheus alerts, see the OpenShift documentation on managing alerting rules.
Chapter 5. Configuring tracing in Connectivity Link
You can enable tracing in OpenShift Service Mesh and the Connectivity Link components of Authorino and Limitador by directing traces to a central collector for improved observability and troubleshooting.
You must perform these steps on each OpenShift cluster that you want to use Connectivity Link on.
Prerequisites
- You have configured Grafana dashboards as described in Chapter 4, Configuring observability dashboards and alerts.
- You have a trace collector such as Tempo or Jaeger installed and configured to support OpenTelemetry. For more details, see the OpenShift Service Mesh tracing documentation.
Procedure
Enable tracing in OpenShift Service Mesh by configuring your
Telemetrycustom resource as follows:Copy to Clipboard Copied! Toggle word wrap Toggle overflow Configure a tracing
extensionProviderin OpenShift Service Mesh in yourIstiocustom resource as follows:Copy to Clipboard Copied! Toggle word wrap Toggle overflow ImportantYou must set the OpenTelemetry collector protocol in the service port
nameorappProtocolfields as described in the OpenShift Service Mesh documentation. For example, when using gRPC, the port name should begin withgrpc-or theappProtocolshould begrpc.Enable request tracing in your
Authorinocustom resource and send authentication and authorization traces to the central collector as follows:Copy to Clipboard Copied! Toggle word wrap Toggle overflow Enable request tracing in your
Limitadorcustom resource and send rate limit traces to the central collector as follows:Copy to Clipboard Copied! Toggle word wrap Toggle overflow NoteEnsure that the tracing collector is the same one that OpenShift Service Mesh is sending traces to so that they can all be correlated later.
When the changes are applied, the Authorino and Limitador components are redeployed with tracing enabled.
ImportantTrace IDs do not propagate to Wasm modules in OpenShift Service Mesh currently. This means that requests passed to Limitador do not have the relevant parent trace ID. However, if the trace initiation point is outside Service Mesh, the parent trace ID is available to Limitador and included in traces. This impacts on correlating traces from Limitador with traces from Authorino, the Gateway, and any other components in the request path.
Additional resources
- For more details, see the OpenShift Service Mesh Observability documentation.
Chapter 6. Troubleshooting by using traces and logs
You can use a tracing user interface such as Jaeger or Grafana to search for OpenShift Service Mesh and Connectivity Link trace information by trace ID. You can get the trace ID from logs, or from a header in a sample request that you want to troubleshoot. You can also search for recent traces, filtering by the service that you want to focus on.
6.1. Viewing Connectivity Link traces
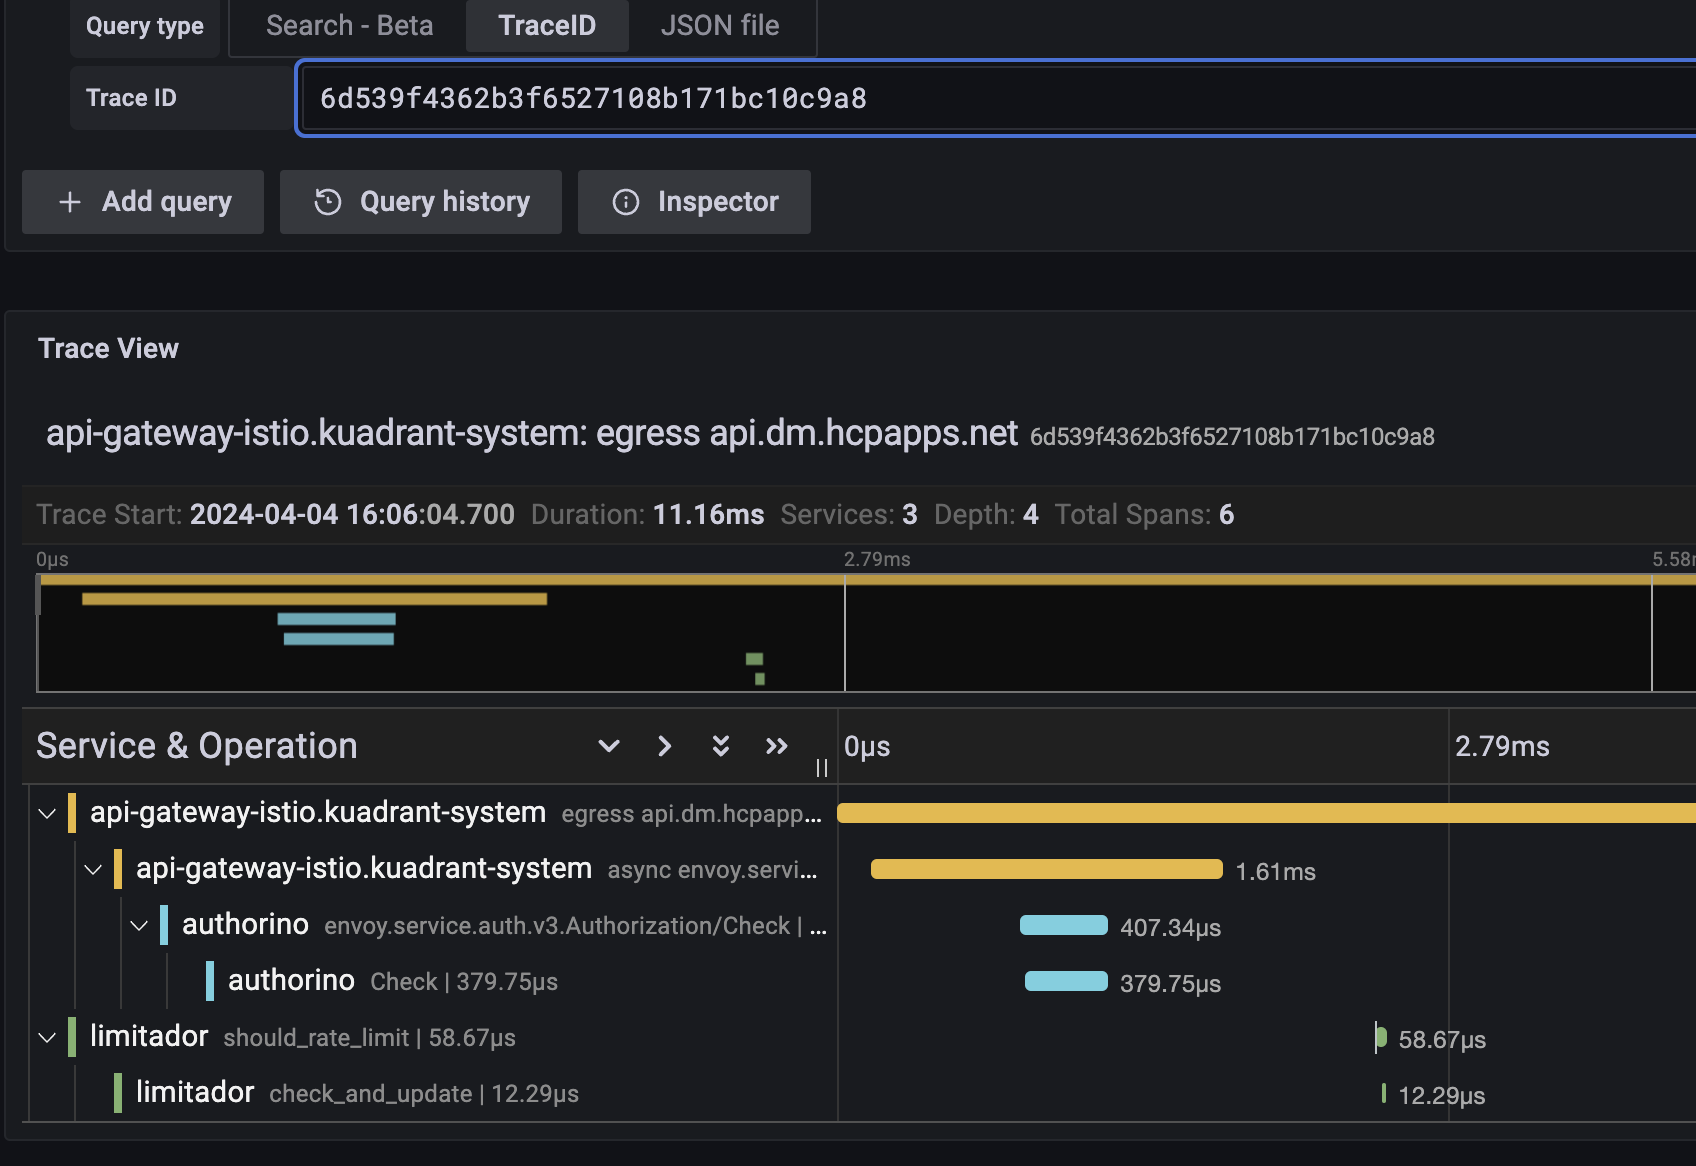
The following example trace in the Grafana user interface shows the total request time from the Istio-based Gateway, the time to check and update the rate limit count in Limitador, and the time to check authentication and authorization in Authorino:
Figure 6.1. Example Connectivity Link trace in Grafana
6.2. Viewing rate limit logging with trace IDs
When using the Limitador component of Connectivity Link for rate limiting, you can enable request logging with trace IDs to get more information on requests. This requires the log level to be increased to at least debug, so you must set the verbosity to 3 or higher in your Limitador custom resource as follows:
A log entry will look something like the following, with the traceparent field holding the trace ID:
"Request received: Request { metadata: MetadataMap { headers: {"te": "trailers", "grpc-timeout": "5000m", "content-type": "application/grpc", "traceparent": "00-4a2a933a23df267aed612f4694b32141-00f067aa0ba902b7-01", "x-envoy-internal": "true", "x-envoy-expected-rq-timeout-ms": "5000"} }, message: RateLimitRequest { domain: "default/toystore", descriptors: [RateLimitDescriptor { entries: [Entry { key: "limit.general_user__f5646550", value: "1" }, Entry { key: "metadata.filter_metadata.envoy\\.filters\\.http\\.ext_authz.identity.userid", value: "alice" }], limit: None }], hits_addend: 1 }, extensions: Extensions }"
"Request received: Request { metadata: MetadataMap { headers: {"te": "trailers", "grpc-timeout": "5000m", "content-type": "application/grpc", "traceparent": "00-4a2a933a23df267aed612f4694b32141-00f067aa0ba902b7-01", "x-envoy-internal": "true", "x-envoy-expected-rq-timeout-ms": "5000"} }, message: RateLimitRequest { domain: "default/toystore", descriptors: [RateLimitDescriptor { entries: [Entry { key: "limit.general_user__f5646550", value: "1" }, Entry { key: "metadata.filter_metadata.envoy\\.filters\\.http\\.ext_authz.identity.userid", value: "alice" }], limit: None }], hits_addend: 1 }, extensions: Extensions }"If you centrally aggregate logs by using tools such as Grafana Loki and Promtail, you can jump between trace information and the relevant logs for that service.
By using a combination of tracing and logs, you can visualize and troubleshoot request timing issues and drill down to specific services. This method becomes even more powerful when combined with Connectivity Link metrics and dashboards to get a more complete picture of your user traffic.
Additional resources
- For more details, see the Grafana user documentation.
Appendix A. Using your Red Hat subscription
Red Hat Connectivity Link is provided through a software subscription. To manage your subscriptions, access your account at the Red Hat Customer Portal.
Managing your subscriptions
- Go to access.redhat.com.
- If you do not already have an account, create one.
- Log in to your account.
- In the menu bar, click Subscriptions to view and manage your subscriptions.
Revised on 2025-09-30 14:46:27 UTC