Tuning Guide
Advanced tuning procedures to optimize latency in RHEL for Real Time
Abstract
Preface
Chapter 1. Before You Start Tuning Your Red Hat Enterprise Linux for Real Time System
Things to Remember While You Are Tuning Your Red Hat Enterprise Linux for Real Time Kernel
- Be PatientReal-time tuning is an iterative process; you will almost never be able to tweak a few variables and know that the change is the best that can be achieved. Be prepared to spend days or weeks narrowing down the set of tunings that work best for your system.Additionally, always make long test runs. Changing some tuning parameters then doing a five minute test run is not a good validation of a set of tunes. Make the length of your test runs adjustable and run them for longer than a few minutes. Try to narrow down to a few different tuning sets with test runs of a few hours, then run those sets for many hours or days at a time, to try and catch corner-cases of max latencies or resource exhaustion.
- Be AccurateBuild a measurement mechanism into your application, so that you can accurately gauge how a particular set of tuning changes affect the application's performance. Anecdotal evidence (for example, "The mouse moves more smoothly") is usually wrong and varies from person to person. Do hard measurements and record them for later analysis.
- Be MethodicalIt is very tempting to make multiple changes to tuning variables between test runs, but doing so means that you do not have a way to narrow down which tune affected your test results. Keep the tuning changes between test runs as small as you can.
- Be ConservativeIt is also tempting to make large changes when tuning, but it is almost always better to make incremental changes. You will find that working your way up from the lowest to highest priority values will yield better results in the long run.
- Be SmartUse the tools you have available. The Tuna graphical tuning tool makes it easy to change processor affinities for threads and interrupts, thread priorities and to isolate processors for application use. The
tasksetandchrtcommand line utilities allow you to do most of what Tuna does. If you run into performance problems, theftraceandperftools can help locate latency issues. - Be FlexibleRather than hard-coding values into your application, use external tools to change policy, priority and affinity. This allows you to try many different combinations and simplifies your logic. Once you have found some settings that give good results, you can either add them to your application, or set up some startup logic to implement the settings when the application starts.
Linux uses three main scheduling policies:
SCHED_OTHER(sometimes calledSCHED_NORMAL)- This is the default thread policy and has dynamic priority controlled by the kernel. The priority is changed based on thread activity. Threads with this policy are considered to have a real-time priority of 0 (zero).
SCHED_FIFO(First in, first out)- A real-time policy with a priority range of from 1 - 99, with 1 being the lowest and 99 the highest.
SCHED_FIFOthreads always have a higher priority thanSCHED_OTHERthreads (for example, aSCHED_FIFOthread with a priority of1will have a higher priority than anySCHED_OTHERthread). Any thread created as aSCHED_FIFOthread has a fixed priority and will run until it is blocked or preempted by a higher priority thread. SCHED_RR(Round-Robin)SCHED_RRis a modification ofSCHED_FIFO. Threads with the same priority have a quantum and are round-robin scheduled among all equal prioritySCHED_RRthreads. This policy is rarely used.
1.1. Running Latency Tests and Interpreting Their Results
1.1.1. Preliminary Steps
Procedure 1.1. To successfully test your system and interpret the results:
- Check the vendor documentation for any tuning steps required for low latency operation.This step aims to reduce or remove any System Management Interrupts (SMIs) that would transition the system into System Management Mode (SMM). While a system is in SMM it is running firmware and not running operating system code, meaning any timers that expire while in SMM will have to wait until the system transitions back into normal operation. This can cause unexplained latencies since SMIs cannot be blocked by Linux and the only indication that we actually took an SMI may be found in vendor-specific performance counter registers.
Warning
Red Hat strongly recommends that you do not completely disable SMIs, as it can result in catastrophic hardware failure. - Ensure that RHEL-RT and
rt-testspackage is installed.This step verifies that you have tuned the system properly. - Run the
hwlatdetectprogram.hwlatdetectlooks for hardware-firmware induced latencies by polling the clock-source and looking for unexplained gaps.Generally, you do not need to run any sort of load on the system while runninghwlatdetect, since the program is looking for latencies introduced by hardware architecture or BIOS/EFI firmware.A typical output ofhwlatdetectlooks like this:Copy to Clipboard Copied! Toggle word wrap Toggle overflow The above result represents a system that was tuned to minimize system interruptions from firmware.However, not all systems can be tuned to minimize system interruptions as shown below:Copy to Clipboard Copied! Toggle word wrap Toggle overflow The above result shows that while doing consecutive reads of the systemclocksource, there were 10 delays that showed up in the 15-18 us range.hwlatdetectwas using thetracermechanism as thedetectorfor unexplained latencies. Previous versions used a kernel module rather thanftrace tracer.parametersreport a latency and how the detection was run. The default latency threshold was 10 microseconds (10 us), the sample window was 1 second, the sampling window was 0.5 seconds.As a result,tracerran adetectorthread that ran for one half of each second of the specified duration.Thedetectorthread runs a loop which does the following pseudocode:Copy to Clipboard Copied! Toggle word wrap Toggle overflow The inner loop comparison checks thatt0 - t1does not exceed the specified threshold (10 us default). The outer loop comparison checks the time between the bottom of the loop and the topt1 - t0. The time between consecutive reads of the timestamp register should be dozens of nanoseconds (essentially a register read, a comparison and a conditional jump) so any other delay between consecutive reads is introduced by firmware or by the way the system components were connected.Note
The values printed out by thehwlatdetectorforinnerandouterare the best case maximum latency. The latency values are the deltas between consecutive reads of the current systemclocksource(usually theTime Stamp CounterorTSCregister, but potentially theHPETorACPIpower management clock) and any delays between consecutive reads, introduced by the hardware-firmware combination.
1.1.2. Testing the System Real-time Performance under Load
rteval utility to test the system real-time performance under load. rteval starts a heavy system load of SCHED_OTHER tasks and then measures real-time response on each online CPU. The loads are a parallel make of the Linux kernel tree in a loop and the hackbench synthetic benchmark.
rteval then starts the cyclictest measurement program. This program starts the SCHED_FIFO real-time thread on each online core and then measures real-time scheduling response time. Each measurement thread takes a timestamp, sleeps for an interval, then takes another timestamp after waking up. The latency measured is t1 - (t0 + i), which is the difference between the actual wakeup time t1, and the theoretical wakeup time of the first timestamp t0 plus the sleep interval i.
rteval run are written to the XML file along with the boot log for the system. Then the rteval-<date>-N.tar.bz2 file is generated. N is a counter for the Nth run on <date>. A report, generated from the XML file, similar to the below, will be printed to the screen:
# rteval --summarize rteval-<date>-n.tar.bz2Chapter 2. General System Tuning
2.1. Using the Tuna Interface
2.2. Setting Persistent Tuning Parameters
Procedure 2.1. Editing the /etc/sysctl.conf File
/proc/sys/, including it in the /etc/sysctl.conf file will make the parameter persistent.
- Open the
/etc/sysctl.conffile in your chosen text editor. - Remove the
/proc/sys/prefix from the command and replace the central/character with a.character.For example: the commandecho 0 > /proc/sys/kernel/hung_task_panicwill becomekernel.hung_task_panic. - Insert the new entry into the
/etc/sysctl.conffile with the required parameter.# Enable gettimeofday(2) kernel.hung_task_panic = 0
# Enable gettimeofday(2) kernel.hung_task_panic = 0Copy to Clipboard Copied! Toggle word wrap Toggle overflow - Run
# sysctl -pto refresh with the new configuration.sysctl -p ...[output truncated]... kernel.hung_task_panic = 0
~]# sysctl -p
...[output truncated]...
kernel.hung_task_panic = 0
Copy to Clipboard Copied! Toggle word wrap Toggle overflow
Procedure 2.2. Editing the /etc/rc.d/rc.local File
Warning
/etc/rc.d/rc.local mechanism should not be used for production startup code. It is a holdover from the SysV Init days of startup scripts and is executed now by the systemd service. It should only be used for testing of startup code, since there is no way to control ordering or dependencies.
- Adjust the command as per the Procedure 2.1, “Editing the
/etc/sysctl.confFile” instructions. - Insert the new entry into the
/etc/rc.d/rc.localfile with the required parameter.
2.3. Setting BIOS Parameters
- Power Management
- Anything that tries to save power by either changing the system clock frequency or by putting the CPU into various sleep states can affect how quickly the system responds to external events.For best response times, disable power management options in the BIOS.
- Error Detection and Correction (EDAC) units
- EDAC units are devices used to detect and correct errors signaled from Error Correcting Code (ECC) memory. Usually EDAC options range from no ECC checking to a periodic scan of all memory nodes for errors. The higher the EDAC level, the more time is spent in BIOS, and the more likely that crucial event deadlines will be missed.Turn EDAC off if possible. Otherwise, switch to the lowest functional level.
- System Management Interrupts (SMI)
- SMIs are a facility used by hardware vendors ensure the system is operating correctly. The SMI interrupt is usually not serviced by the running operating system, but by code in the BIOS. SMIs are typically used for thermal management, remote console management (IPMI), EDAC checks, and various other housekeeping tasks.If the BIOS contains SMI options, check with the vendor and any relevant documentation to check to what extent it is safe to disable them.
Warning
While it is possible to completely disable SMIs, it is strongly recommended that you do not do this. Removing the ability for your system to generate and service SMIs can result in catastrophic hardware failure.
2.4. Interrupt and Process Binding
Important
00000000000000000000000000000001 as a bitmask, 1 as a decimal, and 0x00000001 as a hexadecimal. The CPU mask for both CPU 0 and 1 is 00000000000000000000000000000011 as a bitmask, 3 as a decimal, and 0x00000003 as a hexadecimal.
Procedure 2.3. Disabling the irqbalance Daemon
irqbalance daemon is not required.
- Check the status of the
irqbalancedaemon.systemctl status irqbalance irqbalance.service - irqbalance daemon Loaded: loaded (/usr/lib/systemd/system/irqbalance.service; enabled) Active: active (running) …
~]# systemctl status irqbalance
irqbalance.service - irqbalance daemon
   Loaded: loaded (/usr/lib/systemd/system/irqbalance.service; enabled)
   Active: active (running) …
Copy to Clipboard Copied! Toggle word wrap Toggle overflow - If the
irqbalancedaemon is running, stop it.systemctl stop irqbalance
~]# systemctl stop irqbalanceCopy to Clipboard Copied! Toggle word wrap Toggle overflow - Ensure that
irqbalancedoes not restart on boot.systemctl disable irqbalance
~]# systemctl disable irqbalanceCopy to Clipboard Copied! Toggle word wrap Toggle overflow
Procedure 2.4. Excluding CPUs from IRQ Balancing
/etc/sysconfig/irqbalance configuration file contains a setting that allows CPUs to be excluded from consideration by the IRQ balacing service. This parameter is named IRQBALANCE_BANNED_CPUS and is a 64-bit hexadecimal bit mask, where each bit of the mask represents a CPU core.
- Open
/etc/sysconfig/irqbalancein your preferred text editor and find the section of the file titledIRQBALANCE_BANNED_CPUS.Copy to Clipboard Copied! Toggle word wrap Toggle overflow - Exclude CPUs 8 to 15 by uncommenting the variable
IRQBALANCE_BANNED_CPUSand setting its value this way:IRQBALANCE_BANNED_CPUS=0000ff00
IRQBALANCE_BANNED_CPUS=0000ff00Copy to Clipboard Copied! Toggle word wrap Toggle overflow - This will cause the
irqbalanceprocess to ignore the CPUs that have bits set in the bitmask; in this case, bits 8 through 15. - If you are running a system with up to 64 CPU cores, separate each group of eight hexadecimal digits with a comma:
IRQBALANCE_BANNED_CPUS=00000001,0000ff00
IRQBALANCE_BANNED_CPUS=00000001,0000ff00Copy to Clipboard Copied! Toggle word wrap Toggle overflow The above mask excludes CPUs 8 to 15 as well as CPU 33 from IRQ balancing.
Note
irqbalance tool automatically avoids IRQs on CPU cores isolated via the isolcpus= kernel parameter if IRQBALANCE_BANNED_CPUS is not set in the /etc/sysconfig/irqbalance file.
Procedure 2.5. Manually Assigning CPU Affinity to Individual IRQs
- Check which IRQ is in use by each device by viewing the
/proc/interruptsfile:cat /proc/interrupts
~]# cat /proc/interruptsCopy to Clipboard Copied! Toggle word wrap Toggle overflow This file contains a list of IRQs. Each line shows the IRQ number, the number of interrupts that happened in each CPU, followed by the IRQ type and a description:CPU0 CPU1 0: 26575949 11 IO-APIC-edge timer 1: 14 7 IO-APIC-edge i8042 ...[output truncated]...
CPU0 CPU1 0: 26575949 11 IO-APIC-edge timer 1: 14 7 IO-APIC-edge i8042 ...[output truncated]...Copy to Clipboard Copied! Toggle word wrap Toggle overflow - To instruct an IRQ to run on only one processor, use the
echocommand to write the CPU mask, as a hexadecimal number, to thesmp_affinityentry of the specific IRQ. In this example, we are instructing the interrupt with IRQ number 142 to run on CPU 0 only:echo 1 > /proc/irq/142/smp_affinity
~]# echo 1 > /proc/irq/142/smp_affinityCopy to Clipboard Copied! Toggle word wrap Toggle overflow - This change will only take effect once an interrupt has occurred. To test the settings, generate some disk activity, then check the
/proc/interruptsfile for changes. Assuming that you have caused an interrupt to occur, you will see that the number of interrupts on the chosen CPU have risen, while the numbers on the other CPUs have not changed.
Procedure 2.6. Binding Processes to CPUs Using the taskset Utility
taskset utility uses the process ID (PID) of a task to view or set the affinity, or can be used to launch a command with a chosen CPU affinity. In order to set the affinity, taskset requires the CPU mask expressed as a decimal or hexadecimal number. The mask argument is a bitmask that specifies which CPU cores are legal for the command or PID being modified.
- To set the affinity of a process that is not currently running, use
tasksetand specify the CPU mask and the process. In this example,my_embedded_processis being instructed to use only CPU 3 (using the decimal version of the CPU mask).taskset 8 /usr/local/bin/my_embedded_process
~]# taskset 8 /usr/local/bin/my_embedded_processCopy to Clipboard Copied! Toggle word wrap Toggle overflow - It is also possible to specify more than one CPU in the bitmask. In this example,
my_embedded_processis being instructed to execute on processors 4, 5, 6, and 7 (using the hexadecimal version of the CPU mask).taskset 0xF0 /usr/local/bin/my_embedded_process
~]# taskset 0xF0 /usr/local/bin/my_embedded_processCopy to Clipboard Copied! Toggle word wrap Toggle overflow - Additionally, you can set the CPU affinity for processes that are already running by using the
-p(--pid) option with the CPU mask and the PID of the process you wish to change. In this example, the process with a PID of 7013 is being instructed to run only on CPU 0.taskset -p 1 7013
~]# taskset -p 1 7013Copy to Clipboard Copied! Toggle word wrap Toggle overflow - Lastly, using the
-cparameter, you can specify a CPU list instead of a CPU mask. For example, in order to use CPU 0, 4 and CPUs 7 to 11, the command line would contain-c 0,4,7-11. This invocation is more convenient in most cases.
Important
For more information, or for further reading, the following man pages are related to the information given in this section.
- chrt(1)
- taskset(1)
- nice(1)
- renice(1)
- sched_setscheduler(2) for a description of the Linux scheduling scheme.
2.5. File System Determinism Tips
xfs. A much earlier file system called ext2 does not use journaling. Unless your organization specifically requires journaling, consider using ext2. In many of our best benchmark results, we utilize the ext2 file system and consider it one of the top initial tuning recommendations.
xfs record the time a file was last accessed (atime). If using ext2 is not a suitable solution for your system, consider disabling atime under xfs instead. Disabling atime increases performance and decreases power usage by limiting the number of writes to the filesystem journal.
Procedure 2.7. Disabling atime
- Open the
/etc/fstabfile using your chosen text editor and locate the entry for the root mount point./dev/mapper/rhel-root / xfs defaults…
/dev/mapper/rhel-root / xfs defaults…Copy to Clipboard Copied! Toggle word wrap Toggle overflow - Edit the options sections to include the terms
noatimeandnodiratime.noatimeprevents access timestamps being updated when a file is read andnodiratimewill stop directory inode access times being updated./dev/mapper/rhel-root / xfs noatime,nodiratime…
/dev/mapper/rhel-root / xfs noatime,nodiratime…Copy to Clipboard Copied! Toggle word wrap Toggle overflow Important
Some applications rely onatimebeing updated. Therefore, this option is reasonable only on system where such applications are not used.Alternatively, you can use therelatimemount option, which ensures that the access time is only updated if the previous access time is older than the current modify time.
For more information, or for further reading, the following man pages are related to the information given in this section.
- mkfs.ext2(8)
- mkfs.xfs(8)
- mount(8) - for information on
atime,nodiratimeandnoatime
2.6. Using Hardware Clocks for System Timestamping
/sys/devices/system/clocksource/clocksource0/available_clocksource file:
~]# cat /sys/devices/system/clocksource/clocksource0/available_clocksource
tsc hpet acpi_pm
~]# cat /sys/devices/system/clocksource/clocksource0/available_clocksource
tsc hpet acpi_pm
/sys/devices/system/clocksource/clocksource0/current_clocksource file:
~]# cat /sys/devices/system/clocksource/clocksource0/current_clocksource
tsc
~]# cat /sys/devices/system/clocksource/clocksource0/current_clocksource
tsc
Sometimes the best-performing clock for a system's main application is not used due to known problems on the clock. After ruling out all problematic clocks, the system can be left with a hardware clock that is unable to satisfy the minimum requirements of a real-time system.
/sys/devices/system/clocksource/clocksource0/available_clocksource file and write the clock's name into the /sys/devices/system/clocksource/clocksource0/current_clocksource file. For example, the following command sets HPET as the clock source in use:
echo hpet > /sys/devices/system/clocksource/clocksource0/current_clocksource
~]# echo hpet > /sys/devices/system/clocksource/clocksource0/current_clocksourceNote
While there is no single clock which is ideal for all systems, TSC is generally the preferred clock source. To optimize the reliability of the TSC clock, you can configure additional parameters when booting the kernel, for example:
idle=poll: Forces the clock to avoid entering the idle state.processor.max_cstate=1: Prevents the clock from entering deeper C-states (energy saving mode), so it does not become out of sync.
Modern processors actively transition to higher power saving states (C-states) from lower states. Unfortunately, transitioning from a high power saving state back to a running state can consume more time than is optimal for a real-time application. To prevent these transitions, an application can use the Power Management Quality of Service (PM QoS) interface.
idle=poll and processor.max_cstate=1 parameters (as listed in Configuring Additional Boot Parameters for the TSC Clock), but with a more fine-grained control of power saving states.
/dev/cpu_dma_latency file open, the PM QoS interface prevents the processor from entering deep sleep states, which cause unexpected latencies when they are being exited. When the file is closed, the system returns to a power-saving state.
- Open the
/dev/cpu_dma_latencyfile. Keep the file descriptor open for the duration of the low-latency operation. - Write a 32-bit number to it. This number represents a maximum response time in microseconds. For the fastest possible response time, use
0.An example/dev/cpu_dma_latencyfile is as follows:Copy to Clipboard Copied! Toggle word wrap Toggle overflow The application will first callstart_low_latency(), perform the required latency-sensitive processing, then callstop_low_latency().
For more information, or for further reading, the following book is related to the information given in this section.
- Linux System Programming by Robert Love
2.7. Avoid Running Extra Applications
- Graphical desktopDo not run graphics where they are not absolutely required, especially on servers. To check if the system is configured to boot into the GUI by default, run the following command:
systemctl get-default
~]# systemctl get-defaultCopy to Clipboard Copied! Toggle word wrap Toggle overflow If you seegraphical.target, reconfigure the system to boot into the text mode:systemctl set-default multi-user.target
~]# systemctl set-default multi-user.targetCopy to Clipboard Copied! Toggle word wrap Toggle overflow - Mail Transfer Agents (MTA, such as Sendmail or Postfix)Unless you are actively using Sendmail on the system you are tuning, disable it. If it is required, ensure it is well tuned or consider moving it to a dedicated machine.
Important
Sendmail is used to send system-generated messages, which are executed by programs such as cron. This includes reports generated by logging functions like logwatch. You will not be able to receive these messages if sendmail is disabled. - Remote Procedure Calls (RPCs)
- Network File System (NFS)
- Mouse ServicesIf you are not using a graphical interface like Gnome or KDE, then you probably do not need a mouse either. Remove the hardware and uninstall
gpm. - Automated tasksCheck for automated
cronoratjobs that could impact performance.
For more information, or for further reading, the following man pages are related to the information given in this section.
- rpc(3)
- nfs(5)
- gpm(8)
2.8. Swapping and Out of Memory Tips
Swapping pages out to disk can introduce latency in any environment. To ensure low latency, the best strategy is to have enough memory in your systems so that swapping is not necessary. Always size the physical RAM as appropriate for your application and system. Use vmstat to monitor memory usage and watch the si (swap in) and so (swap out) fields. It is optimal that they remain zero as much as possible.
Procedure 2.8. Out of Memory (OOM)
/proc/sys/vm/panic_on_oom. When set to 1 the kernel will panic on OOM. The default setting is 0 which instructs the kernel to call a function named oom_killer on an OOM. Usually, oom_killer can kill rogue processes and the system will survive.
- The easiest way to change this is to
echothe new value to/proc/sys/vm/panic_on_oom.Copy to Clipboard Copied! Toggle word wrap Toggle overflow Note
It is recommended that you make the $RT; kernel panic on OOM. When the system has encountered an OOM state, it is no longer deterministic. - It is also possible to prioritize which processes get killed by adjusting the
oom_killerscore. In/proc/PID/there are two files namedoom_adjandoom_score. Valid scores foroom_adjare in the range -16 to +15. This value is used to calculate the 'badness' of the process using an algorithm that also takes into account how long the process has been running, among other factors. To see the currentoom_killerscore, view theoom_scorefor the process.oom_killerwill kill processes with the highest scores first.This example adjusts theoom_scoreof a process with a PID of 12465 to make it less likely thatoom_killerwill kill it.Copy to Clipboard Copied! Toggle word wrap Toggle overflow - There is also a special value of -17, which disables
oom_killerfor that process. In the example below,oom_scorereturns a value ofO, indicating that this process would not be killed.Copy to Clipboard Copied! Toggle word wrap Toggle overflow
For more information, or for further reading, the following man pages are related to the information given in this section.
- swapon(2)
- swapon(8)
- vmstat(8)
2.9. Network Determinism Tips
TCP can have a large effect on latency. TCP adds latency in order to obtain efficiency, control congestion, and to ensure reliable delivery. When tuning, consider the following points:
- Do you need ordered delivery?
- Do you need to guard against packet loss?Transmitting packets more than once can cause delays.
- If you must use TCP, consider disabling the Nagle buffering algorithm by using
TCP_NODELAYon your socket. The Nagle algorithm collects small outgoing packets to send all at once, and can have a detrimental effect on latency.
Network Tuning
- Interrupt Coalescing
- To reduce the amount of interrupts, packets can be collected and a single interrupt generated for a collection of packets.In systems that transfer large amounts of data where throughput is a priority, using the default value or increasing coalesce can increase throughput and lower the number of interrupts hitting CPUs. For systems requiring a rapid network response, reducing or disabling coalesce is advised.Use the
-C(--coalesce) option with theethtoolcommand to enable. - Congestion
- Often, I/O switches can be subject to back-pressure, where network data builds up as a result of full buffers.Use the
-A(--pause) option with theethtoolcommand to change pause parameters and avoid network congestion. - Infiniband (IB)
- Infiniband is a type of communications architecture often used to increase bandwidth and provide quality of service and failover. It can also be used to improve latency through Remote Direct Memory Access (RDMA) capabilities.
- Network Protocol Statistics
- Use the
-s(--statistics) option with thenetstatcommand to monitor network traffic.
For more information, or for further reading, the following man pages are related to the information given in this section.
- ethtool(8)
- netstat(8)
2.10. syslog Tuning Tips
syslog can forward log messages from any number of programs over a network. The less often this occurs, the larger the pending transaction is likely to be. If the transaction is very large an I/O spike can occur. To prevent this, keep the interval reasonably small.
Procedure 2.9. Using syslogd for System Logging.
syslogd, is used to collect messages from a number of different programs. It also collects information reported by the kernel from the kernel logging daemon klogd. Typically, syslogd will log to a local file, but it can also be configured to log over a network to a remote logging server.
- To enable remote logging, you will first need to configure the machine that will receive the logs. See https://access.redhat.com/solutions/54363 for details.
- Once remote logging support is enabled on the remote logging server, each system that will send logs to it must be configured to send its syslog output to the server, rather than writing those logs to the local file system. To do this, edit the
/etc/rsyslog.conffile on each client system. For each of the various logging rules defined in that file, you can replace the local log file with the address of the remote logging server.# Log all kernel messages to remote logging host. kern.* @my.remote.logging.server
# Log all kernel messages to remote logging host. kern.* @my.remote.logging.serverCopy to Clipboard Copied! Toggle word wrap Toggle overflow The example above will cause the client system to log all kernel messages to the remote machine at@my.remote.logging.server. - It is also possible to configure
syslogdto log all locally generated system messages, by adding a wildcard line to the/etc/rsyslog.conffile:# Log all messages to a remote logging server: *.* @my.remote.logging.server
# Log all messages to a remote logging server: *.* @my.remote.logging.serverCopy to Clipboard Copied! Toggle word wrap Toggle overflow
Important
syslogd does not include built-in rate limiting on its generated network traffic. Therefore, we recommend that remote logging on Red Hat Enterprise Linux for Real Time systems be confined to only those messages that are required to be remotely logged by your organization. For example, kernel warnings, authentication requests, and the like. Other messages are locally logged.
For more information, or for further reading, the following man pages are related to the information given in this section.
- syslog(3)
- rsyslog.conf(5)
- rsyslogd(8)
2.11. The PC Card Daemon
pcscd daemon is used to manage connections to PC and SC smart card readers. Although pcscd is usually a low priority task, it can often use more CPU than any other daemon. This additional background noise can lead to higher pre-emption costs to real-time tasks and other undesirable impacts on determinism.
Procedure 2.10. Disabling the pcscd Daemon
- Check the status of the
pcscddaemon.systemctl status pcscd pcscd.service - PC/SC Smart Card Daemon Loaded: loaded (/usr/lib/systemd/system/pcscd.service; static) Active: active (running) …
~]# systemctl status pcscd
pcscd.service - PC/SC Smart Card Daemon
   Loaded: loaded (/usr/lib/systemd/system/pcscd.service; static)
   Active: active (running) …
Copy to Clipboard Copied! Toggle word wrap Toggle overflow - If the
pcscddaemon is running, stop it.systemctl stop pcscd
~]# systemctl stop pcscdCopy to Clipboard Copied! Toggle word wrap Toggle overflow - Ensure that
pcscddoes not restart on boot.systemctl disable pcscd
~]# systemctl disable pcscdCopy to Clipboard Copied! Toggle word wrap Toggle overflow
2.12. Reduce TCP Performance Spikes
sysctl command controls the values of TCP related entries, setting the timestamps kernel parameter found at /proc/sys/net/ipv4/tcp_timestamps.
- Turn timestamps off with the following command:
sysctl -w net.ipv4.tcp_timestamps=0
net.ipv4.tcp_timestamps = 0
~]# sysctl -w net.ipv4.tcp_timestamps=0
net.ipv4.tcp_timestamps = 0
Copy to Clipboard Copied! Toggle word wrap Toggle overflow - Turn timestamps on with the following command:
sysctl -w net.ipv4.tcp_timestamps=1
net.ipv4.tcp_timestamps = 1
~]# sysctl -w net.ipv4.tcp_timestamps=1
net.ipv4.tcp_timestamps = 1
Copy to Clipboard Copied! Toggle word wrap Toggle overflow - Print the current value with the following command:
sysctl net.ipv4.tcp_timestamps
net.ipv4.tcp_timestamps = 1
~]# sysctl net.ipv4.tcp_timestamps
net.ipv4.tcp_timestamps = 1
Copy to Clipboard Copied! Toggle word wrap Toggle overflow The value1indicates that timestamps are on, the value0indicates they are off.
2.13. System Partitioning
lscpu and tuna utilities are used to determine the system CPU topology. The Tuna GUI allows you to dynamically isolate CPUs and move threads and interrupts from one CPU to another so that performance impacts can be measured.
yum install tuned-profiles-realtime
~]# yum install tuned-profiles-realtimetuned real-time profile that allows partitioning and other tunings at boot time with no additional user input required. Two configuration files control the behavior of the profile:
/etc/tuned/realtime-variables.conf/usr/lib/tuned/realtime/tuned.conf
realtime-variables.conf file specifies the group of CPU cores to be isolated. To isolate a group of CPU cores from the system, use the isolated_cores option as in the following example:
isolated_cores variable is set, activate the profile with the tuned-adm command:
tuned-adm profile realtime
~]# tuned-adm profile realtimebootloader plug-in. When activated, this plug-in adds the following boot parameters to the Linux kernel command line:
- isolcpus
- specifies CPUs listed in the
realtime-variables.conffile - nohz
- turns off the timer tick on an idle CPU; set to
offby default - nohz_full
- turns off the timer tick on a CPU when there is only one runnable task on that CPU; needs
nohzto be set toon - intel_pstate=disable
- prevents the Intel idle driver from managing power state and CPU frequency
- nosoftlockup
- prevents the kernel from detecting soft lockups in user threads
isolcpus=1-3,5,9-14 nohz=on nohz_full=1-3,5,9-14 intel_pstate=disable nosoftlockup
isolcpus=1-3,5,9-14 nohz=on nohz_full=1-3,5,9-14 intel_pstate=disable nosoftlockupscript.sh shell script specified in the [script] section of tuned.conf. The script adjusts the following entries of the sysfs virtual file system:
/sys/bus/workqueue/devices/writeback/cpumask/sys/devices/system/machinecheck/machinecheck*/ignore_ce
workqueue entry above is set to the inverse of the isolated CPUs mask, while the second entry turns off machine check exceptions.
/etc/sysctl.conf file:
kernel.hung_task_timeout_secs = 600
kernel.nmi_watchdog = 0
kernel.sched_rt_runtime_us = 1000000
vm.stat_interval = 10
kernel.hung_task_timeout_secs = 600
kernel.nmi_watchdog = 0
kernel.sched_rt_runtime_us = 1000000
vm.stat_interval = 10
tuna interface to move any non-bound thread on the isolated CPU numbers off of the isolated CPUs.
/usr/lib/tuned/realtime/script.sh and modify it, then change the tuned.conf JSON file to point to the modified script.
2.14. Reduce CPU Performance Spikes
skew_tick helps to smooth jitter on moderate to large systems with latency-sensitive applications running. A common source of latency spikes on a realtime Linux system is when multiple CPUs contend on common locks in the Linux kernel timer tick handler. The usual locks responsible for the contention are the xtime_lock, which is used by the timekeeping system, and the RCU (Read-Copy-Update) structure locks.
skew_tick=1 boot parameter reduces contention on these kernel locks. The parameter ensures that the ticks per CPU do not occur simultaneously by making their start times 'skewed'. Skewing the start times of the per-CPU timer ticks decreases the potential for lock conflicts, reducing system jitter for interrupt response times.
Chapter 3. Realtime-Specific Tuning
Important
3.1. Setting Scheduler Priorities
Warning
| Priority | Threads | Description |
|---|---|---|
1 | Low priority kernel threads | Priority 1 is usually reserved for those tasks that need to be just above SCHED_OTHER. |
2 - 49 | Available for use | The range used for typical application priorities |
50 | Default hard-IRQ value | |
51 - 98 | High priority threads | Use this range for threads that execute periodically and must have quick response times. Do not use this range for CPU-bound threads as you will starve interrupts. |
99 | Watchdogs and migration | System threads that must run at the highest priority |
Procedure 3.1. Using systemd to Set Priorities
- Priorities are set using a series of levels, ranging from
0(lowest priority) to99(highest priority). Thesystemdservice manager can be used to change the default priorities of threads following kernel boot.To view scheduling priorities of running threads, use the tuna utility:Copy to Clipboard Copied! Toggle word wrap Toggle overflow
3.1.1. Changing the priority of service during boot process
systemd makes it possible to set up real-time priority for services launched during the boot process.
- CPUSchedulingPolicy=
- Sets the CPU scheduling policy for executed processes. Takes one of the scheduling classes available on linux:
- other
- batch
- idle
- fifo
- rr
- CPUSchedulingPriority=
- Sets the CPU scheduling priority for executed processes. The available priority range depends on the selected CPU scheduling policy. For real-time scheduling policies, an integer between 1 (lowest priority) and 99 (highest priority) can be used.
Example 3.1. Changing the priority of the mcelog service
mcelog service. To change the priority of the mcelog service:
- Create a supplementary
mcelogservice configuration directory file at/etc/systemd/system/mcelog.system.d/priority.confas follows:cat <<-EOF > /etc/systemd/system/mcelog.system.d/priority.conf
# cat <<-EOF > /etc/systemd/system/mcelog.system.d/priority.confCopy to Clipboard Copied! Toggle word wrap Toggle overflow - Insert the following:
[SERVICE]
CPUSchedulingPolicy=fifo
CPUSchedulingPriority=20
EOF
[SERVICE]
CPUSchedulingPolicy=fifo
CPUSchedulingPriority=20
EOF
Copy to Clipboard Copied! Toggle word wrap Toggle overflow - Reload the
systemdscripts configuration:systemctl daemon-reload
# systemctl daemon-reloadCopy to Clipboard Copied! Toggle word wrap Toggle overflow - Restart the
mcelogservice:systemctl restart mcelog
# systemctl restart mcelogCopy to Clipboard Copied! Toggle word wrap Toggle overflow - Display the
mcelogpriority set bysystemdissue the following:tuna -t mcelog -P
$ tuna -t mcelog -PCopy to Clipboard Copied! Toggle word wrap Toggle overflow The output of this command should now be similar to the following:thread ctxt_switches pid SCHED_ rtpri affinity voluntary nonvoluntary cmd 826 FIFO 20 0,1,2,3 13 0 mcelog
thread ctxt_switches pid SCHED_ rtpri affinity voluntary nonvoluntary cmd 826 FIFO 20 0,1,2,3 13 0 mcelogCopy to Clipboard Copied! Toggle word wrap Toggle overflow
systemd unit configuration directives refer to the Modifying Existing Unit Files chapter of the System Administrator's Guide.
3.1.2. Configuring the CPU usage of a service
systemd makes it possible to specify which CPUs services are allowed to run on.
Example 3.2. Configuring the CPU usage of the mcelog service
mcelog service to run on CPUs 0 and 1:
- Create a supplementary
mcelogservice configuration directory file at/etc/systemd/system/mcelog.system.d/affinity.confas follows:cat <<-EOF > /etc/systemd/system/mcelog.system.d/affinity.conf
# cat <<-EOF > /etc/systemd/system/mcelog.system.d/affinity.confCopy to Clipboard Copied! Toggle word wrap Toggle overflow - Insert the following:
[SERVICE]
CPUAffinity=0,1
EOF
[SERVICE]
CPUAffinity=0,1
EOF
Copy to Clipboard Copied! Toggle word wrap Toggle overflow - Reload the
systemdscripts configuration:systemctl daemon-reload
# systemctl daemon-reloadCopy to Clipboard Copied! Toggle word wrap Toggle overflow - Restart the
mcelogservice:systemctl restart mcelog
# systemctl restart mcelogCopy to Clipboard Copied! Toggle word wrap Toggle overflow - Display which CPUs the
mcelogservice is restricted to:tuna -t mcelog -P
$ tuna -t mcelog -PCopy to Clipboard Copied! Toggle word wrap Toggle overflow The output of this command should now be similar to the following:thread ctxt_switches pid SCHED_ rtpri affinity voluntary nonvoluntary cmd 12954 FIFO 20 0,1 2 1 mcelog
thread ctxt_switches pid SCHED_ rtpri affinity voluntary nonvoluntary cmd 12954 FIFO 20 0,1 2 1 mcelogCopy to Clipboard Copied! Toggle word wrap Toggle overflow
systemd unit configuration directives, refer to the Modifying Existing Unit Files chapter of the System Administrator's Guide.
3.2. Using kdump and kexec with the Red Hat Enterprise Linux for Real Time Kernel
kexec to boot into a second kernel whenever the system crashes. This second kernel, often called the crash kernel, boots with very little memory and captures the dump image.
kdump kernel into the reserved space. When a kernel panic or other fatal error occurs, kexec is used to boot into the kdump kernel without going through BIOS. The system reboots to the kdump kernel that is confined to the memory space reserved by the standard boot kernel, and this kernel writes a copy or image of the system memory to the storage mechanism defined in the configuration files. Because kexec does not go through the BIOS, the memory of the original boot is retained, and the crash dump is much more detailed. Once this is done, the kernel reboots, which resets the machine and brings the boot kernel back up.
rt-setup-kdump tool. Third, use a graphical system configuration tool called system-config-kdump to create and enable a detailed kdump configuration.
Installing Required kdump Packages
Thert-setup-kdumptool is part of the rt-setup package. You also need kexec-tools and system-config-kdump:yum install rt-setup kexec-tools system-config-kdump
~]# yum install rt-setup kexec-tools system-config-kdumpCopy to Clipboard Copied! Toggle word wrap Toggle overflow Creating a Basic kdump Kernel with
rt-setup-kdump- Run the
rt-setup-kdumptool asroot:rt-setup-kdump --grub
~]# rt-setup-kdump --grubCopy to Clipboard Copied! Toggle word wrap Toggle overflow The--grubparameter adds the necessary changes to all the real-time kernel entries listed in the GRUB configuration. - Restart the system to set up the reserved memory space. You can then turn on the kdump init script and start the kdump service:
systemctl enable kdump
systemctl start kdump
~]# systemctl enable kdump
~]# systemctl start kdump
Copy to Clipboard Copied! Toggle word wrap Toggle overflow
Enabling kdump with
system-config-kdump- Select the system tool from the → menu, or use the following command at the shell prompt:
system-config-kdump
~]# system-config-kdumpCopy to Clipboard Copied! Toggle word wrap Toggle overflow - The Kernel Dump Configuration window displays. On the toolbar, click the button labeled . The Red Hat Enterprise Linux for Real Time kernel supports the
crashkernel=autoparameter which automatically calculates the amount of memory necessary to accommodate the kdump kernel.By design, on Red Hat Enterprise Linux 7 systems with less than 4GB of RAM, thecrashkernel=autodoes not reserve any memory for the kdump kernel. In this case, it is necessary to manually set the amount of memory required. You can do so by entering your required value in the New kdump memory field on the Basic Settings tab:
Note
An alternative way of allocating memory for the kdump kernel is by manually setting thecrashkernel=<value>parameter in the GRUB configuration. - Click the Target Settings tab, and specify the target location for your dump file. It can be either stored as a file in a local file system, written directly to a device, or sent over a network using the NFS (Network File System) or SSH (Secure Shell) protocol.
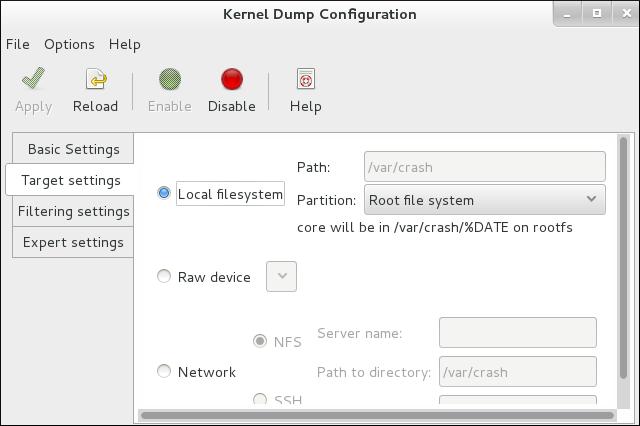 To save your settings, click the button on the toolbar.
 - Reboot the system to ensure that kdump is properly started. If you want to check that the kdump is working correctly, you can simulate a panic using
sysrq:echo c > /proc/sysrq-trigger
~]# echo c > /proc/sysrq-triggerCopy to Clipboard Copied! Toggle word wrap Toggle overflow This will cause the kernel to panic, and the system will boot into the kdump kernel. Once your system has been brought back up, you can check the log file at the specified location.
Note
/etc/sysconfig/kdump file and add reset_devices=1 to the KDUMP_COMMANDLINE_APPEND variable.
Important
irq 9: nobody cared (try booting with the "irqpoll" option) handlers:
[<ffffffff811660a0>] (acpi_irq+0x0/0x1b)
turning off IO-APIC fast mode.
irq 9: nobody cared (try booting with the "irqpoll" option) handlers:
[<ffffffff811660a0>] (acpi_irq+0x0/0x1b)
turning off IO-APIC fast mode.
acpi=noirq as a boot parameter to the kdump kernel. Only add this line if this error occurs as it can cause boot problems on machines not affected by this issue.
For more information, or for further reading, the following man page is related to the information given in this section.
- kexec(8)
/etc/kdump.conf
3.3. TSC Timer Synchronization on Opteron CPUs
gettimeofday skew. This skew occurs when both cpufreq and the Time Stamp Counter (TSC) are in use. Red Hat Enterprise Linux for Real Time provides a method to prevent this skew by forcing all processors to simultaneously change to the same frequency. As a result, the TSC on a single processor never increments at a different rate than the TSC on another processor.
Procedure 3.2. Enabling TSC Timer Synchronization
- Open the
/etc/default/grubfile in your preferred text editor and append the parametersclocksource=tsc powernow-k8.tscsync=1to theGRUB_CMDLINE_LINUXvariable. This forces the use of TSC and enables simultaneous core processor frequency transitions.GRUB_CMDLINE_LINUX="rd.md=0 rd.lvm=0 rd.dm=0 $([ -x /usr/sbin/rhcrashkernel-param ] && /usr/sbin/rhcrashkernel-param || :) rd.luks=0 vconsole.keymap=us rhgb quiet clocksource=tsc powernow-k8.tscsync=1"
GRUB_CMDLINE_LINUX="rd.md=0 rd.lvm=0 rd.dm=0 $([ -x /usr/sbin/rhcrashkernel-param ] && /usr/sbin/rhcrashkernel-param || :) rd.luks=0 vconsole.keymap=us rhgb quiet clocksource=tsc powernow-k8.tscsync=1"Copy to Clipboard Copied! Toggle word wrap Toggle overflow - You will need to restart your system for the changes to take effect.
For more information, or for further reading, the following man page is related to the information given in this section.
- gettimeofday(2)
3.4. Infiniband
Note
3.5. RoCEE and High Performance Networking
Note
3.6. Non-Uniform Memory Access
taskset Utility” the taskset utility only works on CPU affinity and has no knowledge of other NUMA resources such as memory nodes. If you want to perform process binding in conjunction with NUMA, use the numactl command instead of taskset.
For more information, or for further reading, the following man pages are related to the information given in this section.
- numactl(8)
3.7. Reducing the TCP Delayed ACK Timeout
- Quick ACK
- This mode is used at the start of a TCP connection so that the congestion window can grow quickly.
- The acknowledgment (ACK) timeout interval (ATO) is set to
tcp_ato_min, the minimum timeout value. - To change the default TCP ACK timeout value, write the required value in milliseconds to the
/proc/sys/net/ipv4/tcp_ato_minfile:echo 4 > /proc/sys/net/ipv4/tcp_ato_min
~]# echo 4 > /proc/sys/net/ipv4/tcp_ato_minCopy to Clipboard Copied! Toggle word wrap Toggle overflow
- Delayed ACK
- After the connection is established, TCP assumes this mode, in which ACKs for multiple received packets can be sent in a single packet.
- ATO is set to
tcp_delack_minto restart or reset the timer. - To change the default TCP Delayed ACK value, write the required value in milliseconds to the
/proc/sys/net/ipv4/tcp_delack_minfile:echo 4 > /proc/sys/net/ipv4/tcp_delack_min
~]# echo 4 > /proc/sys/net/ipv4/tcp_delack_minCopy to Clipboard Copied! Toggle word wrap Toggle overflow
tcp_ato_min and tcp_delack_min timeouts are now 4 ms by default.
Note
3.8. Using debugfs
debugfs file system is specially designed for debugging and making information available to users. It must be mounted for use with ftrace and trace-cmd, and it is mounted automatically in Red Hat Enterprise Linux 7 under the /sys/kernel/debug/ directory.
debugfs is mounted by running the following command:
mount | grep ^debugfs
~]# mount | grep ^debugfs3.9. Using the ftrace Utility for Tracing Latencies
ftrace, which is used by developers to analyze and debug latency and performance issues that occur outside of user-space. The ftrace utility has a variety of options that allow you to use the utility in a number of different ways. It can be used to trace context switches, measure the time it takes for a high-priority task to wake up, the length of time interrupts are disabled, or list all the kernel functions executed during a given period.
ftrace utility can be set up once the trace variant of the Red Hat Enterprise Linux for Real Time kernel is installed and in use.
Procedure 3.3. Using the ftrace Utility
- In the
/sys/kernel/debug/tracing/directory, there is a file namedavailable_tracers. This file contains all the available tracers forftrace. To see the list of available tracers, use thecatcommand to view the contents of the file:~]# cat /sys/kernel/debug/tracing/available_tracers function_graph wakeup_rt wakeup preemptirqsoff preemptoff irqsoff function nop
~]# cat /sys/kernel/debug/tracing/available_tracers function_graph wakeup_rt wakeup preemptirqsoff preemptoff irqsoff function nopCopy to Clipboard Copied! Toggle word wrap Toggle overflow The user interface forftraceis a series of files withindebugfs. Theftracefiles are also located in the/sys/kernel/debug/tracing/directory. Enter it:cd /sys/kernel/debug/tracing
~]# cd /sys/kernel/debug/tracingCopy to Clipboard Copied! Toggle word wrap Toggle overflow The files in this directory can only be modified by therootuser, as enabling tracing can have an impact on the performance of the system.Ftrace FilesThe main files within this directory are:
trace- The file that shows the output of a ftrace trace. This is really a snapshot of the trace in time, as it stops tracing as this file is read, and it does not consume the events read. That is, if the user disabled tracing and read this file, it will always report the same thing every time its read.
trace_pipe- Like "trace" but is used to read the trace live. It is a producer / consumer trace, where each read will consume the event that is read. But this can be used to see an active trace without stopping the trace as it is read.
available_tracers- A list of ftrace tracers that have been compiled into the kernel.
current_tracer- Enables or disables a ftrace tracer.
events- A directory that contains events to trace and can be used to enable or disable events as well as set filters for the events.
tracing_on- Disable and enable recording to the ftrace buffer. Disabling tracing via the
tracing_onfile does not disable the actual tracing that is happening inside the kernel. It only disables writing to the buffer. The work to do the trace still happens, but the data does not go anywhere.
TracersDepending on how the kernel was configured, not all tracers may be available for a given kernel. For the Red Hat Enterprise Linux for Real Time kernels, the trace and debug kernels have different tracers than the production kernel does. This is because some of the tracers have a noticeable overhead when the tracer is configured into the kernel but not active. Those tracers are only enabled for the trace and debug kernels.
function- One of the most widely applicable tracers. Traces the function calls within the kernel. Can cause noticeable overhead depending on the quantity of functions traced. Creates little overhead when not active.
function_graph- The
function_graphtracer is designed to present results in a more visually appealing format. This tracer also traces the exit of the function, displaying a flow of function calls in the kernel.Note that this tracer has more overhead than thefunctiontracer when enabled, but the same low overhead when disabled. wakeup- A full CPU tracer that reports the activity happening across all CPUs. Records the time that it takes to wake up the highest priority task in the system, whether that task is a real time task or not. Recording the max time it takes to wake up a non real time task will hide the times it takes to wake up a real time task.
wakeup_rt- A full CPU tracer that reports the activity happening across all CPUs. Records the time that it takes from the current highests priority task to wake up to the time it is scheduled. Only records the time for real time tasks.
preemptirqsoff- Traces the areas that disable pre-emption or interrupts, and records the maximum amount of time for which pre-emption or interrupts were disabled.
preemptoff- Similar to the
preemptirqsofftracer but traces only the maximum interval for which pre-emption was disabled. irqsoff- Similar to the
preemptirqsofftracer but traces only the maximum interval for which interrupts were disabled. nop- The default tracer. It does not provide any tracing facility itself, but as events may interleave into any tracer, the
noptracer is used for specific interest in tracing events.
- To manually start a tracing session, first select the tracer you wish to use from the list in
available_tracersand then use theechocommand to insert the name of the tracer into/sys/kernel/debug/tracing/current_tracer:echo preemptoff > /sys/kernel/debug/tracing/current_tracer
~]# echo preemptoff > /sys/kernel/debug/tracing/current_tracerCopy to Clipboard Copied! Toggle word wrap Toggle overflow - To check if
functionandfunction_graphtracing is enabled, use thecatcommand to view the/sys/kernel/debug/tracing/options/function-tracefile. A value of1indicates that this is enabled, and0indicates that it has been disabled.~]# cat /sys/kernel/debug/tracing/options/function-trace 1
~]# cat /sys/kernel/debug/tracing/options/function-trace 1Copy to Clipboard Copied! Toggle word wrap Toggle overflow By default,functionandfunction_graphtracing is enabled. To turn this feature on or off,echothe appropriate value to the/sys/kernel/debug/tracing/options/function-tracefile.echo 0 > /sys/kernel/debug/tracing/options/function-trace echo 1 > /sys/kernel/debug/tracing/options/function-trace
~]# echo 0 > /sys/kernel/debug/tracing/options/function-trace
~]# echo 1 > /sys/kernel/debug/tracing/options/function-trace
Copy to Clipboard Copied! Toggle word wrap Toggle overflow Important
When using theechocommand, ensure you place a space character in between the value and the>character. At the shell prompt, using0>, 1>, and 2>(without a space character) refers to standard input, standard output and standard error. Using them by mistake could result in unexpected trace output.Thefunction-traceoption is useful because tracing latencies withwakeup_rt,preemptirqsoffand so on automatically enables function tracing, which may exaggerate the overhead. - Adjust details and parameters of the tracers by changing the values for the various files in the
/debugfs/tracing/directory. Some examples are:The irqsoff, preemptoff, preempirqsoff, and wakeup tracers continuously monitor latencies. When they record a latency greater than the one recorded intracing_max_latencythe trace of that latency is recorded, andtracing_max_latencyis updated to the new maximum time. In this way,tracing_max_latencywill always show the highest recorded latency since it was last reset.To reset the maximum latency,echo0into thetracing_max_latencyfile. To see only latencies greater than a set amount,echothe amount in microseconds:echo 0 > /sys/kernel/debug/tracing/tracing_max_latency
~]# echo 0 > /sys/kernel/debug/tracing/tracing_max_latencyCopy to Clipboard Copied! Toggle word wrap Toggle overflow When the tracing threshold is set, it overrides the maximum latency setting. When a latency is recorded that is greater than the threshold, it will be recorded regardless of the maximum latency. When reviewing the trace file, only the last recorded latency is shown.To set the threshold,echothe number of microseconds above which latencies must be recorded:echo 200 > /sys/kernel/debug/tracing/tracing_thresh
~]# echo 200 > /sys/kernel/debug/tracing/tracing_threshCopy to Clipboard Copied! Toggle word wrap Toggle overflow - View the trace logs:
cat /sys/kernel/debug/tracing/trace
~]# cat /sys/kernel/debug/tracing/traceCopy to Clipboard Copied! Toggle word wrap Toggle overflow - To store the trace logs, copy them to another file:
cat /sys/kernel/debug/tracing/trace > /tmp/lat_trace_log
~]# cat /sys/kernel/debug/tracing/trace > /tmp/lat_trace_logCopy to Clipboard Copied! Toggle word wrap Toggle overflow - Function tracing can be filtered by altering the settings in the
/sys/kernel/debug/tracing/set_ftrace_filterfile. If no filters are specified in the file, all functions are traced. Use thecatto view the current filters:cat /sys/kernel/debug/tracing/set_ftrace_filter
~]# cat /sys/kernel/debug/tracing/set_ftrace_filterCopy to Clipboard Copied! Toggle word wrap Toggle overflow - To change the filters,
echothe name of the function to be traced. The filter allows the use of a*wildcard at the beginning or end of a search term.The*wildcard can also be used at both the beginning and end of a word. For example:*irq*will select all functions that containirqin the name. The wildcard cannot, however, be used inside a word.Encasing the search term and the wildcard character in double quotation marks ensures that the shell will not attempt to expand the search to the present working directory.Some examples of filters are:- Trace only the
schedulefunction:echo schedule > /sys/kernel/debug/tracing/set_ftrace_filter
~]# echo schedule > /sys/kernel/debug/tracing/set_ftrace_filterCopy to Clipboard Copied! Toggle word wrap Toggle overflow - Trace all functions that end with
lock:echo "*lock" > /sys/kernel/debug/tracing/set_ftrace_filter
~]# echo "*lock" > /sys/kernel/debug/tracing/set_ftrace_filterCopy to Clipboard Copied! Toggle word wrap Toggle overflow - Trace all functions that start with
spin_:echo "spin_*" > /sys/kernel/debug/tracing/set_ftrace_filter
~]# echo "spin_*" > /sys/kernel/debug/tracing/set_ftrace_filterCopy to Clipboard Copied! Toggle word wrap Toggle overflow - Trace all functions with
cpuin the name:echo "*cpu*" > /sys/kernel/debug/tracing/set_ftrace_filter
~]# echo "*cpu*" > /sys/kernel/debug/tracing/set_ftrace_filterCopy to Clipboard Copied! Toggle word wrap Toggle overflow
Note
If you use a single>with theechocommand, it will override any existing value in the file. If you wish to append the value to the file, use>>instead.
3.10. Latency Tracing Using trace-cmd
trace-cmd is a front-end tool to ftrace. It can enable the ftrace interactions described earlier without needing to write into the /sys/kernel/debug/tracing/ directory. It can be installed without the special tracing kernel variants, and it does not add any overhead when it is installed.
- To install the
trace-cmdtool, enter the following command asroot:yum install trace-cmd
~]# yum install trace-cmdCopy to Clipboard Copied! Toggle word wrap Toggle overflow - To start the utility, type
trace-cmdat the shell prompt, along with the options you require, using the following syntax:trace-cmd command
~]# trace-cmd commandCopy to Clipboard Copied! Toggle word wrap Toggle overflow Some examples of commands are:trace-cmd record -p function myapp
~]# trace-cmd record -p function myappCopy to Clipboard Copied! Toggle word wrap Toggle overflow Enable and start recording functions executing within the kernel while myapp runs. It records functions from all CPUS and all tasks, even those not related to myapp.trace-cmd report
~]# trace-cmd reportCopy to Clipboard Copied! Toggle word wrap Toggle overflow Display the result.trace-cmd record -p function -l 'sched*' myapp
~]# trace-cmd record -p function -l 'sched*' myappCopy to Clipboard Copied! Toggle word wrap Toggle overflow Record only functions that start withschedwhile myapp runs.trace-cmd start -e irq
~]# trace-cmd start -e irqCopy to Clipboard Copied! Toggle word wrap Toggle overflow Enable all the IRQ events.trace-cmd start -p wakeup_rt
~]# trace-cmd start -p wakeup_rtCopy to Clipboard Copied! Toggle word wrap Toggle overflow Start thewakeup_rttracer.trace-cmd start -p preemptirqsoff -d
~]# trace-cmd start -p preemptirqsoff -dCopy to Clipboard Copied! Toggle word wrap Toggle overflow Start thepreemptirqsofftracer but disable function tracing in doing so. Note: the version of trace-cmd in Red Hat Enterprise Linux 7 turns offftrace_enabledinstead of using thefunction-traceoption. You can enable it again withtrace-cmd start -p function.trace-cmd start -p nop
~]# trace-cmd start -p nopCopy to Clipboard Copied! Toggle word wrap Toggle overflow Restore the state in which the system was before trace-cmd started modifying it. This is important if you want to use the debugfs file system after using trace-cmd, whether or not the system was restarted in the meantime.
Note
See the trace-cmd(1) man page for a complete list of commands and options. All the individual commands also have their own man pages, trace-cmd-command. For further information about event tracing and function tracer, see Appendix A, Event Tracing and Appendix B, Detailed Description of Ftrace. - In this example, the
trace-cmdutility will trace a single trace point:trace-cmd record -e sched_wakeup ls /bin
~]# trace-cmd record -e sched_wakeup ls /binCopy to Clipboard Copied! Toggle word wrap Toggle overflow
3.11. Using sched_nr_migrate to Limit SCHED_OTHER Task Migration.
SCHED_OTHER task spawns a large number of other tasks, they will all run on the same CPU. The migration task or softirq will try to balance these tasks so they can run on idle CPUs. The sched_nr_migrate option can be set to specify the number of tasks that will move at a time. Because real-time tasks have a different way to migrate, they are not directly affected by this, however when softirq moves the tasks it locks the run queue spinlock that is needed to disable interrupts. If there are a large number of tasks that need to be moved, it will occur while interrupts are disabled, so no timer events or wakeups will happen simultaneously. This can cause severe latencies for real-time tasks when the sched_nr_migrate is set to a large value.
Procedure 3.4. Adjusting the Value of the sched_nr_migrate Variable
- Increasing the
sched_nr_migratevariable gives high performance fromSCHED_OTHERthreads that spawn lots of tasks, at the expense of real-time latencies. For low real-time task latency at the expense ofSCHED_OTHERtask performance, the value must be lowered. The default value is 8. - To adjust the value of the
sched_nr_migratevariable, you canechothe value directly to/proc/sys/kernel/sched_nr_migrate:echo 2 > /proc/sys/kernel/sched_nr_migrate
~]# echo 2 > /proc/sys/kernel/sched_nr_migrateCopy to Clipboard Copied! Toggle word wrap Toggle overflow
3.12. Real Time Throttling
The two real-time scheduling policies in Red Hat Enterprise Linux for Real Time share one main characteristic: they run until they are preempted by a higher priority thread or until they "wait", either by sleeping or performing I/O. In the case of SCHED_RR, a thread may be preempted by the operating system so that another thread of equal SCHED_RR priority may run. In any of these cases, no provision is made by the POSIX specifications that define the policies for allowing lower priority threads to get any CPU time.
SCHED_FIFO thread, it cannot perform the housekeeping tasks and eventually the entire system becomes unstable, potentially causing a crash.
SCHED_FIFO priority (default: 50). A cpu-hog thread with a SCHED_FIFO or SCHED_RR policy higher than the interrupt handler threads can prevent interrupt handlers from running and cause programs waiting for data signaled by those interrupts to be starved and fail.
Red Hat Enterprise Linux for Real Time comes with a safeguard mechanism that allows the system administrator to allocate bandwith for use by real-time tasks. This safeguard mechanism is known as real-time scheduler throttling and is controlled by two parameters in the /proc file system:
/proc/sys/kernel/sched_rt_period_us- Defines the period in μs (microseconds) to be considered as 100% of CPU bandwidth. The default value is 1,000,000 μs (1 second). Changes to the value of the period must be very well thought out as a period too long or too small are equally dangerous.
/proc/sys/kernel/sched_rt_runtime_us- The total bandwidth available to all real-time tasks. The default values is 950,000 μs (0.95 s) or, in other words, 95% of the CPU bandwidth. Setting the value to -1 means that real-time tasks may use up to 100% of CPU times. This is only adequate when the real-time tasks are well engineered and have no obvious caveats such as unbounded polling loops.
SCHED_OTHER and similar scheduling policies). It is important to note that if a single real-time task occupies that 95% CPU time slot, the remaining real-time tasks on that CPU will not run. The remaining 5% of CPU time is used only by non-realtime tasks.
the RT_RUNTIME_GREED feature
RT_RUNTIME_GREED with the following command:
echo RT_RUNTIME_GREED > /sys/kernel/debug/sched_features
# echo RT_RUNTIME_GREED > /sys/kernel/debug/sched_featuresNO_RT_RUNTIME_SHARE logic:
echo NO_RT_RUNTIME_SHARE > /sys/kernel/debug/sched_features
# echo NO_RT_RUNTIME_SHARE > /sys/kernel/debug/sched_featuresFrom the kernel documentation, which is available in the kernel-rt-doc package:
/usr/share/doc/kernel-rt-doc-3.10.0/Documentation/scheduler/sched-rt-group.txt
3.13. Isolating CPUs Using tuned-profiles-realtime
- removing all user-space threads;
- removing any unbound kernel threads (bound kernel threads are tied to a specific CPU and may not be moved);
- removing interrupts by modifying the
/proc/irq/N/smp_affinityproperty of each Interrupt Request (IRQ) number N in the system.
isolated_cores=cpulist configuration option of the tuned-profiles-realtime package.
Choosing CPUs to Isolate
- If you have a multi-threaded application where threads need to communicate with one another by sharing cache, then they may need to be kept on the same NUMA node or physical socket.
- If you run multiple unrelated real-time applications, then separating the CPUs by NUMA node or socket may be suitable.
lstopo-no-graphics and numactl:
- To show the layout of available CPUs in physical packages, use the
lstopo-no-graphics --no-io --no-legend --of txtcommand:
Figure 3.1. Showing the layout of CPUs using
lstopo-no-graphicsThe above command is useful for multi-threaded applications, because it shows how many cores and sockets are available and the logical distance of the NUMA nodes.Additionally, the hwloc-gui package provides thelstopocommand, which produces graphical output. - For further information about the CPUs, such as the distance between nodes, use the
numactl --hardwarecommand:Copy to Clipboard Copied! Toggle word wrap Toggle overflow
hwloc(7) manpage.
Isolating CPUs Using tuned's isolated_cores Option
isolcpus=cpulist on the kernel boot command line. The recommended way to do this for Red Hat Enterprise Linux for Real Time is to use the tuned daemon and its tuned-profiles-realtime package.
isolcpus boot parameter, follow these steps:
- Install the tuned package and the tuned-profiles-realtime package:
yum install tuned tuned-profiles-realtime
~]# yum install tuned tuned-profiles-realtimeCopy to Clipboard Copied! Toggle word wrap Toggle overflow - In file
/etc/tuned/realtime-variables.conf, set the configuration optionisolated_cores=cpulist, where cpulist is the list of CPUs that you want to isolate. The list is separated with commas and can contain single CPU numbers or ranges, for example:isolated_cores=0-3,5,7
isolated_cores=0-3,5,7Copy to Clipboard Copied! Toggle word wrap Toggle overflow The above line would isolate CPUs 0, 1, 2, 3, 5, and 7.Example 3.3. Isolating CPUs with Communicating threads
In a two socket system with 8 cores, where NUMA node zero has cores 0-3 and NUMA node one has cores 4-7, to allocate two cores for a multi-threaded application, add this line:isolated_cores=4,5
isolated_cores=4,5Copy to Clipboard Copied! Toggle word wrap Toggle overflow Once thetuned-profiles-realtimeprofile is activated, theisolcpus=4,5parameter will be added to the boot command line. This will prevent any user-space threads from being assigned to CPUs 4 and 5.Example 3.4. Isolating CPUs with Non-communicating threads
If you wanted to pick CPUs from different NUMA nodes for unrelated applications, you could specify:isolated_cores=0,4
isolated_cores=0,4Copy to Clipboard Copied! Toggle word wrap Toggle overflow This would prevent any user-space threads from being assigned to CPUs 0 and 4. - Activate the
tunedprofile using thetuned-admutility and then reboot:tuned-adm profile realtime reboot
~]# tuned-adm profile realtime
~]# reboot
Copy to Clipboard Copied! Toggle word wrap Toggle overflow - Upon reboot, verify that the selected CPUs have been isolated by searching for the
isolcpusparameter at the boot command line:~]$ cat /proc/cmdline | grep isolcpus BOOT_IMAGE=/vmlinuz-3.10.0-394.rt56.276.el7.x86_64 root=/dev/mapper/rhel_foo-root ro crashkernel=auto rd.lvm.lv=rhel_foo/root rd.lvm.lv=rhel_foo/swap console=ttyS0,115200n81 isolcpus=0,4
~]$ cat /proc/cmdline | grep isolcpus BOOT_IMAGE=/vmlinuz-3.10.0-394.rt56.276.el7.x86_64 root=/dev/mapper/rhel_foo-root ro crashkernel=auto rd.lvm.lv=rhel_foo/root rd.lvm.lv=rhel_foo/swap console=ttyS0,115200n81 isolcpus=0,4Copy to Clipboard Copied! Toggle word wrap Toggle overflow
Isolating CPUs Using the nohz and nohz_full Parameters
nohz and nohz_full kernel boot parameters, you need to use one of the following profiles: realtime-virtual-host, realtime-virtual-guest, or cpu-partitioning.
- nohz=on
- May be used to reduce timer activity on a particular set of CPUs. The
nohzparameter is mainly used to reduce timer interrupts happening on idle CPUs. This helps battery life by allowing the idle CPUs to run in reduced power mode. While not being directly useful for real-time response time, thenohzparameter does not directly hurt real-time response time and is required to activate the next parameter which *does* have positive implications for real-time performance. - nohz_full=cpulist
- The
nohz_fullparameter is used to treat a list of CPUs differently, with respect to timer ticks. If a CPU is listed as a nohz_full CPU and there is only one runnable task on the CPU, then the kernel will stop sending timer ticks to that CPU, so more time may be spent running the application and less time spent servicing interrupts and context switching.
3.14. Offloading RCU Callbacks
rcu_nocbs and rcu_nocb_poll kernel parameters.
- To remove one or more CPUs from the candidates for running RCU callbacks, specify the list of CPUs in the
rcu_nocbskernel parameter, for example:rcu_nocbs=1,4-6
rcu_nocbs=1,4-6Copy to Clipboard Copied! Toggle word wrap Toggle overflow orrcu_nocbs=3
rcu_nocbs=3Copy to Clipboard Copied! Toggle word wrap Toggle overflow The second example instructs the kernel that CPU 3 is a no-callback CPU. This means that RCU callbacks will not be done in thercuc/$CPUthread pinned to CPU 3, but in thercuo/$CPUthread, which can be moved to a housekeeping CPU, relieving CPU 3 from doing RCU callbacks job.To move RCU callback threads to the housekeeping CPU, use thetuna -t rcu* -c X -mcommand, where X denotes the housekeeping CPU. For example, in a system where CPU 0 is the housekeeping CPU, all RCU callback threads can be moved to CPU 0 using this command:tuna -t rcu* -c 0 -m
~]# tuna -t rcu* -c 0 -mCopy to Clipboard Copied! Toggle word wrap Toggle overflow This relieves all CPUs other than CPU 0 from doing RCU work. - Although the RCU offload threads can perform the RCU callbacks on another CPU, each CPU is responsible for awakening the corresponding RCU offload thread. To relieve each CPU from the responsibility of awakening their RCU offload threads, set the
rcu_nocb_pollkernel parameter:rcu_nocb_poll
rcu_nocb_pollCopy to Clipboard Copied! Toggle word wrap Toggle overflow Withrcu_nocb_pollset, the RCU offload threads will be periodically raised by a timer to check if there are callbacks to run.
- Using
rcu_nocbs=cpulistto allow the user to move all RCU offload threads to a housekeeping CPU; - Setting
rcu_nocb_pollto relieve each CPU from the responsibility awakening their RCU offload threads.
Chapter 4. Application Tuning and Deployment
Note
For further reading on developing your own Red Hat Enterprise Linux for Real Time applications, start by reading the RTWiki Article.
4.1. Signal Processing in Real-time Applications
For more information, or for further reading, the following links are related to the information given in this section.
4.2. Using sched_yield and Other Synchronization Mechanisms
sched_yield system call is used by a thread allowing other threads a chance to run. Often when sched_yield is used, the thread can go to the end of the run queues, taking a long time to be scheduled again, or it can be rescheduled straight away, creating a busy loop on the CPU. The scheduler is better able to determine when and if there are actually other threads wanting to run. Avoid using sched_yield on any RT task.
For more information, or for further reading, the following man pages are related to the information given in this section.
- pthread.h(P)
- sched_yield(2)
- sched_yield(3p)
4.3. Mutex Options
Procedure 4.1. Standard Mutex Creation
Note
- When you initialize a
pthread_mutex_tobject with the standard attributes, it will create a private, non-recursive, non-robust and non priority inheritance capable mutex. - Under pthreads, mutexes can be initialized with the following strings:
pthread_mutex_t my_mutex;

pthread_mutex_init(&my_mutex, NULL);
pthread_mutex_t my_mutex;

pthread_mutex_init(&my_mutex, NULL);
Copy to Clipboard Copied! Toggle word wrap Toggle overflow - In this case, your application will not benefit from the advantages provided by the pthreads API and the Red Hat Enterprise Linux for Real Time kernel. There are a number of mutex options that must be considered when writing or porting an application.
Procedure 4.2. Advanced Mutex Options
pthread_mutexattr_t object. This object will store the defined attributes for the futex.
Important
- Creating the mutex object:
Copy to Clipboard Copied! Toggle word wrap Toggle overflow - Shared and Private mutexes:Shared mutexes can be used between processes, however they can create a lot more overhead.
pthread_mutexattr_setpshared(&my_mutex_attr, PTHREAD_PROCESS_SHARED);
pthread_mutexattr_setpshared(&my_mutex_attr, PTHREAD_PROCESS_SHARED);Copy to Clipboard Copied! Toggle word wrap Toggle overflow - Real-time priority inheritance:Priority inversion problems can be avoided by using priority inheritance.
pthread_mutexattr_setprotocol(&my_mutex_attr, PTHREAD_PRIO_INHERIT);
pthread_mutexattr_setprotocol(&my_mutex_attr, PTHREAD_PRIO_INHERIT);Copy to Clipboard Copied! Toggle word wrap Toggle overflow - Robust mutexes:Robust mutexes are released when the owner dies, however this can also come at a high overhead cost.
_NPin this string indicates that this option is non-POSIX or not portable.pthread_mutexattr_setrobust_np(&my_mutex_attr, PTHREAD_MUTEX_ROBUST_NP);
pthread_mutexattr_setrobust_np(&my_mutex_attr, PTHREAD_MUTEX_ROBUST_NP);Copy to Clipboard Copied! Toggle word wrap Toggle overflow - Mutex initialization:Once the attributes are set, initialize a mutex using those properties.
pthread_mutex_init(&my_mutex, &my_mutex_attr);
pthread_mutex_init(&my_mutex, &my_mutex_attr);Copy to Clipboard Copied! Toggle word wrap Toggle overflow - Cleaning up the attributes object:After the mutex has been created, you can keep the attribute object in order to initialize more mutexes of the same type, or you can clean it up. The mutex is not affected in either case. To clean up the attribute object, use the
_destroycommand.pthread_mutexattr_destroy(&my_mutex_attr);
pthread_mutexattr_destroy(&my_mutex_attr);Copy to Clipboard Copied! Toggle word wrap Toggle overflow The mutex will now operate as a regularpthread_mutex, and can be locked, unlocked and destroyed as normal.
For more information, or for further reading, the following man pages are related to the information given in this section.
- futex(7)
- pthread_mutex_destroy(P)For information on
pthread_mutex_tandpthread_mutex_init - pthread_mutexattr_setprotocol(3p)For information on
pthread_mutexattr_setprotocolandpthread_mutexattr_getprotocol - pthread_mutexattr_setprioceiling(3p)For information on
pthread_mutexattr_setprioceilingandpthread_mutexattr_getprioceiling
4.4. TCP_NODELAY and Small Buffer Writes
Procedure 4.3. Using TCP_NODELAY and TCP_CORK to Improve Network Latency
- Applications that require lower latency on every packet sent must be run on sockets with
TCP_NODELAYenabled. It can be enabled through thesetsockoptcommand with the sockets API:int one = 1; setsockopt(descriptor, SOL_TCP, TCP_NODELAY, &one, sizeof(one));
# int one = 1;

# setsockopt(descriptor, SOL_TCP, TCP_NODELAY, &one, sizeof(one));
Copy to Clipboard Copied! Toggle word wrap Toggle overflow - For this to be used effectively, applications must avoid doing small, logically related buffer writes. Because
TCP_NODELAYis enabled, these small writes will make TCP send these multiple buffers as individual packets, which can result in poor overall performance.If applications have several buffers that are logically related, and are to be sent as one packet, it is possible to build a contiguous packet in memory and then send the logical packet to TCP on a socket configured withTCP_NODELAY.Alternatively, create an I/O vector and pass it to the kernel usingwritevon a socket configured withTCP_NODELAY. - Another option is to use
TCP_CORK, which tells TCP to wait for the application to remove the cork before sending any packets. This command will cause the buffers it receives to be appended to the existing buffers. This allows applications to build a packet in kernel space, which can be required when using different libraries that provides abstractions for layers. To enableTCP_CORK, set it to a value of1using thesetsockoptsockets API (this is known as "corking the socket"):int one = 1; setsockopt(descriptor, SOL_TCP, TCP_CORK, &one, sizeof(one));
# int one = 1;

# setsockopt(descriptor, SOL_TCP, TCP_CORK, &one, sizeof(one));
Copy to Clipboard Copied! Toggle word wrap Toggle overflow - When the logical packet has been built in the kernel by the various components in the application, tell TCP to remove the cork. TCP will send the accumulated logical packet right away, without waiting for any further packets from the application.
int zero = 0;

setsockopt(descriptor, SOL_TCP, TCP_CORK, &zero, sizeof(zero));
# int zero = 0;

# setsockopt(descriptor, SOL_TCP, TCP_CORK, &zero, sizeof(zero));
Copy to Clipboard Copied! Toggle word wrap Toggle overflow
For more information, or for further reading, the following man pages are related to the information given in this section.
- tcp(7)
- setsockopt(3p)
- setsockopt(2)
4.5. Setting Real-time Scheduler Priorities
systemd to set scheduler priorities is described in Procedure 3.1, “Using systemd to Set Priorities”. In the example given in that procedure, some kernel threads could have been given a very high priority. This is to have the default priorities integrate well with the requirements of the Real Time Specification for Java (RTSJ). RTSJ requires a range of priorities from 10 to 89.
Generally, only root users are able to change priority and scheduling information. If you require non-privileged users to be able to adjust these settings, the best method is to add the user to the realtime group.
Important
/etc/security/limits.conf file. This has a potential for duplication and can render the system unusable for regular users. If you do decide to edit this file, exercise caution and always create a copy before making changes.
4.6. Loading Dynamic Libraries
LD_BIND_NOW variable with ld.so, the dynamic linker/loader.
LD_BIND_NOW variable with a value of 1, then runs a program with a scheduler policy of FIFO and a priority of 1.
For more information, or for further reading, the following man pages are related to the information given in this section.
- ld.so(8)
4.7. Using _COARSE POSIX Clocks for Application Timestamping
clock_gettime() function to produce clock readings with the lowest cost possible.
POSIX clocks is a standard for implementing and representing time sources. The POSIX clocks can be selected by each application, without affecting other applications in the system. This is in contrast to the hardware clocks as described in Section 2.6, “Using Hardware Clocks for System Timestamping”, which is selected by the kernel and implemented across the system.
clock_gettime(), which is defined at <time.h>. clock_gettime() has a counterpart in the kernel, in the form of a system call. When the user process calls clock_gettime(), the corresponding C library (glibc) calls the sys_clock_gettime() system call which performs the requested operation and then returns the result to the user program.
CLOCK_MONOTONIC_COARSE and CLOCK_REALTIME_COARSE POSIX clocks was created in the form of a VDSO library function.
clock_gettime(), using one of the _COARSE clock variants, do not require kernel intervention and are executed entirely in user space, which yields a significant performance gain. Time readings for _COARSE clocks have a millisecond (ms) resolution, meaning that time intervals smaller than 1ms will not be recorded. The _COARSE variants of the POSIX clocks are suitable for any application that can accommodate millisecond clock resolution, and the benefits are more evident on systems which use hardware clocks with high reading costs.
Note
_COARSE prefix, see the Red Hat Enterprise Linux for Real Time Reference guide for Red Hat Enterprise Linux for Real Time.
Example 4.1. Using the _COARSE Clock Variant in clock_gettime
clock_gettime(), to verify the value of the rc variable, or to ensure the content of the ts structure is to be trusted. The clock_gettime() manpage provides more information to help you write more reliable applications.
Important
clock_gettime() function must be linked with the rt library by adding '-lrt' to the gcc command line.
gcc clock_timing.c -o clock_timing -lrt
~]$ gcc clock_timing.c -o clock_timing -lrtFor more information, or for further reading, the following man page and books are related to the information given in this section.
- clock_gettime()
- Linux System Programming by Robert Love
- Understanding The Linux Kernel by Daniel P. Bovet and Marco Cesati
4.8. About Perf
perf_events interface exported by the kernel.
root:
yum install perf
~]# yum install perfperf help COMMAND.
Example 4.2. Example of perf Options
Example 4.3. Perf Record
perf record -a
^C[ perf record: Woken up 1 times to write data ]
[ perf record: Captured and wrote 0.725 MB perf.data (~31655 samples) ]
~]# perf record -a
^C[ perf record: Woken up 1 times to write data ]
[ perf record: Captured and wrote 0.725 MB perf.data (~31655 samples) ]
-a, and the process was terminated after a few seconds. The results show that it collected 0.725 MB of data, and created the following file of results.
ls
perf.data
~]# ls
perf.data
Example 4.4. Example of the Perf Report and Archive Features
record feature can now be directly investigated using the perf report commands. If the samples are to be analyzed on a different system, use the perf archive command. This will not always be necessary as the DSOs (such as binaries and libraries) may already be present in the analysis system, such as the ~/.debug/ cache or if both systems have the same set of binaries.
perf archive
~]# perf archivereport.
tar xvf perf.data.tar.bz2 -C ~/.debug
~]# tar xvf perf.data.tar.bz2 -C ~/.debugreport to analyze the tarball.
perf report
~]# perf report[kernel.kallsyms]. If a kernel sample is taking place in the kernel module, it will be marked as [module], [ext4]. For a process in user space, the results might show the shared library linked with the process.
[.] indicates user space and [k] indicates kernel space. Finer grained details are available for review, including data appropriate for experienced perf developers.
Example 4.5. Example of the Perf List and Stat Features
stat feature.
for i in {1..100}; do touch /tmp/$i; sleep 1; done
~]# for i in {1..100}; do touch /tmp/$i; sleep 1; donestat feature.
list feature.
Important
Chapter 5. More Information
5.1. Reporting Bugs
Before you file a bug report, follow these steps to diagnose where the problem has been introduced. This will greatly assist in rectifying the problem.
- Check that you have the latest version of the Red Hat Enterprise Linux 7 kernel, then boot into it from the GRUB menu. Try reproducing the problem with the standard kernel. If the problem still occurs, report a bug against Red Hat Enterprise Linux 7.
- If the problem does not occur when using the standard kernel, then the bug is probably the result of changes introduced in the Red Hat Enterprise Linux for Real Time specific enhancements Red Hat has applied on top of the baseline (3.10.0) kernel.
If you have determined that the bug is specific to Red Hat Enterprise Linux for Real Time follow these instructions to enter a bug report:
- Create a Bugzilla account if you do not have it yet..
- Click on Enter A New Bug Report. Log in if necessary.
- Select the
Red Hatclassification. - Select the
Red Hat Enterprise Linux 7product. - If it is a kernel issue, enter
kernel-rtas the component. Otherwise, enter the name of the affected user-space component, such astrace-cmd. - Continue to enter the bug information by giving a detailed problem description. When entering the problem description be sure to include details of whether you were able to reproduce the problem on the standard Red Hat Enterprise Linux 7 kernel.
Appendix A. Event Tracing
Appendix B. Detailed Description of Ftrace
Appendix C. Revision History
| Revision History | |||
|---|---|---|---|
| Revision 1-8 | Tue Sep 29 2020 | ||
| |||
| Revision 1-7 | Tue Mar 31 2020 | ||
| |||
| Revision 1-6 | Tue Aug 6 2019 | ||
| |||
| Revision 1-5 | Fri Oct 19 2018 | ||
| |||
| Revision 1-4 | Mon Mar 26 2018 | ||
| |||
| Revision 1-3 | Tue Jul 25 2017 | ||
| |||
| Revision 1-2 | Mon Nov 3 2016 | ||
| |||
| Revision 1-1 | Fri Nov 06 2015 | ||
| |||
| Revision 1-0 | Fri Feb 13 2015 | ||
| |||