Management Console User Guide
Red Hat JBoss Fuse
Managing your environment from the Web
Version 6.2
Copyright © 2011-2015 Red Hat, Inc. and/or its affiliates.
26 Sep 2017
Abstract
The [Fuse Management Console User Guide] describes the Fuse Management Console user interface and the tasks you can perform to manage containers and fabrics. This guide assumes that you are familiar with Red Hat JBoss Fuse components, Apache components, and the processing requirements for your organization.
Part I. Introduction
Copy linkLink copied to clipboard!
Chapter 1. Fuse Management Console Overview
Copy linkLink copied to clipboard!
Overview
Copy linkLink copied to clipboard!
The Fuse Management Console provides a central interface to manage and configure Fuse entities. You can use the Fuse Management Console to configure and deploy containers, Apache ActiveMQ brokers, and fabrics. You also monitor JBoss Fuse and system resources, perform updates, and start or stop services.
The Fuse Management Console is available by default when you install Red Hat JBoss Fuse, and must be accessed using a web browser.
User interface overview
Copy linkLink copied to clipboard!
The Management Console consists of the following areas:
- Welcome Page
- Introduction to the Management Console and help topics.
- Menu Bar
- Global and user options. The Menu bar contains the following options:
Expand Option Description 
Opens the logging console in a drop-down pane. 
Opens the Welcome page and shows the wiki help. Admin > Preferences Opens the Preferences page. Use the page to configure global options for the user. Admin > Log Out Logs out of the Management Console. Admin > About Opens the About page that shows version information. - Container Perspective
- Container management options. The actual areas depend on the container features and bundles. The Container perspective can contain the following options:
Expand Option Description ActiveMQ Tree view and details of running Apache ActiveMQ brokers. This page is available only when you connect to a container with an ActiveMQ profile. Camel Tree view and details of running Apache Camel routes. This page is available only when you connect to a container with a Camel profile. Connect Connection page to a remote server or a local JVM with a running Jolokia agent. Dashboard Overview of the Management Console status, services status, and system performance. You can add views to the dashboard and create additional dashboards. If you create or join a fabric, this toolbar option is not available. Use the Dashboard page in the Fabric perspective to view information for all containers in the fabric. For more information, see Dashboard Page. Health List and status of running health mbeans. This page shows any available container health mbeans. If you create or join a fabric, this toolbar option is not available. For more information, see Health Page. JMX Tree view of the JMX domains and mbeans. You can view details and execute commands on the mbeans. Logs List of log entries. Use this page to view activity details and error messages. Maven Search for Maven repositories using either a simple search or an advanced search with more parameters. This page is only available if the hawtio-maven-indexerfeature has been installed.OSGi Detailed view of the JBoss Fuse OSGi environment. Use this page to manage bundles, features and configurations, and view details of Java packages and OSGi services. Red Hat Access Gain access to the Red Hat Customer Portal. Sign in to the Red Hat Customer Portal to search the Knowledge Base, Open a new support case, or list existing support cases. You can also use this page to use the Log File Viewer. Terminal Emulator view of the Karaf console. Use this page to run JBoss Fuse commands in the same way you run commands in the Karaf console. Threads List of active threads and stack trace details for each thread. Wiki Explorer view of the fabric configuration repository and wiki content. The repository contains files that affect the behavior of the fabric during runtime. This toolbar option is available only if you create or join a fabric, and opens the Wiki page in the Fabric perspective. For more information, see Wiki Page. - Fabric Perspective
- Fabric management options. Available only if you create or join a fabric. The Fabric perspective contains the following options:
Expand Option Description Containers View the containers available on this instance of Fuse. Start/Stop, Delete or Create containers. Click the container name to get more information about each container. Profiles Lists the profiles available to this instance of Fuse. Click Details... to get more details of each profile. You can deploy selected profiles to a new container, assign selected profiles to existing container, or add requirements to selected profiles. Wiki Explorer view of the fabric configuration repository and wiki content. The repository contains files that affect the behavior of the fabric during runtime. Services View the services available on Fuse. Stop or start containers, edit profiles and administer services. Scaling Increase or decrease the number of required instances of a profile and review the effect on the health of the profile. You can also set up SSH or Docker Configurations. Dashboard Overview of the Management Console status, services status, and system performance. You can add views to the dashboard and create additional dashboards. Health List and status of running fabric and container health mbeans. For more information, see Health Page.
Chapter 2. Accessing the Management Console
Copy linkLink copied to clipboard!
Prerequisites
Copy linkLink copied to clipboard!
To access the Management Console, you must start JBoss Fuse and configure user credentials.
Note
If you use JBoss Fuse on OpenShift, you can skip this task and access the Management Console directly with the JBoss Fuse application URL after you deploy the JBoss Fuse cartridge. For more information about how to get started with JBoss Fuse on OpenShift, see the Cloud Computing with Fabric book for this release of JBoss Fuse.
To configure user credentials and start JBoss Fuse:
- In the command line, navigate to the directory in which you installed JBoss Fuse and run the following command:
./fuseThe Karaf console starts and shows version information, the default Management Console URL, and a list of common commands. - If no user exists for JBoss Fuse, you can create one by running thecommand. You can also define the user name and password directly in the
esb:create-admin-useretc/users.propertiesfile. For more information, see the Red Hat JBoss Fuse Installation Guide.
Accessing the Management Console
Copy linkLink copied to clipboard!
To access the Management Console:
- In a Web browser, enter the URL to connect to the Management Console in the following format:
http://<host_name>:<port_number>NoteFor a list of supported browsers, see access.redhat.com.For example, use the following default URL to connect to the Management Console locally:http://localhost:8181NoteYou can configure the pax-web property to support HTTPS connections for a specific container.See chapter "Securing the Jetty HTTP Server" in "Security Guide" for more details. - In the login page, enter the user name and password and click .If you created or joined a fabric, the Management Console opens to the Fabric perspective. Otherwise, only the Container perspective is available. By default, the Management Console shows the Welcome page. You can choose to hide the Welcome page at the bottom of the page.
Chapter 3. Securing the Management Console
Copy linkLink copied to clipboard!
Overview
Copy linkLink copied to clipboard!
There are two main aspects to securing the Management Console:
- Authentication
- SSL/TLS security
Authentication
Copy linkLink copied to clipboard!
Authentication is enabled by default on the Management Console and is required in order for the Management Console to function correctly. The authentication mechanism consists of the following key elements:
- HTTP BASIC authentication protocol—the standard HTTP protocol for transferring username/password credentials is the BASIC authentication protocol. This protocol sends username/password credentials in plaintext, so these credentials are vulnerable to snooping, unless you enable SSL/TLS security.
- JAAS authentication—the Java Authentication and Authorization Service (JAAS) is a pluggable framework for authenticating credentials on the server side. The Jetty servlet container (which hosts the Management Console) is configured to use the
karafJAAS realm by default. This ensures that the Management Console uses the same pool of user credentials as the other standard container services (where the user credentials are usually stored in theetc/users.propertiesfile by default, in a standalone container).
SSL/TLS security
Copy linkLink copied to clipboard!
SSL/TLS security is not enabled by default for the Management Console. It is recommended that you enable SSL/TLS security on the Management Console to protect username/password credentials from snooping. For detailed instructions on how to enable SSL/TLS security, please see the following reference:
Part II. Container Management
Copy linkLink copied to clipboard!
Abstract
You use the Fuse Management Console to deploy containers to a fabric and manage container properties. You can manage properties for each container such as the JMX domains, versions, and hosts. You can also review log entries and monitor system status and performance while the container runs.
Chapter 4. Container Perspective
Copy linkLink copied to clipboard!
Overview
Copy linkLink copied to clipboard!
When you log in to the Management Console, you use the Container perspective to configure and monitor runtime information about a specific container. By detault, the Container perspective shows information about the root container. You can also select and connect to any container from the Fabric perspective.
Toolbar
Copy linkLink copied to clipboard!
The Container perspective contains a toolbar that you use to manage and monitor container components. The actual areas depend on the container features and bundles and whether the container is deployed to a fabric. The toolbar can contain the following options:
| Option | Description |
|---|---|
| ActiveMQ | Tree view and details of running Apache ActiveMQ brokers. This page is available only when you connect to a container with an ActiveMQ profile. |
| Camel | Tree view and details of running Apache Camel routes. This page is available only when you connect to a container with a Camel profile. |
| Connect | Connection page to a remote server or a local JVM with a running Jolokia agent. |
| Dashboard | Overview of the Management Console status, services status, and system performance. You can add views to the dashboard and create additional dashboards. If you create or join a fabric, this toolbar option is not available. Use the Dashboard page in the Fabric perspective to view information for all containers in the fabric. For more information, see Dashboard Page. |
| Health | List and status of running health mbeans. This page shows any available container health mbeans. If you create or join a fabric, this toolbar option is not available. Use the Health page in the Fabric perspective to view fabric and container health mbeans. For more information, see Health Page. |
| JMX | Tree view of the JMX domains and mbeans. You can view details and execute commands on the mbeans. |
| Logs | List of log entries. Use this page to view activity details and error messages. |
| OSGi | Detailed view of the JBoss Fuse OSGi environment. Use this page to manage bundles, features and configurations, and view details of Java packages and OSGi services. |
| Terminal | Emulator view of the Karaf console. Use this page to run JBoss Fuse commands in the same way you run commands in the Karaf console. |
| Threads | List of active threads and stack trace details for each thread. |
| Wiki | Explorer view of the fabric configuration repository and wiki content. The repository contains files that affect the behavior of the fabric during runtime. This toolbar option is available only if you create or join a fabric, and opens the Wiki page in the Fabric perspective. For more information, see Wiki Page. |
Chapter 5. Managing Containers
Copy linkLink copied to clipboard!
Overview
Copy linkLink copied to clipboard!
You can create, edit, and delete a container from the Fabric perspective of the Management Console. The type of container you create depends on the purpose and location of the container.
You can create a child container, a cloud container, or an ssh container. If you create a cloud container, make sure you have the credentials to your cloud account. If you create an ssh container, make sure you have the remote host properties.
If you do not create or join a fabric, you must use the Karaf console to create the container and use the Container perspective to view and manage container properties. See Red Hat JBoss Fuse Console Reference for Karaf Console commands.
Creating a container
Copy linkLink copied to clipboard!
Depending on the location from which you create the container, the Management Console auto-fills one or more container properties. For example, if you create a container for an existing profile from the Wiki page, the profile name appears in the Selected Profiles list.
To create a container:
- To create a container, navigate to one of the pages from which you can create a container and click the button to open the Create New Container page. You can create containers from the following pages:
- The Container page
- The Services > Container page
- The Services > MQ page
- Set the container properties, such as the name and user credentials to use when JBoss Fuse runs the container.
- Click the button to save the container. The Containers page opens and shows the container name and status. It may take some time to download and assign all the container features and dependencies.NoteIf you create an OpenShift container, the container also appears as an application on the OpenShift applications page.
Editing container properties
Copy linkLink copied to clipboard!
You can access the Container Details page from multiple areas in the Fabric perspective of the Management Console, amongst which are:
- The Container page
- The Services > Container page
To edit a container, click the container name and edit the container properties in the Container Details page. If you added or removed profiles, bundles, or other components, the Management Console shows the progress of the changes and the state of the container.
Deleting one or more containers
Copy linkLink copied to clipboard!
You can delete containers from the Containers page or the Services > Containers page.
To delete containers, select one or more containers from the list and click the Delete button.
Chapter 6. Managing JMS Queues and Messages
Copy linkLink copied to clipboard!
Overview
Copy linkLink copied to clipboard!
You can create, edit, and delete message queues for JMS brokers from the ActiveMQ page of the Container perspective. You can also search for messages, move, and resend messages directly from the queue.
Creating a queue
Copy linkLink copied to clipboard!
- Connect to the container and open the ActiveMQ page.
- Select the top-level node in the tree and click the Create button in the toolbar. The details pane shows a text box and a type selector.
- Enter a name for the queue and make sure to select the Queue radio button. The queue appears in the Queue folder under the top-level node in the tree.
Managing queues and messages
Copy linkLink copied to clipboard!
When you select a queue from the Queue folder, the details pane shows a toolbar with the following options:
- Attributes
- Detailed information about the queue properties. You can click each property to show additional information about the property, such as description, type, and default value.
- Browse
- Grid view of all messages in the queue. You can select one or more messages to resend, move, or delete. You can also filter the message list according to properties such as the message ID, priority, type, custom header attributes, and message body.
- Send
- Composer window where you can create a message to send to the queue. You can format the message as JSON, plain text, Properties, or XML. You can also add header properties or choose message templates.
- Diagram
- Visual representation of broker components. You can choose to show or hide component types, such as queues, topics, profiles, or containers.
- Delete
- Options to purge or delete the queue. You can purge the queue to delete all messages without deleting the queue itself, or delete the queue including all messages and attributes.WarningDeleting and purging the queue cannot be undone.
- Operations
- List of possible operations that you can perform in the queue. To manually execute an operation, you click an operation and define parameters and conditions if exist for the operation.
- Chart
- Timeline representation of message processing in the queue. The timeline dynamically shows the message flow in real-time. You can edit the chart to determine which attributes to show in the chart.
Chapter 7. ActiveMQ Page
Copy linkLink copied to clipboard!
Abstract
You view and and manage Apache ActiveMQ brokers in the ActiveMQ page. You can view broker attributes, run commands, add destinations, and monitor broker status.
Overview
Copy linkLink copied to clipboard!
You access the ActiveMQ page from the Container perspective. This page is available only when you connect to a container that uses one or more ActiveMQ brokers.
The following image shows an example of the ActiveMQ page:

The ActiveMQ page contains the following sections:
- ActiveMQ Tree
- Tree view of running ActiveMQ brokers organized in folders. You can click a folder to show the folder contents, and select a topic, queue, or broker to show the details in the details pane.
- Toolbar
- Options to view attributes, run commands, and view or create charts for the selected entity. You can also add the current view to the dashboard and toggle full screen mode. If you select a topic, you can also manually send the message to an endpoint.
- Details Pane
- Detailed view of the selected entity. The contents of this pane depend on the toolbar option that you select. You can filter the details pane to show only values that match the text string that you enter.
Chapter 8. Camel Page
Copy linkLink copied to clipboard!
Abstract
You view and and manage Apache Camel routes and dependencies in the Camel page. You can view route attributes and source code, debug and trace the route, and monitor route status.
Overview
Copy linkLink copied to clipboard!
You access the Camel page from the Container perspective. This page is available only when you connect to a container that uses one or more Camel routes.
The following image shows an example of the Camel page:
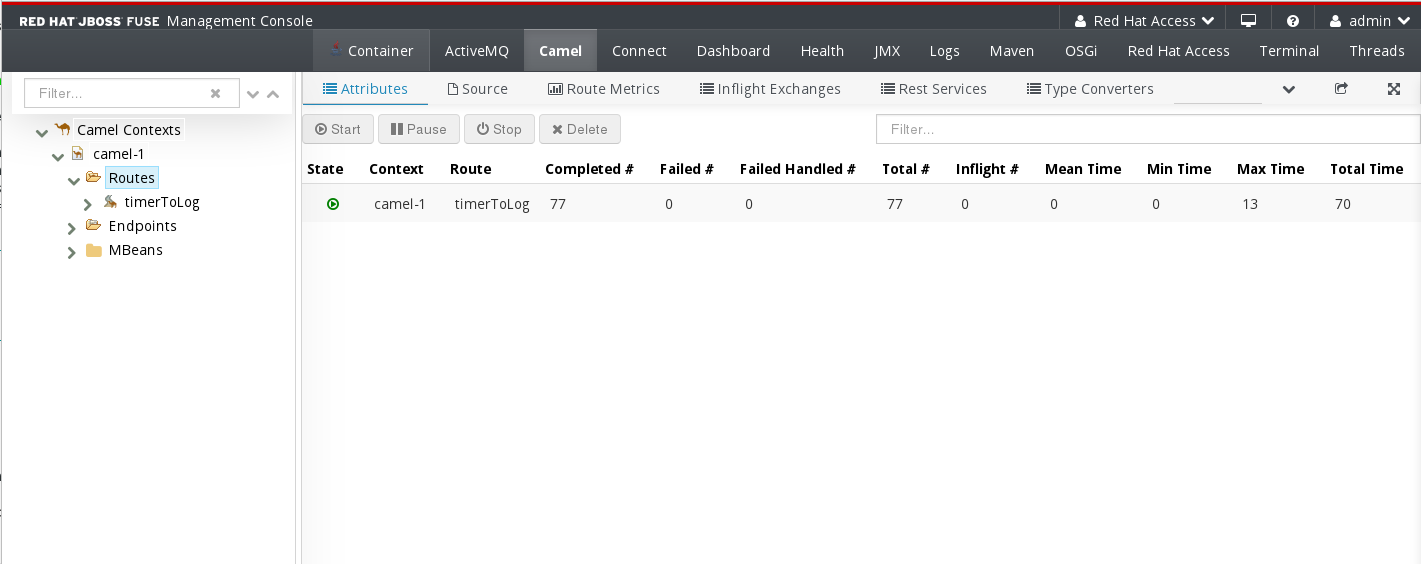
The Camel page contains the following sections:
- Camel Tree
- Tree view of running Camel routes and dependencies organized in folders. You can click a folder to show the folder contents, and select a route, endpoint, or mbean to show the details in the details pane.
- Toolbar
- Options to view attributes, run commands, and view or create charts for the selected entity. You can also add the current view to the dashboard and toggle full screen mode. If you select a route, you can also debug or trace messages through the route.
- Details Pane
- Detailed view of the selected entity. The contents of this pane depend on the toolbar option that you select. You can filter the details pane to show only values that match the text string that you enter.
Chapter 9. Connect Page
Copy linkLink copied to clipboard!
Abstract
You view and manage local and remote connections in the Connect page. You can connect to a remote server with a running jolokia agent, or connect to a local server if you have a local JVM with a jolokia agent.
For more information about Jolokia JMX agents, see the Jolokia Web site at the following address: http://www.jolokia.org/
Overview
Copy linkLink copied to clipboard!
You access the Connect page from the Container perspective. By default, this page opens to the Remote tab. If you have a local JVM with a jolokia agent, the Local tab also appears.
The following image shows an example of the Remote tab:
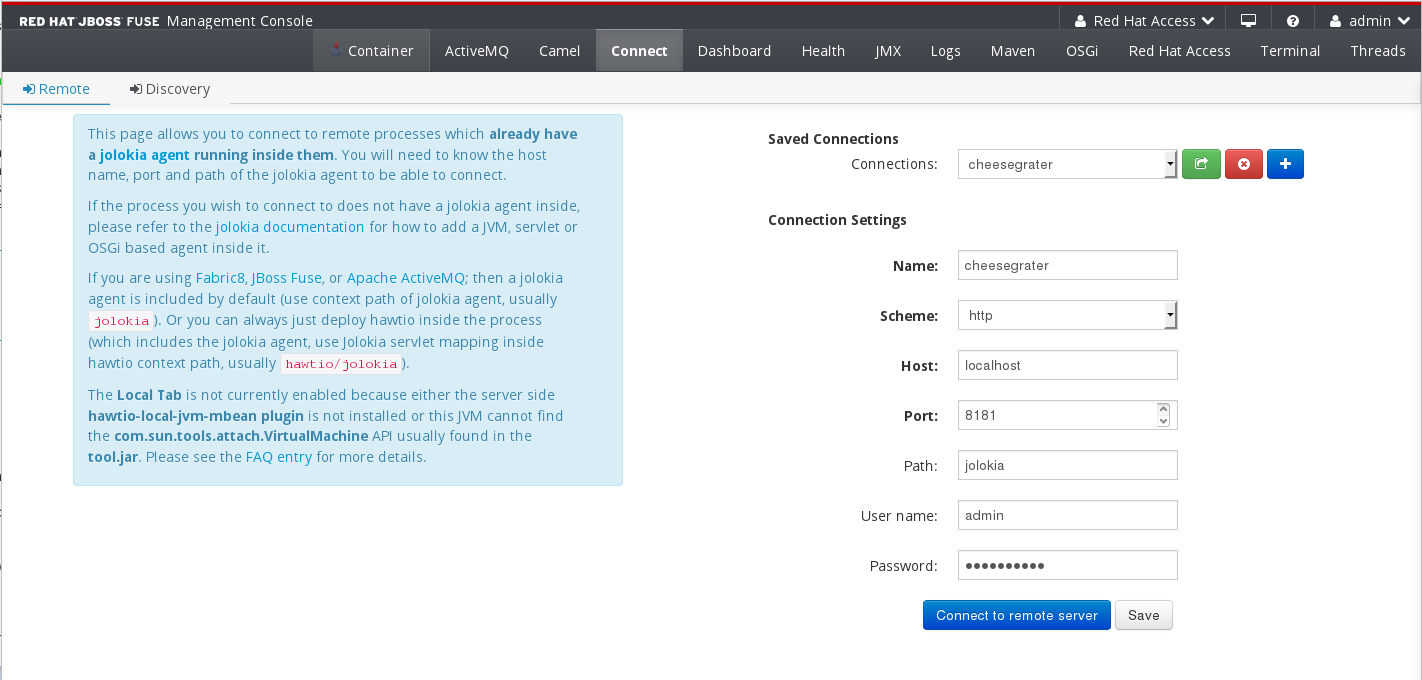
The Connect page contains the following sections:
- Navigation Bar
- Tabbed view of available connection types. The Remote tab always appears. If you have a local JVM with a jolokia agent, the Local tab also appears. Click the Discovery tab to automatically discover agents.
- Saved Connections List
- This is a drop-down list of default and custom connections. Select a connection from the list and perform the following operations by clicking on the buttons:
 to connect to the selected connection
 to delete the selected connection.
 to add a new connection.
- Connection Settings
- User credentials and connection properties, such as the connection name and host properties. When you save the connection a new browser window opens and connects to the remote server. If you select a saved connection you can edit the connection properties in this section.
Chapter 10. JMX Page
Copy linkLink copied to clipboard!
Abstract
You view and manage JMX domains and mbeans in the JMX page. You can view mbean attributes, run commands, and create charts that show statistics for the mbeans.
Overview
Copy linkLink copied to clipboard!
You access the JMX page from the Container perspective.
The following image shows an example of the JMX page:
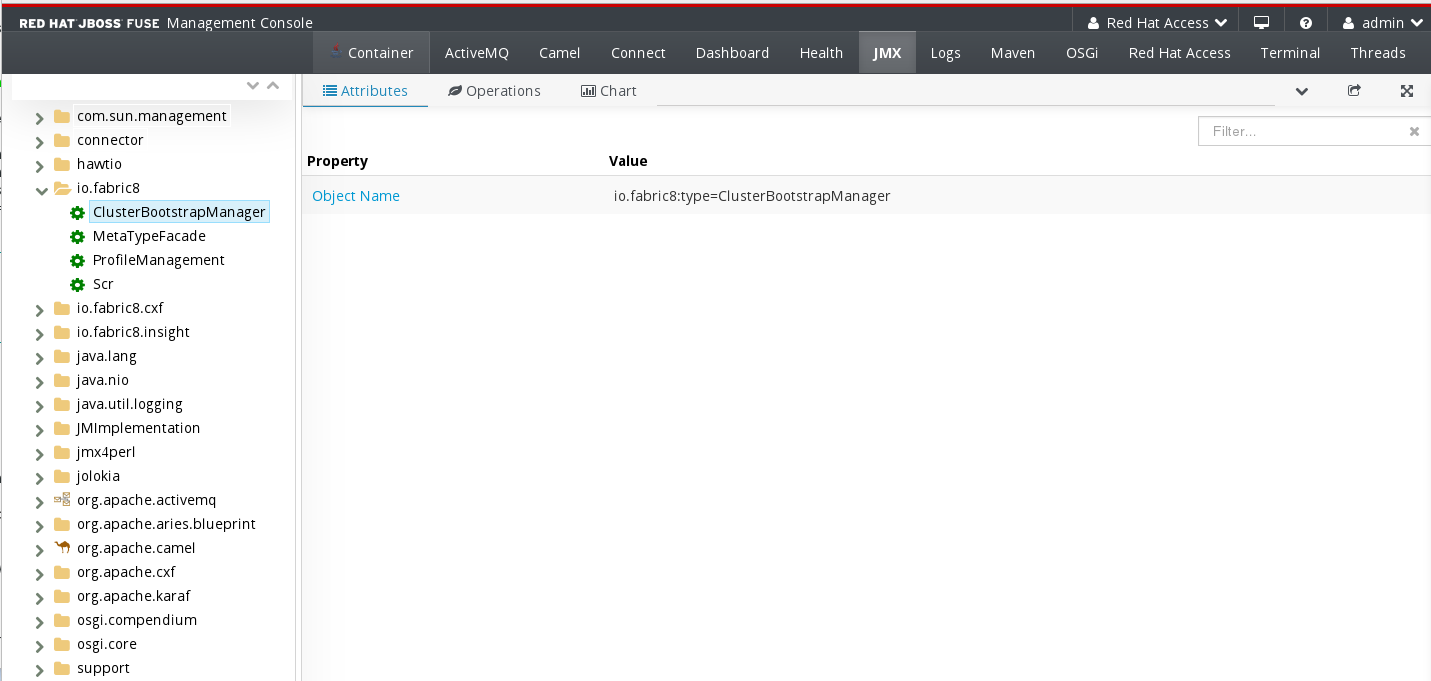
The JMX page contains the following sections:
- JMX Tree
- Tree view of the active JMX domains and mbeans organized in folders. You can click a folder to show the mbeans, and select an mbean to show the details in the details pane.
- Toolbar
- Options to view attributes, perform operations, and view or create charts for the selected mbean. You can also add the current view to the dashboard and toggle full screen mode. If you select a broker mbean, you can view additional information about the broker and manage durable subscribers.
- Details Pane
- Detailed view of the selected mbean. The contents of this pane depend on the toolbar option that you select. You can filter the details pane to show only values that match the text string that you enter.
Chapter 11. Logs Page
Copy linkLink copied to clipboard!
Abstract
You view log entries for JBoss Fuse in the Logs page. You can filter the page to show specific log types, and drill down to each log entry to view detailed information about the log entry.
Overview
Copy linkLink copied to clipboard!
You access the Logs page from the Container perspective.
The following image shows an example of the Logs page:
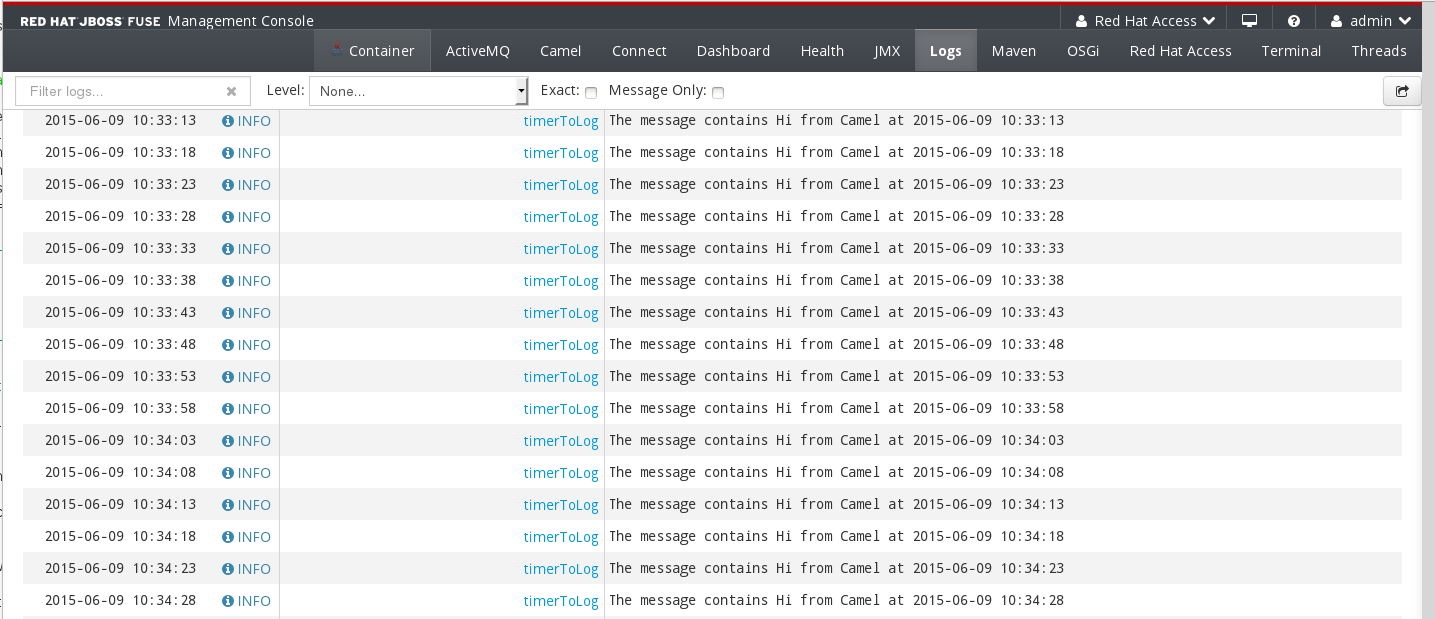
The Logs page contains the following sections:
- Action Bar
- Options to filter the log entries section according to a text string or the logging level. You can also add the current view to the dashboard.
- Log Entries
- List view of the log entries. By default, the list shows log entries in descending order. You can change the default sorting in the User > Preferences > Server Logs page. Click the log entry link to drill down to details about the log entry, such as the bundle name, thread, and the full message text.
Chapter 12. OSGi Page
Copy linkLink copied to clipboard!
Abstract
Use the OSGi page to view and manage the JBoss Fuse OSGi environment. You can view and manage container bundles, features, and configurations, as well as Java packages and OSGi services.
Overview
Copy linkLink copied to clipboard!
The OSGi page is accessed from the Container perspective. The page contains a toolbar with options for each container component.
The following image shows an example of the Bundles page:
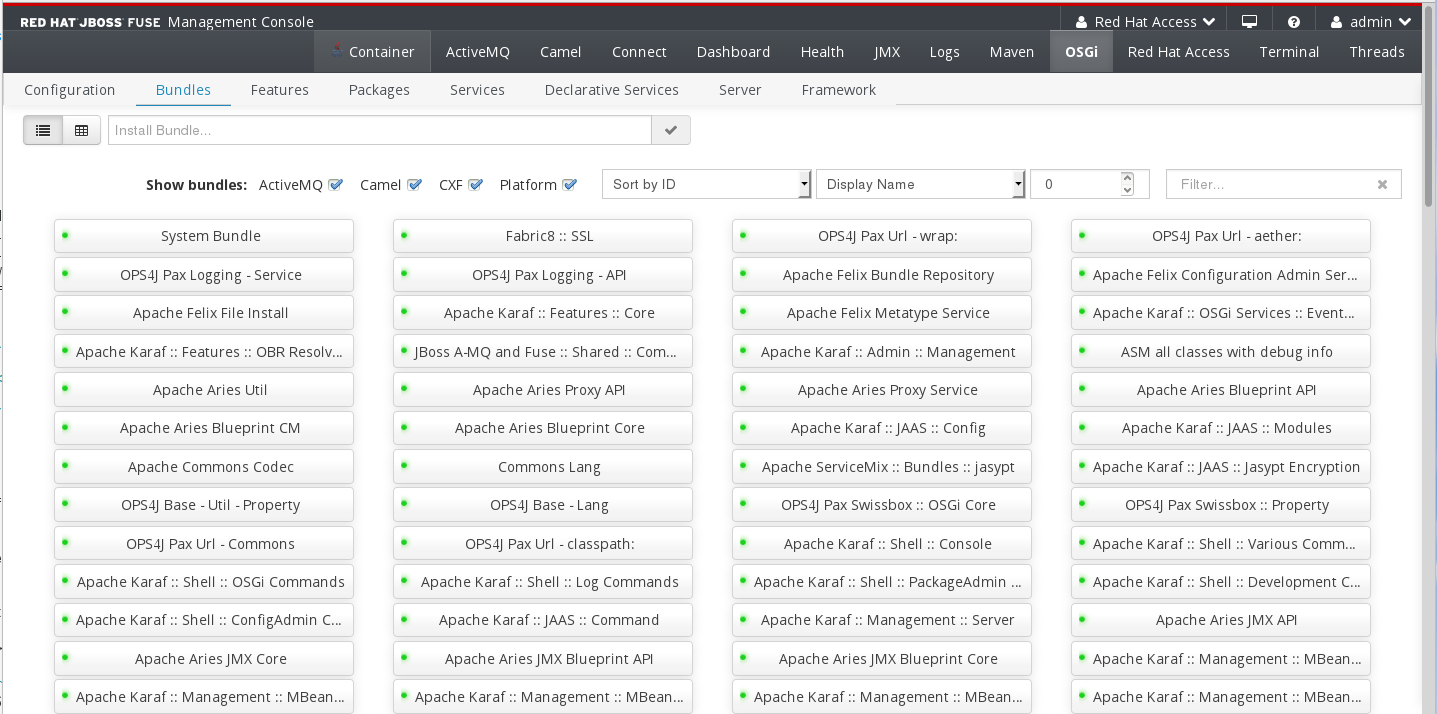
The OSGi page contains the following toolbar options:
- Configuration
- List of configuration objects. You can view the state of each object and drill down to view or edit object details. You can also create a new configuration object.
- Bundles
- List of installed bundles. You can install and uninstall bundles, start and stop bundles, and edit bundle properties. You can also filter the list and toggle between list and grid view.
- Features
- List of available features. You can install and uninstall features or feature repositories, and drill down to view feature details.
- Packages
- List of installed Java packages. You can view package versions and associated bundles.
- Services
- List of running services. You can view service IDs, associated bundles and object classes.
- Declarative Services
- List of declarative OSGi services. You can view the service state and drill down to view service details. You can also activate and deactivate services.
- Server
- Detailed information about the local or remote host in read-only mode.
- Framework
- Configuration options for the container OSGi framework. You can set the framework start level and the initial bundle start level.
Chapter 13. Threads Page
Copy linkLink copied to clipboard!
Abstract
You view and monitor the state of threads in the Threads page. You can filter the page to show threads by status, and drill down to each thread to view stack trace information about the thread.
Overview
Copy linkLink copied to clipboard!
You access the Threads page from the Container perspective.
The following image shows an example of the Threads page:
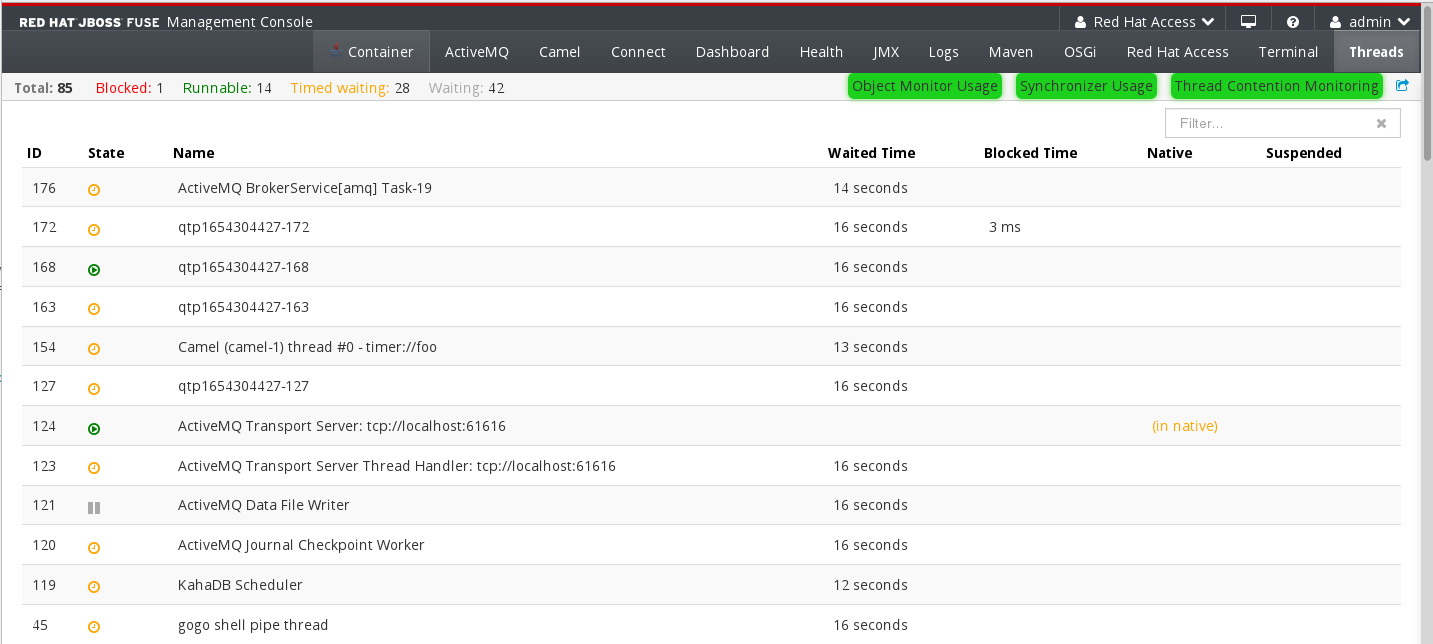
The Threads page contains the following sections:
- Filter
- Options to filter the thread list according to the thread state. You can click each state to filter the page, or click Total to show all threads. Each state shows the number of threads with that state. You can also enter a text string in the Filter box to show only thread names that match the text string.
- Thread List
- List view of active threads. By default, the thread list shows all threads in descending ID order. You can click each column header to sort the list by that column. You can also click each thread to drill down to detailed information, such as the lock class name and full stack trace for that thread.
Part III. Fabric Management
Copy linkLink copied to clipboard!
Abstract
You use the Fuse Management Console to deploy containers to a fabric and assign containers to profiles. You can start, stop, and connect to containers. You can also update container versions, manage profiles and dependencies, and monitor the system status and performance.
Chapter 14. Fabric Perspective
Copy linkLink copied to clipboard!
Overview
Copy linkLink copied to clipboard!
When you log in to the Management Console, you use the Fabric perspective to configure and manage containers, profiles, and general fabric properties.
Toolbar
Copy linkLink copied to clipboard!
The Fabric perspective contains a toolbar that you use to manage and monitor fabric areas. The toolbar contains the following buttons:
| Option | Description |
|---|---|
| Fabric | The Fabric tab has a drop down menu which enables you to select a Fabric perspective, or a container perspective. |
|
Containers
| This view shows all the containers available in the Fabric. |
|
Profiles
| This tab shows the profiles that are available to the Fabric. This page can be used to manage the profiles. |
| Wiki | Explorer view of the fabric configuration repository and wiki content. The repository contains files that affect the behavior of the fabric during runtime. |
| Services | This tab shows the services available to the Fabric. The options on this page include:
|
| Scaling | Increase or decrease the number of instances of a profile and reveiw the effect on the health of the profile. You can also set up SSH or Docker Configurations. |
| Dashboard | Overview of the Management Console status, services status, and system performance. You can add views to the dashboard and create additional dashboards. |
| Health | List and status of running health mbeans. This page shows any available container or fabric health mbeans. |
Chapter 15. Creating or Joining a Fabric
Copy linkLink copied to clipboard!
Overview
Copy linkLink copied to clipboard!
To view and manage fabric properties, you must create or join a fabric. You create or join a fabric from the Karaf console. Before you create or join a fabric, make sure that JBoss Fuse is running and that your system is connected to the network.
Creating or joining a fabric
Copy linkLink copied to clipboard!
You create or join a fabric from the Karaf console or from the Terminal page in the Container perspective of the Management Console. You use the same command syntax in the Karaf console and the Terminal page.
To create a fabric, run the following command:
fabric:create
The Karaf console shows the default zookeeper password to use when you access the fabric.
To join a fabric, run the following command:
fabric:join <zookeeper_URL> <container_name>
You can set optional arguments, such as the profile or the port range. For more information, see chapter "Creating a New Fabric" in "Fabric Guide".
Chapter 16. Managing Profiles
Copy linkLink copied to clipboard!
Overview
Copy linkLink copied to clipboard!
A profile is a set of instructions to use when you run containers in a fabric. For example, a profile might contain one or more bundles, features, or configuration objects that you want to assign to multiple containers.
JBoss Fuse provides a default set of profiles based on the distribution that you install. You must create or join a fabric before you can manage profiles. You can create, edit, and delete profiles. You can also add or remove features, bundles, or feature repositories from an existing profile.
Creating a Profile
Copy linkLink copied to clipboard!
- In the Wiki page, click the +Create icon. Select Fabric8 Profile from the list. Enter a name in the Name: field. The Name: field accepts a combination of letters, numbers, and the characters
.,-and_.To create a profile in an existing folder, click on the Wiki tab and drill down to the folder in which you want to create the profile. Click the +Create icon. - Enter a name for the profile. Use dash characters to create directory levels. Each dash character adds a level to the directory hierarchy. For example, if you enter
MyProfile-Profile1, the Management Console creates the directory MyProfile under the main profiles directory and creates the Profile1 in that directory.If you create a profile from an existing folder, you do not need to use the dash character to create a directory. The profile appears in the directory from which you create the profile. - If you want the profile to inherit features, bundles, or other configuration properties from one or more existing profiles, you have to change the parents of the profile. Click the edit icon underneath the parents section and select new parents from the list. Click the Change Parents button to apply your changes.
Editing a Profile
Copy linkLink copied to clipboard!
- In the Profiles tab or the Wiki page, click a profile name. A page will open showing profile details.
- Edit the profile properties and save the changes. The Management Console updates the profile properties and deploys the changes to any container to which you assigned the profile.
Deleting one or more profiles
Copy linkLink copied to clipboard!
- Click on the Wiki tab. A list of profiles will be shown.
- Select one or more profiles, then click on the Actions label. Select Delete to delete all the selected profiles.WarningDeleting a profile that is in use can have severe consequences for your system. Exercise extreme caution when deleting profiles.
Chapter 17. Assigning Profiles to Containers
Copy linkLink copied to clipboard!
Overview
Copy linkLink copied to clipboard!
You can assign one or more profiles to a container in a fabric. Each profile contains configuration information, such as features, bundles, or system properties. You must create or join a fabric before you can assign profiles to containers.
Creating a container with an assigned profile
Copy linkLink copied to clipboard!
- To create a new container, go to the Containers tab and click the + Create button. Alternatively, you can create a new container from the Services page by selecting + Create.

- In the Profiles section of the Create New Container page, click a folder to show the available profiles for that category or enter a filter string to search the profile list for a specific profile.
- Select one or more profiles and enter the container properties in the same way that you enter the container properties for a standalone container.
Assigning or removing a profile from an existing container
Copy linkLink copied to clipboard!
- Open the Containers tab or go to Services > Containers and select the container that you want to edit. The Container page shows a list of the assigned profiles.
- Choose whether to add or remove profiles from the container.
- To add profiles to the container, click the Add button and select one or more profiles from the list. You can add profiles based on the profiles that you already assigned to the container. For example, you cannot add a JON profile to a container that runs with a SOAP profile.
- To remove profiles from the container, select one or more profiles and click the Remove button. If you remove all profiles from a container, JBoss Fuse assigns the default profile to the container.
Assigning multiple profiles to multiple containers
Copy linkLink copied to clipboard!
- In the Profiles page, select one or more profiles by clicking on the name. A green tick will appear beside the name indicating that the profile has been selected.

- Click the Assign button. A list of available containers will be shown.
- Select one or more containers from the list. To select more than one container, hold down ctrl key when selecting the container.
- Click the Assign button to apply the selected profiles to the selected containers.
Chapter 18. Profiles Details Page
Copy linkLink copied to clipboard!
Overview
Copy linkLink copied to clipboard!
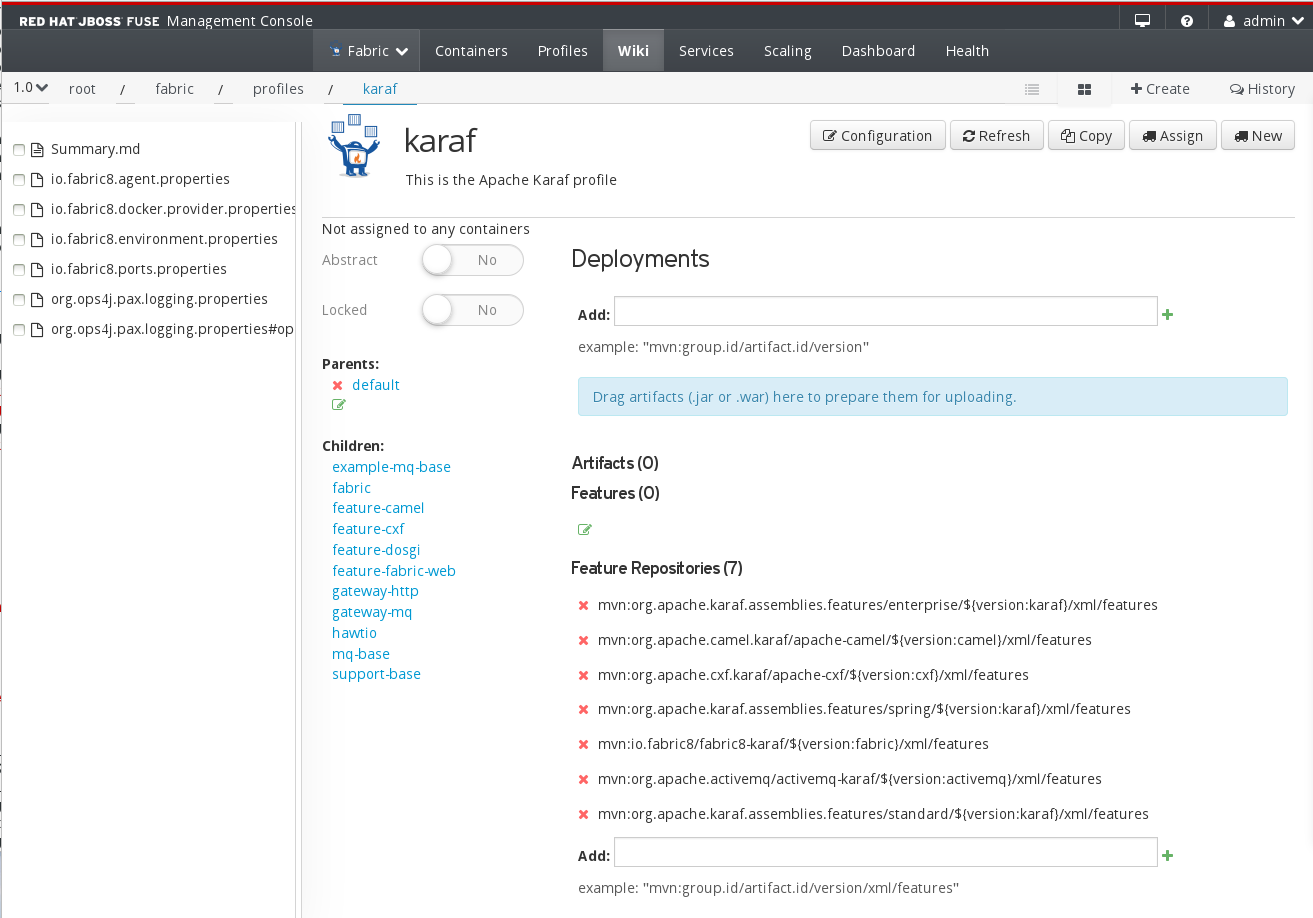
You can edit profile details on the Wiki profile page. Use this page to add and remove artifacts, features and feature repositories. Other functions are provided via buttons and editable lists.

Function Buttons
Copy linkLink copied to clipboard!
Some functions are available using the following buttons:
| Button | Function |
|---|---|
| Configuration | View a list of the bundles and features that make up this profile. |
| Refresh | Deploy the latest version of this profile on all associated containers. |
| Copy | Create a new profile by copying this one. |
| Assign | Assign this profile to a container that already exists in the system. |
| New | Create a new container and assign this profile to it. |
View Associated Containers
Copy linkLink copied to clipboard!
To view the containers that this profile is assigned to, click the sentence Assigned to X Containers, where X is a number indicating how many containers have this profile assigned. You will be taken to a list of the containers where you can click on individual containers to see any details you require.
Abstract Toggle
Copy linkLink copied to clipboard!
Use the Abstract toggle to mark this profile as abstract. This means that the profile must be inherited by other profiles, and cannot be instantiated in its own right.
Locked Toggle
Copy linkLink copied to clipboard!
Use the Locked toggle ensure that no changes can be made to the profile unless it is deliberately unlocked.
Parents List
Copy linkLink copied to clipboard!
This list shows all the parent profiles from which this profile inherits features. You can remove a parent profile by clicking the red X next to it. Confirm the removal in the pop-up window.
You can add to the parent profiles list by clicking the green edit icon at the bottom of the list. To add the features of a profile, select from the presented list in the pop-up window. Click Change Parents to confirm. The list of parent profiles will be updated with the new information.
Deployments
Copy linkLink copied to clipboard!
The Deployments section shows lists of artifacts, features and feature repositories deployed to the profile.
To add to the Artifacts list, either drag an artifact or enter the address of an artifact into the Add box. Click the green + to add the artifact.
To remove an entry from any of the Deployments lists, click the red X next to the entry. Confirm the delete in the pop-up box by clicking Delete.
To edit an entry in any of the Deployments lists, click the pencil icon at the end of each entry. Edit the details required, then confirm the change by clicking the green tick, or cancel by clicking the red X in the pop-up box.
To edit the Features list, click the green edit icon at the bottom of the list. On the Edit Profilename Features page, you can perform the following:
Confirm the changes by clicking the button. Click when you have finished, or if no changes have been made.
- Filter the list of available features.
- Select additional features from the list. Click to add the name to the features list, or click to add the name and version number to the features list.
- Delete entries from the Features list. Click the red X next to the feature name in the Profile Features list.
- See which features are inherited, by referring to the Inherited Features list.
To add a feature repository, enter a repository name in the specified format into the Add box. Click the green + to add the repository.
Chapter 19. Patching a Fabric
Copy linkLink copied to clipboard!
Overview
Copy linkLink copied to clipboard!
This section explains how to apply patches to a fabric. In a fabric, patches are applied to individual containers, so you can choose whether you want to apply a given patch to just some or all containers in a fabric.
Creating a Version
Copy linkLink copied to clipboard!
You may want to create a new version before patching a fabric. This will enable you to have multiple versions of a fabric container available, and make them easier to manage. To create a new version:

- Go to the Wiki tab. Click the version number on the action bar. Select Create Version from the drop-down menu.
- On the Create new Version pop-up window, enter a version name and a description. Click to complete the version creation process. The version name must be composed of lowercase letters, numbers, and any of the following symbols:
-_.
Patching a fabric
Copy linkLink copied to clipboard!
To patch a fabric container (or containers) from the Management Console, perform the following steps:
- Go to the Wiki tab. Click the version number on the action bar. Select Patch Version from the drop-down menu.

- Select the version that you want to apply the patch to. Click .
- Fill in the fields on the Applying Patch to Version .... page as follows:
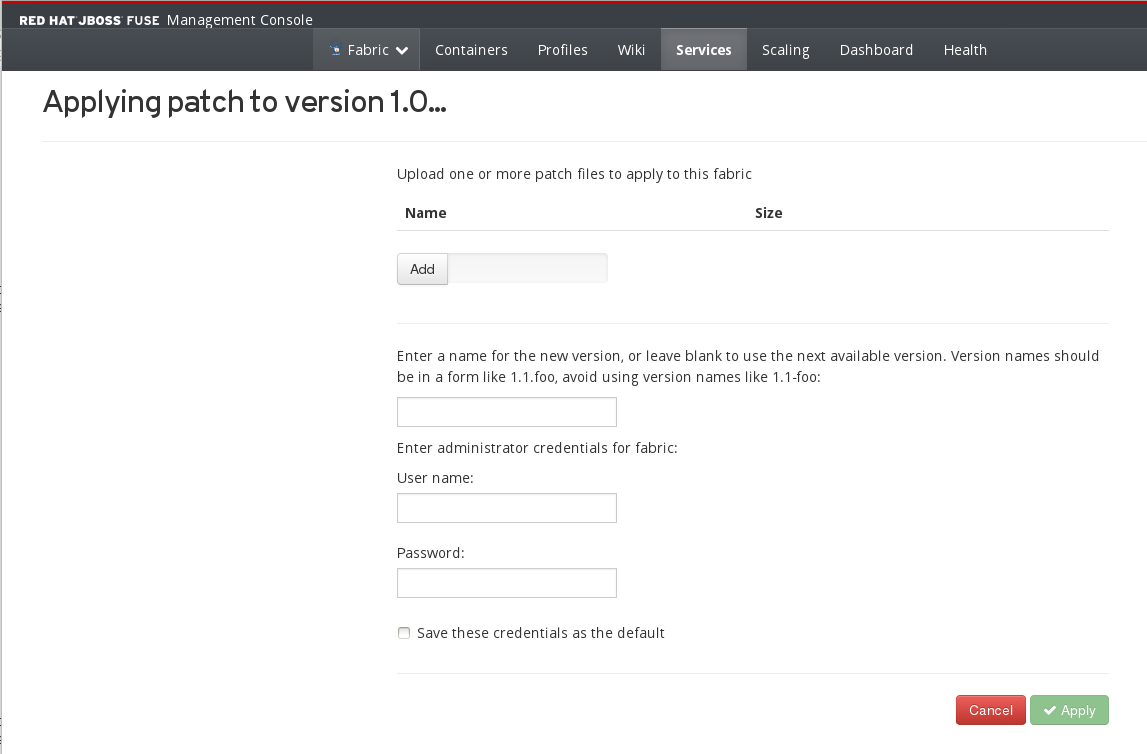
- Use the Add button to add one or more patch files.
- (Optional) Enter a name for the new version (to which the patch will be applied).
- Enter the administrator credentials, User Name and Password.
- Click Apply.
- Apply the patched version to one or more containers from the Containers page.
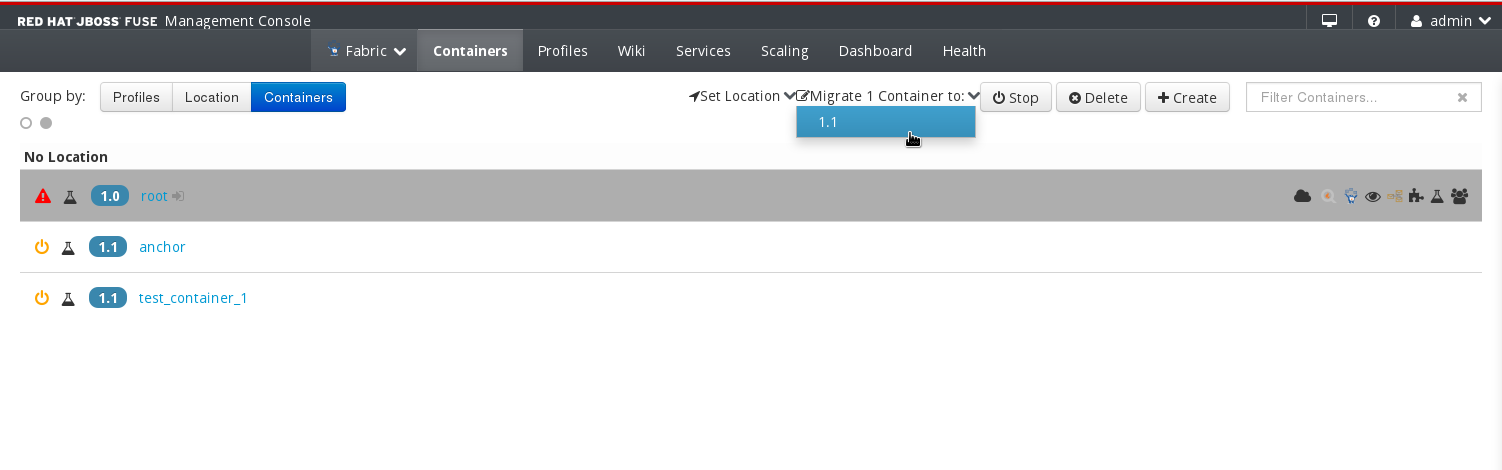 Perform the following steps:
- Select one or more containers to migrate, by selecting the line in the list. Hold down
ctrland select the line to select more than one container. - Click the Migrate X Containers to: label to show a dropdown list of available versions. Select the patched version that you wish to migrate to.
- A log message will appear to show that action is being taken, and that it might take a while.
If the migration is successful, you will see the changed version of the container on the Containers page.
Chapter 20. Services Area
Copy linkLink copied to clipboard!
Abstract
You use the Services area to view and manage containers, profiles, ActiveMQ brokers, and APIs. You can perform rolling updates to entities, monitor registered services, and view the location of your containers on a map.
20.1. Services Overview
Copy linkLink copied to clipboard!
Overview
Copy linkLink copied to clipboard!
Toolbar
Copy linkLink copied to clipboard!
The Services tab contains a toolbar that you can use to access management pages for fabric entities. The Services toolbar contains links to the following pages:
- Containers
- List of available containers. Use this page to view container status, drill down to container details, and create containers in the fabric.
- Profiles
- List of assigned profiles. Use this page to view profile and container details and define minimum and maximum container requirements for each profile.
- MQ
- Graphical view of ActiveMQ brokers in a broker topology. Use this page to move, group, and connect containers.
- APIs
- List of installed Apache CXF Web Services APIs. Use this page to view and manage API properties, such as parameter values and exceptions.
- EIPs
- Dynamic diagram of installed Apache Camel containers. Use this page to view the details of the Camel route endpoints and dependencies.
- Registry
- List of registered services. Use this page to drill down to services and view service details and status.
- Map
- Locations of deployed containers according to the fabric geoIP data.
20.2. Containers Page
Copy linkLink copied to clipboard!
Abstract
You can view and manage containers in a fabric in the Containers page. You can view the list of containers, drill down to container details, and create containers.
Overview
Copy linkLink copied to clipboard!
The following image shows an example of the Containers page:

The Containers page contains the following sections:
- Action Bar
- Options to filter the container list, add the view to the dashboard, create a new entity, delete a container, or stop a container. The whole bar is shown when one or more containers is selected.
- Container List
- This is a list of the deployed containers. Click the name of the container to drill down to the container details page.
Action Bar
Copy linkLink copied to clipboard!
The Action Bar contains the following options:
- Select All / Select None
- Selects all containers in the list or clears all selections. Use the clear circle to clear all selections, and the solid circle to select all.
- Filter
- Filters the container list to show only containers that match a string that you enter in the text box. The container list refreshes as you type. To clear the filter, click the X in the filter box.
- Set Location
- Use this option to set the location of one or more containers. Select Set Location and either select No Location or select New... and add a location in the pop-up box.
- Add to Dashboard
- Adds the current view to the dashboard. The view appears in the fabric dashboard.
- +Create
- Opens the Create New Container page. The new container appears as a child of the root container in the container list.
- Start/Stop
- Starts or stops the selected containers. This icon toggles between start and stop, depending on the state of the selected container.
- Delete
- Deletes the selected containers.
Container List
Copy linkLink copied to clipboard!
The container list contains the following elements:
- Status
- Icon that shows the status of the container.
- Version
- Version number of the associated profile.
- Container Name
- Name of the container. You click the container name to drill down to the container details page.
- Open a New Window and Connect to this Container
- Use the icon next to the container name to open the container in the container perspective in a new window.
- Icon list
- Next at the end of each container row is a list of icons representing the services available in the container. Hover the mouse over each icon to identify it.
20.3. Profiles Page
Copy linkLink copied to clipboard!
Abstract
You can view and manage assigned profiles in a fabric in the Services > Profiles page. You can drill down to profile and container details and create containers for the profiles. You can also define profile requirements for the fabric.
Overview
Copy linkLink copied to clipboard!
You access the Profiles page from the Fabric perspective. If the Fabric perspective is not available, make sure that your fabric is available or create a new fabric.
The following image shows an example of the Profiles page:

The Profiles page contains the following sections:
- Action Bar
- Options to filter the container list, add the view to the dashboard, or define profile usage targets.
- Container List
- List of assigned profiles. You can click the name of the profile to drill down to the profile details page where you can manage profile settings.
Action Bar
Copy linkLink copied to clipboard!
The Action Bar contains the following options:
- Filter
- Filters the profile list to show only profiles that match a string that you enter in the text box. The profile list refreshes as you type. To clear the filter, click the X in the filter box.
- Add to Dashboard
- Adds the current view to the dashboard. The view appears in the fabric dashboard.
- Target
- Configure the mininum number of required instances for each profile. Click Target to open a pop-up window in which you can configure the maximum and mininum number of instances for each profile. You can also add or remove dependent profiles for each profile.
- Count
- Shows the number of running containers for each profile. Click on the number to add more containers.
Profile List
Copy linkLink copied to clipboard!
The profile list contains the following elements:
- Show / Hide
- Arrow icon to show or hide containers for each profile. Each container shows the same information as the container list on the Containers page.
- Profile
- Name and version of the profile. Click on the profile name to drill down to the profile details page.
- Instances
- Icon that shows the number of profile instances. You can click the icon to create additional containers for the profile.
20.4. MQ Page
Copy linkLink copied to clipboard!
Abstract
You view and manage Apache ActiveMQ brokers in the Services > MQ page. You can create and organize ActiveMQ brokers in topologies, and monitor broker status during runtime.
Overview
Copy linkLink copied to clipboard!
The following image shows an example of the MQ Configuration Topology page:

The MQ page contains the following sections:
- Action Bar
- Options to filter the topology viewer, add brokers and containers.
- Topology Viewer
- Graphical overview of Apache ActiveMQ brokers, profiles, and topologies.
Action Bar
Copy linkLink copied to clipboard!
The Action Bar contains the following options:
- Filter
- Filters the topology viewer to show only brokers that match a string that you enter in the text box. The topology viewer refreshes as you type. To clear the filter, you click the icon.
- +Broker
- Opens the Master Slave Broker page. In this page, you create a broker configuration that acts as a fabric profile. If you create a broker from the Action Bar, you must manually specify in which group to create the broker.
- +Container
- Opens the Create New Container page. The new container appears in the container list.
- Diagram
- Toggles between the Configuration view, as shown above, and the Diagram view.
Configuration Topology Viewer
Copy linkLink copied to clipboard!
The Configuration topology viewer contains the following elements:
- Group
- Broker group with one or more profiles. Each group appears as a box that shows the name of the group. You can click the to create a broker in the group. When you create a broker in the group, you can choose to assign the broker to an existing profile in the group or choose a different profile.
- Profile
- Profile with one or more brokers. Each profile appears as a box that shows the name of the profile and one or more nested boxes that represent brokers. You can click the profile name to drill down to the profile details. You can also click the + icon to create a broker in the group. The broker is assigned to the existing profile.
- Broker
- Apache ActiveMQ broker with one or more containers. Each broker appears as a box that shows the name of the broker and icons that represent the containers of the broker. You can click the broker name to view the configuration properties of the broker.
- Container
- One or more active containers that run with the parent profile and broker. Each container appears as a box that shows the container icon. You can hover over the container icon to view the container name, and click the icon to drill down to container details.
Diagram Viewer
Copy linkLink copied to clipboard!
The Diagram topology viewer shows a diagrammatic representation of the AMQ topology. It shows links between components. The Diagram page contains the following elements:
- Filter
- The Filter field allows you to focus your diagram on specific parts or specific versions of the system.
- View
- The View drop-down menu allows you to select the components you want to see in your diagram. You can include or exclude a number of components, and configure how the diagram is presented.
The following image shows an example of the MQ Diagram page:

20.5. APIs Page
Copy linkLink copied to clipboard!
Abstract
You view and manage Apache CXF Web Services APIs in the Services > APIs page.
Overview
Copy linkLink copied to clipboard!
The following image shows an example of the APIs page:

The APIs page contains the following sections:
- Filter
- Filters the API list to show only APIs that match a string that you enter in the text box. The API list refreshes as you type. To clear the filter, you click the icon.
- API List
- List of active Web Services APIs. Each API shows the service name, a link to the available operations, the container that uses the API, and the location of the Web Service.
20.6. EIPs Page
Copy linkLink copied to clipboard!
Abstract
You view Apache Camel routes and dependencies in the Enterprise Integration Pattern (EIPs) page.
Overview
Copy linkLink copied to clipboard!
The EIPs page contains the following sections:
- Action Bar
- Options to filter and show or hide entities from the route viewer.
- Route Viewer
- Graphical overview of Apache Camel routes and dependencies. You can click each entity to display the properties in the right pane.
Action Bar
Copy linkLink copied to clipboard!
The Action Bar contains the following options:
- Filter
- Filters the route viewer to show only entities that match a string that you enter in the text box. The route viewer refreshes as you type. To clear the filter, you click the icon.
- View
- Drop-down list of entity types. You select or clear the check box next to each entity type that you want to show or hide.
Route Viewer
Copy linkLink copied to clipboard!
The route viewer shows active Camel routes and dependency clusters. You can use the mouse scroll button to zoom in and out. You can also use the mouse to drag the clusters in the pane. When you click each entity, you can view details and properties in the right pane.
20.7. Registry Page
Copy linkLink copied to clipboard!
Abstract
You view the status and manage registered services in the Registry page. You can view the details and monitor the status for entities such as clusters, servlets, webapps, and repositories.
Overview
Copy linkLink copied to clipboard!
The following image shows an example of the Registry page:

The Registry page contains the following sections:
- Navigation Bar
- Breadcrumb view of the location in the service list.
- Service List
- List view of the registered services.
Navigation Bar
Copy linkLink copied to clipboard!
The Navigation Bar shows a breadcrumb view of the location in the service list. Each node in the hierarchy appears as a link. You can click each link to drill up in the hierarchy. By default, the Registry page shows the clusters node.
Service List
Copy linkLink copied to clipboard!
The service list shows registered services in folders. Click the folder to drill down to the service details.
When you drill down to service details, you can view the following general properties:
- ID
- Identifier of the service.
- Container
- Name of the container that uses the service.
- Services
- URL of the service.
Each service can show additional properties based on the type of service and the profile that runs the container.
20.8. Map Page
Copy linkLink copied to clipboard!
Abstract
You view the location of deployed containers in the Map page.
Overview
Copy linkLink copied to clipboard!
The Map page contains the following sections:
- Container Tree
- Tree view of the deployed containers. You can click a container in the tree to center the map to the location of the container.
- Map
- Google Map control that shows the location of the container. You can switch between the map view and the satellite view. You can also zoom in and out of the map.
Chapter 21. Wiki Page
Copy linkLink copied to clipboard!
Abstract
You view and manage the fabric configuration repository and integrated wiki content in the Wiki page. You can view the list of configuration objects, drill down to object details, and manage wiki documents.
Overview
Copy linkLink copied to clipboard!
You access the Wiki page from the Fabric perspective. If the Fabric perspective is not available, make sure that your fabric is available or create a new fabric.
The following image shows an example of the Wiki page:
The Wiki page contains the following sections:
- Action Bar
- Breadcrumb view of the location in the configuration repository and document management options.
- Repository Explorer
- Tree view of the fabric configuration repository and wiki documents.
- Details Pane
- Detailed view of the configuration object or wiki content.
Action Bar
Copy linkLink copied to clipboard!
The Action Bar contains the following options:
- Version
- Version of the repository branch to view. You can open the drop-down list to switch versions.
- Navigation Bar
- Breadcrumb view of the location in the repository. Each hierarchical level appears as a link. You can click each link to drill up to the parent directory. By default, the Wiki page opens to the main profiles directory.
- Create
- Opens the Create Document dialog box. You can use this dialog box to create configuration objects such as profiles, property files, Camel routes, or wiki pages. You cannot use this dialog box to create profiles or containers.
- Edit
- Switches the details pane to a wiki markdown view. You can edit the wiki markdown content directly in the page and save the updated wiki document.
- Actions Menu
- Object management options based on the contents of the details pane. For example, when you edit a profile you can use the Actions menu to change the profile parent, assign the profile to a new container, or edit the profile features. Use the mouse to hover over the menu options and view the description.
Repository Explorer
Copy linkLink copied to clipboard!
The repository explorer shows a tree view of all configuration objects and wiki documents organized in folders. You can click a folder in the tree to show the folder contents, or click a profile or a wiki document to show the details in the details pane.
You can select one or more objects and use the Actions menu to move, delete, or view the version history of the selected objects. You can also hover over each object to view the last modified date and time and the size of the object.
Details Pane
Copy linkLink copied to clipboard!
Detailed view of the configuration object or wiki content. When you edit a profile, this pane shows the profile details. When you drill down to a directory with a wiki document, this pane shows the contents of the wiki document.
If the directory does not contain a wiki document, this pane is empty.
Chapter 22. Dashboard Page
Copy linkLink copied to clipboard!
Abstract
Monitor system performance and runtime status using the Dashboard page. You can view recent log entries, active profiles, running containers, and system services.
Overview
Copy linkLink copied to clipboard!
The Dashboard page contains the following sections:
- Navigation Bar
- Tabbed view of available dashboards and management options.
- Active Dashboard Pane
- Detailed view of the active dashboard.
Navigation Bar
Copy linkLink copied to clipboard!
The navigation bar shows a tabbed view of available dashboards. Custom dashboards that you create or import appear in the navigation bar. You can click the dashboard name to switch between dashboards.
You can click the Manage button to create or import custom dashboards.
Active Dashboard Pane
Copy linkLink copied to clipboard!
The active dashboard pane shows a detailed view of the selected dashboard. By default, this pane shows the Welcome dashboard. You can use the Add Current View to Dashboard button in various areas of the Management Console to customize the default dashboard or create a new dashboard.
You can click and drag each area in the dashboard to arrange the dashboard. You can also click the edit icon next to each area title to edit the area name.
The Welcome dashboard contains the following areas:
- Java Heap Memory
- Pie chart view of used and free Java heap memory.
- Java Non Heap Memory
- Pie chart view of used and free Java non-heap memory.
- Containers
- List of deployed containers and container management options.
- Active Profiles
- List of active profiles and profile management options. Active profiles are profiles that you assigned to containers.
- Loaded Classes
- Pie chart view of loaded classes and unloaded classes.
- Process CPU Load
- Graphical view of CPU usage.
- Threads
- Timeline view of running threads and status information, such as thread count and thread user time.
- Logs
- List of recent log entries. You can click the log type to view basic information about the log entry, or click the log entry link to open the full log entry syntax.
Chapter 23. Health Page
Copy linkLink copied to clipboard!
Abstract
You view the status of health mbeans for containers and fabrics in the Health page. Health mbeans continuously check running Java code and services for syntax errors.
You can view the status for each broker and profile. The actual content of this page depends on the active brokers and profiles.
Overview
Copy linkLink copied to clipboard!
The following image shows an example of the Health page:
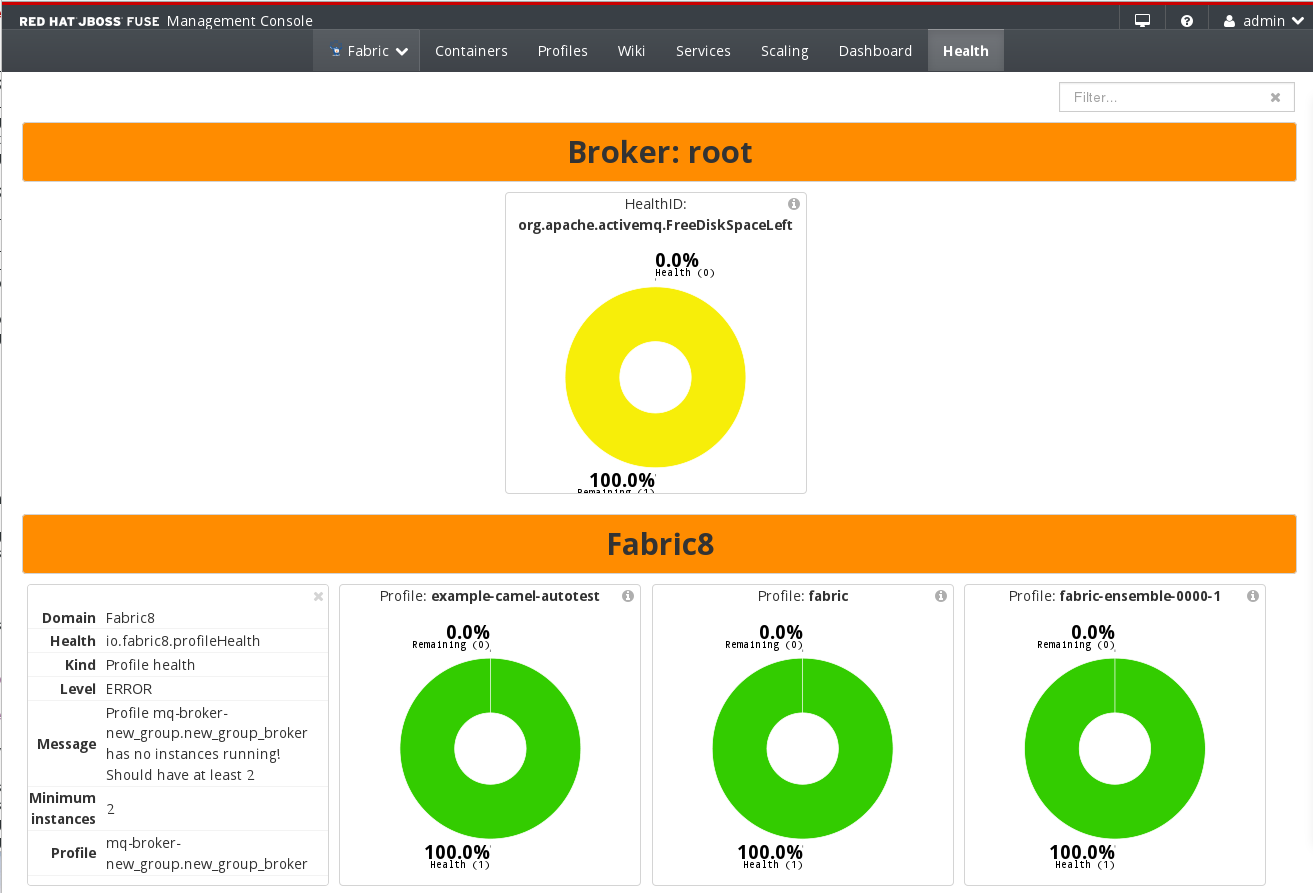
The Health page contains the following sections:
- Filter
- Filters the brokers and profiles pane to show only brokers or profiles that match a string that you enter in the text box. The pane refreshes as you type. To clear the filter, you click the X icon.
- Brokers and Profiles Pane
- Graphical view and service names for the active brokers and profiles. Each broker and profile shows the name and type of the broker or profile. You can click the information icon to expand the details pane for the seleected broker or profile.
Part IV. Log Management with Insight
Copy linkLink copied to clipboard!
Abstract
You use the Insight plugin to centrally manage logs and metrics for multiple containers in a fabric. The Insight plugin is a set of profiles that uses Elasticsearch and Kibana technology to collect log messages and events from multiple containers in one or more data stores. You then access and analyze the messages from the Insight perspective of the Fuse Management Console.
Chapter 24. Getting Started
Copy linkLink copied to clipboard!
Overview
Copy linkLink copied to clipboard!
To get started with Insight, you set up the data store, configure the containers to send messages or events to the data store, and install the embedded Web viewer to show the data in the Management Console. You then configure each container that you want to add to the Insight ensemble to send logs or metrics to the data store.
Prerequisites
Copy linkLink copied to clipboard!
Before you install and configure Insight, you must create a fabric or join an existing fabric.
Data store installation
Copy linkLink copied to clipboard!
To ensure optimal system resource usage, it is recommended that you install each data store in a separate container.
To install the data store, create a container with the following profiles:
- insight-elasticsearch.node
- Listener process that collects logs and events from the containers and writes the data to the data store. This profile contains all the configuration for the data store, such as size and location.To customize the data store configuration, edit the
io.fabric8.elasticsearch-insight.propertiesfile. For more information about the Elasticsearch node configuration properties, see the Elasticsearch configuration documentation. - insight-elasticsearch.datastore
- Database instance that uses Elasticsearch to store log messages and events from multiple sources. This profile extends the
insight-elasticsearch.nodeprofile and inherits its configuration.
Web viewer installation
Copy linkLink copied to clipboard!
To install the Web viewer, add the following profiles to the root container:
- insight-elasticsearch.node
- This profile enables the container to join the Elasticsearch cluster as an Elasticsearch client.
- insight-console
- Enables the Insight perspective in the Fuse Management Console.
After adding these profiles to the root container, the Web viewer is then available from the Insight perspective.
You can configure a different Web viewer to access logs and metrics. To connect directly to the cluster from an external Web viewer, enter the IP address from the Connect box of the Elasticsearch page as the destination of the data store cluster. You cannot use the command line to query the data store.
Configuring log collection
Copy linkLink copied to clipboard!
By default, containers send log messages to standalone log files that you view in the Logs tab of the container. To instruct a container to send the messages to the Insight data store, add the insight-logs.elasticsearch profile to each container that you want to add to the Insight ensemble.
Configuring metrics collection
Copy linkLink copied to clipboard!
By default, containers with Camel routes use stack tracing to collect metrics. To instruct a container to send the messages to the Insight data store, add the insight-metrics.elasticsearch and the insight-camel profiles to each Camel container that you want to add to the Insight ensemble.
Viewing and analyzing logs and metrics
Copy linkLink copied to clipboard!
You access the logs and metrics for all containers and brokers from the Insight perspective. For more information, see Chapter 25, Insight Perspective.
Chapter 25. Insight Perspective
Copy linkLink copied to clipboard!
Overview
Copy linkLink copied to clipboard!
When you log in to the Management Console, you use the Insight perspective to view and analyze log messages and events stored in the Insight data store. The Insight perspective shows information for all the containers and brokers in the fabric that you add to the Insight ensemble.
Toolbar
Copy linkLink copied to clipboard!
The Insight perspective contains a toolbar that you use to manage and monitor Insight components. The actual options depend on which Insight profiles you install and the type of containers from which you collect log messages and events. The toolbar can contain the following options:
| Option | Description |
|---|---|
| Camel | Detailed view of a Camel event based on the exchange ID of the event. |
| Logs | Embedded Web viewer that you use to access all logs stored in the Insight data store. |
| Camel Events | Embedeed Web viewer that you use to access all Camel events stored in the Insight data store. |
| Elasticsearch | Overview of all data stores in the fabric. |
Chapter 26. Camel Page
Copy linkLink copied to clipboard!
Abstract
You view metrics about a Camel route in the Camel page. You can view route attributes and source code, debug and trace the route, and monitor route status.
Overview
Copy linkLink copied to clipboard!
You access the Camel page from the Insight perspective. This page is available only when you install and configure the Insight plugin for one or more containers with a Camel route.
The following image shows an example of the Camel page:

The Camel page contains the following sections:
- Exchange ID
- Text box where you enter the exchange ID of a Camel route. To locate the exchange ID, select an event from the Camel Events page of the Insight perspective and copy the value of the exchange.id field.
- Details pane
- Gantt chart and diagram view of the message processing time in each part of the route. You can use these diagrams to locate bottlenecks and optimize the route.
Chapter 27. Logs Page
Copy linkLink copied to clipboard!
Abstract
You view and and analyze log messages in the Logs page. The page displays logs of all containers that use the insight-logs profile. You can query the Elasticsearch data store, filter the log list, and drill down to message details.
Overview
Copy linkLink copied to clipboard!
You access the Logs page from the Insight perspective. This page is available only when you install and configure the Insight plugin for one or more containers in the fabric.
The following image shows an example of the Logs page:

The Logs page contains the following sections:
- Quick-filter
- Drop-down list with options to filter the log list and graph according to predefined times, such as last 15 minutes or last 7 days. The list also includes a Refresh icon that you can use to display messages that were generated after you navigated to this page.
- Query box
- Text box where you enter a query to search for log messages in the data store. By default, the page shows only events of type log. You can define queries with the lucene query string, regular expressions, or topN formats. For information and conventions, click the colored circle icon on the left side of the query box and open the About dialog box.
- Filtering pane
- Filter settings for the logs list. You can use this pane to add, edit or delete filter settings.
- Log Events Over Time graph
- Visual representation of the messages as they are collected in the data store. You can drag the mouse cursor to highlight an area in the graph and show the events that occured during the selected time frame. The log list refreshes as you zoom in or out in the graph.
- All Logs list
- List of logs messages for all containers and brokers in the Insight ensemble. The events in this list depend on the query, filter, and graph settings. Use the left and right arrows to navigate the list.You can click an event to drill down to detailed information, such as log level, full message, bundle name, and so on. You can also perform actions on the event, such as add or remove a filter based on one of the event properties.
Chapter 28. Camel Events Page
Copy linkLink copied to clipboard!
Abstract
You view and analyze events for all containers with Camel routes in the Camel page. This page provides functionality similar to route tracing.
Overview
Copy linkLink copied to clipboard!
You access the Camel Events page from the Insight perspective. This page is available only when you install and configure the Insight plugin for one or more containers with a Camel route.
The following image shows an example of the Camel Events page:

The Camel Events page contains the following sections:
- Quick-filter
- Drop-down list with options to filter the event list and graph according to predefined times, such as last 15 minutes or last 7 days. The list also includes a Refresh icon that you can use to display messages that were generated after you navigated to this page.
- Query box
- Text box where you enter a query to search for events in the data store. By default, the page shows only completed and failed events. You can define queries with the lucene query string, regular expressions, or topN formats. For information and conventions, click the colored circle icon on the left side of the query box and open the About dialog box.
- Filtering pane
- Filter settings for the event list. You can use this pane to add, edit or delete filter settings.
- Camel Events Over Time graph
- Visual representation of the events as they are collected in the data store. You can drag the mouse cursor to highlight an area in the graph and show the events that occured during the selected time frame. The event list refreshes as you zoom in or out in the graph.
- Statistics pie chart
- Visual representation of the percentage of completed events. You can click the completed area in the pie chart to add a filter that shows only completed events.
- Trends overview
- Statistical information about the Camel events that occured in the last hour and the last day. The trends are displayed based on the query settings. By default, the overview shows information about completed and failed events.
- All Camel Events list
- List of events for all Camel containers and brokers in the Insight ensemble. The events in this list depend on the query, filter, and graph settings. Use the left and right arrows to navigate the list.You can click an event to drill down to detailed information, such as exchange ID, full message, endpoint, and so on. You can also perform actions on the event, such as add or remove a filter based on one of the event properties.
Chapter 29. Elasticsearch Page
Copy linkLink copied to clipboard!
Abstract
You view and and manage the Elasticsearch data stores in the Elasticsearch page. You can view detailed information about all the data stores in the fabric, such as cluster and node state. You can also run custom queries on the database.
Overview
Copy linkLink copied to clipboard!
You access the Elasticsearch page from the Insight perspective. This page is available only when you install and configure the Insight plugin for one or more containers in the fabric.
The following image shows an example of the Elasticsearch page:

The Elasticsearch page contains the following sections:
- Cluster overview and toolbar
- General information about the data store cluster, such as the address and the state of the cluster. If you want to connect directly to the cluster from an external Web viewer, you use the IP address from the Connect box to indicate the location of the data store cluster.
- Data Store list and details
- List of all the data stores in the cluster. Each node represents a data store container. The right pane shows general information about each node, such as storage size according to date, number of messages, and so on.
Part V. Diagnostic Tool plug-in
Copy linkLink copied to clipboard!
The Diagnostic tool is implement as a Hawtio plug-in integrated in the Fuse Management Console. The plug-in is deployed either as a feature in a non-fabric environment or as a profile in a Fabric environment called support-base.
The plug-in can be accessed on the Fuse Management Console under the Red Hat Access menu in the top right corner. The plug-in allows you to add artifacts such as
LOGS, SUPPORT_ZIP, ETC, HEAPDUMP and THREADDUMP.
The diagnostic tool allows the following attachments:
- LOGS: logged information of the root container.
SUPPORT_ZIP: Generates a comprehensive zip of diagnostic information.ETC: Generates a zip of the configuration folder.HEAPDUMP: Generates a zipped heap dump.THREADDUMP: Generates a thread dump.
Note
In case of Fabric, the
SUPPORT_ZIP artifact would contain extra Fabric-specific configurations such as the contents of the ZooKeeper registry (calls zkdump).
Chapter 30. Open a New Case
Copy linkLink copied to clipboard!
You can open a new case through the Fuse Management Console.
Opening a New Case
Copy linkLink copied to clipboard!
- Login to Fuse Management Console.
- In Fuse Management Console, click on Red Hat Access in the top right corner.
- Login with your Red Hat Subscription ID and Password.
- Select from the drop-down list.
- In the Open New Case window, click My Account and the owner field and Product field are updated automatically, select the product version, enter the Summary and Description and click Next.
- On the next page, select the Support Level,Severity and
- You can upload local files and server files when you open a new case.To upload local files, click Attach local file, enter file description and click Add.
- To attach server files, select the file type from the listed option and click Submit.
Chapter 31. Edit an Existing Case
Copy linkLink copied to clipboard!
You can edit an existing case through the Fuse Management Console.
Editing an Existing Case
Copy linkLink copied to clipboard!
- Login to Fuse Management Console.
- In Fuse Management Console, click on Red Hat Access in the top right corner.
- Login with your Red Hat Subscription ID and Password.
- Select from the drop-down list.
- The case list can be filtered using the search box, selecting a case group, or as per the status of the cases.Select the case for editing from the search results.
- On the next page, there are different section such as Details, Attachments and Case Discussion.To modify the case details, edit the Details section and click Update Details.
- In the Attachments section you can add new attachments and click Upload Attachments or delete existing attachments.
- In the Discussion section you can add comments and choose to make the comment public or private.
You can access existing solutions in the Recommendations section. You can also choose to escalate the case with Red Hat Support manager.
Chapter 32. Using the Diagnostic Tool
Copy linkLink copied to clipboard!
To use the Diagnostic tool, you need to install and create an instance of Red Hat JBoss Fuse 6.2. You can access the diagnostic tool through the Hawtio interface.
Using the Diagnostic Tool
Copy linkLink copied to clipboard!
- Login to Fuse Management Console.
- In Fuse Management Console, click on Red Hat Access in the top right corner.
- Select from the drop-down list.The Log File Viewer screen opens.
- In the Log File Viewer, click Please Select the machine and click root, select the log file and click Select File.The contents of the log file are displayed in the Log Viewer windowNoteThe log file used in this step is for example purpose. You can choose any file for diagnostics.
- From the list of the log messages, click on the message relevant to your issue and click Red Hat Diagnose.
- The Recommendations panel opens, click the appropriate Support case in the panel to access the information related to the problem.In case the issue is not listed in the recommendations panel, you can click the Open a New Support Case to file a case with Red Hat Support Team
Chapter 33. Limitations of the Diagnostic Tool
Copy linkLink copied to clipboard!
The diagnostic tool has certain limitations:
- The diagnostic tool can only get extra information from root, child, or SSH containers.
- Cloud containers are not supported.
- The diagnostic tool collects the extra information by a process running on the remote container, in extreme cases (heavily overloaded container), the tool might not be able to gather statistics from a badly failing container.
- Extra artifacts are delivered straight from container, so container host must have Internet access.
Legal Notice
Copy linkLink copied to clipboard!
Trademark Disclaimer
The text of and illustrations in this document are licensed by Red Hat under a Creative Commons Attribution–Share Alike 3.0 Unported license ("CC-BY-SA"). An explanation of CC-BY-SA is available at http://creativecommons.org/licenses/by-sa/3.0/. In accordance with CC-BY-SA, if you distribute this document or an adaptation of it, you must provide the URL for the original version.
Red Hat, as the licensor of this document, waives the right to enforce, and agrees not to assert, Section 4d of CC-BY-SA to the fullest extent permitted by applicable law.
Red Hat, Red Hat Enterprise Linux, the Shadowman logo, JBoss, MetaMatrix, Fedora, the Infinity Logo, and RHCE are trademarks of Red Hat, Inc., registered in the United States and other countries.
Apache, ServiceMix, Camel, CXF, and ActiveMQ are trademarks of Apache Software Foundation. Any other names contained herein may be trademarks of their respective owners.