Managing Fuse
Managing Fuse applications with Hawtio and Prometheus
Abstract
Preface
Red Hat Fuse provides two enterprise monitoring tools for viewing and managing Fuse integrations:
- The Fuse Console is a web-based console that you access from a browser to monitor and manage a running Fuse container. The Fuse Console is based on Hawtio open source software (http://hawt.io/).
- Prometheus (https://prometheus.io/docs/introduction/overview/) stores system and integration-level metrics for Fuse distributions. You can use a graphical analytics interface, such as Grafana, to view and analyze the stored historical data.
The audience for this guide is Red Hat Fuse administrators. This guide assumes that you are familiar with the Red Hat Fuse platform, Apache Camel, and the processing requirements for your organization.
When you deploy a Fuse application, you can use both the Fuse Console (Hawtio) and Prometheus to monitor and interact with Red Hat Fuse integrations.
Fuse Console
The Fuse Console provides a central interface to examine and manage the details of one or more deployed Fuse containers. You can also monitor Red Hat Fuse and system resources, perform updates, and start or stop services.
The Fuse Console is available when you install Red Hat Fuse standalone or use Fuse on OpenShift. The integrations that you can view and manage in the Fuse Console depend on the plugins that are running. Possible plugins include:
- Camel
- JMX
- Spring Boot
- OSGI
- Runtime
- Logs
The Fuse Console is a web-based console. For a list of supported browsers, go to https://access.redhat.com/articles/310603.
Prometheus
Prometheus is container-native software built for storing historical data and for monitoring large, scalable systems of which Fuse on OpenShift is a component. It gathers data over an extended time, rather than just for the currently running session.
Chapter 1. Accessing the Fuse Console
How you access the Fuse Console depends on your Fuse distribution:
- Fuse on OpenShift
Fuse Standalone:
1.1. Accessing the Fuse Console on OpenShift
You can deploy the Fuse Console either from the OpenShift Console or from the command line.
Security and user management for the Fuse Console is handled by OpenShift.
The Fuse Console templates configure end-to-end encryption by default so that your Fuse Console requests are secured end-to-end, from the browser to the in-cluster services.
Role-based access control (for users accessing the Fuse Console after it is deployed) is not yet available for Fuse on OpenShift.
1.1.1. Before you begin (cluster-mode setup)
If you want to deploy the Fuse Console in cluster mode on the OpenShift Container Platform environment, you need the cluster admin role and the cluster mode template. Run the following command:
oc adm policy add-cluster-role-to-user cluster-admin system:serviceaccount:openshift-infra:template-instance-controller
oc adm policy add-cluster-role-to-user cluster-admin system:serviceaccount:openshift-infra:template-instance-controllerThe cluster mode template is only available, by default, on the latest version of the OpenShift Container Platform. It is not provided with the OpenShift Online default catalog.
1.1.2. Deploying the Fuse Console from the OpenShift Console
To deploy the Fuse Console on your OpenShift cluster, follow these steps:
- In the OpenShift console, open an existing project or create a new project.
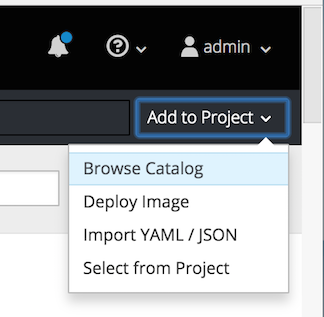
Add the Fuse Console to your OpenShift project:
Select Add to Project → Browse Catalog.
The Select an item to add to the current project page opens.
In the Search field, type Fuse Console.
The Red Hat Fuse 7.x Console item should appear as the search result.
NoteIf the Red Hat Fuse Console item does not appear as the search result, or if the item that appears is not the latest version, you can install the Fuse Console templates manually as described in the "Prepare the OpenShift server" section of the Fuse on OpenShift Guide.
Click the Red Hat Fuse Console item.
The Red Hat Fuse Console wizard opens.
Click Next. The Configuration page of the wizard opens.
Optionally, you can change the default values of the configuration parameters.
Click Create.
The Results page of the wizard indicates that the Red Hat Fuse Console has been created.
- Click the Continue to the project overview link to verify that the Fuse Console application is added to the project.
To open the Fuse Console, click the provided URL link and then log in.
An Authorize Access page opens in the browser listing the required permissions.
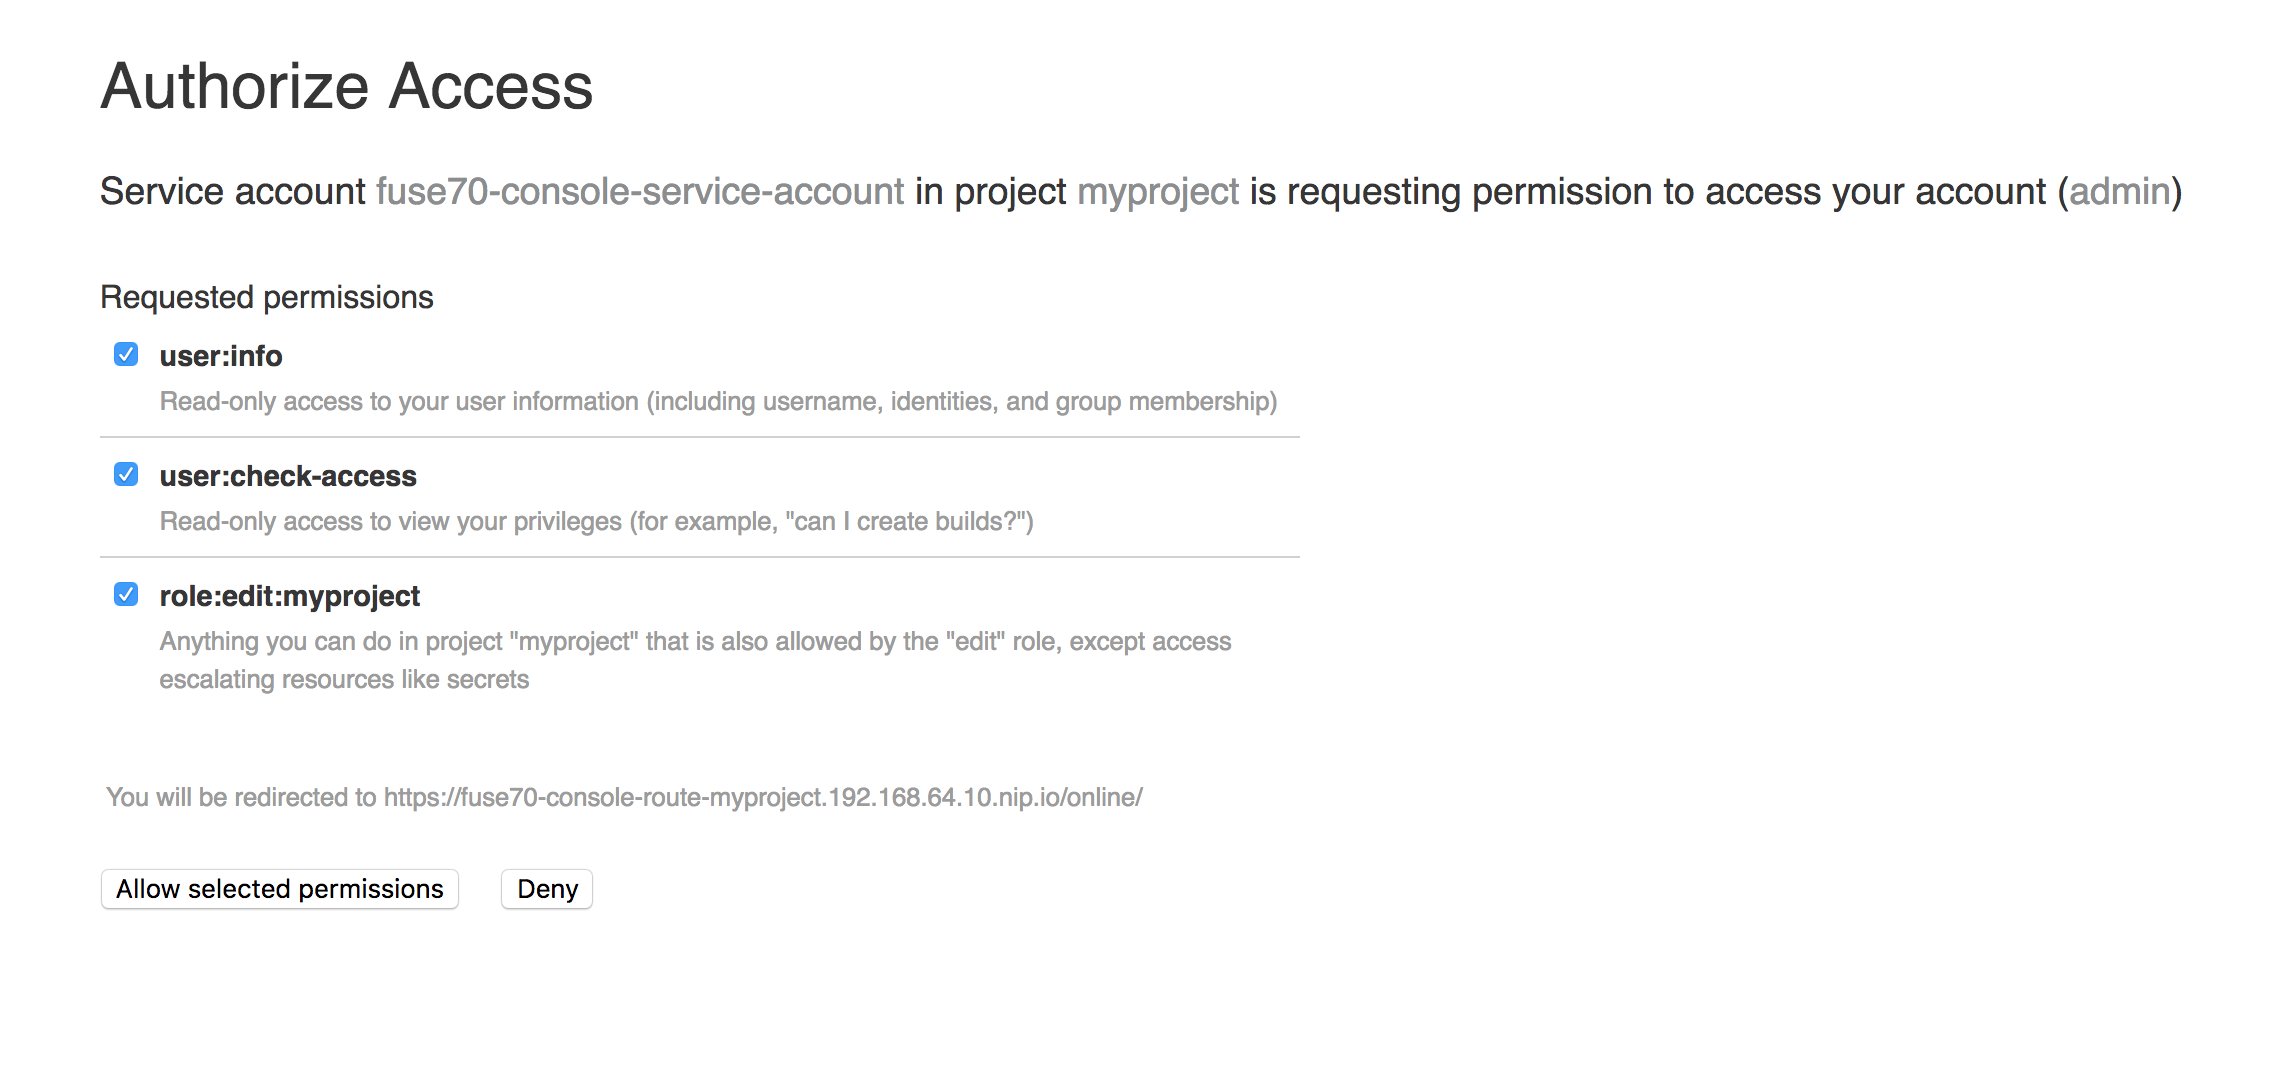
Click Allow selected permissons.
The Fuse Console opens in the browser and shows the Fuse pods running in the project.
Click Connect for the application that you want to view.
A new browser window opens showing the application in the Fuse Console.

1.1.3. Deploying the Fuse Console from the command line
Table 1.1, “Fuse Console templates” describes the two OpenShift templates that you can use to access the Fuse Console from the command line, depending on the type of Fuse application deployment.
| Type | Description |
|---|---|
| cluster | Use an OAuth client that requires the cluster-admin role to be created. The Fuse Console can discover and connect to Fuse applications deployed across multiple namespaces or projects. |
| namespace | Use a service account as OAuth client, which only requires the admin role in a project to be created. This restricts the Fuse Console access to this single project, and as such acts as a single tenant deployment. |
Optionally, you can view a list of the template parameters by running the following command:
oc process --parameters -f https://raw.githubusercontent.com/jboss-fuse/application-templates/application-templates-2.1.fuse-730065-redhat-00002/fis-console-namespace-template.json
oc process --parameters -f https://raw.githubusercontent.com/jboss-fuse/application-templates/application-templates-2.1.fuse-730065-redhat-00002/fis-console-namespace-template.jsonTo deploy the Fuse Console from the command line:
Create a new application based on a Fuse Console template by running one of the following commands (where myproject is the name of your project):
For the Fuse Console cluster template, where
myhostis the hostname to access the Fuse Console:oc new-app -n myproject -f https://raw.githubusercontent.com/jboss-fuse/application-templates/application-templates-2.1.fuse-730065-redhat-00002/fis-console-cluster-template.json -p ROUTE_HOSTNAME=myhost
oc new-app -n myproject -f https://raw.githubusercontent.com/jboss-fuse/application-templates/application-templates-2.1.fuse-730065-redhat-00002/fis-console-cluster-template.json -p ROUTE_HOSTNAME=myhostCopy to Clipboard Copied! Toggle word wrap Toggle overflow For the Fuse Console namespace template:
oc new-app -n myproject -f https://raw.githubusercontent.com/jboss-fuse/application-templates/application-templates-2.1.fuse-730065-redhat-00002/fis-console-namespace-template.json
oc new-app -n myproject -f https://raw.githubusercontent.com/jboss-fuse/application-templates/application-templates-2.1.fuse-730065-redhat-00002/fis-console-namespace-template.jsonCopy to Clipboard Copied! Toggle word wrap Toggle overflow NoteYou can omit the route_hostname parameter for the namespace template because OpenShift automatically generates one.
Obtain the status of your deployment by running this command:
oc status
oc statusCopy to Clipboard Copied! Toggle word wrap Toggle overflow - To access the Fuse Console from a browser, use the provided URL (for example, https://fuse-console.192.168.64.12.nip.io).
1.2. Accessing the Fuse Console for Spring Boot standalone
To access the Fuse Console for a standalone Fuse Spring Boot distribution:
Add hawtio-springboot to your Fuse application’s
pom.xmlfile dependencies.<dependency> <groupId>io.hawt</groupId> <artifactId>hawtio-springboot</artifactId> </dependency>
<dependency> <groupId>io.hawt</groupId> <artifactId>hawtio-springboot</artifactId> </dependency>Copy to Clipboard Copied! Toggle word wrap Toggle overflow Note that you do not need to specify the version because it is provided by the Maven BOM.
Edit the
src/main/resources/application.propertiesfile:Set the following properties to false:
-
endpoints.jolokia.sensitive -
endpoints.hawtio.sensitive -
hawtio.authenticationEnabled
-
Set the following properties to true:
-
endpoints.hawtio.enabled endpoints.jolokia.enabledYour application.properties settings should look similar to the following example:
Copy to Clipboard Copied! Toggle word wrap Toggle overflow NoteBy default, authentication for the Fuse Console on Spring Boot is disabled. Optionally, you can enable authentication by writing code specific to your Fuse Console distribution. Here is an example that you can use for guidance:
https://github.com/hawtio/hawtio/tree/master/examples/springboot-authentication
-
Run the Fuse application:
mvn spring-boot:run
mvn spring-boot:runCopy to Clipboard Copied! Toggle word wrap Toggle overflow To determine the port number for the Fuse Console URL, obtain the management.port value by looking at the value set in the
src/main/resources/application.propertiesfile. For example:management.port = 10001
management.port = 10001Copy to Clipboard Copied! Toggle word wrap Toggle overflow To open the Fuse Console in a browser, use the following URL syntax where nnnnn is the value of the management.port property:
http://localhost:nnnnn/hawtio/index.htmlFor example:
http://localhost:10001/hawtio/index.html
1.3. Accessing the Fuse Console for JBoss EAP standalone
Before you can access the Fuse Console for Red Hat JBoss Enterprise Application Platform, you must install Fuse on the JBoss EAP container. For step-by-step instructions, see Installing on JBoss EAP.
To access the Fuse Console for a standalone JBoss EAP distribution:
Start Red Hat Fuse standalone with the following command:
On Linux/Mac OS:
./bin/standalone.shOn Windows:
./bin/standalone.bat-
In a web browser, enter the URL to connect to the Fuse Console. For example:
http://localhost:8080/hawtio - In the login page, enter your user name and password and then click Log In.
By default, the Fuse Console shows the Home page. The left navigation tabs indicate the running plugins.
1.3.1. Resolving delayed Fuse Console loading
If the main Fuse Console page takes a long time to display in the browser, you might need to reduce the number and the size of the log files. You can use the periodic-size-rotating-file-handler to rotate the file when it reaches a maximum size (rotate-size) and maintains a number of files (max-backup-index). For details on how to use this handler, see the Red Hat JBoss Enterprise Application Platform product documentation.
1.4. Accessing the Fuse Console for Karaf standalone
To access the Fuse Console for Apache Karaf standalone:
- Install Fuse on the Karaf container. For step-by-step instructions, see Installing on Apache Karaf.
In the command line, navigate to the directory in which you installed Red Hat Fuse and run the following command to start Fuse standalone:
./bin/fuse
./bin/fuseCopy to Clipboard Copied! Toggle word wrap Toggle overflow The Karaf console starts and shows version information, the default Fuse Console URL, and a list of common commands.
-
In a browser, enter the URL to connect to the Fuse Console. For example:
http://localhost:8181/hawtio - In the login page, enter your user name and password and then click Log In.
By default, the Fuse Console shows the Home page. The left navigation tabs indicate the running plugins.
Chapter 2. Securing the Fuse Console
You can implement any or all of the following security features to secure Fuse containers for standalone deployments:
2.1. Set HTTPS as the required protocol
You can use the hawtio.http.strictTransportSecurity property to require web browsers to use the secure HTTPS protocol to access the Fuse Console. This property specifies that web browsers that try to use HTTP to access the Fuse Console must automatically convert the request to use HTTPS.
For a description of the property’s syntax, see the description page for the HTTP Strict Transport Security (HSTS) response header.
Set the hawtio.http.strictTransportSecurity property as shown in the following examples:
For Karaf standalone:
Set this property in the
$KARAF_HOME/etc/system.propertiesfile as shown in the following example:hawtio.http.strictTransportSecurity = max-age=31536000; includeSubDomains; preload
hawtio.http.strictTransportSecurity = max-age=31536000; includeSubDomains; preloadCopy to Clipboard Copied! Toggle word wrap Toggle overflow For JBoss EAP standalone:
Set this property in the system-properties section of the
$EAP_HOME/standalone/configuration/standalone*.xmlfile as shown in the following example:<property name="hawtio.http.strictTransportSecurity" value="max-age=31536000; includeSubDomains; preload"/>
<property name="hawtio.http.strictTransportSecurity" value="max-age=31536000; includeSubDomains; preload"/>Copy to Clipboard Copied! Toggle word wrap Toggle overflow For Spring Boot standalone:
Set this property as shown in the following example:
public static void main(String[] args) {
    System.setProperty("hawtio.http.strictTransportSecurity", "max-age=31536000; includeSubDomains; preload");
    SpringApplication.run(YourSpringBootApplication.class, args);
}
public static void main(String[] args) { System.setProperty("hawtio.http.strictTransportSecurity", "max-age=31536000; includeSubDomains; preload"); SpringApplication.run(YourSpringBootApplication.class, args); }Copy to Clipboard Copied! Toggle word wrap Toggle overflow
2.2. Use public keys to secure responses
You can use the hawtio.http.publicKeyPins property to secure the HTTPS protocol by telling the web browser to associate a specific cryptographic public key with the Fuse Console to decrease the risk of “man-in-the-middle” attacks with forged certificates.
For a description of the property’s syntax, including instructions on how to extract the Base64 encoded public key, see the description page for the HTTP Public Key Pinning response header.
Set the hawtio.http.publicKeyPins property as shown in the following examples:
For Karaf standalone:
Set this property in the
$KARAF_HOME/etc/system.propertiesfile as shown in the following example:hawtio.http.publicKeyPins = pin-sha256="cUPcTAZWKaASuYWhhneDttWpY3oBAkE3h2+soZS7sWs"; max-age=5184000; includeSubDomains
hawtio.http.publicKeyPins = pin-sha256="cUPcTAZWKaASuYWhhneDttWpY3oBAkE3h2+soZS7sWs"; max-age=5184000; includeSubDomainsCopy to Clipboard Copied! Toggle word wrap Toggle overflow For JBoss EAP standalone:
Set this property in the system-properties section of the
$EAP_HOME/standalone/configuration/standalone*.xmlfile as shown in the following example:<property name="hawtio.http.publicKeyPins" value="pin-sha256=cUPcTAZWKaASuYWhhneDttWpY3oBAkE3h2+soZS7sWs"; max-age=5184000; includeSubDomains"/>
<property name="hawtio.http.publicKeyPins" value="pin-sha256=cUPcTAZWKaASuYWhhneDttWpY3oBAkE3h2+soZS7sWs"; max-age=5184000; includeSubDomains"/>Copy to Clipboard Copied! Toggle word wrap Toggle overflow For Spring Boot standalone:
Set this property as shown in the following example:
public static void main(String[] args) {
    System.setProperty("hawtio.http.publicKeyPins", "pin-sha256=cUPcTAZWKaASuYWhhneDttWpY3oBAkE3h2+soZS7sWs"; max-age=5184000; includeSubDomains");
    SpringApplication.run(YourSpringBootApplication.class, args);
}
public static void main(String[] args) { System.setProperty("hawtio.http.publicKeyPins", "pin-sha256=cUPcTAZWKaASuYWhhneDttWpY3oBAkE3h2+soZS7sWs"; max-age=5184000; includeSubDomains"); SpringApplication.run(YourSpringBootApplication.class, args); }Copy to Clipboard Copied! Toggle word wrap Toggle overflow
2.3. Enable SSL/TLS security (Karaf only)
SSL/TLS security is not enabled by default for the Fuse Console. It is recommended that you enable SSL/TLS security on the Fuse Console to protect username/password credentials from snooping. For detailed instructions on how to enable SSL/TLS security, see the "Enabling SSL/TLS for Undertow in an Apache Karaf container" section in the Apache Karaf Security Guide.
2.4. Red Hat Single Sign On (Karaf)
For information on how to secure the Fuse Console with Red Hat Single Sign-On, see the section on securing the Hawtio administration console in the Red Hat Single Sign-on Securing Applications and Services Guide.
2.5. Control user access (Karaf only)
For this release, role-based access control for the Fuse Console is only enabled for Fuse on Karaf standalone.
The operations that an authenticated user is allowed to perform depend on the role (or roles) assigned to that user, as listed in Table 2.1, “Role-based access on Karaf standalone”.
Ensure that a user has the necessary user role authorization to perform the Fuse Console operations that the user needs to perform.
To set a user role:
-
Open the Red Hat Fuse
etc/users.propertiesfile in an editor. Add an entry for the user name, password, and role.
For example, the following entry in the
etc/users.propertiesfile defines the admin user and grants the admin role.admin = secretpass,admin
admin = secretpass,adminCopy to Clipboard Copied! Toggle word wrap Toggle overflow - Save the file.
| Operation | admin | manager | viewer |
|---|---|---|---|
| Log in/Log out | Y | Y | Y |
| View Help topics | Y | Y | Y |
| Set user preferences | Y | Y | Y |
| Connect | |||
| Discover and connect to remote integrations | Y | Y | Y |
| Discover and connect to local integrations | Y | Y | Y |
| Camel | |||
| View all running Camel applications | Y | Y | Y |
| Start, suspend, resume, and delete Camel contexts | Y | Y | |
| Send messages | Y | Y | |
| Add endpoints | Y | Y | |
| View routes, route diagrams, and runtime statistics | Y | Y | Y |
| Start and stop routes | Y | Y | |
| Delete routes | Y | Y | |
| JMX | |||
| Change attribute values | Y | Y | |
| Select and view attributes in a time-based chart | Y | Y | Y |
| View operations | Y | Y | Y |
| OSGI | |||
| View bundles, features, packages, services, servers, framework, and configurations | Y | Y | Y |
| Add and delete bundles | Y | Y | |
| Add configurations | Y | Y | |
| Install and uninstall features | Y | ||
| Runtime | |||
| View system properties, metrics, and threads | Y | Y | Y |
| Logs | |||
| View logs | Y | Y | Y |
For more information on role-based access control, see Deploying into Apache Karaf.
Chapter 3. Disabling the Fuse Console
How you disable the Fuse Console depends on your Fuse distribution.
3.1. OpenShift
For OpenShift, the Fuse Console is not enabled by default.
3.2. Spring Boot standalone
For Spring Boot, the Fuse Console is not enabled by default.
3.3. JBoss EAP standalone
To disable the Fuse Console on JBoss EAP, do one of the following:
-
Remove the deployment file:
$EAP_HOME/standalone/deployments/hawtio-wildfly-xxxxx.war - Undeploy the Fuse Console by using the JBoss EAP admin console or command line interface.
3.4. Karaf standalone
To disable the Fuse Console on Karaf so that it becomes inaccessible to all users without affecting any other component, follow these steps:
To determine the hawtio-web bundle ID, use the following command to list the Fuse bundles that the Fuse Console uses:
osgi:list | grep hawtioTo stop the bundle, use the osgi:stop command. For example, if the hawtio :: Web console bundle has an ID of 246, type this command:
osgi:stop 246
The bundle goes into the resolved state and you can no longer access the Fuse Console.
For more information about managing bundles, see the "Lifecycle Management" chapter of Deploying into Apache Karaf.
Chapter 4. Viewing and managing Fuse applications from the Fuse Console
You can view and manage Fuse applications as described in the following sections:
- Section 4.1, “Viewing containers and applications (Fuse on OpenShift)”
- Section 4.2, “Connecting to remote Fuse integrations (standalone distributions)”
- Section 4.3, “Viewing and managing Apache Camel applications”
- Section 4.4, “Viewing and managing JMX domains and MBeans”
- Section 4.5, “Viewing and managing your OSGI environment (Karaf standalone)”
- Section 4.6, “Viewing and monitoring thread state”
- Section 4.7, “Viewing log entries”
- Section 4.8, “Changing the Fuse Console branding”
- Section 4.9, “Ensuring that data displays correctly in the Fuse Console”
4.1. Viewing containers and applications (Fuse on OpenShift)
When you login to the Fuse Console for OpenShift, the Fuse Console home page shows the available containers.
To manage (create, edit, or delete) containers, use the OpenShift console.
To view Fuse applications on the OpenShift cluster, click the Online tab.
4.2. Connecting to remote Fuse integrations (standalone distributions)
The Fuse Console uses Jolokia, an agent-based approach to Java Management Extensions (JMX) that requires extra software (an agent) installed on the client. By default, Red Hat Fuse includes a jolokia agent.
With standalone Fuse Console distributions, you can connect to remote integrations that already have a jolokia agent (https://jolokia.org/) running inside them. If the process that you want to connect to does not have a jolokia agent inside, refer to the jolokia documentation (http://jolokia.org/agent.html).
4.2.1. Unlocking the Fuse Console
By default, Jolokia for Fuse 7 standalone (on Apache Karaf and JBoss EAP) is locked and the Fuse Console is not accessible remotely.
To unlock the Fuse Console for a hostname or IP address other than locahost or 127.0.0.1, follow these steps:
Open the
jolokia-access.xmlfile in an editor.On Karaf, the XML file is located in the
$KARAF_HOME/etcfolder.On JBoss EAP, it is located in the
$EAP_HOME/standalone/configurationfolder.Register the hostnames or IP addresses for the Fuse integrations that you want to access with the Fuse console by adding them to the <cors> section.
For example, to access hostname 0.0.0.3 from the Fuse Console, add the
*<allow-origin>http://0.0.0.3:*</allow-origin>*
*<allow-origin>http://0.0.0.3:*</allow-origin>*Copy to Clipboard Copied! Toggle word wrap Toggle overflow line as shown:
Copy to Clipboard Copied! Toggle word wrap Toggle overflow - Save the file.
4.2.2. Restricting remote access
Optionally, you can restrict remote access to the Fuse Console for specific hosts and IP addresses.
You can grant overall access based on the IP address of an HTTP client. To specify these restrictions:
In the jolokia-access.xml file, add or edit a <remote> section that contains one or more <host> elements. For the <host> element, you can specify an IP address, a host name, or a netmask given in CIDR format (for example, 10.0.0.0/16 for all clients coming from the 10.0 network).
The following example allows access from localhost and all clients whose IP addresses start with 10.0. For all other IP addresses, access is denied.
<remote>
  <host>localhost</host>
  <host>10.0.0.0/16</host>
</remote>
<remote>
  <host>localhost</host>
  <host>10.0.0.0/16</host>
</remote>For more details, see the Jolokia security documentation (https://jolokia.org/reference/html/security.html).
4.2.3. Allowing connections to remote Fuse instances
The Fuse Console’s proxy servlet uses whitelist host protection, with which by default the Fuse Console can only connect to localhost. If you want to connect the Fuse Console to other remote Fuse instances, you need to configure the whitelist as follows:
For Apache Karaf, make the following configuration changes in
etc/system.propertiesfile:hawtio.proxyWhitelist = localhost, 127.0.0.1, myhost1, myhost2, myhost3
hawtio.proxyWhitelist = localhost, 127.0.0.1, myhost1, myhost2, myhost3Copy to Clipboard Copied! Toggle word wrap Toggle overflow For JBoss EAP, make the following configuration changes in the
standalone/configuration/standalone-*.xmlfile:<property name=hawtio.proxyWhitelist" value="localhost, 127.0.0.1, myhost1, myhost2, myhost3"/>
<property name=hawtio.proxyWhitelist" value="localhost, 127.0.0.1, myhost1, myhost2, myhost3"/>Copy to Clipboard Copied! Toggle word wrap Toggle overflow For Spring Boot, configure the hawtio.proxyWhitelist system property in the
main()method of your Spring Boot application:System.setProperty("hawtio.proxyWhitelist", "localhost, 127.0.0.1, myhost1, myhost2, myhost3");System.setProperty("hawtio.proxyWhitelist", "localhost, 127.0.0.1, myhost1, myhost2, myhost3");Copy to Clipboard Copied! Toggle word wrap Toggle overflow
4.2.4. Connecting to a remote Jolokia agent
Before you begin, you need to know the connection details (host name, port, and path) of the remote Jolokia agent.
Here are the default connection URLs for the Jolokia agent depending on your Fuse distribution:
-
Spring Boot:
http://<host>:8080/jolokia -
Red Hat JBoss EAP:
http://<host>:8080/hawtio/jolokia -
Fuse Karaf:
http://<host>:8181/hawtio/jolokia
As a system administrator, you can change these defaults.
Typically, the URL to remotely connect to a Jolokia agent is the URL to open the Fuse Console plus /jolokia. For example, if the URL to open the Fuse Console is http://<host>:1234/hawtio, then the URL to remotely connect to it would probably be http://<host>:1234/hawtio/jolokia.
To connect to a remote Jolokia instance so that you can examine its JVM:
- Click the Connect tab.
Click the Remote tab, and then Add connection.
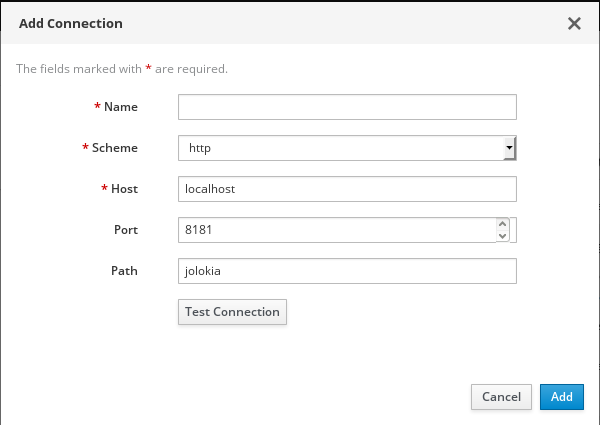
- Type the Name, Scheme (HTTP or HTTPS), and the hostname.
- Click Test Connection.
- Click Add.
The Fuse Console automatically probes the local network interfaces other than localhost and 127.0.0.1 and adds them to the whitelist. Hence, you do not need to manually register the local machine’s addresses to the whitelist.
4.2.5. Setting data moving preferences
You can change the following Jolokia preferences, for example, if you want to more frequently refresh data that displays in the Fuse Console. Note that increasing the frequency of data updates impacts networking traffic and increases the number of requests made to the server.
- Update rate - The period between polls to Jolokia to fetch JMX data (the default is 5 seconds).
- Maximum depth - The number of levels that Jolokia will marshal an object to JSON on the server side before returning (the default is 7).
- Maximum collection size - The maximum number of elements in an array that Jolokia marshals in a response (the default is 50,000).
To change the values of these settings:
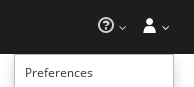
In the upper right of the Fuse Console, click the user icon and then click Preferences.
- Edit the options and then click Close.
4.2.6. Viewing JVM runtime information
To view JVM runtime information, such as system properties, metrics, and threads, click the Runtime tab.
4.3. Viewing and managing Apache Camel applications
In the Fuse Console’s Camel tab, you view and manage Apache Camel contexts, routes, and dependencies.
4.3.1. Overview
The Camel tab is only available when you connect to a container that uses one or more Camel routes.
You can view the following details:
- A list of all running Camel contexts
- Detailed information of each Camel context such as Camel version number and runtime statics
- Lists of all routes in each Camel application and their runtime statistics
- Graphical representation of the running routes along with real time metrics
You can also interact with a Camel application by:
- Starting and suspending contexts
- Managing the lifecycle of all Camel applications and their routes, so you can restart, stop, pause, resume, etc.
- Live tracing and debugging of running routes
- Browsing and sending messages to Camel endpoints
4.3.2. Interacting with a Camel application
To start, suspend, or delete a context:
- In the Camel tab’s tree view, click Camel Contexts.
- Check the box next to one or more contexts in the list.
- Click Start or Suspend.
- To delete a context, you must first stop it. Then click the ellipse icon and select Delete from the dropdown menu.
When you delete a context, you remove it from the deployed application.
To view Camel application details:
- In the Camel tab’s tree view, click a Camel application.
- To view a list of application attributes and values, click Attributes.
To view a graphical representation of the application attributes::
- Click Chart.
- Click Edit to select the attributes that you want to see in the chart.
- To view inflight and blocked exchanges, click Exchanges.
- To view application endpoints, click Endpoints. You can filter the list by URL, Route ID, and direction.
- Click Type Converters to view, enable, and disable statistics related to the Camel built-in type conversion mechanism, that is used to convert message bodies and message headers to different types.
- Click Operations to view and execute JMX operations, such as adding or updating routes from XML or finding all Camel components available in the classpath.
To interact with Camel routes:
In the Camel tab’s tree view, click the application’s routes folder to view a list of the routes:
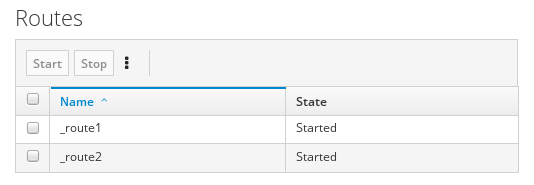
To start, stop, or delete one or more routes:
- Check the box next to one or more routes in the list.
- Click Start or Stop.
To delete a route, you must first stop it. Then click the ellipse icon and select Delete from the dropdown menu.
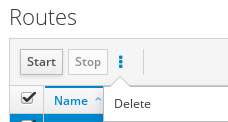 Note
Note- When you delete a route, you remove it from the deployed application.
- You can also select a specific route in the tree view and then click the upper-right menu to start, stop, or delete it.
- To view a graphical diagram of the routes, click Route Diagram.
- To view inflight and blocked exchanges, click Exchanges.
- To view endpoints, click Endpoints. You can filter the list by URL, Route ID, and direction.
- Click Type Converters to view, enable, and disable statistics related to the Camel built-in type conversion mechanism, which is used to convert message bodies and message headers to different types.
To interact with a specific route:
- In the Camel tab’s tree view, select a route.
- To view a list of route attributes and values, click Attributes.
- To view a graphical representation of the route attributes, click Chart. You can click Edit to select the attributes that you want to see in the chart.
- To view inflight and blocked exchanges, click Exchanges.
- Click Operations to view and execute JMX operations on the route, such as dumping the route as XML or getting the route’s Camel ID value.
To trace messages through a route:
- In the Camel tab’s tree view, select a route.
- Select Trace, and then click Start tracing.
To send messages to a route:
- In the Camel tab’s tree view, open the context’s endpoints folder and then select an endpoint.
- Click the Send subtab.
- Configure the message in JSON or XML format.
- Click Send.
- Return to the route’s Trace tab to view the flow of messages through the route.
To debug a route:
- In the Camel tab’s tree view, select a route.
- Select Debug, and then click Start debugging.
To add a breakpoint, select a node in the diagram and then click Add breakpoint. A red dot appears in the node:
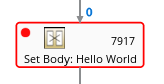
The node is added to the list of breakpoints:
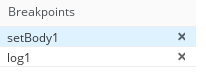
- Click the down arrow to step to the next node or the Play button to resume running the route.
- Click the Pause button to suspend all threads for the route.
- Click Stop debugging when you are done. All breakpoints are cleared.
4.4. Viewing and managing JMX domains and MBeans
Java Management Extensions (JMX) is a Java technology that allows you to manage resources (services, devices, and applications) dynamically at runtime. The resources are represented by objects called MBeans (for Managed Bean). You can manage and monitor resources as soon as they are created, implemented, or installed.
With the JMX plugin on the Fuse Console, you can view and manage JMX domains and MBeans. You can view MBean attributes, run commands, and create charts that show statistics for the MBeans.
The JMX tab provides a tree view of the active JMX domains and MBeans organized in folders. You can view details and execute commands on the MBeans.
To view and edit MBean attributes:
- In the tree view, select an MBean.
- Click the Attributes tab.
- Click an attribute to see its details.
To perform operations:
- In the tree view, select an MBean.
- Click the Operations tab, expand one of the listed operations.
- Click Execute to run the operation.
To view charts:
- In the tree view, select an item.
- Click the Chart tab.
4.5. Viewing and managing your OSGI environment (Karaf standalone)
For Apache Karaf standalone distributions, you can view and manage the Red Hat Fuse OSGi environment. You can view and manage container bundles, features, and configurations, as well as Java packages and OSGi services.
The OSGi tab contains a series of subtabs with options for each container component:
- Bundles
- List of installed bundles. You can install and uninstall bundles, start and stop bundles, and edit bundle properties. You can also filter the list and toggle between list and grid view.
- Features
- List of available features. You can install and uninstall features or feature repositories, and drill down to view feature details.
- Packages
- List of installed Java packages. You can view package versions and associated bundles.
- Services
- List of running services. You can view service IDs, associated bundles and object classes.
- Declarative Services
- List of declarative OSGi services. You can view the service state and drill down to view service details. You can also activate and deactivate services.
- Server
- Detailed information about the local or remote host in read-only mode.
- Framework
- Configuration options for the container OSGi framework. You can set the framework start level and the initial bundle start level.
- Configuration
- List of configuration objects. You can view the state of each object and drill down to view or edit object details. You can also create a new configuration object.
4.6. Viewing and monitoring thread state
To view and monitor the state of threads:
- Click the Runtime tab and then the Threads subtab. The Threads page lists active threads and stack trace details for each thread. By default, the thread list shows all threads in descending ID order.
- To sort the list by increasing ID, click the ID column label.
- Optionally, filter the list by thread state (for example, Blocked) or by thread name.
- To drill down to detailed information for a specific thread, such as the lock class name and full stack trace for that thread, in the Actions column, click More.
4.7. Viewing log entries
You can view log entries for Red Hat Fuse in the Logs tab. The Logs tab is available (for Fuse standalone on Karaf and Fuse standalone on JBoss EAP) when the Java application has the Log MBean available .
You can filter the list of logs to show specific log types, and drill down to each log entry to view detailed information about the log entry.
The Logs tab contains the following sections:
- Action Bar
- Options to filter the log entries section according to a text string or the logging level.
- Log Entries
- List view of the log entries. By default, the list shows log entries in ascending order. You can change the default sorting in the User → Preferences → Server Logs page. Click the log entry link to drill down to details about the log entry, such as the bundle name, thread, and the full message text.
4.7.1. Setting Fuse Console log attributes
You can customize the following Fuse Console browser settings for storing log messages:
- The number of log statements to keep in the Fuse Console (the default is 100).
- The global log level: INFO (the default), OFF, ERROR, WARN, and DEBUG.
- The child-level Hawtio messages to include, such as hawtio-oauth and hawtio-core-utils.
To change the defaults:
In the upper right corner of the Fuse Console, click the user icon and then click Preferences from the drop-down menu:
- Edit the options and then click Close.
To reset the Console Logs settings to the default values, click Reset → Reset settings.
4.8. Changing the Fuse Console branding
To change the branding name and image for the Fuse Console, you can edit the following files:
The
hawtconfig.jsonfile in the Fuse Console’s war file (karaf-install-dir/system/io/hawt/hawtio-war/version/hawtio-war-version.war):Copy to Clipboard Copied! Toggle word wrap Toggle overflow -
The war file’s style sheet (
.css) file to modify other aspects of the Fuse Console UI.
If you have already run the Fuse Console in a web browser, the branding is stored in the browser’s local storage. To use new branding settings, you must clear the browser’s local storage.
4.9. Ensuring that data displays correctly in the Fuse Console
If the display of the queues and connections in the Fuse Console is missing queues, missing connections, or displaying inconsistent icons, adjust the Jolokia collection size parameter that specifies the maximum number of elements in an array that Jolokia marshals in a response.
In the upper right corner of the Fuse Console, click the user icon and then click Preferences.
- Increase the value of the Maximum collection size option (the default is 50,000).
- Click Close.
Chapter 5. Accessing Prometheus to monitor Fuse applications
You can use Prometheus to monitor and store Fuse on OpenShift data by exposing endpoints with your Fuse application’s data to Prometheus format. Prometheus stores the data so that you can use a graphical tool, such as Grafana, to visualize and run queries on the data.
You can use Prometheus to monitor Fuse applications that are running on an on-premise OpenShift cluster or on a single-node cluster, such as Minishift or the Red Hat Container Development Kit.
For information on installing and developing with Red Hat Fuse on OpenShift, see the Fuse on OpenShift Guide.
The following sections describe how to access Prometheus:
Using Prometheus to monitor Fuse applications on OpenShift Online is not supported.
5.1. Setting up Prometheus
To set up Prometheus, install the Prometheus operator custom resource definition on the cluster and then add Prometheus to an OpenShift project that includes a Fuse application.
Prerequisites
- You have system administrator access to the OpenShift cluster.
- You have prepared the OpenShift cluster by installing the Fuse on OpenShift images and templates as described in the Fuse on OpenShift Guide.
- You have created an OpenShift project on the cluster and added a Fuse application to it.
Procedure
Login to OpenShift with administrator permissions:
oc login -u system:admin
$ oc login -u system:adminCopy to Clipboard Copied! Toggle word wrap Toggle overflow Install the custom resource definitions necessary for running the Prometheus operator, where
{$templates-base-url}is the location of the Fuse on OpenShift template files:oc create -f {$templates-base-url}\fuse-prometheus-crd.yml$ oc create -f {$templates-base-url}\fuse-prometheus-crd.ymlCopy to Clipboard Copied! Toggle word wrap Toggle overflow The Prometheus operator is now available to any namespace on the cluster.
Install the Prometheus operator to your namespace by using the following command syntax:
oc process -f {$templates-base-url}/fuse-prometheus-operator.yml -p NAMESPACE=<YOUR NAMESPACE> | oc create -f -$ oc process -f {$templates-base-url}/fuse-prometheus-operator.yml -p NAMESPACE=<YOUR NAMESPACE> | oc create -f -Copy to Clipboard Copied! Toggle word wrap Toggle overflow For example, use this command for a project (namespace) named myproject:
oc process -f {$templates-base-url}/fuse-prometheus-operator.yml -p NAMESPACE=myproject | oc create -f -oc process -f {$templates-base-url}/fuse-prometheus-operator.yml -p NAMESPACE=myproject | oc create -f -Copy to Clipboard Copied! Toggle word wrap Toggle overflow NoteThe first time that you install the Prometheus operator into a namespace, it might take a few minutes for the Prometheus resource pods to start. Subsequently, if you install it to other namespaces on your cluster, the Prometheus resource pods start much faster.
Instruct the Prometheus operator to monitor the Fuse application in the project by using the following command syntax::
oc process -f {$templates-base-url}/fuse-servicemonitor.yml -p NAMESPACE=<YOUR NAMESPACE> FUSE_SERVICE_NAME=<YOUR FUSE SERVICE> | oc apply -f -$ oc process -f {$templates-base-url}/fuse-servicemonitor.yml -p NAMESPACE=<YOUR NAMESPACE> FUSE_SERVICE_NAME=<YOUR FUSE SERVICE> | oc apply -f -Copy to Clipboard Copied! Toggle word wrap Toggle overflow For example, use this command for an OpenShift project (namespace) named myproject that includes a Fuse application named myfuseapp:
oc process -f {$templates-base-url}/fuse-servicemonitor.yml -p NAMESPACE=myproject FUSE_SERVICE_NAME=myfuseapp | oc apply -f -oc process -f {$templates-base-url}/fuse-servicemonitor.yml -p NAMESPACE=myproject FUSE_SERVICE_NAME=myfuseapp | oc apply -f -Copy to Clipboard Copied! Toggle word wrap Toggle overflow To open the Prometheus dashboard:
- Login to the OpenShift console.
- Open the project to which you added Prometheus.
In the left pane, select Applications → Routes.

Click the Prometheus Hostname URL to open the Prometheus dashboard in a new browser tab or window.
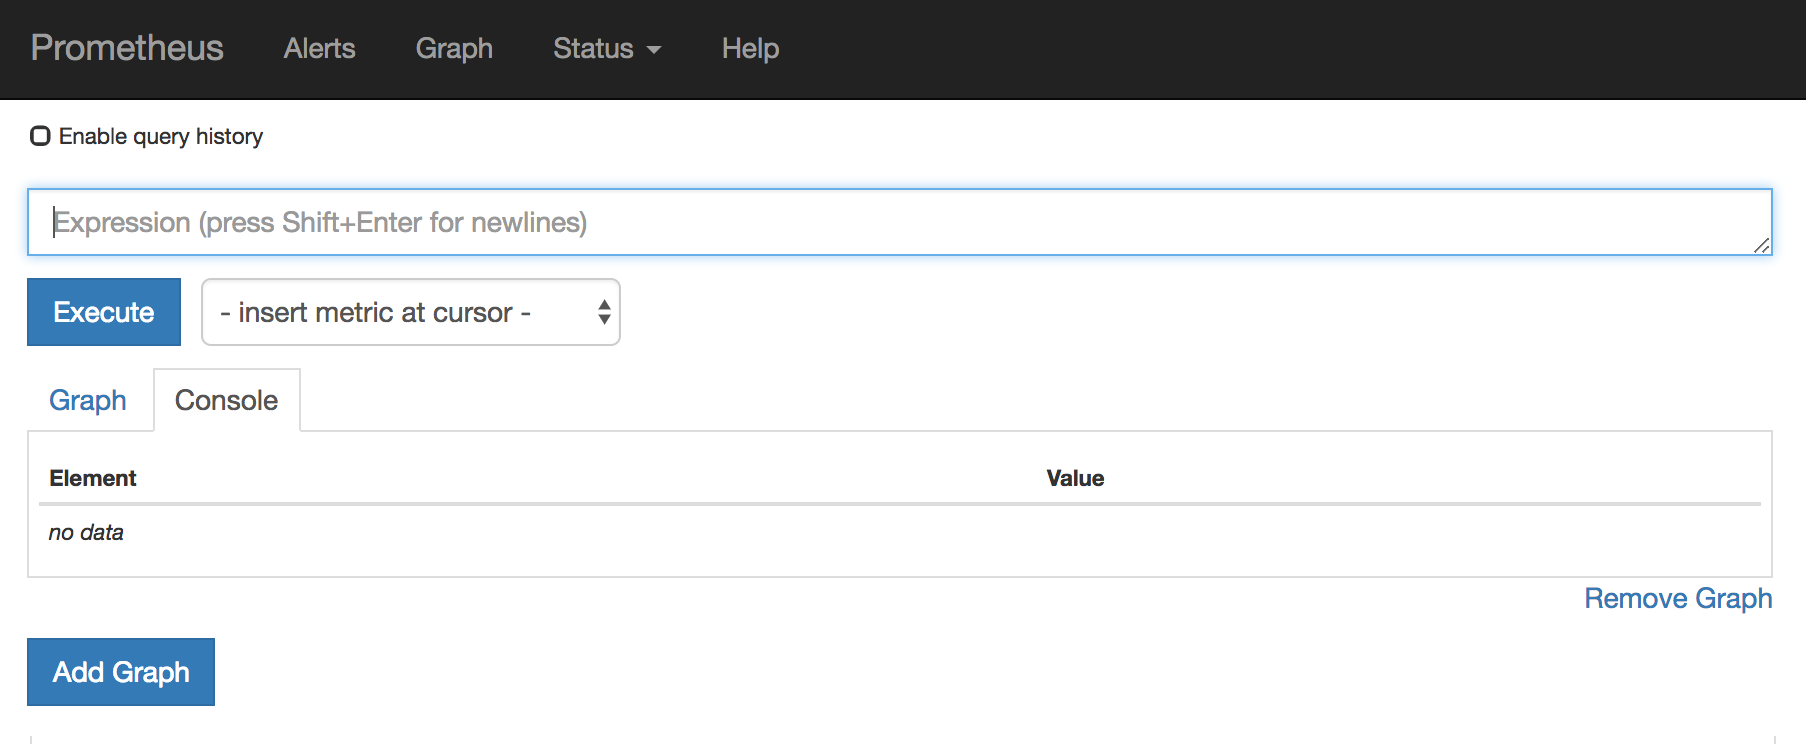
- For information about getting started with Prometheus, go to: https://prometheus.io/docs/prometheus/latest/getting_started/
5.2. Configuring Prometheus
The following sections describe how to configure Prometheus:
5.2.1. Setting OpenShift environment variables
To configure your application’s Prometheus instance, you can set the following environment variables in OpenShift:
| Environment Variable | Description | Default |
|---|---|---|
|
| The host address to bind. |
|
|
| If set, disables the activation of Prometheus (echoes an empty value). | Prometheus is enabled. |
|
| The Port to use. |
|
|
| Uses the file (including path) as the Prometheus configuration file. | The /opt/prometheus/prometheus-config.yml file with Camel metrics. |
|
| Additional options to append to the JMX exporter configuration. | Not applicable. |
For information on setting environment variables for a pod, see the OpenShift Developer Guide (https://access.redhat.com/documentation/en-us/openshift_container_platform/3.11/html/developer_guide/).
5.2.2. Controlling the metrics that Prometheus monitors and collects
By default, Prometheus uses a configuration file ( https://raw.githubusercontent.com/jboss-fuse/application-templates/master/prometheus/prometheus-config.yml) that includes all possible metrics exposed by Camel.
If you have custom metrics within your application that you want Prometheus to monitor and collect (for example, the number of orders that your application processes), you can use your own configuration file. Note that the metrics that you can identify are limited to those supplied in JMX.
Procedure
To use a custom configuration file to expose JMX beans that are not covered by the default Prometheus configuration, follow these steps:
Create a custom Prometheus configuration file. You can use the contents of the default file (
prometheus-config.ymlhttps://raw.githubusercontent.com/jboss-fuse/application-templates/master/prometheus/prometheus-config.yml) as a guide for the format.You can use any name for the custom configuration file, for example:
my-prometheus-config.yml.-
Add your prometheus configuration file (for example,
my-prometheus-config.yml) to your application’ssrc/main/fabric8-includesdirectory. Create a
src/main/fabric8/deployment.xmlfile within your application and add an entry for the AB_JMX_EXPORTER_CONFIG environment variable with its value set to your configuration file. For example:Copy to Clipboard Copied! Toggle word wrap Toggle overflow This environment variable applies to your application at the pod level.
- Rebuild and deploy your application.
5.2.3. Generating alerts
For an example of using Prometheus for OpenShift to generate alerts, see the Red Hat Cloud Forms Monitoring, Alerts, and Reporting guide:
5.2.4. Configuring an external Prometheus instance to monitor Fuse Online Integration applications
When you install Fuse Online on OpenShift Container Platform, a syndesis-prometheus instance is included by default. For detailed instructions on how to install Fuse Online on premise OpenShift Container Platform, see Integrating Applications with Fuse Online.
However, if you already have an existing external Prometheus instance, you can configure that external instance to also monitor Fuse Online Integration applications that are deployed on OpenShift Container Platform.
The steps depend on whether you used the Prometheus operator to install your external Prometheus instance.
5.2.4.1. Configuring a Prometheus instance (with the Prometheus operator)
If you installed a Prometheus instance by using the Prometheus operator, updating your external Prometheus configuration to monitor Fuse Online integration involves adding and then editing a service monitor.
Prerequisite
You installed Prometheus as described in Section 5.1, “Setting up Prometheus”.
Procedure
In a terminal window, add a service monitor to the namespace (project) in which you installed Prometheus:
oc process -f {$templates-base-url}/fuse-servicemonitor.yml -p NAMESPACE=<YOUR-NAMESPACE> -p FUSE_SERVICE_NAME=fuseonline | oc create -f -oc process -f {$templates-base-url}/fuse-servicemonitor.yml -p NAMESPACE=<YOUR-NAMESPACE> -p FUSE_SERVICE_NAME=fuseonline | oc create -f -Copy to Clipboard Copied! Toggle word wrap Toggle overflow - In the OpenShift console, open the project and then select Applications → Services.
- Click the fuseonline service and then select Actions → Edit YAML.
-
In the Editor, change the selector section of the YAML file by replacing
app: fuseonlinewithsyndesis.io/type: integration. - Click Save.
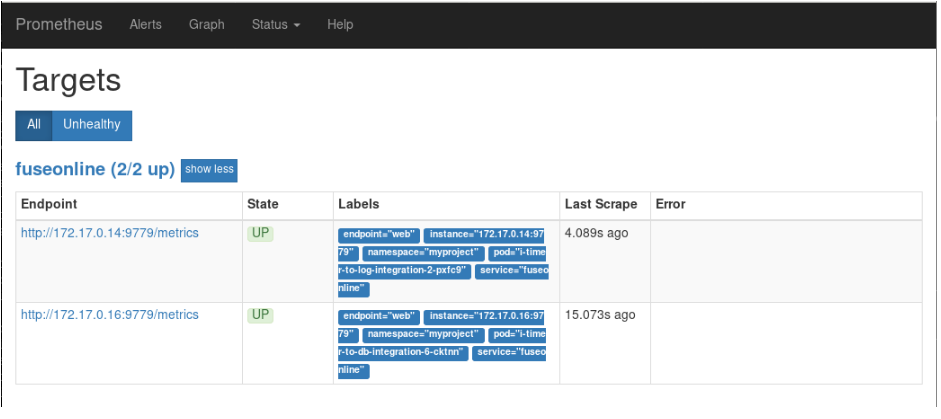
The Prometheus operator updates its configuration to monitor all Fuse Online integrations.
You can now view Fuse Online integrations in the Prometheus instance. The following example shows a Prometheus instance that monitors two integrations:
5.2.4.2. Configuring a Prometheus instance (without the Prometheus operator)
If you installed an external Prometheus instance without using the Prometheus operator, updating the configuration to monitor Fuse Online integration involves editing your Prometheus configuration file and updating the Prometheus pod configuration.
Prerequisite
You must have write access to the Prometheus configuration file (prometheus-config.yml). In the OpenShift web console, the configuration file is located in Resources → Config Maps.
Procedure
Edit your Prometheus configuration file (
prometheus-config.yml) as follows:Set the scrape interval to 5 seconds:
global:
        scrape_interval:     5s
        evaluation_interval: 5s
global: scrape_interval: 5s evaluation_interval: 5sCopy to Clipboard Copied! Toggle word wrap Toggle overflow Add a scrape config job named
integration-podwith the Kubernetes service discovery configuration that configures it to scrape pods in the${OPENSHIFT_PROJECT}, which is typically thesyndesisnamespace:Copy to Clipboard Copied! Toggle word wrap Toggle overflow Add a
relabel_configssection that:-
Only scrapes integration pods with the
prometheus.io/scrapelabel set to true. -
Sets the
metrics_pathandaddresslabels, that are used to scrape the JMX exporter in the integration pod, by using values from theprometheus.io/pathandprometheus.io/portlabels. - Adds pod labels and annotations as Prometheus labels.
Creates
kubernetes_namespaceandkubernetes_pod_namelabels.Here is an example
relabel_configssection:Copy to Clipboard Copied! Toggle word wrap Toggle overflow
-
Only scrapes integration pods with the
Fuse Online integrations expose a large number of metrics from the JVM, Camel and CXF. To reduce the amount of storage needed for metrics, add the following
metric_relabel_configssection to filter out metrics that are not displayed in the Fuse Online console.Copy to Clipboard Copied! Toggle word wrap Toggle overflow NoteThe last configuration line explicitly lists metrics to be added in Prometheus metrics store that are critical to the statistics shown in the Fuse Online web console. Your Prometheus instance must explicitly allow these metrics to be collected if other metrics are being filtered.
Update the Prometheus pod configuration to store 30 days worth of metric data as follows:
args:
            - '--config.file=/etc/prometheus/prometheus.yml'
            - '--storage.tsdb.retention=30d'
args: - '--config.file=/etc/prometheus/prometheus.yml' - '--storage.tsdb.retention=30d'Copy to Clipboard Copied! Toggle word wrap Toggle overflow