Monitoring Guide
Monitoring Gluster Cluster
Abstract
Chapter 1. Overview
Red Hat Gluster Storage Web Administration provides visual monitoring and metrics infrastructure for Red Hat Gluster Storage 3.5 and is the primary method to monitor your Red Hat Gluster Storage environment. The Red Hat Gluster Storage Web Administration is based on the Tendrl upstream project and utilizes Ansible automation for installation. The key goal of Red Hat Gluster Storage Web Administration is to provide deep metrics and visualization of Red Hat Storage Gluster clusters and the associated physical storage elements such as storage nodes, volumes, and bricks.
Key Features
- Monitoring dashboards for Clusters, Hosts, Volumes, and Bricks
- Top-level list views of Clusters, Hosts, and Volumes
- SNMPv3 Configuration and alerting
- User Management
- Importing Gluster cluster
Chapter 2. Import Cluster
You can import and start managing a cluster once Web Administration is installed and ready. For installation instructions, see the Installing Web Administration chapter of the Red Hat Gluster Storage Web Administration Quick Start Guide.
2.1. Importing Cluster
The following procedure outlines the steps to import a Gluster cluster.
Procedure. Importing Cluster
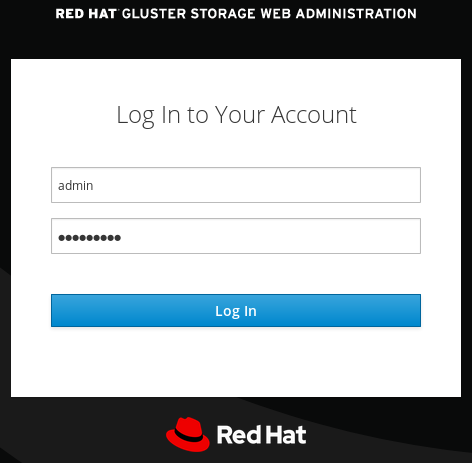
Log in to the Web Administration interface. Enter the username and password, and click Log In.
NoteThe default username is admin and the default password is adminuser.
Figure 2.1. Login Page
In the default landing interface, a list of all the clusters ready to be imported is displayed. Locate the cluster to be imported and click Import.
Figure 2.2. Import Cluster

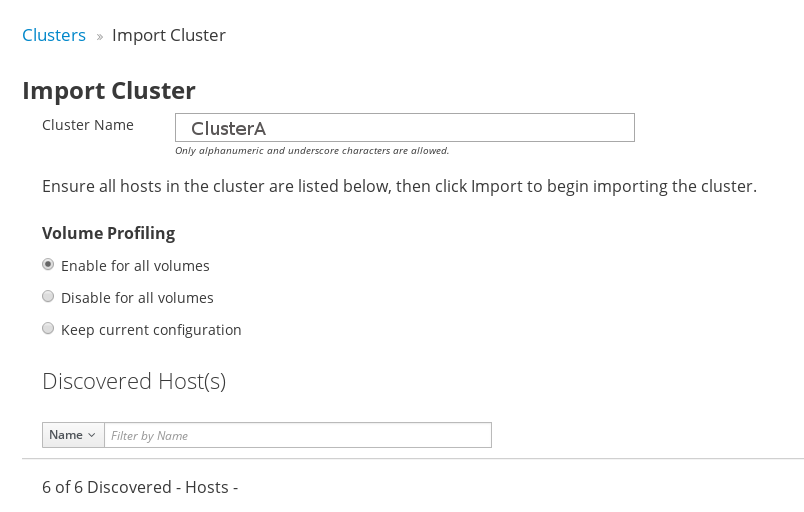
Enter a user-friendly Cluster name. By default, the Enable for all volumes option is selected.
Figure 2.3. Cluster name
 Note
NoteIf the cluster name is not provided, the system will assign a randomly generated uuid as a cluster name. However, it is advisable to enter a user-friendly cluster name to easily locate the cluster from the clusters list.
- Click Import to continue.
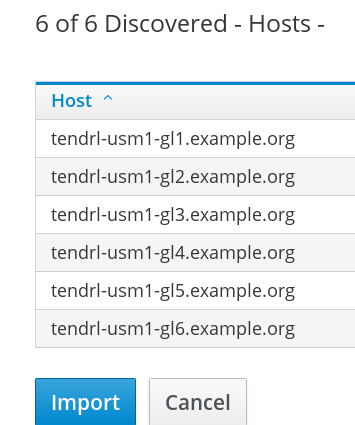
The cluster import request is submitted. To view the task progress, click View Task Progress.
Figure 2.4. Task Detail

- Navigate to the All Clusters interface view. The Cluster is successfully imported and ready for use.
Figure 2.5. Cluster Ready

2.1.1. Troubleshooting Import Cluster
Scenario: The Import cluster UI button is disabled after a failed cluster import operation.
In this scenario, when cluster import fails, the Import button is disabled.
Resolution
Resolve the issue by investigating why the import cluster operation failed. To see details of the failed operation, navigate to the All Clusters interface of the Web Administration environment. In the clusters list, locate the cluster that you attempted to import and click on View Details next to the Import Failed status label.
Examine the reason of the failed cluster import operation and resolve the issue. After resolving the issue, unmanage the cluster and then reimport the cluster. For unmanaging cluster instructions, navigate to the Unmanaging Cluster section of this Guide.
2.1.2. Volume Profiling
Volume profiling enables additional telemetry information to be collected on a per volume basis for a given cluster, which helps in troubleshooting, capacity planning, and performance tuning.
Volume profiling can be enabled or disabled on a per cluster basis and per volume basis when a cluster is actively managed and monitored using the Web Administration interface.
Enabling volume profiling results in richer set of metrics being collected which may cause performance degradation to occur as system resources, for example, CPU and memory, may get used for volume profiling data collection.
Volume Profiling at Cluster Level
To enable or disable volume profiling at cluster level:
- Log in to the Web Administration interface
From the Clusters list, locate the cluster to disable Volume Profiling.
NoteClusters list is the default landing interface after login and the Interface switcher is on All Clusters.
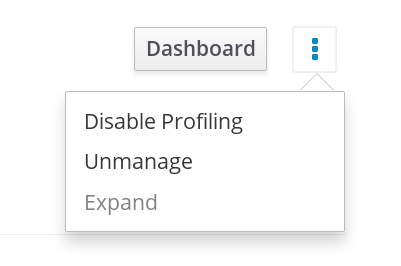
- At the right-hand side, next to the Dashboard button, click the vertical ellipsis.
An inline menu is opened. Click Disable Profiling or Enable Profiling depending on the current state. In the example screen below, Volume Profiling option is enabled. Click Disable Profiling to disable.
Figure 2.6. Disable Volume Profiling
- The disable profiling task is submitted and processed. After processing, Volume Profiling is successfully disabled.
Figure 2.7. Disable Volume Profiling

Volume Profiling at Volume Level
To enable or disable volume profiling at Volume level:
- Log in to the Web Administration interface and select the specific cluster from the Interface switcher drop-down.
- After selecting the specific cluster, the left vertical navigation pane is exposed.
From the navigation pane, click Volumes. The Volumes view is displayed listing all the Volumes part of the cluster.
Figure 2.8. Volumes View

Locate the volume and click Disable Profiling or Enable Profiling depending on the current state. In the example screen below, Volume Profiling is enabled. To disable volume profiling, click Disable Profiling.
Figure 2.9. Disable Volume Profiling

- The disable profiling task is submitted and processed. After processing, Volume Profiling is successfully disabled.
Figure 2.10. Disable Volume Profiling

Volume Profiling Metrics
When volume profiling is disabled, the following metrics will not be displayed in the Grafana Dashboard. Based on the metrics required to view, enable or disable volume profiling accordingly.
For detailed information on Volume Profiling, see the Monitoring Red Hat Gluster Storage Gluster Workload chapter of the Red Hat Gluster Storage Administration Guide.
| Grafana Dashboard Level | Dashboard Section | Panel and Metrics |
|---|---|---|
| Cluster Dashboard | At-a-glance | IOPS |
| Host Dashboard | At-a-glance | Brick IOPS |
| Volume Dashboard | Performance | IOPS |
| Volume Dashboard | Profiling Information | File Operations For Locks |
| Volume Dashboard | Profiling Information | Top File Operations |
| Volume Dashboard | Profiling Information | File Operations for Read/Write |
| Volume Dashboard | Profiling Information | File Operations for Inode Operations |
| Volume Dashboard | Profiling Information | File Operations for Entry Operations |
| Brick Dashboard | At-a-glance | IOPS |
Chapter 3. Cluster Expansion
To expand an existing Gluster cluster already imported and managed by the Web Administration environment, perform the following sequence of actions:
Create New Nodes
Before initiating cluster expansion in the Web Administration interface, create new Gluster storage nodes to be imported in Web Administration. For detailed instructions, see the Expanding Volumes section in the Red Hat Gluster Storage Administration Guide.
New Alert
After successfully expanding the cluster with new nodes, an alert is generated in the Notifications panel of the Web Administration interface as displayed in the following screen:
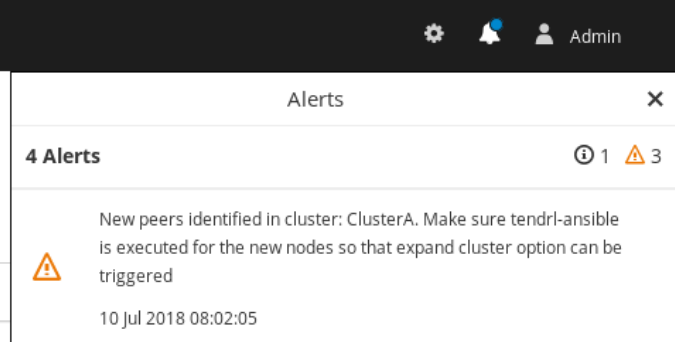
In this screen, new peers represents new storage nodes that were created in the previous cluster expansion process.
New Event
Additionally, a new Event is also generated about the availability of new storage nodes for expansion as displayed in the following screen:

Run Tendrl-ansible installation for new nodes
After the storage nodes are identified by Web Administration, run tendrl-ansible installation by adding the new hosts in the inventory file. For detailed installation instructions, see the Installing Web Administration chapter in the Red Hat Gluster Storage Web Administration Quick Start Guide.
If you have implemented TLS-based client-server authentication, install and deploy TLS encryption certificates on the new nodes before running tendrl-ansible installation to avoid cluster expansion failure. For detailed information on configuring TLS encryption, see the TLS Encryption Configuration chapter of the Red Hat Gluster Storage Web Administration Quick Start Guide.
Expand Cluster in Web Administration Environment
After tendrl-ansible is executed, the expand cluster option becomes available in the Web Administration interface. Follow these instructions to expand the cluster:
Procedure. Expanding Cluster
- Log in to the Web Administration interface and click All Clusters interface from the interface selector drop-down.
In the Clusters view, locate the cluster to be expanded. It will be labelled as Expansion required.

At the far right of the cluster row, click the vertical ellipsis and then click Expand.

The available hosts to be added are listed. Click Expand.
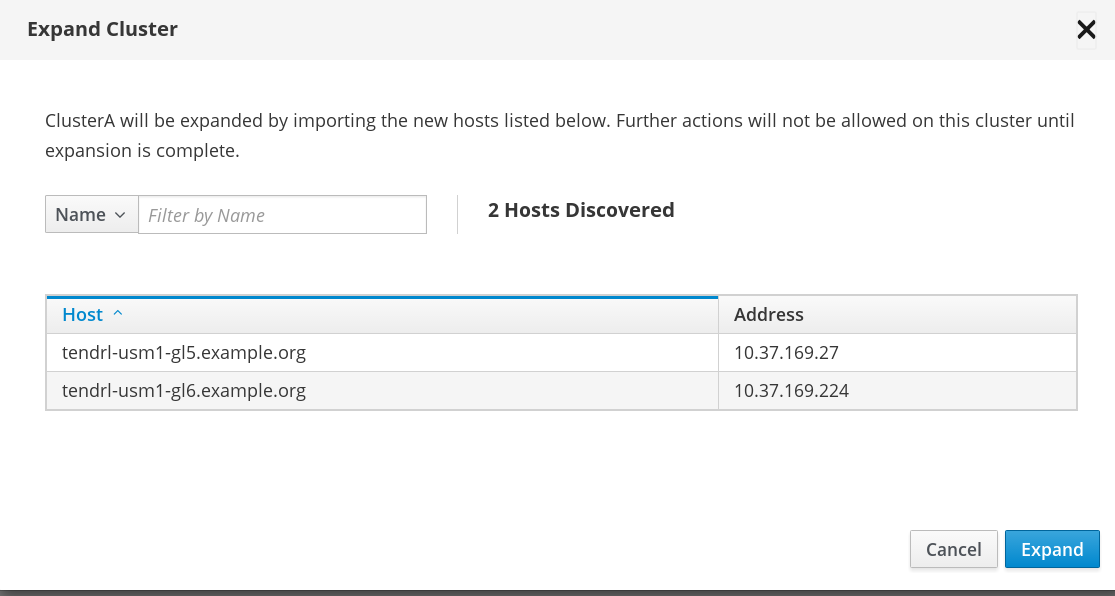
The cluster expansion task is submitted.

- The cluster is successfully expanded and ready for use.

3.1. Troubleshooting Cluster Expansion
Scenario: Cluster Expansion task failed
In this scenario, the cluster explansion task fails.
Resolution
If cluster expansion fails, check if tendrl-ansible was executed successfully and ensure the node agents are correctly configured. If cluster expansion failed due to errors, resolve the errors on affected nodes and re-initiate the Expand Cluster action.
To verify tendrl-ansible execution steps, see the Web Administration Installation section of the Red Hat Gluster Storage Web Administration Quick Start Guide.
For detailed instructions on expanding cluster, navigate to the Cluster Expansion section of this Guide.
Chapter 4. Unmanaging Cluster
The following are the reasons to unmanage a cluster:
- Import cluster fails
- Removal of a cluster that is no longer under management and used for monitoring
- A way to remove orphaned cluster entries
Unmanage a cluster from Web Administration
To unmanage a cluster:
- Log in to the Web Administration interface and select the All Clusters view from drop-down.
Locate the cluster from the list of imported clusters. At the far right of the cluster row, click the vertical ellipsis and then click Unmanage.
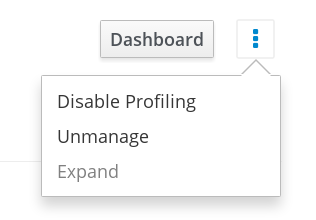
A confirmation box appears. Click Unmanage to proceed.
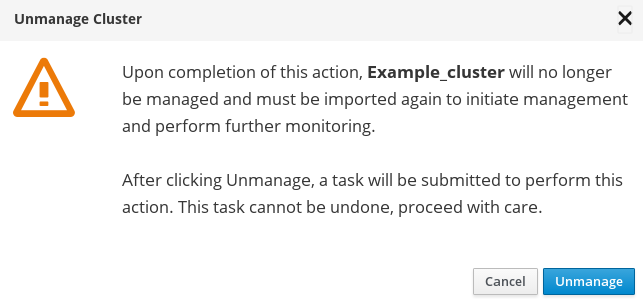
The unmanage cluster task is submitted. To view the task progress, click View Task Progress.

- The status shows Completed after the unmanage task is successfully completed.

After a cluster is unmanaged, it will not reappear immediately for reimport in the Web Administration environment. When the cluster is unmanaged, the tendrl-node-agent service undergoes synchronization with the nodes in the cluster. Based on the number of nodes in the cluster, expect a delay ranging from 60 seconds to a few minutes for the unmanaged cluster to reappear in the Web Administration environment.
4.1. Graphite and Carbon Data Archival
Graphite and Carbon Data Archival
When the cluster unmanage process is initiated, a concurrent process of cluster metrics data archival also begins. Once the cluster unmanage operation is successfully concluded, the Graphite and Carbon metrics data is archived to the following path on the Web Administration server:
/var/lib/carbon/whisper/tendrl/archive/clusters
/var/lib/carbon/whisper/tendrl/archive/clustersThe size of the archived data will depend on the size of the cluster that is unmanaged. You can either store the archived data or delete it to free some disk space.
4.2. Graphite Database Metrics Retention
The Graphite web service is a repository of telemetry data collected using collectd.
Changing metrics retention period
By default, Graphite retains the cluster metrics for a period of 180 days. To change the default metrics retention period for a given cluster, follow these steps:
- Unmanage the cluster by following the Unmanage Cluster procedure outlined in the Red Hat Gluster Storage Web Administration Monitoring Guide.
After the cluster is unmanaged, stop the
carbon-cacheservice on the Web Administration server:systemctl stop carbon-cache
# systemctl stop carbon-cacheCopy to Clipboard Copied! Toggle word wrap Toggle overflow Access the
storage-schemas.conffile at:/etc/tendrl/monitoring-integration/storage-schemas.conf
/etc/tendrl/monitoring-integration/storage-schemas.confCopy to Clipboard Copied! Toggle word wrap Toggle overflow Change the retention period in the retentions parameter under [tendrl] section and save the changes.
Example:
If you want to change the retention value to 90 days, set the value in the retentions parameter:
[tendrl]
pattern = ^tendrl\.
retentions = 60s:90d
[tendrl]
pattern = ^tendrl\.
retentions = 60s:90d
Copy to Clipboard Copied! Toggle word wrap Toggle overflow Where:
retentions = Each datapoint represents 60 seconds, and we want to keep enough datapoints so that they add up to 90 days of data.
Start the
carbon-cacheservice on the Web Administration server:systemctl start carbon-cache
# systemctl start carbon-cacheCopy to Clipboard Copied! Toggle word wrap Toggle overflow - Import the cluster again. For instructions, see the Import Cluster chapter in the Red Hat Gluster Storage Web Administration Monitoring Guide.
Chapter 5. Web Administration Log Levels
In Web Administration, the log messages of different components and services are logged by tendrl-node-agent. It receives all the log messages from other components via a socket and logs the messages using syslog.
tendrl-node-agent logs messages for the following Web Administration components:
Server-side Web Administration components:
-
tendrl-monitoring-integration -
tendrl-notifier
Storage node-side Web Administration components:
-
tendrl-gluster-integration
These are the available log levels for Web Administration:
- DEBUG
- INFO
- WARNING
- ERROR (Default)
- CRITICAL
The log levels are case-sensitive. Input the log levels in uppercase format to avoid any error messages.
To change the default log level (ERROR), follow these steps:
Open the logging configuration yaml file in an editor:
/etc/tendrl/node-agent/node-agent_logging.yaml
/etc/tendrl/node-agent/node-agent_logging.yamlCopy to Clipboard Copied! Toggle word wrap Toggle overflow Change the log level by modifying all instances of level variables under handlers and root:
Copy to Clipboard Copied! Toggle word wrap Toggle overflow Restart the
tendrl-node-agentservice by:service tendrl-node-agent restart
# service tendrl-node-agent restartCopy to Clipboard Copied! Toggle word wrap Toggle overflow
Chapter 6. Monitoring and Metrics
Gluster Web Administration provides deep metrics and visualization of Gluster clusters, the physical server nodes and the storage elements (disks) through the Grafana open-source monitoring platform.
Chapter 7. Monitoring Dashboard and Concepts
The Monitoring Dashboard provides high level visual information on health, performance and utilization of cluster wide resources.
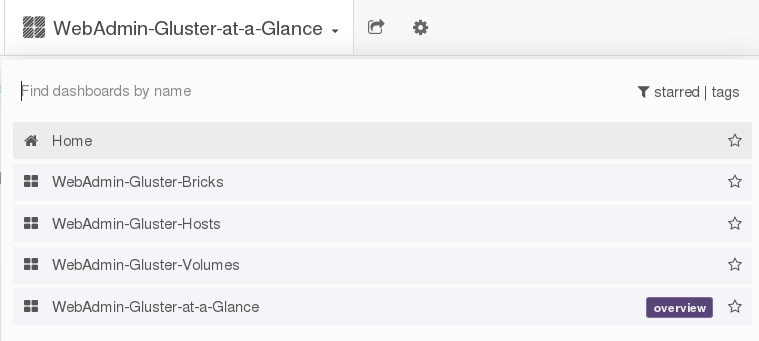
7.1. Dashboard Selector
The Dashboard Selector is the primary navigation tool to move between different dashboards.
Figure 7.1. Dashboard Selector
7.2. Dashboard Panels
The Dashboard is composed of individual visualization blocks displaying different metrics and statistics termed as Panels. The panels exhibit different data based on the current status of the cluster component. Panels can be dragged and dropped and rearranged on the Dashboard.
The following are the types of panels available to visualize monitoring data:
Single Status Panel: The status panel displays the aggregated value of a series in e a single number data. For example, the Health, volume, snapshots are Singlestat panels.
Figure 7.2. Single Status Panel Example

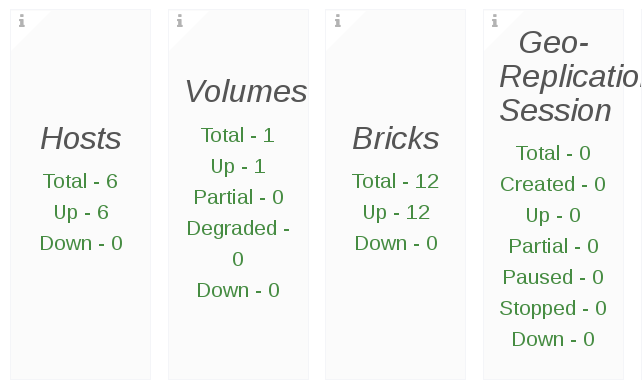
Multiple Status Panel: The Multiple status panel displays multiple values of a data source. The multiple status panel displays:
- The severity of the component
- If the component is disabled
Extra data in the panel about the component
Figure 7.3. Multiple Status Panel Example
 Note
NoteIf a multitple status panel displays Invalid Number as a status for a component, it indicates there is no data available to display from the time series database.
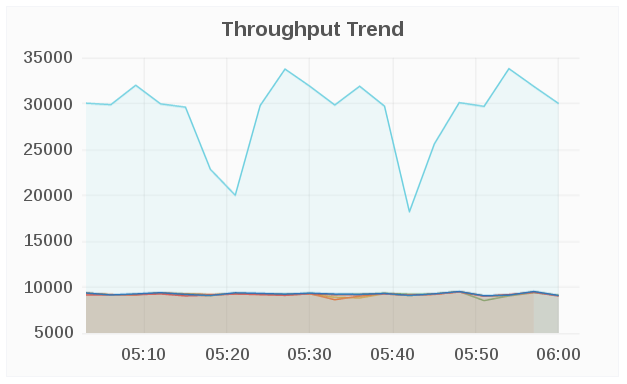
Graph Panel: The Graph panel allows to visualize unrestrained amounts of metrics. The Connection Trend and the Throughput Trend are examples of Graph panel.
Figure 7.4. Graph Panel Example
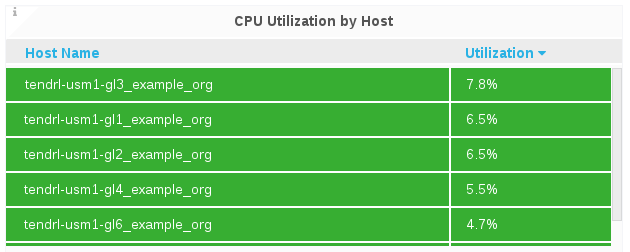
- Table Panel: The Graph panel allows to visualize unrestrained amounts of metrics. The Connection Trend and the Throughput Trend are examples of Graph panel.
Figure 7.5. Table Panel Example
7.3. Dashboard Rows
A row is a logical divider in a given Dashboard. The panels of the dashboard are arranged and organized in rows to give a streamlined look and visual.
7.4. Dashboard Color Codes
The Dashboard panels text displays the following color codes to represent health status information:
- Green: Healthy
- Orange: Degraded
- Red: Unhealthy, Down, or Unavailable
Chapter 8. Monitoring Dashboard Features
8.1. Dashboard Search
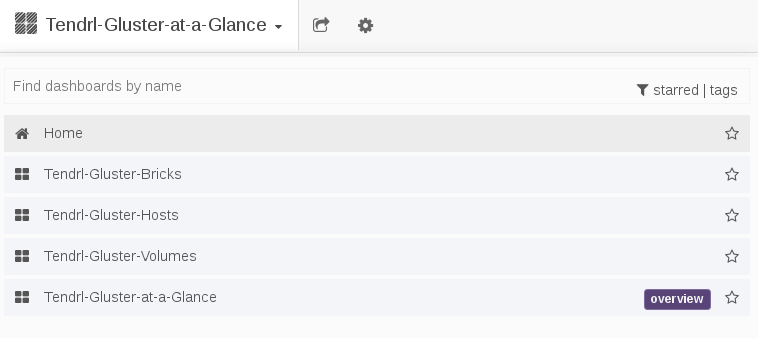
You can search the available dashboards by the dashboard name. The available filters to search a particular dashboard are starred and tags. The dashboard search functionality is accessed through the dashboard selector, located at the top of the Grafana interface.
Figure 8.1. Dashboard Search
8.2. Dashboard Time Range
The Grafana interface provides time range management of the the data being visualized. You can change the time range for a graph to view the data at different points in time
At the top right, you can access the master Dashboard time picker. It shows the currently selected time range and the refresh interval.

Clicking the master Dashboard time picker, toggles a menu for time range controls.

Time range
The time range filter allows to mix both explicit and relative time ranges. The explicit time range format is YYYY-MM-DD HH:MM:SS.
Quick Range
Quick ranges are preset values to choose a relative time.
Refreshing every
When enabled, auto-refresh will reload the dashboard at the specified time range.
8.3. Dashboard Sharing
The Dashboard Selector is the primary navigation tool to move between different dashboards.
Figure 8.2. Dashboard Selector

Chapter 10. Monitoring Cluster Metrics
10.1. Cluster Level Dashboard
This is the default dashboard of the Monitoring interface that shows the overview of the selected cluster.
10.1.1. Monitoring and Viewing Cluster Health
To monitor the Cluster health status and the metrics associated with it, view the panels in the Cluster Dashboard. For detailed panel descriptions and health indicators, see Table 7.1. Cluster Health Panel Descriptions.
10.1.1.1. Health and Snapshots
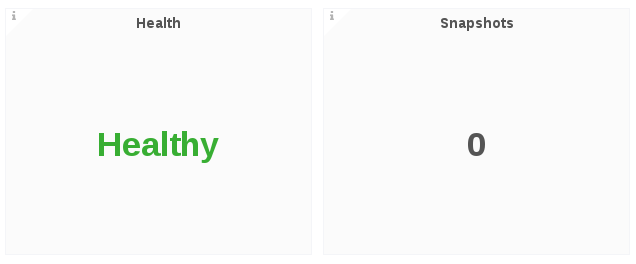
The Health panel displays the overall health of the selected cluster and the Snapshots panel shows the active number of snapshots.
10.1.1.2. Hosts, Volumes and Bricks
The Hosts, Volumes, and Bricks panels displays status information. The following is an example screen displaying the respective status information.
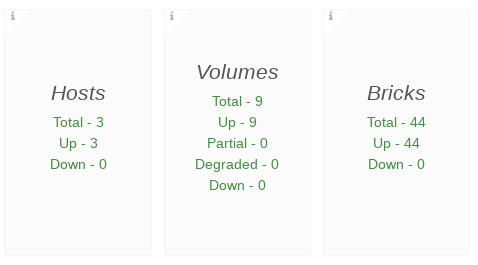
- Hosts: In total, there are 3 online Hosts
- Volumes: In total, there are 9 Volumes
- Bricks: In total, there are 44 Bricks
10.1.1.3. Geo-Replication Session
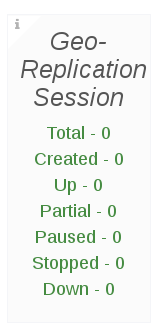
The Geo-Replication Session panel displays geo-replication session information from a given cluster, including the total number of geo-replication session and a count of geo-replication sessions by status.
10.1.1.4. Health Panel Descriptions
The following table lists the Panels and the descriptions.
| Panel | Description | Health Indicator |
|---|---|---|
| Health | The Health panel displays the overall health of the selected cluster, which is either Healthy or Unhealthy | Green: Healthy Red: Unhealthy Orange: Degraded |
| Snapshots | The Snapshots panel displays the count of the active snapshots | |
| Hosts | The Hosts panel displays host status information including the total number of hosts and a count of hosts by status | |
| Volume | The Volumes panel displays volume status information for the selected cluster, including the total number of volumes and a count of volumes by status | |
| Bricks | The Bricks panel displays brick status information for the selected cluster, including the total number of bricks in the cluster, and a count of bricks by status | |
| Geo-Replication Session | The Geo-Replication Session panel displays geo-replication session information from a given cluster, including the total number of geo-replication session and a count of geo-replication sessions by status |
10.1.2. Monitoring and Viewing Cluster Performance
Cluster performance metrics can be monitored by the data displayed in the following panels.
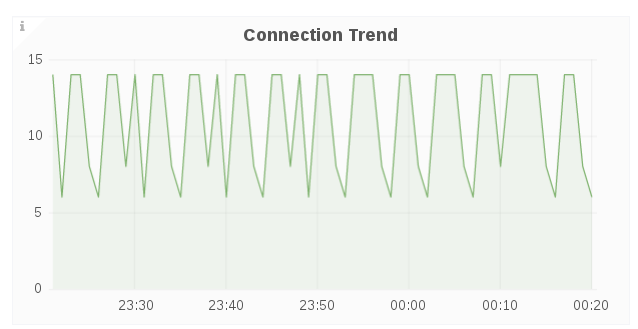
Connection Trend
The Connection Trend panel displays the total number of client connections to bricks in the volumes for the selected cluster over a period of time. Typical statistics may look like this:
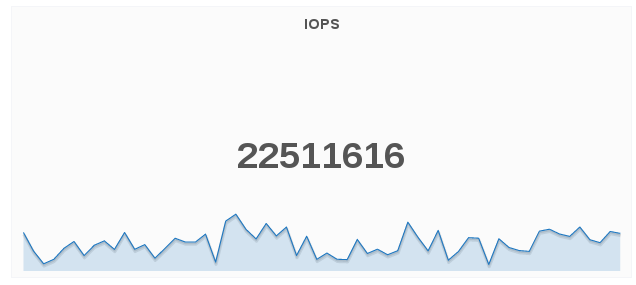
IOPS
The IOPS panel displays IOPS for the selected cluster over a period of time. IOPS is based on the aggregated brick level read and write operations collected using gluster volume profile info.
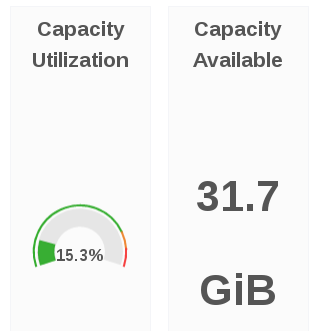
Capacity Utilization and Capacity Available
The Capacity Utilization panel displays the capacity utilized across all volumes for the selected cluster.
The Capacity Available panel displays the available capacity across all volumes for the selected cluster.
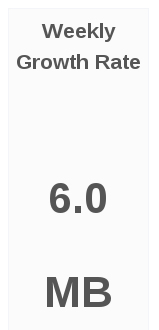
Weekly Growth Rate
The Weekly Growth Rate panel displays the forecasted weekly growth rate for capacity utilization computed based on daily capacity utilization.
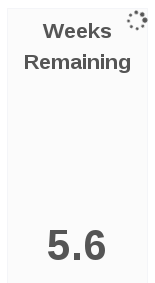
Weeks Remaining
The Weeks Remaining panel displays the estimated time remaining in weeks till volumes reach full capacity based on the forecasted Weekly Growth Rate.
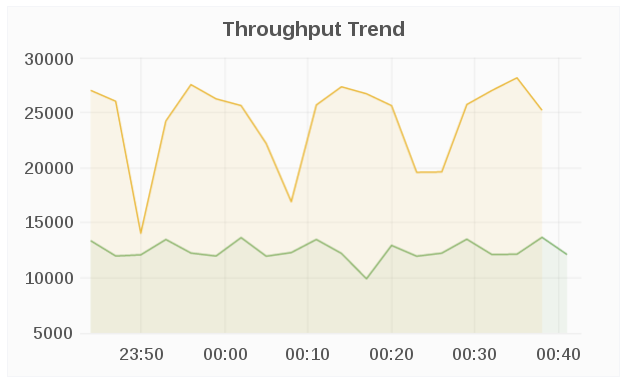
Throughput Trend
The Throughput Trend panel displays the network throughput for the selected cluster over a period of time.
10.1.3. Top Consumers
The Top Consumers panels displays the highest capacity utilization by the cluster resources.
To view the top consumers of the cluster:
In the Cluster level dashboard, at the bottom, click Top Consumers to expand the menu.
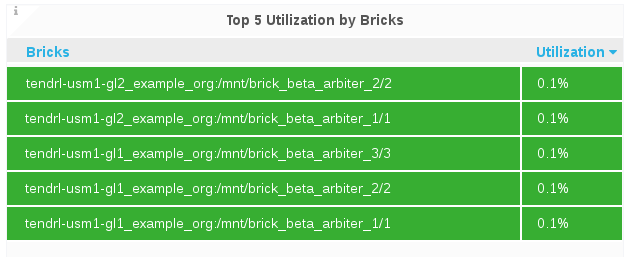
Top 5 Utilization By Bricks
The Top 5 Utilization By Bricks panel displays the bricks with the highest capacity utilization.
Top 5 Utilization by Volume
The Top 5 Utilization By Volumes panel displays the volumes with the highest capacity utilization.

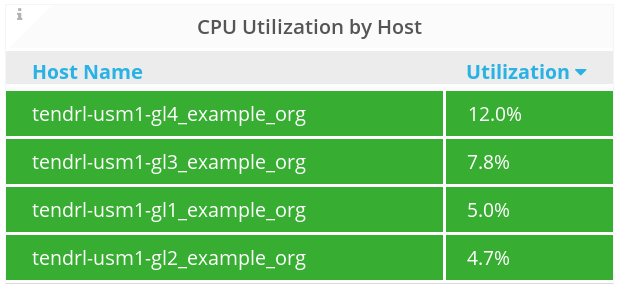
CPU Utilization by Host
The CPU Utilization by Host panel displays the CPU utilization of each node in the cluster.
Memory Utilization By Host
The Memory Utilization by Hosts panel displays memory utilization of each node in the cluster.

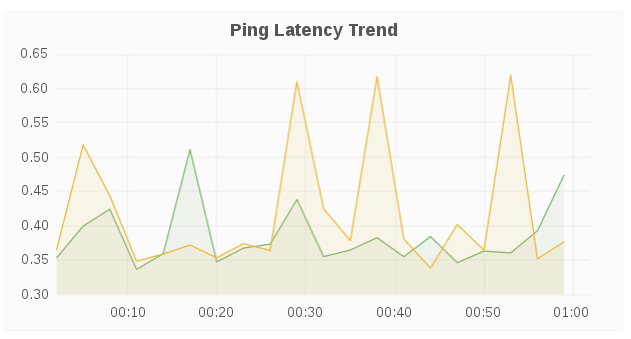
Ping Latency Trend
The Ping Latency Trend panel displays the ping latency for each host in a given cluster.
10.1.4. Monitoring and Viewing Cluster Status
To view the status of the overall cluster:
In the Cluster level dashboard, at the bottom, click Status to expand the menu.

- The Volume, Host, and Brick status are displayed in the panels.

Volume Status
The Volume Status panel displays the status code of each volume for the selected cluster.

The volume status is displayed in numerals and colors. The following are the corresponding status of the numerals.
- 0 = Up
- 3 = Up (Degraded)
- 4 = Up (Partial)
- 5 = Unknown
- 8 = Down
Host Status
The Host Status panel displays the status code of each host for the selected cluster.
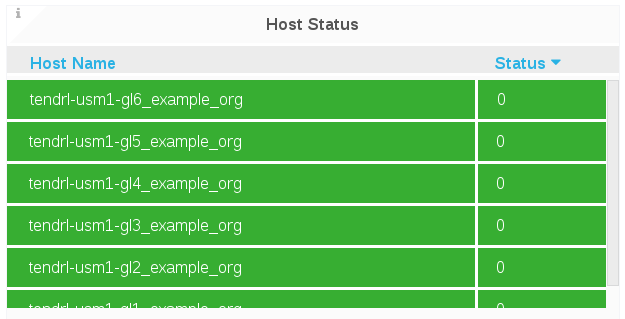
The Host status is displayed in numeric codes:
- 0 = Up
- 8 = Down
Brick Status
The Brick Status panel displays the status code of each brick for the selected cluster.
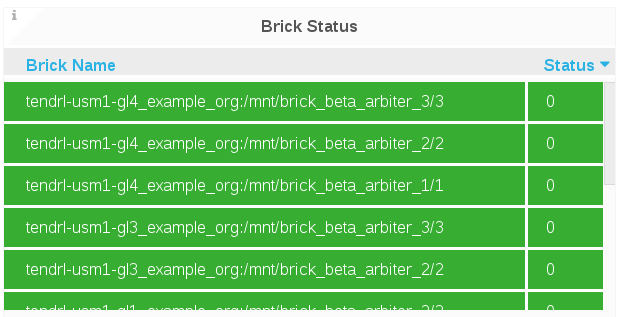
The Brick status is displayed in numeric codes:
- 1 = Started
- 10 = Stopped
10.2. Host Level Dashboard
10.2.1. Monitoring and Viewing Health and Status
To monitor the Cluster Hosts status and the metrics associated with it, navigate to the Hosts Level Dashboard and view the panels.
Health
The Health panel displays the overall health for a given host.

Bricks and Bricks Status
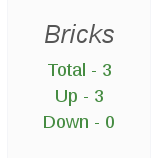
The Bricks panel displays brick status information for a given host, including the total number of bricks in the host, and a count of bricks by status.
The Brick Status panel displays the status code of each brick for a given host.
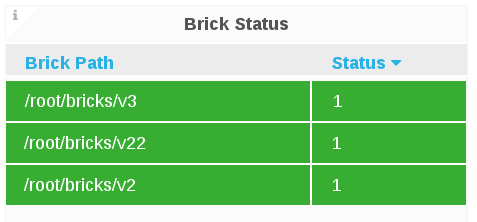
- 1 = Started
- 10 = Stopped
10.2.2. Monitoring and Viewing Performance
10.2.2.1. Memory and CPU Utilization
Memory Available
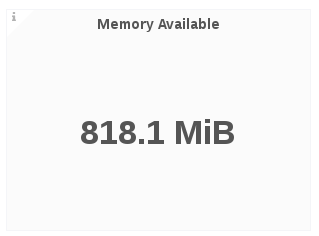
The Memory Available panel displays the sum of memory free and memory cached.
Memory Utilization
The Memory Utilization panel displays memory utilization percentage for a given host that includes buffers and caches used by the kernel over a period of time.
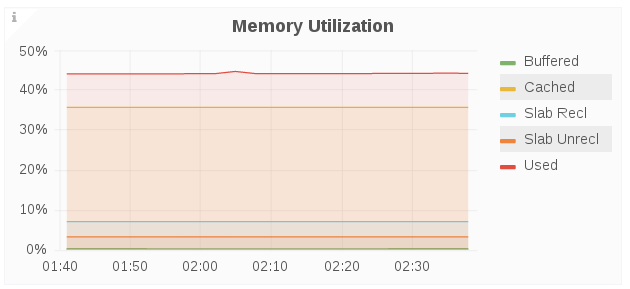
- Buffered: Amount of memory used for buffering, mostly for I/O operations
- Cached: Memory used for caching disk data for reads, memory-mapped files or tmpfs data
- Slab Rec: Amount of reclaimable memory used for slab kernel allocations
- Slab Unrecl: Amount of unreclaimable memory used for slab kernel allocations
- Used: Amount of memory used, calculated as Total - Free (Unused Memory) - Buffered - Cache
- Total: Total memory used
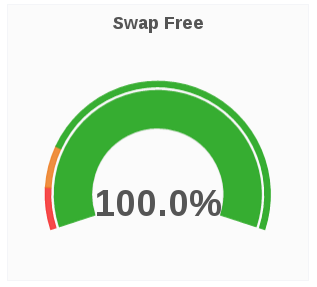
Swap Free
The Swap Free panel displays the available swap space in percent for a given host.
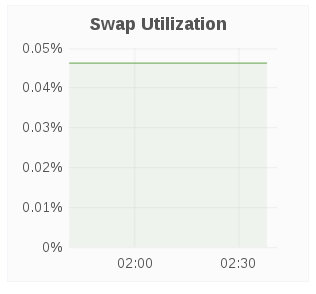
Swap Utilization
The Swap Utilization panel displays the used swap space in percent for a given host.
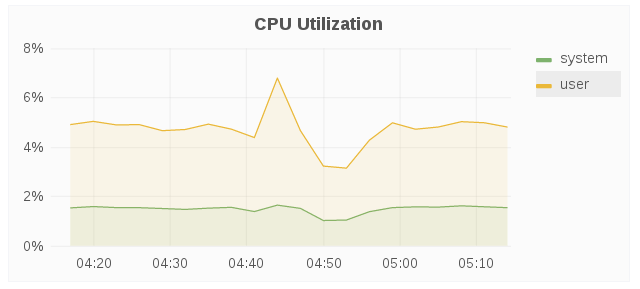
CPU Utilization
The CPU utilization panel displays the CPU utilization for a given host over a period of time.
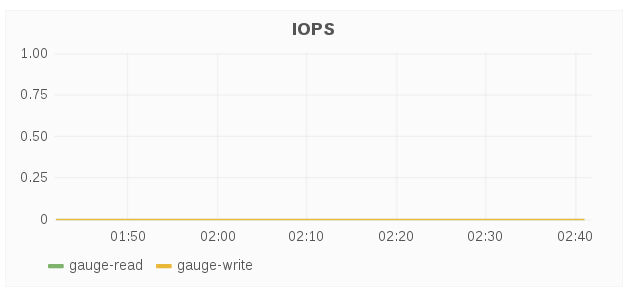
IOPS
The IOPS panel displays IOPS for a given host over a period of time. IOPS is based on the aggregated brick level read and write operations.
10.2.2.2. Capacity and Disk Load
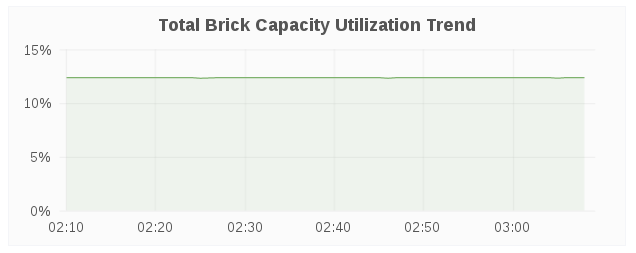
Total Brick Capacity Utilization Trend
The Total Brick Capacity Utilization Trend panel displays the capacity utilization for all bricks on a given for a period of time.
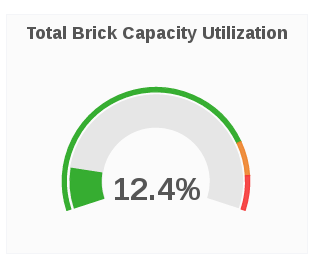
Total Brick Capacity Utilization
The Total Brick Capacity Utilization panel displays the current percent capacity utilization for a given host.
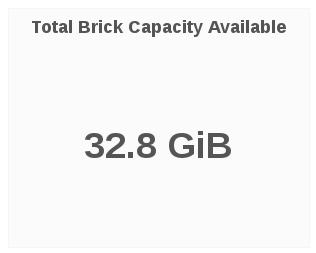
Total Brick Capacity Available
The Total Brick Capacity Available panel displays the current available capacity for a given host.
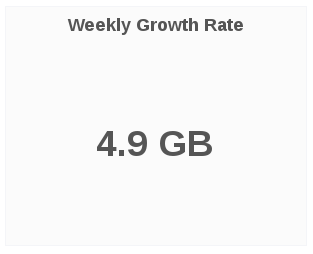
Weekly Growth Rate
The Weekly Growth Rate panel displays the forecasted weekly growth rate for capacity utilization computed based on daily capacity utilization.
Weeks Remaining
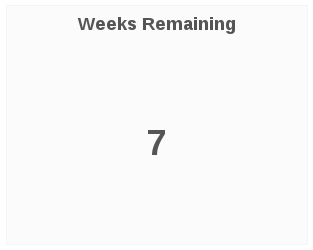
The Weeks Remaining panel displays the estimated time remaining in weeks till host capacity reaches full capacity based on the forecasted Weekly Growth Rate.
Brick Utilization
The Brick Utilization panel displays the utilization of each brick for a given host.

Brick Capacity
The Brick Capacity panel displays the total capacity of each brick for a given host.

Brick Capacity Used
The Brick Capacity Used panel displays the used capacity of each brick for a given host.

Disk Load
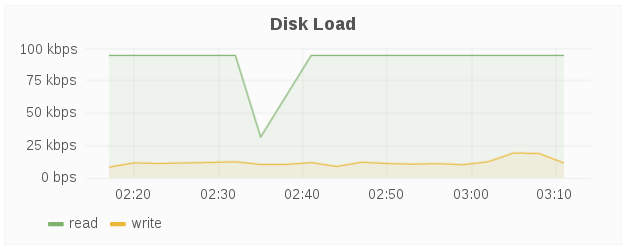
The Disk Load panel shows the host’s aggregated read and writes from/to disks over a period of time.
Disk Operation
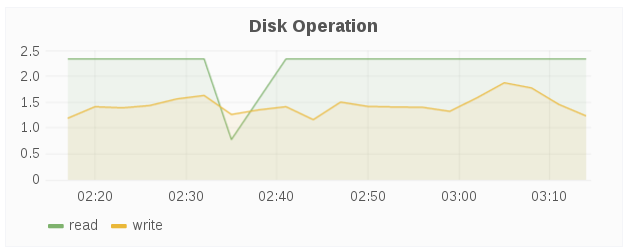
The Disk Operations panel shows the host’s aggregated read and writes disk operations over a period of time.
Disk IO
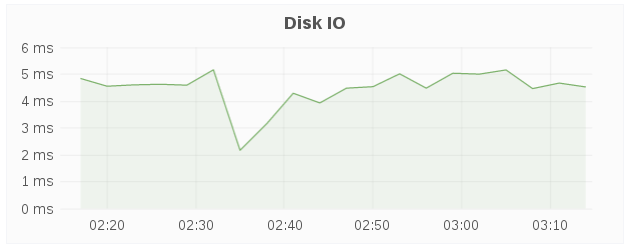
The Disk IO panel shows the host’s aggregated I/O time over a period of time.
10.2.2.3. Network
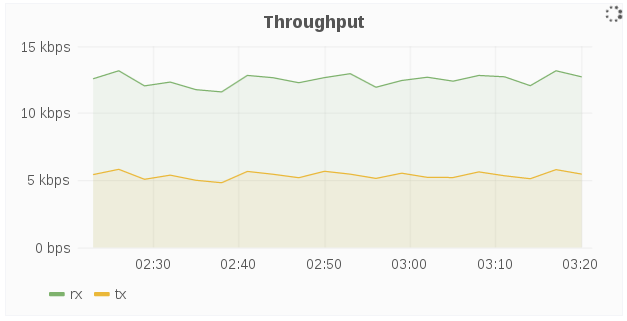
Throughput
The Throughput panel displays the network throughput for a given host over a period of time.
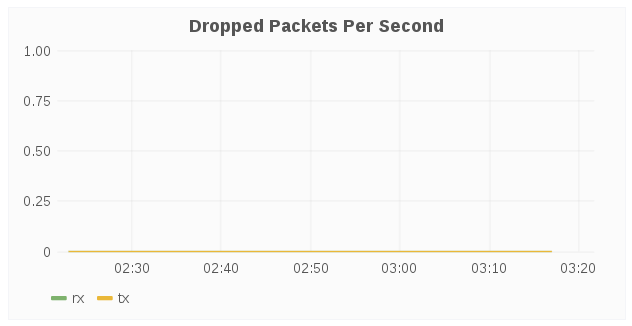
Dropped Packets Per Second
The Dropped Packets Per Second panel displays dropped network packets for the host over a period of time. Typically, dropped packets indicates network congestion, for example, the queue on the switch port your host is connected to is full and packets are dropped because it cannot transmit data fast enough.
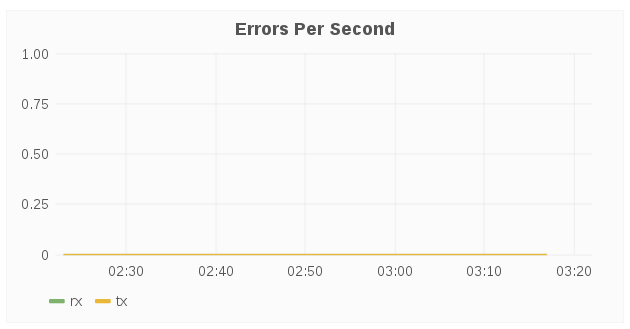
Errors Per Second
The Errors Per Second panel displays network errors for a given host over a period of time. Typically, the errors indicate issues that occurred while transmitting packets due to carrier errors (duplex mismatch, faulty cable), fifo errors, heartbeat errors, and window errors, CRC errors too short frames, and/or too long frames. In short, errors typically result from faulty hardware, and/or speed mismatch.
10.2.3. Host Dashboard Metric Units
The following table shows the metrics and their corresponding measurement units.
| Metrics | Units |
|---|---|
| Memory Available | Megabyte/Gigabyte/Terabyte |
| Memory Utilization | Percentage % |
| Swap free | Percentage % |
| Swap Utilization | Percentage % |
| CPU Utilization | Percentage % |
| Total Brick Capacity Utilization | Percentage % |
| Total Brick Capacity | MB/GB/TB |
| Weekly Growth Rate | MB/GB/TB |
| Disk Load | kbps |
| Disk IO | millisecond ms |
| Network Throughput | kbps |
10.3. Volume Level Dashboard
The Volume view dashboard allows the Gluster Administrator to:
- View at-a-glance information about the Gluster volume that includes health and status information, key performance indicators such as IOPS, throughput, etc, and alerts that can highlight attention to potential issues in the volume, brick, and disk.
- Compare 1 or more metrics such as IOPS, CPU, Memory, Network Load across bricks within the volume.
- Compare utilization such as IOPS, capacity, etc, across bricks within a volume.
- View performance metrics by brick (within a volume) to address diagnosing of failure, rebuild, degradation, and poor performance on one brick.
When all the Gluster storage nodes are shut down or offline, Time to live (TTL) will delete the volume details from etcd as per the TTL value measured in seconds. The TTL value for volumes is set based on the number of volumes and bricks in the system. The formula to calculate the TTL value to delete volume details is:
Time to Live (seconds) = synchronization interval (60 seconds) + number of volumes * 20 + number of bricks * 10 + 160.
In Web Administration environment
- Cluster will show status as unhealthy and all hosts will be marked as down
- No display of Volumes and Bricks
- The Events view will reflect the relevant status
In Grafana Dashboard
- In Cluster level Dashboard, the Host, Volumes, and Bricks panels reflects the relevant updated counts with status.
- In Cluster, Volume, and Brick level dashboards, some panels will be marked as N/A, indicating no data is available.
10.3.1. Monitoring and Viewing Health
Health
The Health panel displays the overall health for a given volume.

Snapshots
The Snapshots panel displays the count of active snapshots for the selected cluster.
Brick Status
The Brick Status panel displays the status code of each brick for a given volume.
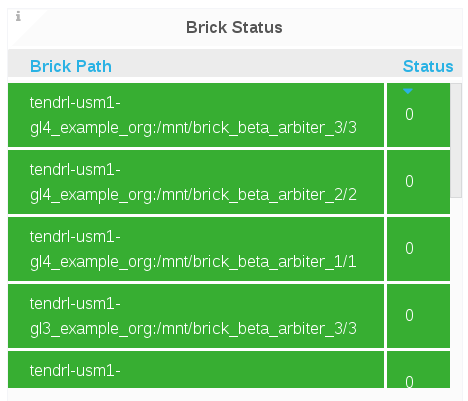
- 1 = Started
- 10 = Stopped
Bricks
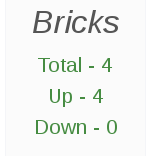
The Bricks panel displays brick status information for a given volume, including the total number of bricks in the volume, and a count of bricks by status.
Subvolumes
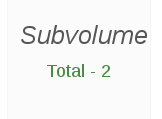
The Subvolumes panel displays subvolume status information for a given volume.
Geo-Replication Sessions
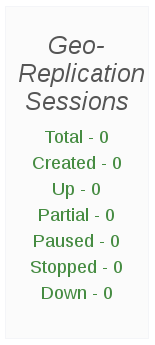
The Geo-Replication Session panel displays geo-replication session information from a given volumes, including the total number of geo-replication session and a count of geo-replication sessions by status.
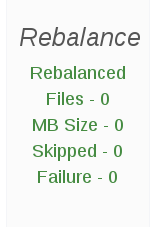
Rebalance
The Rebalance panel displays rebalance progress information for a given volume, which is applicable when rebalancing is underway.
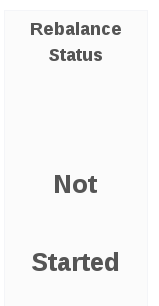
Rebalance Status:
The Rebalance Status panel displays the status of rebalancing for a given volume, which is applicable when rebalancing is underway.
10.3.2. Monitoring and Viewing Performance
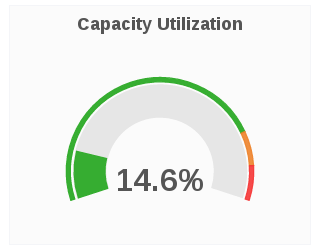
Capacity Utilization
The Capacity Utilization panel displays the used capacity for a given volume.
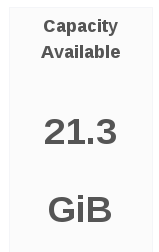
Capacity Available
The Capacity Available panel displays the available capacity for a given volume.
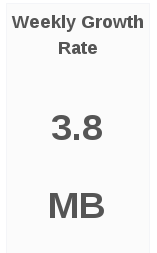
Weekly Growth Rate
The Weekly Growth Rate panel displays the forecasted weekly growth rate for capacity utilization computed based on daily capacity utilization.
Weeks Remaining
The Weeks Remaining panel displays the estimated time remaining in weeks till volume reaches full capacity based on the forecasted Weekly Growth Rate.

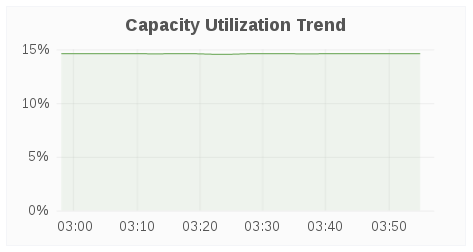
Capacity Utilization Trend
The Capacity Utilization Trend panel displays the volume capacity utilization over a period of time.
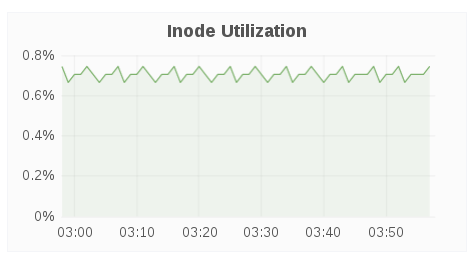
Inode Utilization
The Inode Utilization panel displays inodes used for bricks in the volume over a period of time.
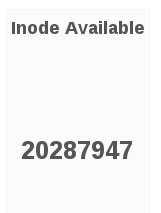
Inode Available
The Inode Available panel displays inodes free for bricks in the volume.
Throughput
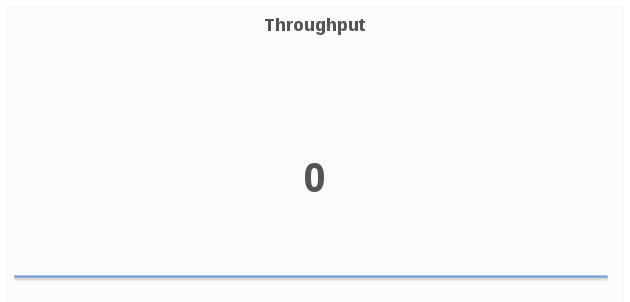
The Throughput panel displays volume throughput based on brick-level read and write operations fetched using gluster volume profile.
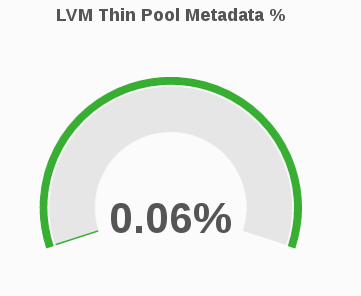
LVM Thin Pool Metadata %
The LVM Thin Pool Metadata % panel displays the utilization of LVM thin pool metadata for a given volume. Monitoring the utilization of LVM thin pool metadata and data usage is important to ensure they do not run out of space. If the data space is exhausted, I/O operations are either queued or failing based on the configuration. If metadata space is exhausted, you will observe error I/O’s until the LVM pool is taken offline and repair is performed to fix potential inconsistencies. Moreover, due to the metadata transaction being aborted and the pool doing caching there might be uncommitted (to disk) I/O operations that were acknowledged to the upper storage layers (file system) so those layers will need to have checks/repairs performed as well.
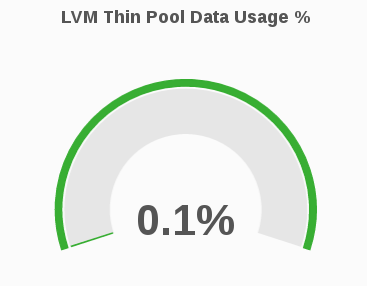
LVM Thin Pool Data Usage %
The LVM Thin Pool Data Usage % panel displays the LVM thin pool data usage for a given volume. Monitoring the utilization of LVM thin pool metadata and data usage is important to ensure they do not run out of space. If the data space is exhausted , I/O operations are either queued or failing based on the configuration. If metadata space is exhausted, you will observe error I/O’s until the LVM pool is taken offline and repair is performed to fix potential inconsistencies. Moreover, due to the metadata transaction being aborted and the pool doing caching there might be uncommitted (to disk) I/O operations that were acknowledged to the upper storage layers (file system) so those layers will need to have checks/repairs performed as well.
10.3.3. Monitoring File Operations
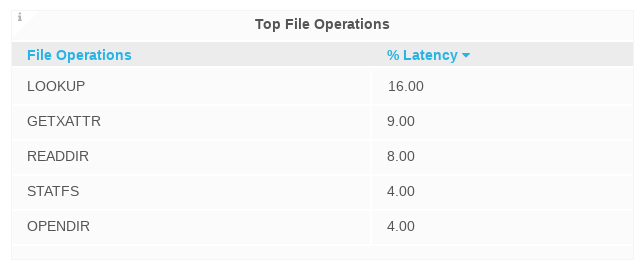
Top File Operations
The Top File Operations panel displays the top 5 FOP (file operations) with the highest % latency, wherein the % latency is the fraction of the FOP response time that is consumed by the FOP.
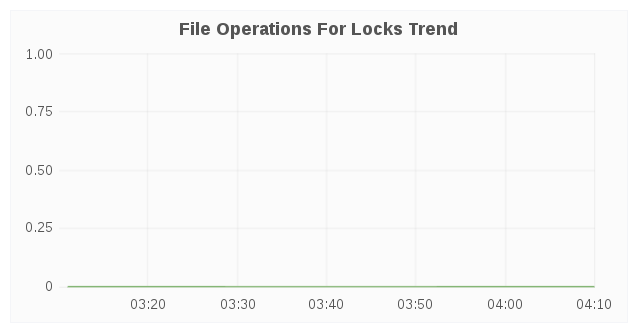
File Operations for Locks Trend
The File Operations for Locks Trend panel displays the average latency, maximum latency, call rate for each FOP for Locks over a period of time.
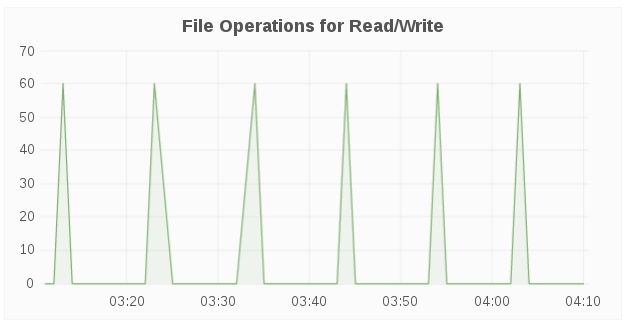
File Operations for Read/Write
The File Operations for Read/Write panel displays the average latency, maximum latency, call rate for each FOP for Read/Write Operations over a period of time.
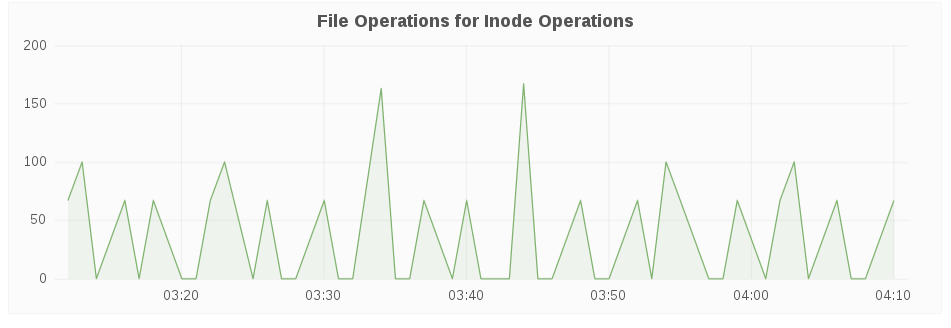
File Operations for Inode Operations
The File Operations for Inode Operations panel displays the average latency, maximum latency, call rate for each FOP for Inode Operations over a period of time.
File Operations for Entry Operations
The File Operations for Entry Operations panel displays the average latency, maximum latency, call rate for each FOP for Entry Operations over a period of time.

10.3.4. Volume Dashboard Metric Units
The following table shows the metrics and their corresponding measurement units.
| Metrics | Units |
|---|---|
| Capacity Utilization | Percentage % |
| Capacity Available | Megabyte/Gigabyte/Terabyte |
| Weekly Growth Rate | Megabyte/Gigabyte/Terabyte |
| Capacity Utilization Trend | Percentage % |
| Inode Utilization | Percentage % |
| Lvm Thin Pool Metadata | Percentage % |
| Lvm Thin Pool Data Usage | Percentage % |
| File Operations for Locks Trend | MB/GB/TB |
| File Operations for Read/Write | K |
| File Operations for Inode Operation Trend | K |
| File Operations for Entry Operations | K |
10.4. Brick Level Dashboard
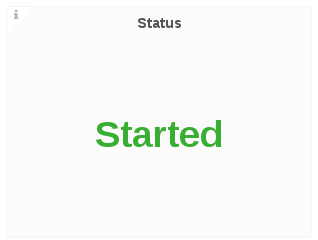
10.4.1. Monitoring and Viewing Brick Status
The Status panel displays the status for a given brick.
10.4.2. Monitoring and Viewing Brick Performance
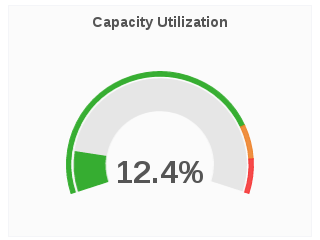
Capacity Utilization
The Capacity Utilization panel displays the percentage of capacity utilization for a given brick.
Capacity Available
The Capacity Available panel displays the available capacity for a given volume.

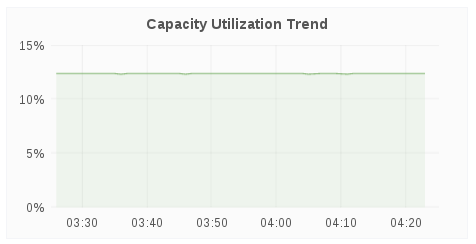
Capacity Utilization Trend
The Capacity Utilization Trend panel displays the brick capacity utilization over a period of time.
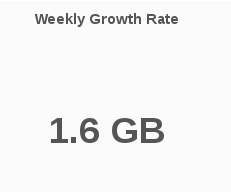
Weekly Growth Rate
The Weekly Growth Rate panel displays the forecasted weekly growth rate for capacity utilization computed based on daily capacity utilization.
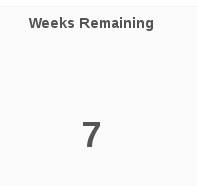
Weeks Remaining
The Weeks Remaining panel displays the estimated time remaining in weeks till brick reaches full capacity based on the forecasted Weekly Growth Rate.
Healing
The Healing panel displays healing information for a given volume based on healinfo.

The Healing panel will not show any data for volumes without replica.
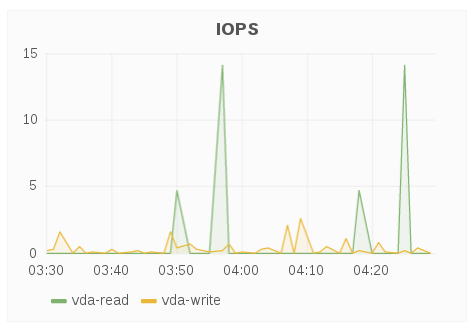
IOPS
The IOPS panel displays IOPS for a brick over a period of time. IOPS is based on brick level read and write operations.
LVM Thin Pool Metadata %
The LVM Thin Pool Metadata % panel displays the utilization of LVM thin pool metadata for a given brick. Monitoring the utilization of LVM thin pool metadata and data usage is important to ensure they don’t run out of space. If the data space is exhausted , I/O operations are either queued or failing based on the configuration. If metadata space is exhausted, you will observe error I/O’s until the LVM pool is taken offline and repair is performed to fix potential inconsistencies. Moreover, due to the metadata transaction being aborted and the pool doing caching there might be uncommitted (to disk) I/O operations that were acknowledged to the upper storage layers (file system) so those layers will need to have checks/repairs performed as well.
LVM Thin Pool Data Usage %
The LVM Thin Pool Data Usage % panel displays the LVM thin pool data usage for a given brick. Monitoring the utilization of LVM thin pool metadata and data usage is important to ensure they don’t run out of space. If the data space is exhausted , I/O operations are either queued or failing based on the configuration. If metadata space is exhausted, you will observe error I/O’s until the LVM pool is taken offline and repair is performed to fix potential inconsistencies. Moreover, due to the metadata transaction being aborted and the pool doing caching there might be uncommitted (to disk) I/O operations that were acknowledged to the upper storage layers (file system) so those layers will need to have repairs performed as well.
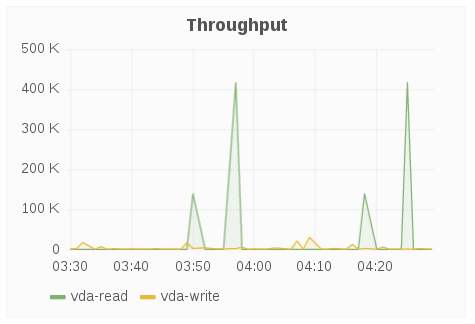
Throughput
The Throughput panel displays brick-level read and write operations fetched using “gluster volume profile.”
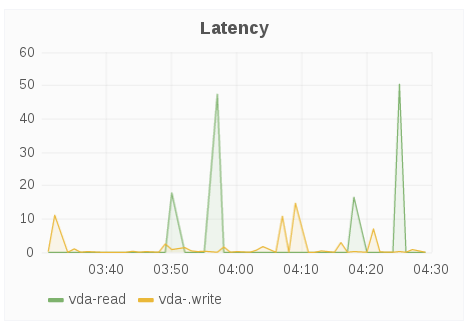
Latency
The Latency panel displays latency for a brick over a period of time. Latency is based on the average amount of time a brick spends doing a read or write operation.
10.4.3. Brick Dashboard Metric Units
The following table shows the metrics and their corresponding measurement units.
| Metrics | Units |
|---|---|
| Capacity Utilization | Percentage % |
| Capacity Available | Megabyte/Gigabyte/Terabyte |
| Weekly Growth Rate | Megabyte/Gigabyte/Terabyte |
| Capacity Utilization Trend | Percentage % |
| Inode Utilization | Percentage % |
| Lvm Thin Pool Metadata | Percentage % |
| Lvm Thin Pool Data Usage | Percentage % |
| Disk Throughput | Percentage % |
Chapter 11. Users and Roles Administration
11.1. User Roles
There are three user roles available for Web Administration.
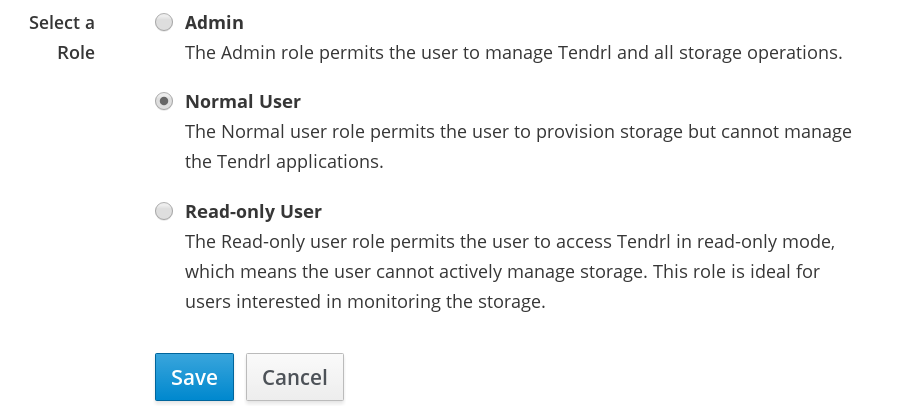
- Admin: The Admin role gives complete rights to the user to manage all Web Administration operations.
- Normal User: The Normal User role authorizes the user to perform operations such as importing cluster and enabling or disabling volume profiling but restricts managing users and other administrative operations.
- Read-only User: Read-only: The Read-only User role authorizes the user to only view and monitor cluster-wide metrics and readable data. The user can launch Grafana dashboards from the Web Administration interface but is restricted to perform any storage operations. This role is suited for users performing monitoring tasks.
11.2. Configuring Roles
To add and configure a new user, follow these steps:
- Log In the Web Administration interface and in navigation pane, click Admin > Users.
The users list is displayed. To add a new user, click Add at the right-hand side.

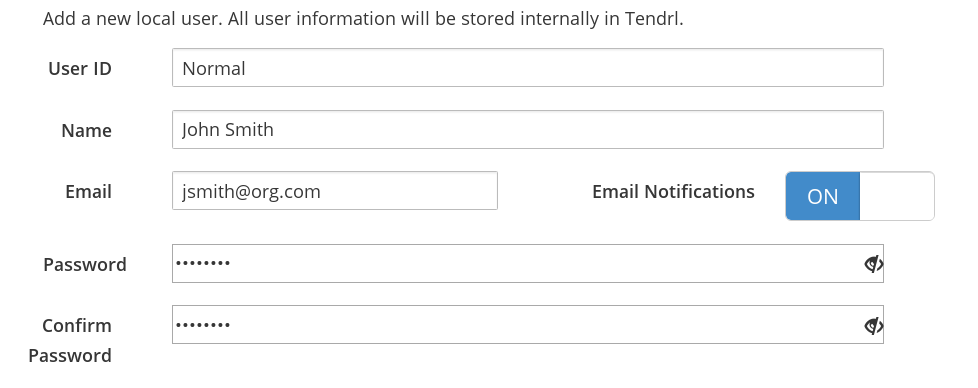
Enter the user information in the given fields. To enable or disable email notifications, toggle the ON-OFF button.
Select a Role from the available three roles and click Save.
- The new user is successfully created.

11.2.1. Editing Users
To edit an existing user:
- Navigate to the user view by clicking Admin > Users from the interface navigation.
Locate the user to be edited and click Edit at the right-hand side.

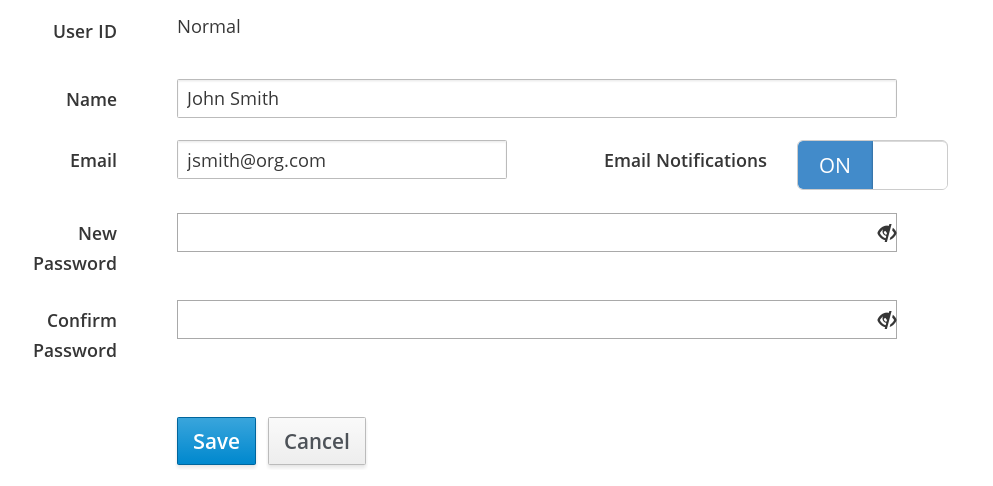
- Edit the required information and click Save.
11.2.2. Disabling Notifications and Deleting User
Enabling and Disabling Notifications
To enable notifications:
Navigate to the user view by clicking Admin > Users from the interface navigation.

Click the vertical elipsis next to the Edit button and click Disable Email Notification from the callout menu.
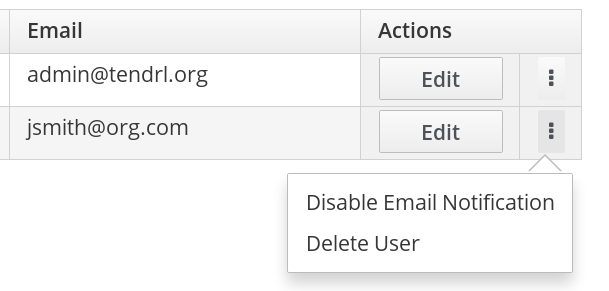
- Email notification is successfuly disabled for the user.

Deleting User
To delete an existing user:
- Navigate to the user view by clicking Admin > Users from the interface navigation.
Locate the user to be deleted and click the vertical elipsis next to the Edit button. A callout menu opens, click Delete User.

A confirmation box appears. Click Delete.

Chapter 12. Alerts and Notifications
Alerts are current problems and critical conditions that occur in the system and notified to the user. The Grafana monitoring platform generates alerts based on severity levels.
You can configure alerts via SMTP and SNMP protocols. SMTP configuration will send email alerts to users that have email notifications enabled. SNMPv3 configuration will send SNMP trap alerts to the Alerts notifications drawer of the Web Administration environment.
12.1. Types of Alerts
The alerts triggered by the dashboard are classified in the following categories:
- Status alerts : Alerts arising when a cluster resource undergoes a change of state. For example, Healthy to Unhealthy.
- Utilization alerts: Alerts arising after a cluster resource exceed the set threshold and after it reverts to the normal state. For example, when the Host CPU utilization is breached, an alert is triggered notifying the user about the event.
12.2. List of Alerts
The list of Web Administration alerts are given in the tables below.
Status Alerts
| Alert | System Resource(s) |
|---|---|
| volume status | Volume and Cluster |
| volume state | Volume and Cluster |
| brick status | Volume, Host, and Cluster |
| peer status | Cluster |
| rebalance status | Volume and Cluster |
| Geo-Replication status | Cluster |
| quorum of volume lost | Volume and Cluster |
| quorum of volume regained | Volume and Cluster |
| svc connected | Cluster |
| svc disconnected | Cluster |
| minimum number of bricks not up in EC subvolume | Volume and Cluster |
| minimum number of bricks up in EC subvolume | Volume and Cluster |
| afr quorum met for subvolume | Volume and Cluster |
| afr quorum fail for subvolume | Volume and Cluster |
| afr subvolume up | Volume and Cluster |
| afr subvolume down | Volume and Cluster |
Utilization Alerts
| Alert | System Resource |
|---|---|
| cpu utilization | Host |
| memory utilization | host |
| swap utilization | host |
| volume utilization | Volume and Cluster |
| brick utilization | Volume and Cluster |
12.3. Alerts Notifications Drawer
Alerts drawer is a notification indicator embedded in the Web Administration interface to display the system wide alerts.
Accessing Alerts Drawer
To access the Alerts drawer, log in the Web Administration interface. In the default landing interface, locate and click on the interactive bell icon on the header bar at the top right-hand side.

- The drawer is opened displaying the number of alerts generated.
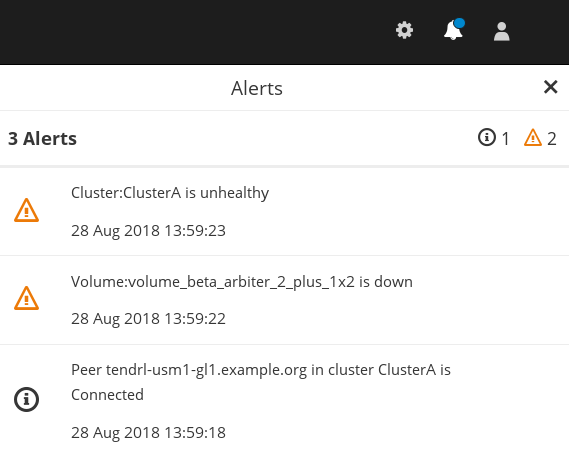
To filter alerts, click on the status icon at the right.

12.4. SMTP Notifications Configuration
Tendrl-ansible installs and configures tendrl-notifier. After the tendrl-notifier file is configured, configure SMTP email notifications:
-
Open the
/etc/tendrl/notifier/email.conf.yamlfile. Update the parameters:
email_id = <The sender email id>

email_smtp_server = <The smtp server>

email_smtp_port = <The smtp port>
email_id = <The sender email id>

email_smtp_server = <The smtp server>

email_smtp_port = <The smtp port>
Copy to Clipboard Copied! Toggle word wrap Toggle overflow If the SMTP server supports only authenticated email, follow the template in the
/etc/tendrl/notifier/email_auth.conf.yamlfile and accordingly enable the following:auth = <ssl/tls> email_pass = <password corresponding to email_id for authenticating to smtp server>auth = <ssl/tls> email_pass = <password corresponding to email_id for authenticating to smtp server>Copy to Clipboard Copied! Toggle word wrap Toggle overflow Restart the tendrl-notifier service:
systemctl restart tendrl-notifier
systemctl restart tendrl-notifierCopy to Clipboard Copied! Toggle word wrap Toggle overflow
12.5. SNMPv3 Notification Configuration
Configure SNMP
Tendrl-ansible installs and configures tendrl-notifier. After the tendrl-notifier file is configured, configure SNMPv3 trap notifications:
Open the
tendrl-notifierconfiguration file:cat /etc/tendrl/notifier/snmp.conf.yaml
# cat /etc/tendrl/notifier/snmp.conf.yamlCopy to Clipboard Copied! Toggle word wrap Toggle overflow Update the parameters in the file for v3 trap alerts:
Copy to Clipboard Copied! Toggle word wrap Toggle overflow Restart the tendrl-notifier service:
systemctl restart tendrl-notifier
systemctl restart tendrl-notifierCopy to Clipboard Copied! Toggle word wrap Toggle overflow


