Monitoring Red Hat Integration
Monitoring Red Hat Integration
Abstract
Chapter 1. About Prometheus
Prometheus is an open-source systems and service monitoring and alerting toolkit that you can use to monitor services deployed in your Red Hat OpenShift environment. Prometheus collects and stores metrics from configured services at given intervals, evaluates rule expressions, displays the results, and can trigger alerts if a specified condition becomes true.
Red Hat support for Prometheus is limited to the setup and configuration recommendations provided in Red Hat product documentation.
To monitor OpenShift services, you must configure each service to expose an endpoint to Prometheus format. This endpoint is an HTTP interface that provides a list of metrics and the current values of the metrics. Prometheus periodically scrapes each target-defined endpoint and writes the collected data to its database. Prometheus gathers data over an extended time, rather than just for the currently running session. Prometheus stores the data so that you can graphically visualize and run queries on the data.
1.1. Prometheus queries
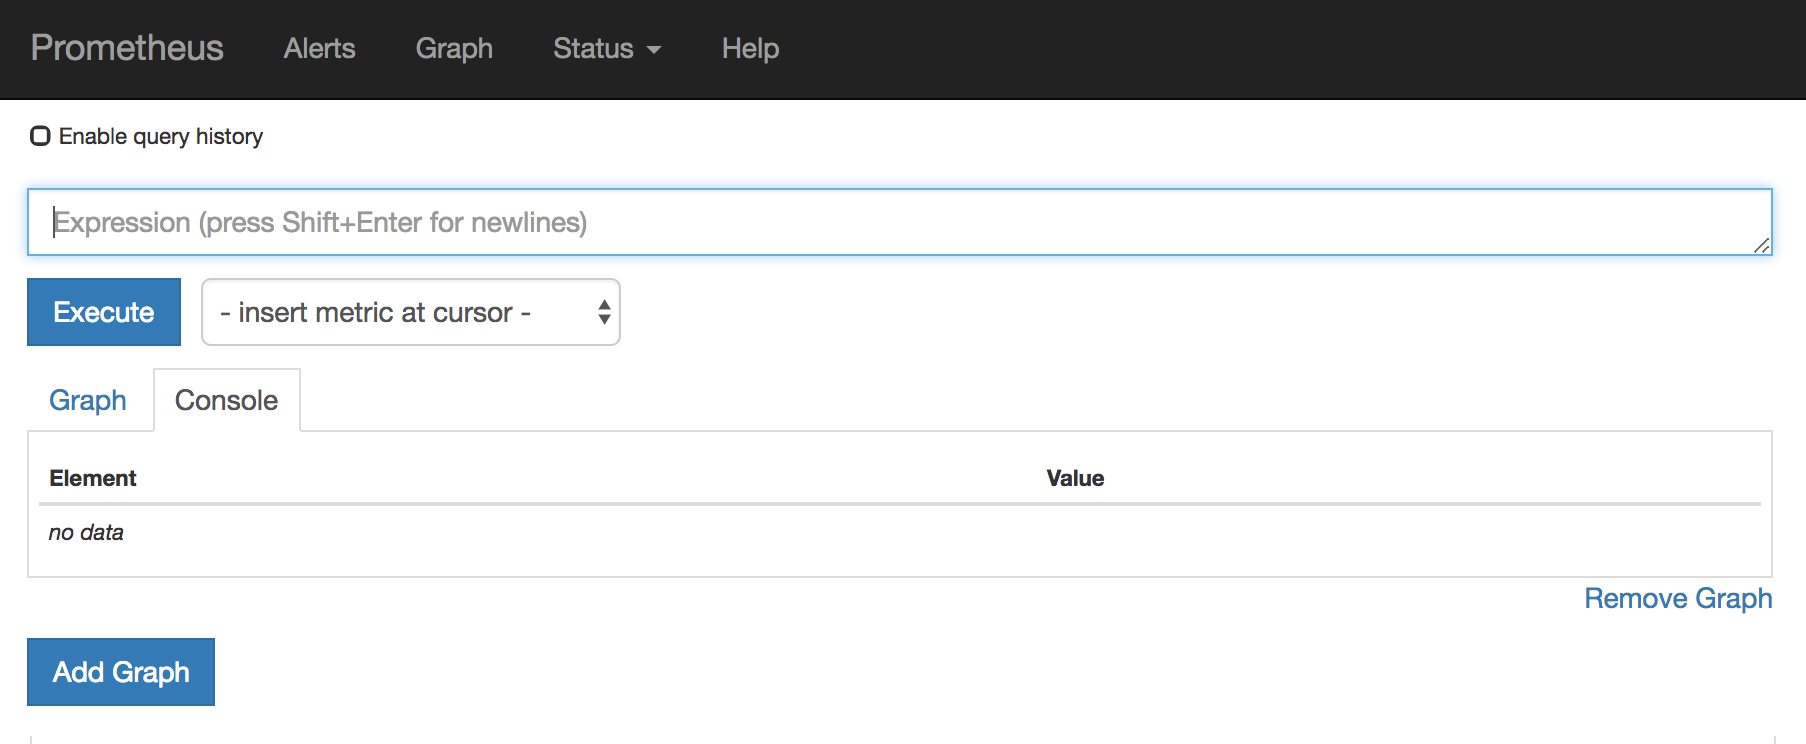
In the Prometheus web interface, you can write queries in Prometheus Query Language (PromQL) to select and aggregate the collected data.
For example, you can use the following query to select all of the values that Prometheus has recorded within the last five minutes for all time-series data that has http_requests_total as the metric name:
http_requests_total[5m]
http_requests_total[5m]
To further define or filter the results of the query, specify a label (a key:value pair) for the metric. For example, you can use the following query to select all the values that Prometheus has recorded within the last five minutes for all time-series data that has the metric name http_requests_total and a job label set to integration:
http_requests_total{job="integration"}[5m]
http_requests_total{job="integration"}[5m]1.2. Options for displaying Prometheus data
You can specify how Prometheus handles the result of a query:
- View Prometheus data as tabular data in Prometheus’s expression browser.
- Consume Prometheus data by external systems through the Prometheus HTTP API.
Display Prometheus data in a graph.
Prometheus provides a default graphical view of the data that it collects. If you prefer a more robust graphical dashboard to view Prometheus data, Grafana is a popular choice.
NoteGrafana is a community-supported feature. Deploying Grafana to monitor Red Hat products is not supported with Red Hat production service level agreements (SLAs).
You can also use the PromQL language to configure alerts in Prometheus’s Alertmanager tool.
1.3. Using Prometheus to monitor Fuse
You can use Prometheus to monitor Fuse services as follows:
- Fuse applications on OpenShift
- Fuse on OpenShift is the distribution of Fuse for running integration applications on OpenShift (supported on the Red Hat Enterprise Linux operating system). You can use Prometheus on an on-premise OpenShift cluster or on a single-node cluster, such as Minishift or the Red Hat Container Development Kit. For more information about Fuse on OpenShift, see Fuse on OpenShift Guide.
- Fuse Online infrastructure components and Fuse Online integration applications
- Fuse Online is the distribution of Fuse for non-expert integrators with a simplified workflow accessed through a browser based UI. For more information about Fuse Online, see Integrating Applications with Fuse Online.
- Using Prometheus to monitor Fuse applications on OpenShift Online is not supported.
- Grafana is a community-supported feature. Deploying Grafana to monitor Red Hat Integration products is not supported with Red Hat production service level agreements (SLAs).
Additional resources
For information on installing and developing with Fuse on OpenShift, see the Fuse on OpenShift Guide.
Chapter 2. Accessing Prometheus to monitor Fuse applications on OpenShift
2.1. Setting up Prometheus
To set up Prometheus, install the Prometheus operator custom resource definition on the cluster and then add Prometheus to an OpenShift project that includes a Fuse application.
Prerequisites
-
You have
cluster adminaccess to the OpenShift cluster. - You have prepared the OpenShift cluster by installing the Fuse on OpenShift images and templates as described in the Fuse on OpenShift Guide.
- You have created an OpenShift project on the cluster and added a Fuse application to it.
Procedure
Login to OpenShift with administrator permissions:
oc login -u system:admin
$ oc login -u system:adminCopy to Clipboard Copied! Toggle word wrap Toggle overflow Install the custom resource definitions necessary for running the Prometheus operator, where
{$templates-base-url}is the location of the Fuse on OpenShift template files:oc create -f {$templates-base-url}\fuse-prometheus-crd.yml$ oc create -f {$templates-base-url}\fuse-prometheus-crd.ymlCopy to Clipboard Copied! Toggle word wrap Toggle overflow The Prometheus operator is now available to any namespace on the cluster.
Install the Prometheus operator to your namespace by using the following command syntax:
oc process -f {$templates-base-url}/fuse-prometheus-operator.yml -p NAMESPACE=<YOUR NAMESPACE> | oc create -f -$ oc process -f {$templates-base-url}/fuse-prometheus-operator.yml -p NAMESPACE=<YOUR NAMESPACE> | oc create -f -Copy to Clipboard Copied! Toggle word wrap Toggle overflow For example, use this command for a project (namespace) named myproject:
oc process -f {$templates-base-url}/fuse-prometheus-operator.yml -p NAMESPACE=myproject | oc create -f -oc process -f {$templates-base-url}/fuse-prometheus-operator.yml -p NAMESPACE=myproject | oc create -f -Copy to Clipboard Copied! Toggle word wrap Toggle overflow NoteThe first time that you install the Prometheus operator into a namespace, it might take a few minutes for the Prometheus resource pods to start. Subsequently, if you install it to other namespaces on your cluster, the Prometheus resource pods start much faster.
Instruct the Prometheus operator to monitor the Fuse application in the project by using the following command syntax::
oc process -f {$templates-base-url}/fuse-servicemonitor.yml -p NAMESPACE=<YOUR NAMESPACE> -p FUSE_SERVICE_NAME=<YOUR FUSE SERVICE> | oc apply -f -$ oc process -f {$templates-base-url}/fuse-servicemonitor.yml -p NAMESPACE=<YOUR NAMESPACE> -p FUSE_SERVICE_NAME=<YOUR FUSE SERVICE> | oc apply -f -Copy to Clipboard Copied! Toggle word wrap Toggle overflow For example, use this command for an OpenShift project (namespace) named myproject that includes a Fuse application named myfuseapp:
oc process -f {$templates-base-url}/fuse-servicemonitor.yml -p NAMESPACE=myproject -p FUSE_SERVICE_NAME=myfuseapp | oc apply -f -oc process -f {$templates-base-url}/fuse-servicemonitor.yml -p NAMESPACE=myproject -p FUSE_SERVICE_NAME=myfuseapp | oc apply -f -Copy to Clipboard Copied! Toggle word wrap Toggle overflow To open the Prometheus dashboard:
- Login to the OpenShift console.
- Open the project to which you added Prometheus.
In the left pane, select Applications → Routes.

Click the Prometheus Hostname URL to open the Prometheus dashboard in a new browser tab or window.
- For information about getting started with Prometheus, go to: https://prometheus.io/docs/prometheus/latest/getting_started/
2.2. OpenShift environment variables
To configure your application’s Prometheus instance, you can set the OpenShift environment variables listed in Table 2.1, “Prometheus Environment Variables”.
| Environment Variable | Description | Default |
|---|---|---|
|
| The host address to bind. |
|
|
| If set, disables the activation of Prometheus (echoes an empty value). | Prometheus is enabled. |
|
| The Port to use. |
|
|
| Uses the file (including path) as the Prometheus configuration file. | The /opt/prometheus/prometheus-config.yml file with Camel metrics. |
|
| Additional options to append to the JMX exporter configuration. | Not applicable. |
Additional resources
For information on setting environment variables for a pod, see the OpenShift Developer Guide (https://access.redhat.com/documentation/en-us/openshift_container_platform/3.11/html/developer_guide/).
2.3. Controlling the metrics that Prometheus monitors and collects
By default, Prometheus uses a configuration file ( https://raw.githubusercontent.com/jboss-fuse/application-templates/master/prometheus/prometheus-config.yml) that includes all possible metrics exposed by Camel.
If you have custom metrics within your application that you want Prometheus to monitor and collect (for example, the number of orders that your application processes), you can use your own configuration file. Note that the metrics that you can identify are limited to those supplied in JMX.
Procedure
To use a custom configuration file to expose JMX beans that are not covered by the default Prometheus configuration, follow these steps:
Create a custom Prometheus configuration file. You can use the contents of the default file (
prometheus-config.ymlhttps://raw.githubusercontent.com/jboss-fuse/application-templates/master/prometheus/prometheus-config.yml) as a guide for the format.You can use any name for the custom configuration file, for example:
my-prometheus-config.yml.-
Add your prometheus configuration file (for example,
my-prometheus-config.yml) to your application’ssrc/main/fabric8-includesdirectory. Create a
src/main/fabric8/deployment.xmlfile within your application and add an entry for the AB_JMX_EXPORTER_CONFIG environment variable with its value set to your configuration file. For example:Copy to Clipboard Copied! Toggle word wrap Toggle overflow This environment variable applies to your application at the pod level.
- Rebuild and deploy your application.
2.4. Generating alerts
For an example of using Prometheus for OpenShift to generate alerts, see the Red Hat Cloud Forms Monitoring, Alerts, and Reporting guide:
Chapter 3. Accessing Prometheus to monitor Fuse Online
You can use Prometheus to monitor Fuse Online infrastructure and Fuse Online applications as described in these sections:
You can configure an external Prometheus instance to monitor Fuse Online applications as described in this section:
3.1. Monitoring Fuse Online infrastructure components
You can use Prometheus to monitor the metrics exposed by the following Fuse Online infrastructure components:
- Syndesis Server
-
The
syndesis-servercomponent has been instrumented with Micrometer and exposes all of the JVM metrics Micrometer automatically by default. Additionally,syndesis-serverexposes metrics about the REST API endpoints, such as request rate, error rate, and latency. - Syndesis Meta
-
The
syndesis-metacomponent has been instrumented with Micrometer and exposes all of the JVM metrics Micrometer automatically by default. It also exposes metrics about its REST API endpoints. - Syndesis DB
- Metrics for the Fuse Online Postgres database are exported using a third-party Prometheus exporter.
- Integrations
-
The
integrationmetrics are exported using the official JMX exporter, which exposes several JVM metrics by default. Additionally, integration metrics expose metrics that are specific to Apache Camel, such as message rate and error rate.
You can also use a Grafana dashboard to visualize the metrics gathered by Prometheus.
Prerequisites
-
You have
cluster adminaccess to the OpenShift cluster. -
Deploy Prometheus and Grafana with the Application Monitoring operator (specifically, tag
v1.1.6) by following these installation instructions.
Grafana is a community-supported feature. Deploying Grafana to monitor Red Hat Integration products is not supported with Red Hat production service level agreements (SLAs).
Procedure
In the Fuse Online namespace, set the
monitoring-key=middlewarelabel by using the following command:oc label namespace <fuse-online-namespace> monitoring-key=middleware
oc label namespace <fuse-online-namespace> monitoring-key=middlewareCopy to Clipboard Copied! Toggle word wrap Toggle overflow Verify that your Fuse Online installation added the application monitoring configuration resources to the OpenShift cluster:
-
In the OpenShift web console, go to the
applicaton-monitoringproject and then open theprometheus-routeURL. In the Prometheus console, go to the Status → Targets page.
If a
Syndesistarget is listed, then Fuse Online is configured for monitoring and you can skip to Step 4.If a
Syndesistarget is not listed, continue to Step 3.
-
In the OpenShift web console, go to the
If the infrastructure resources are not on the OpenShift cluster, to enable Prometheus monitoring:
Go to the Fuse Online namespace:
Expand OpenShift 4.x OpenShift 3.11 -
In the OpenShift web console, go to the Fuse Online (
syndesis) project. - Select Catalog > Installed Operators and then click Fuse Online Operator.
- Click Syndesis CRD and then click app.
-
Click Yaml to open the
yamlfile in the editor.
- Select Resources > Other Resources.
- From the dropdown menu, select the Syndesis resources type.
-
For the app resource, click Actions and then select Edit YAML to open the
yamlfile in the editor.
-
In the OpenShift web console, go to the Fuse Online (
Edit the
yamlfile to set theSyndesis.Spec.Addons.Ops.Enablevalue to true by adding the follow lines:spec: addons: ops: enabled: "true"spec: addons: ops: enabled: "true"Copy to Clipboard Copied! Toggle word wrap Toggle overflow - Save the file.
Wait for the pod to restart.
NoteThe infrastructure resources are not available immediately after you run the install commands. You might need to wait before you can see the Fuse Online (Syndesis) targets in the Prometheus Targets page.
To access Prometheus:
- In the OpenShift console for the project where the application monitoring operator is installed, open the list of routes.
- Next to the prometheus-route entry, click the hostname URL to open the Prometheus console.
- To view a list of the alert rules configured for Fuse Online infrastructure components, click the Alerts menu item.
To access Grafana dashboards:
- In the OpenShift console for the project where the application monitoring operator is installed, open the list of routes.
- Next to the grafana-route entry, click the hostname URL to open the Grafana console.
At the top of the Grafana console, click the dashboard selector and then select one of the following infrastructure dashboards:
- Infrastructure - DB
- Displays metrics related to the Fuse Online Postgres instance.
- Infrastructure - JVM
-
Displays metrics about the running JVM for the
syndesis-metaorsyndesis-serverapplications. Chose the application that you want to monitor from the Application drop down list at the top of the dashboard. - Infrastructure - REST APIs
-
Displays metrics relating to the Fuse Online infrastructure API endpoints, such as
request throughputandlatency. Chose the application that you want to monitor from the Application drop down list at the top of the dashboard.
To access Prometheus Alertmanager:
- In the OpenShift console for the project where the application monitoring operator is installed, open the list of routes.
Next to the alertmanager-route entry, click the hostname URL to open the Alertmanager console.
If the Fuse Online infrastructure is healthy, the default view is empty.
If any of the infrastructure components are unhealthy, any active alerts that have been fired are listed, along with the option to silence them.
3.2. Monitoring Fuse Online integration applications
You can use the Application Monitoring operator to deploy Prometheus so that you can monitor Fuse Online integration applications. You can also use Grafana dashboards to visualize the metrics gathered by Prometheus.
Prerequisites
-
You have
cluster adminaccess to the OpenShift cluster. -
Deploy Prometheus and Grafana with the Application Monitoring operator (specifically, tag
v1.1.6) by following these installation instructions.
Grafana is a community-supported feature. Deploying Grafana to monitor Red Hat Integration products is not supported with Red Hat production service level agreements (SLAs).
Procedure
In the Fuse Online namespace, set the
monitoring-key=middlewarelabel by using the following command:oc label namespace <fuse-online-namespace> monitoring-key=middleware
oc label namespace <fuse-online-namespace> monitoring-key=middlewareCopy to Clipboard Copied! Toggle word wrap Toggle overflow Verify that your Fuse Online installation added the application monitoring configuration resources to the OpenShift cluster.
-
In the OpenShift web console, go to the
applicaton-monitoringproject and then open theprometheus-routeURL. In the Prometheus console, go to the Status > Targets page.
If a Syndesis target is listed, then Fuse Online has been configured for monitoring and you can skip to Step 4.
If a Syndesis target is not listed, continue to Step 3.
-
In the OpenShift web console, go to the
If the infrastructure resources are not on the OpenShift cluster, to enable Prometheus monitoring:
Go to the Fuse Online namespace:
Expand OpenShift 4.x OpenShift 3.11 -
In the OpenShift web console, go to the Fuse Online (
syndesis) project. - Select Catalog > Installed Operators and then click Fuse Online Operator.
- Click Syndesis CRD and then click app.
-
Click Yaml to open the
yamlfile in the editor.
- Select Resources > Other Resources.
- From the dropdown menu, select the Syndesis resources type.
-
For the app resource, click Actions and then select Edit YAML to open the
yamlfile in the editor.
-
In the OpenShift web console, go to the Fuse Online (
Edit the
yamlfile to set theSyndesis.Spec.Addons.Ops.Enablevalue to true by adding the follow lines:spec: addons: ops: enabled: "true"spec: addons: ops: enabled: "true"Copy to Clipboard Copied! Toggle word wrap Toggle overflow - Save the file.
Wait for the pod to restart.
NoteThe infrastructure resources are not available immediately after you run the install commands. You might need to wait before you can see the Fuse Online (Syndesis) targets in the Prometheus Targets page.
To access Prometheus:
- In the OpenShift console for the project where the application monitoring operator is installed, open the list of routes.
- Next to the prometheus-route entry, click the hostname URL to open the Prometheus console.
- To view a list of the alert rules configured for Fuse Online infrastructure components, clicking the Alerts menu item.
To access a Grafana dashboard:
- In the OpenShift console for the project where the application monitoring operator is installed, open the list of routes.
- Next to the grafana-route entry, click the hostname URL to open the Grafana console.
At the top of the Grafana console, click the dashboard selector and then select Integration - Camel.
This dashboard displays the standard metrics exposed by Apache Camel integration applications.
3.3. Configuring an external Prometheus instance to monitor Fuse Online applications
When you install Fuse Online on OpenShift Container Platform 3.11, a syndesis-prometheus instance is included by default. For detailed instructions on how to install Fuse Online on premise OpenShift Container Platform, see Integrating Applications with Fuse Online.
However, if you already have an existing external Prometheus instance, you can configure that external instance to also monitor Fuse Online Integration applications that are deployed on OpenShift Container Platform.
The steps depend on whether you used the Prometheus operator to install your external Prometheus instance.
3.3.1. Configuring a Prometheus instance (with the Prometheus operator)
If you installed a Prometheus instance by using the Prometheus operator, updating your external Prometheus configuration to monitor Fuse Online integration involves adding and then editing a service monitor.
Prerequisite
You installed Prometheus as described in Section 2.1, “Setting up Prometheus”.
Procedure
In a terminal window, add a service monitor to the namespace (project) in which you installed Prometheus:
oc process -f {$templates-base-url}/fuse-servicemonitor.yml -p NAMESPACE=<YOUR-NAMESPACE> -p FUSE_SERVICE_NAME=fuseonline | oc create -f -oc process -f {$templates-base-url}/fuse-servicemonitor.yml -p NAMESPACE=<YOUR-NAMESPACE> -p FUSE_SERVICE_NAME=fuseonline | oc create -f -Copy to Clipboard Copied! Toggle word wrap Toggle overflow - In the OpenShift console, open the project and then select Applications → Services.
- Click the fuseonline service and then select Actions → Edit YAML.
-
In the Editor, change the selector section of the YAML file by replacing
app: fuseonlinewithsyndesis.io/type: integration. - Click Save.
The Prometheus operator updates its configuration to monitor all Fuse Online integrations.
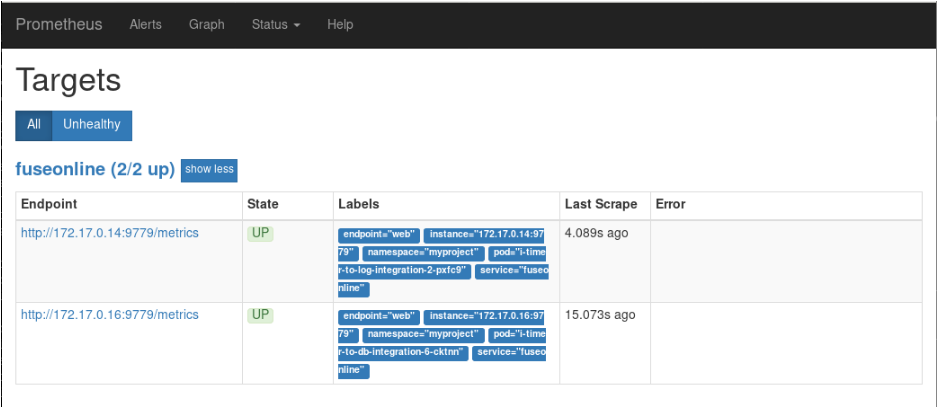
You can now view Fuse Online integrations in the Prometheus instance. The following example shows a Prometheus instance that monitors two integrations:
3.3.2. Configuring a Prometheus instance (without the Prometheus operator)
If you installed an external Prometheus instance without using the Prometheus operator, updating the configuration to monitor Fuse Online integration involves editing your Prometheus configuration file and updating the Prometheus pod configuration.
Prerequisite
You must have write access to the Prometheus configuration file (prometheus-config.yml). In the OpenShift web console, the configuration file is located in Resources → Config Maps.
Procedure
Edit your Prometheus configuration file (
prometheus-config.yml) as follows:Set the scrape interval to 5 seconds:
global:
        scrape_interval:     5s
        evaluation_interval: 5s
global: scrape_interval: 5s evaluation_interval: 5sCopy to Clipboard Copied! Toggle word wrap Toggle overflow Add a scrape config job named
integration-podwith the Kubernetes service discovery configuration that configures it to scrape pods in the${OPENSHIFT_PROJECT}, which is typically thesyndesisnamespace:Copy to Clipboard Copied! Toggle word wrap Toggle overflow Add a
relabel_configssection that:-
Only scrapes integration pods with the
prometheus.io/scrapelabel set to true. -
Sets the
metrics_pathandaddresslabels, that are used to scrape the JMX exporter in the integration pod, by using values from theprometheus.io/pathandprometheus.io/portlabels. - Adds pod labels and annotations as Prometheus labels.
Creates
kubernetes_namespaceandkubernetes_pod_namelabels.Here is an example
relabel_configssection:Copy to Clipboard Copied! Toggle word wrap Toggle overflow
-
Only scrapes integration pods with the
Fuse Online integrations expose a large number of metrics from the JVM, Camel and CXF. To reduce the amount of storage needed for metrics, add the following
metric_relabel_configssection to filter out metrics that are not displayed in the Fuse Online console.Copy to Clipboard Copied! Toggle word wrap Toggle overflow NoteThe last configuration line explicitly lists metrics to be added in Prometheus metrics store that are critical to the statistics shown in the Fuse Online web console. Your Prometheus instance must explicitly allow these metrics to be collected if other metrics are being filtered.
Update the Prometheus pod configuration to store 30 days worth of metric data as follows:
args:
            - '--config.file=/etc/prometheus/prometheus.yml'
            - '--storage.tsdb.retention=30d'
args: - '--config.file=/etc/prometheus/prometheus.yml' - '--storage.tsdb.retention=30d'Copy to Clipboard Copied! Toggle word wrap Toggle overflow