6. URL Response Time Monitoring
Part of web application performance is determined by how responsive it is to requests. JBoss Operations Network supplies an extra monitoring setting called response time filters which measures the amount of time it takes for a URL to respond to a request.
6.1. Call-Time (or Response Time) Monitoring for URLs
Performance for web applications is more complex than simple availability. How quickly an application can respond to requests is as important as whether the application is running.
The time that it takes an application to respond to some kind of request is call-time or response time data.
Two types of resources support call-time data by default:
- Session beans, for EJB method calls.
- Web servers (standalone or embedded in an application server), for URL responses. Web servers require an additional response time filter with configuration on what URL resources to measure for response times.
Response time monitoring is more based upon performance than it is on capturing a single data point. Response or call-time data are displayed as aggregates, showing maximum, minimum, and average response times per URL or per method.
6.2. Viewing Call Time Metrics
Both session bean resources and web server resources have an additional Monitoring subtab called Calltime. All of the call-time data or response time data ranges (minimum, maximum, and averages) are displayed for each URL resource or method. As new URLs or methods are accessed, they are dynamically added to the results table.
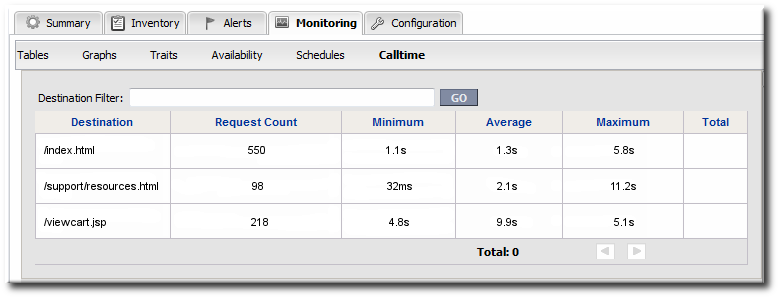
Figure 14. URL Metrics for a Web Server
6.3. Extended Example: Website Performance
The Setup
A significant amount of Example Co.'s business, services, and support is tied to its website. Customers have to be able to access the site to purchase products, schedule training or consulting, and to receive most support and help. If the site is slow or if some resources are inaccessible, customers immediately have a negative experience.
The goal is not to monitor whether the web server is running, but whether the web application are responsive and performing as Example Co.'s customers expect.
What to Do
Tim the IT Guy identifies three different ways that he can capture web application performance information:
- Response times for individual URLs
- Throughput information like total number of requests and responses
- Counts for critical HTTP response codes
Both monitoring and alerting can be configured based solely off response time and throughput metrics. However, bad website performance is indicative of an underlying problem with the web server or its associated database. Therefore, Tim not only wants to be informed when website performance it poor; he wants to correlate some performance metrics with underlying server and database performance and launch operations that can mitigate poor responsiveness.
Tim maps a few common scenarios which cause poor website or web server performance and plans simple, immediate operations that JBoss ON can perform until an IT staffer can analyze the problem. Tim attempts to narrow down potential causes to a performance. Alerts can be issued for a single condition or for a combination of conditions. In Tim's case, he creates a three different alerts based on different combinations of underlying causes for performance problems (Section 11.2, “Basic Procedure for Setting Alerts for a Resource”).
- If there are poor response times and a high number of HTTP error 500 responses, then the alert can be configured with an operation to restart the web server (Section 13.2, “Detailed Discussion: Initiating an Operation”).
- If there are poor response times and a high number of HTTP error 404 response (meaning that resources may not be delivered properly), then the alert is configured to restart the database.
- If there are poor response times and a high number of total requests per minute, then it may mean that there is simply too much load on the server. The alert can be configured to create another web server instance to help with load balancing; using a JBoss ON CLI script allows the JBoss ON server to create new resources as necessary and deploy bundles of the appropriate web apps (Section 13.3, “Detailed Discussion: Initiating Resource Scripts”).
The most critical factor is the response time, which is a factor in every alert. Each alert has one condition based on the call time data, specifically of the call-time data moves past a certain threshold.
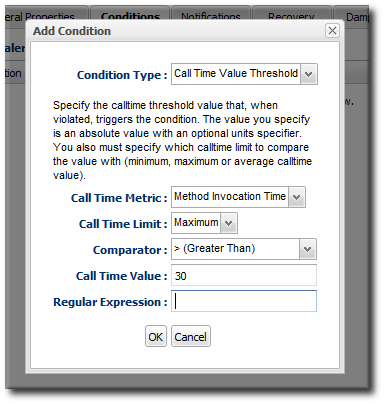
Tim picks a reasonable threshold, about 15 seconds, for performance. If performance degrades so that the HTTP Response Time metric returns a value higher than 20 seconds to load pages, JBoss ON issues an alert.
Alternatively, he could alert on simple call-time changes. Call-time changes will trigger an alert for any change from the established baseline, meaning a new minimum, maximum, or average value. A change of any kind can alert in either a decrease in performance or an increase in performance. A threshold alert only alerts on a specific change.
Tim then adds the other condition, with an AND operator, to each alert he configures.
Also, most web app-related metrics are not enabled by default. Tim enables the Total Number of Requests per Minute, Total Number of Responses per Minute, Number of 404 Responses per Minute, and Number of 500 Responses per Minute metrics for each web server (Section 4.7, “Changing Metrics Templates”).
For every alert, Tim also configures an email notification along with the other responses, so that a member of the IT staff can evaluate any website performance problems and take additional actions if necessary.
6.4. Configuring EJB Call-Time Metrics
EJB method call-time measurements are not collected by default.
- Click the Inventory tab in the top menu.
- Select the Services menu table on the left, and then navigate to the EJB resource.

Note
It is probably easier to search for the session bean by name, if you know it.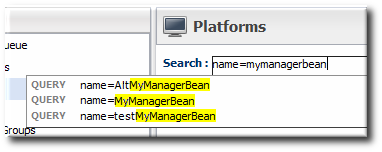
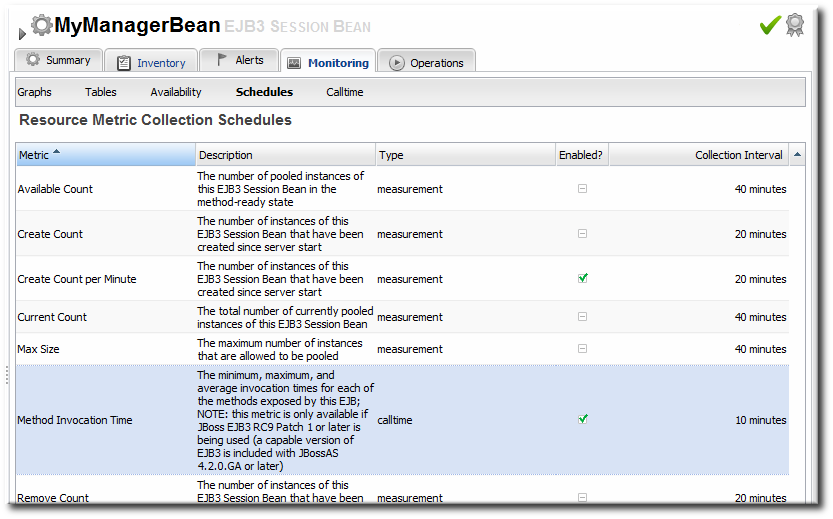
- Click the Monitoring tab on the EJB resource entry.
- Click the Schedules subtab.
- Select the Method Invocation Time metric. This metric is the calltime type.
- Click the at the bottom of the list.
6.5. Configuring Response Time Metrics for JBoss EAP 6/AS 7
To collect response time metrics for a JBoss EAP 6/AS 7 server, first install the servlet JAR for the response time filter and configure the web server to use it. Then, enable the metrics collection for the web resource.
6.5.1. Installing the Response Time Filters
- Make sure that you have created a management user to access the JBoss EAP 6 instance.For more information, see the JBoss AS 7.1 documentation.
- Download the response rime packages for JBoss from the JBoss ON UI. The response time filters are packaged as AS 7 modules. There are two modules to obtain:
rhq-rtfilter-module.zip
rhq-rtfilter-subsystem-module.zip
Note
This can also be done from the command line usingwget:[root@server ~]# wget http://server.example.com:7080/downloads/connectors/rhq-rtfilter-module.zip [root@server ~]# wget http://server.example.com:7080/downloads/connectors/rhq-rtfilter-subsystem-module.zip
- Click the Administration tab in the top menu.
- In the Configuration menu box on the left, select the item.

- Click the rhq-rtfilter-module.zip and
rhq-rtfilter-subsystem-module.ziplinks, and save the files to an accessible directory, like the/tmpdirectory.
- Open the
modules/directory for the JBoss EAP 6 instance. For example:[root@server ~]# cd /opt/jboss-eap-6.0/modules/
- Unzip the
rhq-rtfilter-module.ziparchive to install the response time filter JAR and the associatedmodule.xmlfile.[root@server modules]# unzip /tmp/rhq-rtfilter-module.zip
- Open the configuration file for the server,
domain.xmlorstandalone.xml. - Deploy the response time module globally by adding the module to the list of global modules in the <subsystem> element.
<subsystem xmlns="urn:jboss:domain:ee:1.0"> <global-modules> <module name="org.rhq.helpers.rhq-rtfilter" slot="main"/> </global-modules> </subsystem> - Save the file.
- Unzip the
rhq-rtfilter-subsystem-module.ziparchive to install the subsystem response time filter JAR and the associatedmodule.xmlfile.[root@server modules]# unzip /tmp/rhq-rtfilter-subsystem-module.zip
This installs the filters as a subsystem for the application server or individual web apps. - After the filters have been installed, the JBoss EAP 6 server needs to be configured to use them.The response time filter can be deployed globally, for all web applications hosted by the EAP/AS instance, or it can be configured for a specific web application.To deploy the filter as a global subsystem:
- Open the configuration file for the server,
domain.xmlorstandalone.xml. - Add the an
<extensions>element for the response time filter.<extension module="org.rhq.helpers.rhq-rtfilter-subsystem"/>
- Add a
<subsystem>element beneath the<profileelement.All that is required for response time filtering to work is the default<subsystem>element, without any optional parameters. However, the parameters can be uncommented and set as necessary; the different ones are described in Table 3, “Parameters Available for User-Defined <filter> Settings”.The<subsystem>element should be added even if none of the optional parameters are set.<subsystem xmlns="urn:rhq:rtfilter:1.0"> <!-- Optional parameters. <init-param> <param-name>chopQueryString</param-name> <param-value>true</param-value> </init-param> <init-param> <param-name>logDirectory</param-name> <param-value>/tmp</param-value> </init-param> <init-param> <param-name>logFilePrefix</param-name> <param-value>localhost_7080_</param-value> </init-param> <init-param> <param-name>dontLogRegEx</param-name> <param-value></param-value> </init-param> <init-param> <param-name>matchOnUriOnly</param-name> <param-value>true</param-value> </init-param> <init-param> <param-name>timeBetweenFlushesInSec</param-name> <param-value>73</param-value> </init-param> <init-param> <param-name>flushAfterLines</param-name> <param-value>13</param-value> </init-param> <init-param> <param-name>maxLogFileSize</param-name> <param-value>5242880</param-value> </init-param> --> </subsystem>
To configure the response time filters for an individual web application:- Open the web application's
web.xmlfile.[root@server ~]# vim WARHomeDir/WEB-INF/web.xml
- Add the filter and, depending on the configuration, filter mapping elements to the file. This activates the response time filtering.All that is required for response time filtering to work is the default
<filter>element, without any optional parameters. However, the parameters can be uncommented and set as necessary; the different ones are described in Table 3, “Parameters Available for User-Defined <filter> Settings”.<filter> <filter-name>RhqRtFilter</filter-name> <filter-class>org.rhq.helpers.rtfilter.filter.RtFilter</filter-class> <!-- Optional parameters. <init-param> <param-name>chopQueryString</param-name> <param-value>true</param-value> </init-param> <init-param> <param-name>logDirectory</param-name> <param-value>/tmp</param-value> </init-param> <init-param> <param-name>logFilePrefix</param-name> <param-value>localhost_7080_</param-value> </init-param> <init-param> <param-name>dontLogRegEx</param-name> <param-value></param-value> </init-param> <init-param> <param-name>matchOnUriOnly</param-name> <param-value>true</param-value> </init-param> <init-param> <param-name>timeBetweenFlushesInSec</param-name> <param-value>73</param-value> </init-param> <init-param> <param-name>flushAfterLines</param-name> <param-value>13</param-value> </init-param> <init-param> <param-name>maxLogFileSize</param-name> <param-value>5242880</param-value> </init-param> --> </filter> <!-- Use this only when also enabling the RhqRtFilter in the filter <filter-mapping> <filter-name>RhqRtFilter</filter-name> <url-pattern>/*</url-pattern> </filter-mapping> -->
- Restart the JBoss EAP/AS server to load the new
web.xmlsettings.
|
Parameter
|
Description
|
|---|---|
|
chopQueryString
|
Only the URI part of a query will be logged if this parameter is set to true. Otherwise the whole query line will be logged. Default is true.
|
|
logDirectory
|
The directory where the log files will be written to. Default setting is {
jboss.server.log.dir}/rt/ (usually server/xxx/log/rt). If this property is not defined, the fallback is {java.io.tmpdir}/rt/ (/tmp/ on UNIX®, and ~/Application Data/Local Settings/Temp – check the TEMP environment variable) is used. If you specify this init parameter, no directory rt/ will be created, but the directory you have provided will be taken literally.
|
|
logFilePrefix
|
A prefix that is put in front of the log file names. Default is the empty string.
|
|
dontLogRegEx
|
A regular expression that is applied to query strings. See java.util.regex.Pattern. If the parameter is not given or an empty string, no pattern is applied.
|
|
matchOnUriOnly
|
Should the dontLogRegEx be applied to the URI part of the query (true) or to the whole query string (false). Default is true.
|
|
timeBetweenFlushesInSec
|
Log lines are buffered by default. When the given number of seconds have passed and a new request is received, the buffered lines will be flushed to disk even if the number of lines to flush after (see next point) is not yet reached.. Default value is 60 seconds (1 Minute).
|
|
flushAfterLines
|
Log lines are buffered by default. When the given number of lines have been buffered, they are flushed to disk. Default value is 10 lines.
|
|
maxLogFileSize
|
The maximum allowed size, in bytes, of the log files; if a log file exceeds this limit, the filter will truncate it; the default value is 5242880 (5 MB).
|
|
vHostMappingFile
|
This properties file must exist on the Tomcat process classpath. For example, in the ../conf/vhost-mappings.properties. The file contains mappings from the 'incoming' vhost (server name) to the vhost that should be used as the prefix in the response time log file name. If no mapping is present (no file or no entry response times are set), then the incoming vhost (server name) is used. For example:
pickeldi.users.acme.com=pickeldi
pickeldi=
%HOST%=
The first mapping states that if the incoming vhost is 'host1.users.acme.com', then the log file name should get a vhost of 'host1' as prefix, separated by a _ from the context root portion. The second mapping states that if the 'incoming' vhost is 'host1', then no prefix, and no _, should be used. The third mapping uses a special left-hand-side token, '%HOST%'. This mapping states that if the 'incoming' vhost is a representation of localhost then no prefix, and no _ , should be used.
%HOST% will match the host name, or canonical host name or IP address, as returned by the implementation of InetAddress.getLocalHost().
The second and third mappings are examples of empty right hand side, but could just as well have provided a vhost.
This is a one time replacement. There is no recursion in the form that the result of the first line would then be applied to the second one.
|
6.5.2. Enabling the Call-Time Metric
Response time metrics are configured on a live application deployment. A deployment resource is a child of either a standalone EAP 6 server or of a server group.
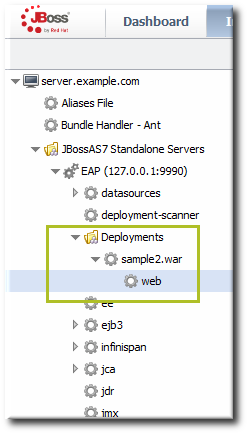
Figure 15. Web Runtime Resource
- Click the Inventory tab in the top menu.
- Click the Servers - Top Level Imports item, and select the JBoss EAP 6 resource.
- Navigate to the deployment resource, and expand the application to the web subsystem.
- Click the Monitoring tab on the web resource entry.
- Click the Schedules subtab.
- Select the Response Time metric. This metric is the calltime type.
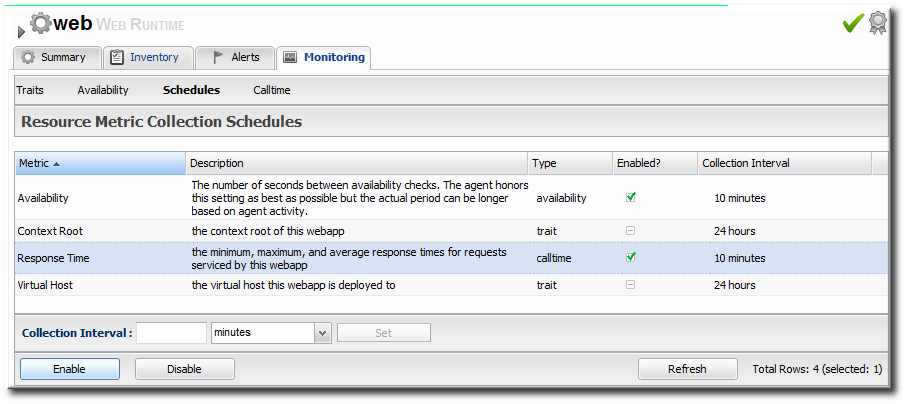
- Click the at the bottom of the list.
- Click the Inventory tab on the web entry.
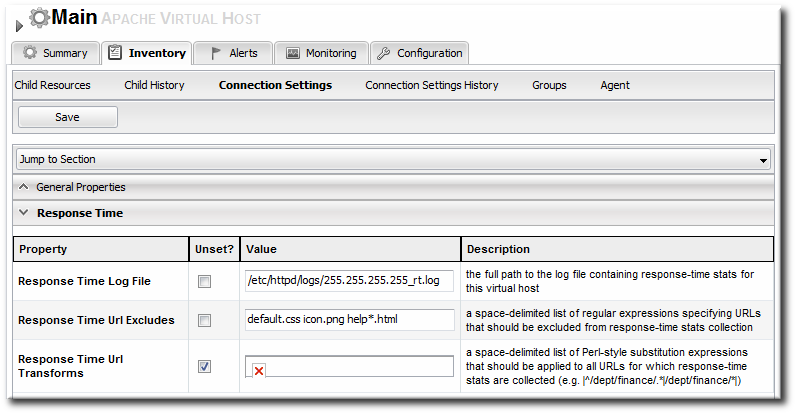
- Select the Connection Settings subtab.
- Unset the check boxes for the response time configuration and fill in the appropriate values for the web application.
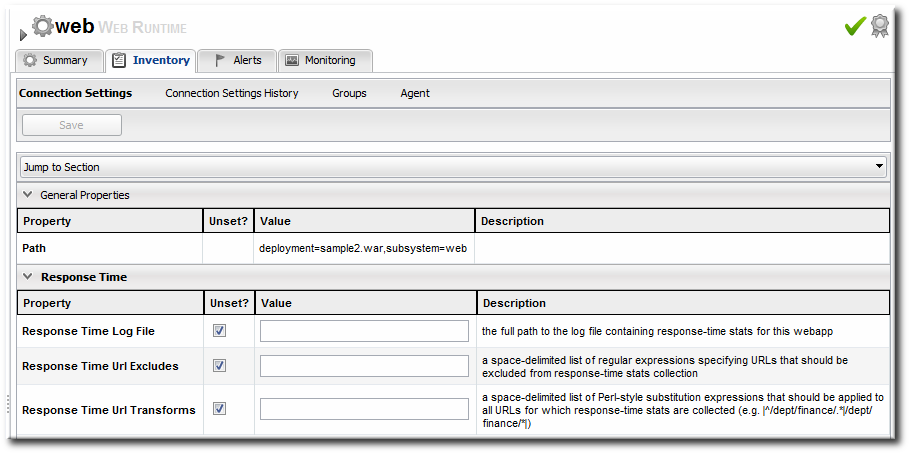
- The response times log which is used by that specific web application. The log file is a required setting for call-time data collection to work..
- Any files, elements, or pages to exclude from response time measurements. The response times log records times for all resources the web server serves, including support files like CSS files and icons or background images.
- The same page can be accessed with different parameters passed along in the URL. The Response Time Url Transforms field provides a regular expression that can be used to strip or substitute the passed parameters.
6.6. Setting up Response Time Monitoring for EWS/Tomcat and JBoss EAP 5
Response time monitoring is not available from application or web servers by default; a special module must be installed which allows JBoss ON to collect response time metrics.
After the module is installed, then the HTTP metrics can be enabled for the resource.
6.6.1. Parameters for User-Defined <filter>s
Administrators can set rules for how response time metrics are collected for application and web servers. This are response time filters.
For response time monitoring to work, JBoss and EWS/Tomcat all must have response time filters installed. Additional configuration options can be added to those default filters to customize the monitoring for the resource.
|
Parameter
|
Description
|
|---|---|
|
chopQueryString
|
Only the URI part of a query will be logged if this parameter is set to true. Otherwise the whole query line will be logged. Default is true.
|
|
logDirectory
|
The directory where the log files will be written to. Default setting is {
jboss.server.log.dir}/rt/ (usually server/xxx/log/rt). If this property is not defined, the fallback is {java.io.tmpdir}/rt/ (/tmp/ on UNIX®, and ~/Application Data/Local Settings/Temp – check the TEMP environment variable) is used. If you specify this init parameter, no directory rt/ will be created, but the directory you have provided will be taken literally.
|
|
logFilePrefix
|
A prefix that is put in front of the log file names. Default is the empty string.
|
|
dontLogRegEx
|
A regular expression that is applied to query strings. See java.util.regex.Pattern. If the parameter is not given or an empty string, no pattern is applied.
|
|
matchOnUriOnly
|
Should the dontLogRegEx be applied to the URI part of the query (true) or to the whole query string (false). Default is true.
|
|
timeBetweenFlushesInSec
|
Log lines are buffered by default. When the given number of seconds have passed and a new request is received, the buffered lines will be flushed to disk even if the number of lines to flush after (see next point) is not yet reached.. Default value is 60 seconds (1 Minute).
|
|
flushAfterLines
|
Log lines are buffered by default. When the given number of lines have been buffered, they are flushed to disk. Default value is 10 lines.
|
|
maxLogFileSize
|
The maximum allowed size, in bytes, of the log files; if a log file exceeds this limit, the filter will truncate it; the default value is 5242880 (5 MB).
|
|
vHostMappingFile
|
This properties file must exist in the Tomcat process classpath. For example, in the
conf/vhost-mappings.properties file. The file contains mappings from the 'incoming' vhost (server name) to the vhost that should be used as the prefix in the response time log file name. If no mapping is present (no file or no entry response times are set), then the incoming vhost (server name) is used. For example:
pickeldi.users.acme.com=pickeldi
pickeldi=
%HOST%=
The first mapping states that if the incoming vhost is 'host1.users.acme.com', then the log file name should get a vhost of 'host1' as prefix, separated by a _ from the context root portion. The second mapping states that if the 'incoming' vhost is 'host1', then no prefix, and no _, should be used. The third mapping uses a special left-hand-side token, '%HOST%'. This mapping states that if the 'incoming' vhost is a representation of localhost then no prefix, and no _ , should be used.
%HOST% will match the host name, or canonical host name or IP address, as returned by the implementation of InetAddress.getLocalHost().
The second and third mappings are examples of empty right hand side, but could just as well have provided a vhost.
This is a one time replacement. There is no recursion in the form that the result of the first line would then be applied to the second one.
|
6.6.2. Configuring Response Time Metrics for JBoss EAP/AS 5
To collect response time metrics for a JBoss EAP/AS 5 server, first install the servlet JAR for the response time filter and configure the web server to use it.
- Download the Response Time packages for JBoss from the JBoss ON UI.
Note
This can also be done from the command line usingwget:[root@server ~]# wget http://server.example.com:7080/downloads/connectors/connector-rtfilter.zip
- Click the Administration tab in the top menu.
- In the Configuration menu box on the left, select the item.
- Click the connector-rtfilter.zip link, and save the file.
- Unzip the connectors.
[root@server ~]# unzip connector-rtfilter.zip
- Copy the
rhq-rtfilter-version.jarfile into thelib/directory for the profile.[root@server ~]# cp connector-rtfilter/rhq-rtfilter-version.jar JbossHomeDir/server/profileName/lib/
JBoss EAP/AS already includes thecommons-logging.jarfile, which is also required for response time filtering. - Then, configure the
web.xmlfor the EAP/AS instance.The response time filter can be deployed globally, for all web applications hosted by the EAP/AS instance or it can be configured for a specific web application.To configure it globally, edit the globalweb.xmlfile:[root@server ~]# vim JbossHomeDir/server/configName/default/deploy/jbossweb.sar/
To configure it for a single web app, edit that one web app'sweb.xmlfile:[root@server ~]# vim WARLocation/WEB-INF/web.xml
- Add the filter and, depending on the configuration, filter mapping elements to the file. This activates the response time filtering.All that is required for response time filtering to work is the default
<filter>element, without any optional parameters. However, the parameters can be uncommented and set as necessary; the different ones are described in Table 4, “Parameters for User-Defined <filter>s”.<filter> <filter-name>RhqRtFilter</filter-name> <filter-class>org.rhq.helpers.rtfilter.filter.RtFilter</filter-class> <!-- Optional parameters. <init-param> <param-name>chopQueryString</param-name> <param-value>true</param-value> </init-param> <init-param> <param-name>logDirectory</param-name> <param-value>/tmp</param-value> </init-param> <init-param> <param-name>logFilePrefix</param-name> <param-value>localhost_7080_</param-value> </init-param> <init-param> <param-name>dontLogRegEx</param-name> <param-value></param-value> </init-param> <init-param> <param-name>matchOnUriOnly</param-name> <param-value>true</param-value> </init-param> <init-param> <param-name>timeBetweenFlushesInSec</param-name> <param-value>73</param-value> </init-param> <init-param> <param-name>flushAfterLines</param-name> <param-value>13</param-value> </init-param> <init-param> <param-name>maxLogFileSize</param-name> <param-value>5242880</param-value> </init-param> --> </filter> <!-- Use this only when also enabling the RhqRtFilter in the filter <filter-mapping> <filter-name>RhqRtFilter</filter-name> <url-pattern>/*</url-pattern> </filter-mapping> --> - Restart the JBoss EAP/AS server to load the new
web.xmlsettings. - Enable the HTTP metrics, as described in Section 6.6.4, “Configuring HTTP Response Time Metrics”, so that JBoss ON checks for the response time metrics on the application server.
6.6.3. Configuring Response Time Filters for Tomcat
- Download the Response Time packages for Tomcat from the JBoss ON UI.
- Click the Administration tab in the top menu.
- In the Configuration menu box on the left, select the item.
- Click the connector-rtfilter.zip link, and save the file.
- Unzip the Response Time connectors.
unzip connector-rtfilter.zip
The package contains two JAR files,commons-logging-version.jarandrhq-rtfilter-version.jar. Tomcat 5 servers use only thecommons-logging-version.jarfile, while Tomcat 6 servers require both files. - Copy the appropriate JAR files into the Tomcat configuration directory. The directory location depends on the Tomcat or JBoss instance (for embedded Tomcat) being modified.For example, on a standalone Tomcat 5.5:
cp commons-logging-version.jar /var/lib/tomcat5/server/lib/
On Tomcat 6:cp rhq-rtfilter-version.jar /var/lib/tomcat6/lib/ cp commons-logging-version.jar /var/lib/tomcat6/lib/
For example, on an embedded Tomcat instance:cp rhq-rtfilter-version.jar JBoss_install_dir/server/default/deploy/jboss-web.deployer/ cp commons-logging-version.jar JBoss_install_dir/server/default/deploy/jboss-web.deployer/
- Open the
web.xmlfile to add the filter definition. The exact location of the file depends on the server instance and whether it is a standalone or embedded server; several common locations are listed in Table 5, “web.xml Configuration File Locations”. - Add either a
<filter>or a<filter-mapping>entry to configuration the Response Time filter in the Tomcat server. Either a<filter>or a<filter-mapping>entry can be used, but not both.The most basic filter definition references simply the Response Time filter name and class in the<filter>element. This loads the response time filter with all of the default settings.<filter> <filter-name>RhqRtFilter </filter-name> <filter-class>org.rhq.helpers.rtfilter.filter.RtFilter </filter-class> </filter>The filter definition can be expanded with user-defined configuration values by adding<init-paramelements. This loads the response time filter with all of the default settings.<filter> <filter-name>RhqRtFilter </filter-name> <filter-class>org.rhq.helpers.rtfilter.filter.RtFilter </filter-class> <init-param> <description>Name of vhost mapping file. This properties file must be in the Tomcat process classpath.</description> <param-name>vHostMappingFile</param-name> <param-value>vhost-mappings.properties</param-value> </init-param> ... </filter>The available parameters are listed in Table 4, “Parameters for User-Defined <filter>s”.Alternatively, set a<filter-map>entry which gives the name of the response time filter and pattern to use to match the URL which will be monitored.<filter-mapping> <filter-name>RhqRtFilter </filter-name> <url-pattern>/* </url-pattern> </filter-mapping>Note
Put the Response Time filter in front of any other configured filter so that the response time metrics will include all of the other response times, total, in the measurement. - Restart the Tomcat instance to load the new configuration.
- Enable the HTTP metrics, as described in Section 6.6.4, “Configuring HTTP Response Time Metrics”, so that JBoss ON checks for the response time metrics on the application server.
| Tomcat Version | Embedded Server Type | File Location |
|---|---|---|
| Tomcat 6 | Standalone Server | /var/lib/tomcat6/webapps/project/WEB-INF/web.xml |
| Tomcat 5 | Standalone Server | /var/lib/tomcat5/webapps/project/WEB-INF/web.xml |
| Tomcat 6 | EAP 5 EAP 5.0.0 | JBOSS_HOME/server/config/deployers/jbossweb.deployer/web.xml |
| Tomcat 6 | JBoss 4.2, JBoss EAP4 | JBOSS_HOME/server/config/deploy/jboss-web.deployer/conf/web.xml |
| Tomcat 5.5 | JBoss 4.0.2 | JBOSS_HOME/server/config/deploy/jbossweb-tomcat55.sar/conf/web.xml |
| Tomcat 5.0 | JBoss 3.2.6 | JBOSS_HOME/server/config/deploy/jbossweb-tomcat50.sar/conf/web.xml |
| Tomcat 4.1 | JBoss 3.2.3 | JBOSS_HOME/server/config/deploy/jbossweb-tomcat41.sar/web.xml |
6.6.4. Configuring HTTP Response Time Metrics
Configuring response time metrics is in some respects analogous to configuring events. The JBoss ON agent polls certain log files kept by the web server to identify the performance times for different resources served by the web server.
- Install the response time filter for the web server. If necessary, set up the filter entry in the
web.xmlfile. - Click the Inventory tab in the top menu.
- Select the Servers menu table on the left, and then navigate to the web server
- Click the Connection Settings tab on the web server resource entry. and scroll to the Response Time configuration section.
- Configure the response time properties for the web server. The agent has to know what log file the web server uses to record response time data.Optionally, the server can perform certain transformations on the collected data.
- The response times log records times for all resources the web server serves, including support files like CSS files and icons or background images. These resources can be excluded from the response time calculations in the Response Time Url Excludes field.
- The same page can be accessed with different parameters passed along in the URL. The Response Time Url Transforms field provides a regular expression that can be used to strip or substitute the passed parameters.
- Click the button.
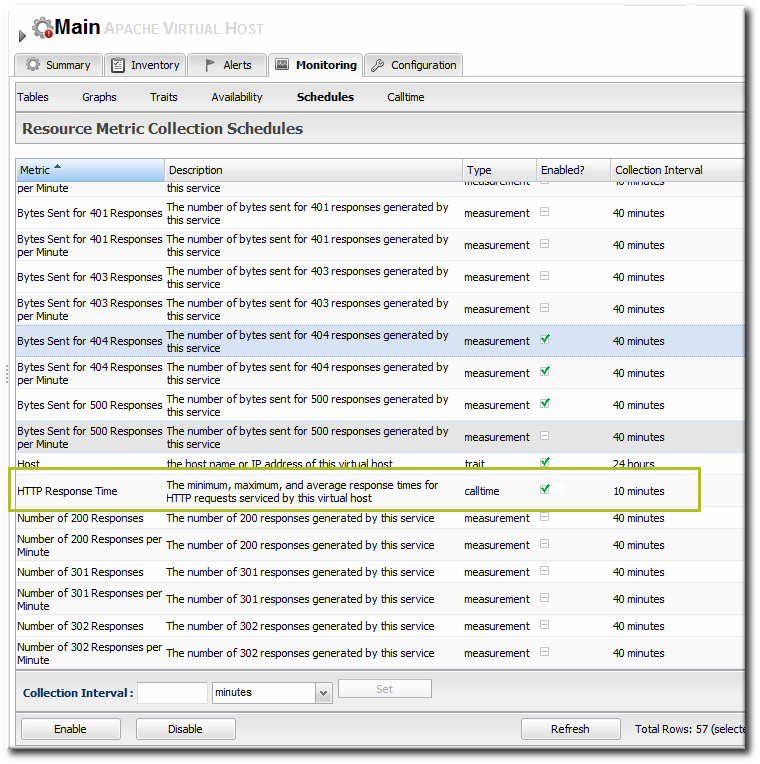
- Click the Monitoring tab on the web server resource entry.
- Click the Schedules subtab.
- Select the HTTP Response Time metric. This metric is the calltime type.
- Click the at the bottom of the list.