OVS-DPDK End to End Troubleshooting Guide
A guide containing the OVS-DPDK end to end troubleshooting procedures
Abstract
Preface
This document contains procedures for OVS-DPDK system administrators for identifying and resolving common issues related to packet loss in Red Hat OpenStack Platform 10. The procedures documented in this guide supersede the previously published knowledge base articles.
Chapter 1. Preliminary Checks
This guide assumes that you are familiar with the planning and deployment procedures in the following documents:
Chapter 2. Validating an OVS-DPDK Deployment
This chapter describes the validation steps to take following a deployment.
2.1. Confirming OpenStack
Use the following commands to confirm OpenStack and OVS-DPDK configuration.
2.1.1. Show the Network Agents
Ensure that the value for Alive is True and State is UP for each agent. If there are any issues, view the logs in /var/log/neutron and /var/log/openvswitch/ovs-vswitchd.log to determine the issue.
2.1.2. Show the Hosts in the Compute Service
Ensure that the value for Status is enabled and State is up for each host. If there are any issues, see the logs in /var/log/nova to determine the issue.
2.2. Confirming Compute Node OVS Configuration
To verify the configuration and health of network adapters and OpenvSwitch, complete the following steps.
To verify the DPDK network device on the compute node, install dpdk tools. Run the following command. This rpm is found in repo:
rhel-7-server-extras-rpms.yum install dpdk-tools
$ yum install dpdk-toolsCopy to Clipboard Copied! Toggle word wrap Toggle overflow Show the network devices managed by DPDK and those used for networking.
dpdk-devbind --status
$ dpdk-devbind --statusCopy to Clipboard Copied! Toggle word wrap Toggle overflow The devices using a DPDK driver are the types
ovs_dpdk_bondorovs_dpdk_portin the Tripleo compute role templates:Copy to Clipboard Copied! Toggle word wrap Toggle overflow To confirm that DPDK is enabled, run the following command:
sudo ovs-vsctl get Open_vSwitch . iface_types
$ sudo  ovs-vsctl get Open_vSwitch . iface_types

[dpdk, dpdkr, dpdkvhostuser, dpdkvhostuserclient, geneve, gre, internal, lisp, patch, stt, system, tap, vxlan]
Copy to Clipboard Copied! Toggle word wrap Toggle overflow Run the following command. The results show PCI devices from the DPDK compatible drivers, for example,
0000:04:00.1and:05:00.0astype: dpdkwith no errors.Copy to Clipboard Copied! Toggle word wrap Toggle overflow The following output shows an error:
Port "dpdkbond0"
           Interface "dpdk1"
               type: dpdk
               options: {dpdk-devargs="0000:04:00.1", n_rxq="2"}
               error: "Error attaching device '0000:04:00.1' to DPDK"
Port "dpdkbond0" Interface "dpdk1" type: dpdk options: {dpdk-devargs="0000:04:00.1", n_rxq="2"} error: "Error attaching device '0000:04:00.1' to DPDK"Copy to Clipboard Copied! Toggle word wrap Toggle overflow To show details about interfaces, run the following command:
sudo ovs-vsctl list interface dpdk1 | egrep "name|mtu|options|status"
$ sudo ovs-vsctl list interface dpdk1 | egrep "name|mtu|options|status"Copy to Clipboard Copied! Toggle word wrap Toggle overflow Run the following command. Note that lacp is not enabled.
Copy to Clipboard Copied! Toggle word wrap Toggle overflow Check that all ovs bridges on compute nodes are
netdevfor fast data path (user space) networking.NoteMixing system (kernel) and netdev (user space) datapath types is not supported.
Copy to Clipboard Copied! Toggle word wrap Toggle overflow Run the following command to check for persistent Open vSwitch errors:
grep ERROR /var/log/openvswitch/ovs-vswitchd.log
$ grep ERROR /var/log/openvswitch/ovs-vswitchd.logCopy to Clipboard Copied! Toggle word wrap Toggle overflow
2.3. Confirming OVS for Instance Configuration
To ensure that vhostuser DMA works, configure instances with OVS-DPDK ports to have dedicated CPUs and huge pages enabled using flavors. For more information, see Step 3 in: Creating a flavor and deploying an instance for OVS-DPDK.
To confirm the instance configuration, complete the following steps:
Confirm the instance has pinned CPUs. Dedicated CPUs can be identified with virsh:
sudo virsh vcpupin 2
$ sudo virsh vcpupin 2Copy to Clipboard Copied! Toggle word wrap Toggle overflow Confirm that the emulator threads used for the instance are not running on the same vCPUs assigned to that instance:
sudo virsh emulatorpin 2
$ sudo virsh emulatorpin 2Copy to Clipboard Copied! Toggle word wrap Toggle overflow NoteBeginning with Red Hat OpenStack Platform 12, you can set the emulatorpin by flavor. See Configuring emulator threads policy with Red Hat OpenStack Platform 12.
For older versions, emulator thread pinning has to be done manually when the instance is powered on. See About the impact of using virsh emulatorpin in virtual environments with NFV, with and without isolcpus, and about optimal emulator thread pinning.
Confirm the instance is using huge pages, which is required for optimal performance.
sudo virsh numatune 1
$ sudo virsh numatune 1Copy to Clipboard Copied! Toggle word wrap Toggle overflow Confirm that the receive queues for the instance are being serviced by a poll mode driver (PMD).
The ports and queues should be equally balanced across the PMDs. Optimally, ports will be serviced by a CPU in the same NUMA node as the network adapter.
Copy to Clipboard Copied! Toggle word wrap Toggle overflow Show statistics for the PMDs. This helps to determine how well receive queues are balanced across PMDs. For more information, see PMD Threads in the Open vSwitch documentation.
NoteThe
pmd-rxq-rebalanceoption was added in OVS 2.9.0. This command performs new PMD queue assignments in order to balance equally across PMDs based on the latest rxq processing cycle information.The
pmd-stats-showcommand shows the full history since the PMDs were running or since the statistics were last cleared. If it is not cleared, it will have incorporated into the stats before the ports were set up and data was flowing. If it is being used to see the load on a datapath (which it typically is) it would then be useless.It is best to put the system into a steady state, clear the stats, wait a few seconds, and then show the stats. This provides an accurate picture of the datapath.
Use the following command to show statistics for the PMDs:
Copy to Clipboard Copied! Toggle word wrap Toggle overflow Reset the PMD statistics. The
pmd-stats-showcommand shows the PMD statistics since the lastpmd-stats-clearcommand. If there was no previouspmd-stats-clearissued, it contains data since the PMD began running.If you are examining a system under load, it is useful to clear the PMD statistics and then show them. Otherwise, the statistics may also include data from an earlier time when the system was not under load (before traffic flowing).
Use the following command to reset the PMD statistics:
sudo ovs-appctl dpif-netdev/pmd-stats-clear
$ sudo ovs-appctl dpif-netdev/pmd-stats-clearCopy to Clipboard Copied! Toggle word wrap Toggle overflow
2.4. Other Helpful Commands
Use these commands to perform additional validation checks.
Find the OVS-DPDK Port & Physical NIC Mapping Configured by os-net-config
cat /var/lib/os-net-config/dpdk_mapping.yaml
cat /var/lib/os-net-config/dpdk_mapping.yamlCopy to Clipboard Copied! Toggle word wrap Toggle overflow Find the DPDK port for an instance with the Nova instance $ID
sudo ovs-vsctl find interface external_ids:vm-uuid="$ID" | grep ^name
sudo ovs-vsctl find interface external_ids:vm-uuid="$ID" | grep ^nameCopy to Clipboard Copied! Toggle word wrap Toggle overflow Find the Nova ID for an instance using a DPDK port
sudo ovs-vsctl get interface vhu24e6c032-db external_ids:vm-uuid
sudo ovs-vsctl get interface vhu24e6c032-db external_ids:vm-uuidCopy to Clipboard Copied! Toggle word wrap Toggle overflow Perform a tcpdump on a dpdk port
sudo ovs-tcpdump -i vhu94ccc316-ea
sudo ovs-tcpdump -i vhu94ccc316-eaCopy to Clipboard Copied! Toggle word wrap Toggle overflow
ovs-tcpdump is from the openvswitch-test RPM located in the rhel-7-server-openstack-10-devtools-rpms repo.
For performance concerns, ovs-tcpdump is not recommended for production environments. For more information, see: How to use ovs-tcpdump on vhost-user interfaces in Red Hat OpenStack Platform?.
2.5. Simple Compute Node CPU Partitioning and Memory Checks
Prerequisites
Run this command on a deployed compute node and note how the cpu masks map to TripleO Heat Template values:
sudo ovs-vsctl get Open_vSwitch . other_config
$ sudo ovs-vsctl get Open_vSwitch . other_config

{dpdk-init="true", dpdk-lcore-mask="300003", dpdk-socket-mem="3072,1024", pmd-cpu-mask="c0000c"}Note the following:
-
dpdk-lcore-maskmaps toHostCpusListin TripleO Heat Templates. -
dpdk-socket-memmaps toNeutronDpdkSocketMemoryin TripleO Heat Templates. pmd-cpu-maskmaps toNeutronDpdkCoreListin TripleO Heat Templates.To convert these cpu masks to decimal values that can be reconciled back to TripleO Heat Templates and actual system values see: How to convert a hexadecimal CPU mask into a bit mask and identify the masked CPUs?
2.5.1. Detecting CPUs
To detect CPUs for pid 1, use the following command. No PMDs or Nova vCPUs should be running on these cores:
taskset -c -p 1
$ taskset -c -p 1

pid 1's current affinity list: 0,1,20,212.5.2. Detecting PMD Threads
To see PMD threads, use the following command. The output should reflect the values of the Tripleo parameter NeutronDpdkCoreList. There should be no overlap with the values of Tripleo parameters HostCpusList or HostIsolatedCoreslist:
2.5.3. Detecting NUMA node
For optimal performance ensure that physical network adapters, PMD threads, and pinned CPUs for instances are all on the same NUMA node. For more information, see: CPUs and NUMA nodes.
The following is a simple exercise for examining NUMA assignments.
Examine the vhu port for an instance on a compute node:
sudo virsh domiflist 1
$ sudo virsh domiflist 1

Interface  Type       Source     Model       MAC
-------------------------------------------------------
vhu24e6c032-db vhostuser  -          virtio      fa:16:3e:e3:c4:c2
Copy to Clipboard Copied! Toggle word wrap Toggle overflow Examine the PMD thread that is servicing that port and note the NUMA node:
Copy to Clipboard Copied! Toggle word wrap Toggle overflow Find the physical pinned cpus for the instance. For example, the PMD servicing the port for this instance is on cpu 2 and the instance is serviced by cpus 34 and 6.
sudo virsh dumpxml 1 | grep cpuset
$ sudo virsh dumpxml 1 | grep cpuset

    <vcpupin 1 vcpu='0' cpuset='34'/>
    <emulatorpin cpuset='6'/>
Copy to Clipboard Copied! Toggle word wrap Toggle overflow Examine the cores for each NUMA node. Note that the CPUs servicing the instance (34,6) are on the same NUMA node (0).
lscpu | grep ^NUMA
$ lscpu | grep ^NUMA

NUMA node(s):          2
NUMA node0 CPU(s):     0,2,4,6,8,10,12,14,16,18,20,22,24,26,28,30,32,34,36,38
NUMA node1 CPU(s):     1,3,5,7,9,11,13,15,17,19,21,23,25,27,29,31,33,35,37,39
Copy to Clipboard Copied! Toggle word wrap Toggle overflow
Additionally, network adapters that are not managed by OVS DPDK will have an entry here that indicates what NUMA node they belong to:
sudo cat /sys/class/net/<device name>/device/numa_node
$ sudo cat /sys/class/net/<device name>/device/numa_nodeAlternatively, you can see the NUMA node for a network adapter by querying the PCI address, even for those managed by OVS DPDK:
sudo lspci -v -s 05:00.1 | grep -i numa
$ sudo lspci -v -s 05:00.1 | grep -i numa

Flags: bus master, fast devsel, latency 0, IRQ 203, NUMA node 0
These exercises demonstrate that the PMD, instance, and network adapter are all on NUMA 0, which is optimal for performance. For an indication of cross NUMA polling from the openvswitch logs (located in /var/log/openvswitch), look for a log entry similar to this:
dpif_netdev|WARN|There's no available (non-isolated) pmd thread on numa node 0. Queue 0 on port 'dpdk0' will be assigned to the pmd on core 7 (numa node 1). Expect reduced performance.
dpif_netdev|WARN|There's no available (non-isolated) pmd thread on numa node 0. Queue 0 on port 'dpdk0' will be assigned to the pmd on core 7 (numa node 1). Expect reduced performance.2.5.4. Detectng Isolated CPUs
Use the following command to show isolated CPUs. The output should be the same as the value of the TripleO parameter HostIsolatedCoreList.
cat /etc/tuned/cpu-partitioning-variables.conf | grep -v ^#

isolated_cores=2-19,22-39
$ cat /etc/tuned/cpu-partitioning-variables.conf | grep -v ^#

isolated_cores=2-19,22-392.5.5. Detectng CPUs Dedicated to Nova Instances
Use the following command to show the CPUs dedicated to Nova instances. This output should be the same as the value of the parameter isolcpus without poll mode driver (PMD) CPUs:
grep ^vcpu_pin_set /etc/nova/nova.conf
$ grep ^vcpu_pin_set /etc/nova/nova.conf

vcpu_pin_set=4-19,24-392.5.6. Confirming Huge Pages Configuration
Check for huge pages configuration on the compute node.
If hugepages are not configured or are exhausted, see ComputeKernelArgs.
2.6. Causes for Packet Drops
Packets are dropped when a queue is full, usually when the queue is not drained fast enough. The bottleneck is the entity that is supposed to drain the queue when the queue is not draining quickly enough. In most instances, a drop counter is used to track dropped packets. Sometimes a bug in the hardware or software design can cause packets to skip the drop counter.
The Data Plan Development Kit (DPDK) includes the testpmd application for forwarding packets. In the scenarios shown in this chapter, testpmd is installed on a VM and polls ports with its assigned logical cores (lcores) to forward packets from one port to another. testpmd is ordinarily used with a traffic generator to test, in this case, throughput across a physical-virtual-physical (PVP) path.
2.6.1. OVS-DPDK Too Slow to Drain Physical NICs
This example shows that a PMD thread is responsible for polling the receive (RX) queue of the physical network adapter (dpdk0). When the PMD thread cannot keep up with the packet volume, or is interrupted, packets might be dropped.
Figure 2.1. Polling the physical adapter RX queue
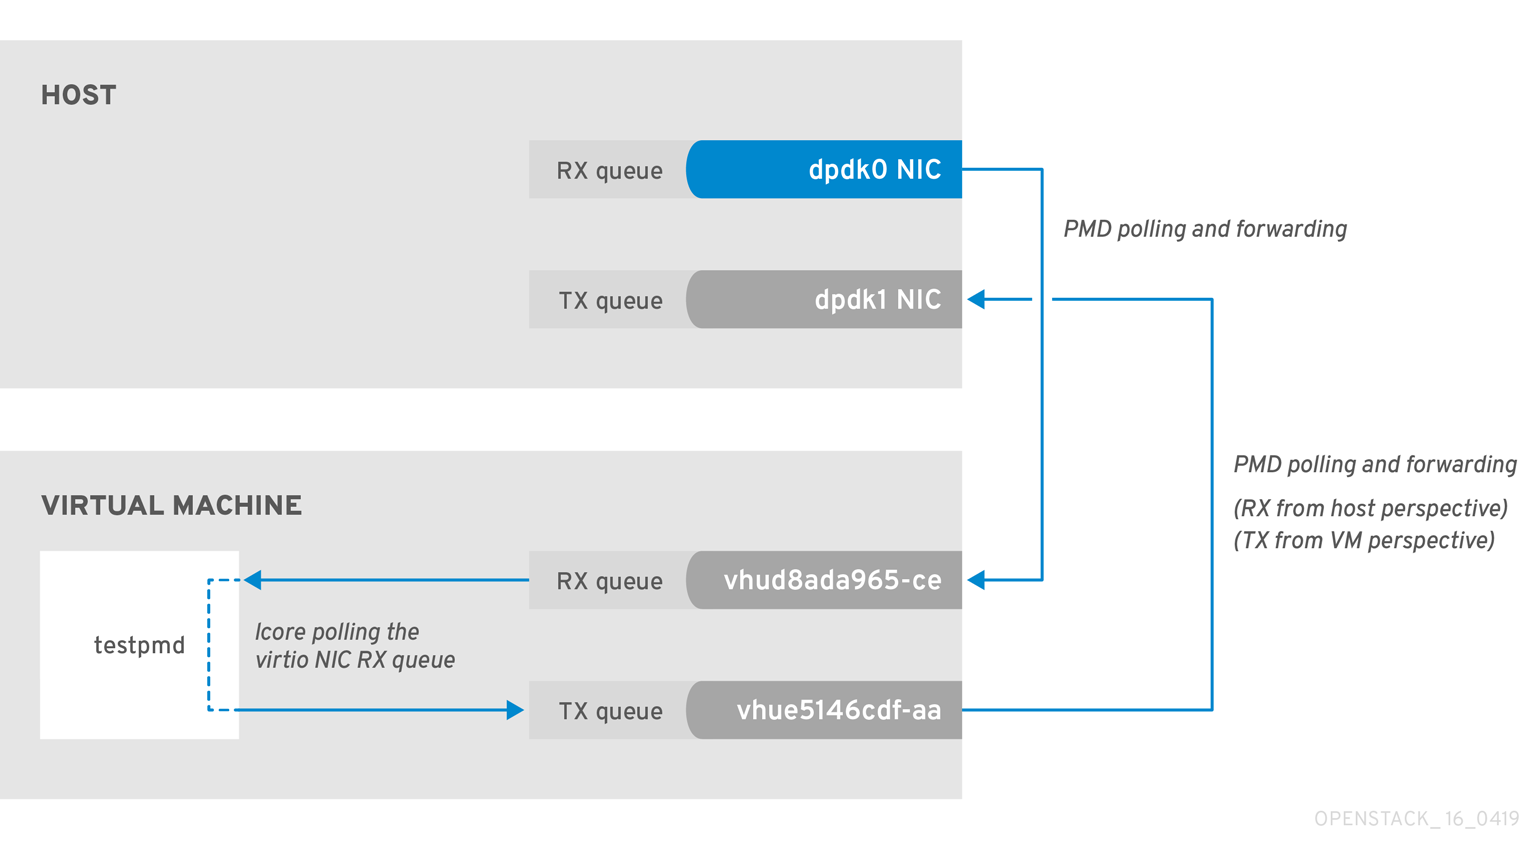
The following command shows statistics from the dpdk0 interface. If packets are being dropped because ovs-dpdk is not draining the physical adapter fast enough, you will see the value of rx_dropped increasing rapidly.
There should be no more than one physical CPU core per NUMA node for PMDs.
2.6.2. VM Too Slow to Drain vhost-user
This example is similar to the example in Figure 2.1, in that you might experience packet loss if the lcore thread is overwhelmed by the packet volume sent to the instance receive (RX) queue.
For more information, see the following articles:
Figure 2.2. Polling the virtual adapter RX queue
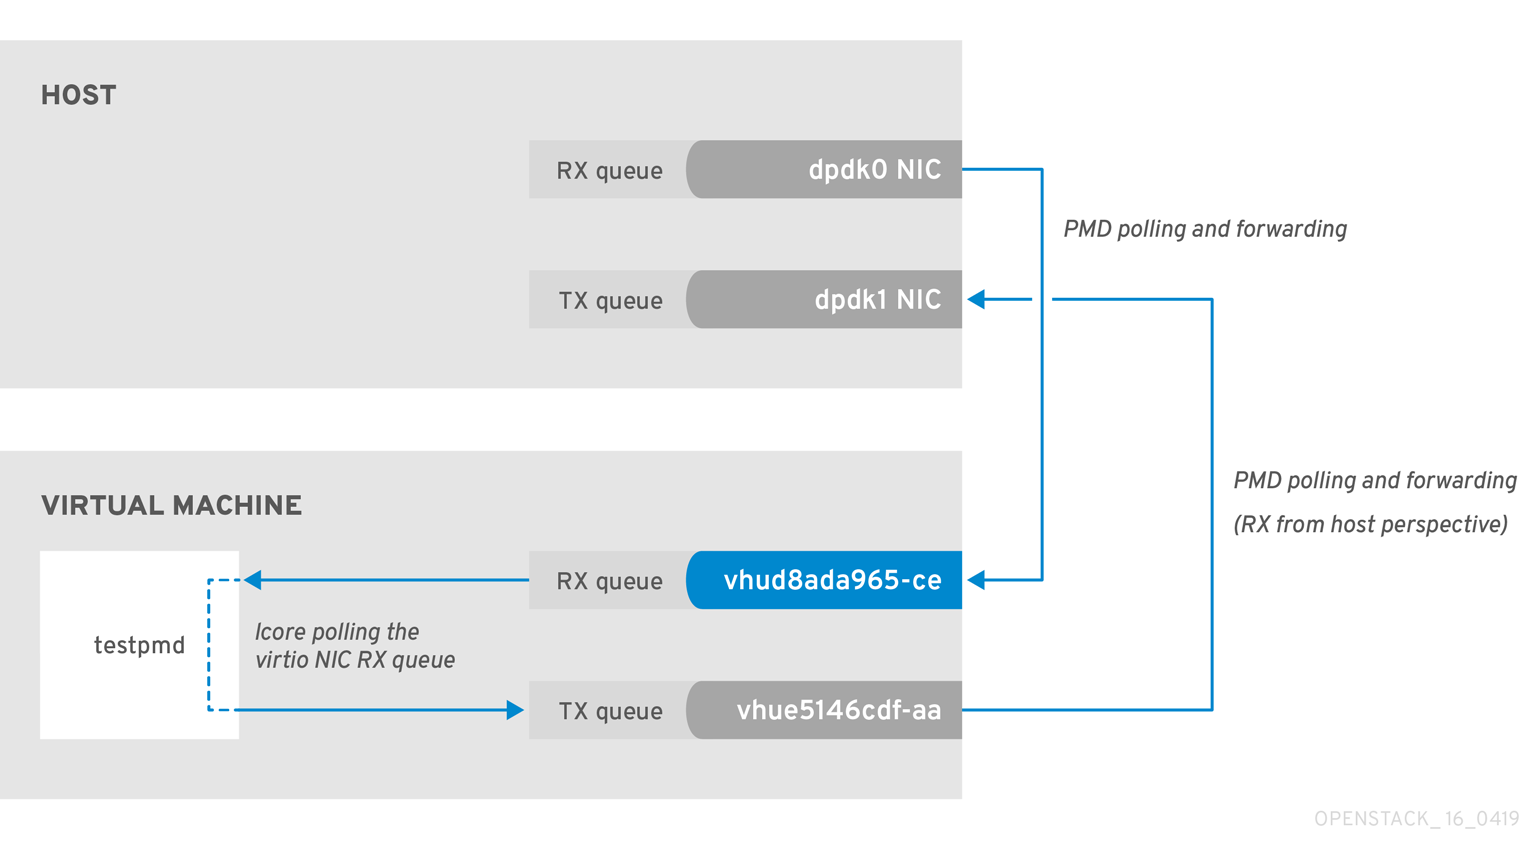
To check if the tx_dropped value of the host corresponds to the rx_dropped value of the VM, run the following command:
ovs-vsctl --column statistics list interface vhud8ada965-ce

statistics          : {"rx_1024_to_1522_packets"=0, "rx_128_to_255_packets"=0, "rx_1523_to_max_packets"=0,
"rx_1_to_64_packets"=0, "rx_256_to_511_packets"=0, "rx_512_to_1023_packets"=0, "rx_65_to_127_packets"=0, rx_bytes=0,
rx_dropped=0, rx_errors=0, rx_packets=0, tx_bytes=0, tx_dropped=0, tx_packets=0}
ovs-vsctl --column statistics list interface vhud8ada965-ce

statistics          : {"rx_1024_to_1522_packets"=0, "rx_128_to_255_packets"=0, "rx_1523_to_max_packets"=0,
"rx_1_to_64_packets"=0, "rx_256_to_511_packets"=0, "rx_512_to_1023_packets"=0, "rx_65_to_127_packets"=0, rx_bytes=0,
rx_dropped=0, rx_errors=0, rx_packets=0, tx_bytes=0, tx_dropped=0, tx_packets=0}2.6.3. OVS-DPDK Too Slow to Drain vhost-user
In this example, a PMD thread is polls the virtio TX, the receive queue from the host perspective. If the PMD thread is overwhelmed by the packet volume, or is interrupted, packets might drop.
Figure 2.3. Polling the virtual adapter TX queue
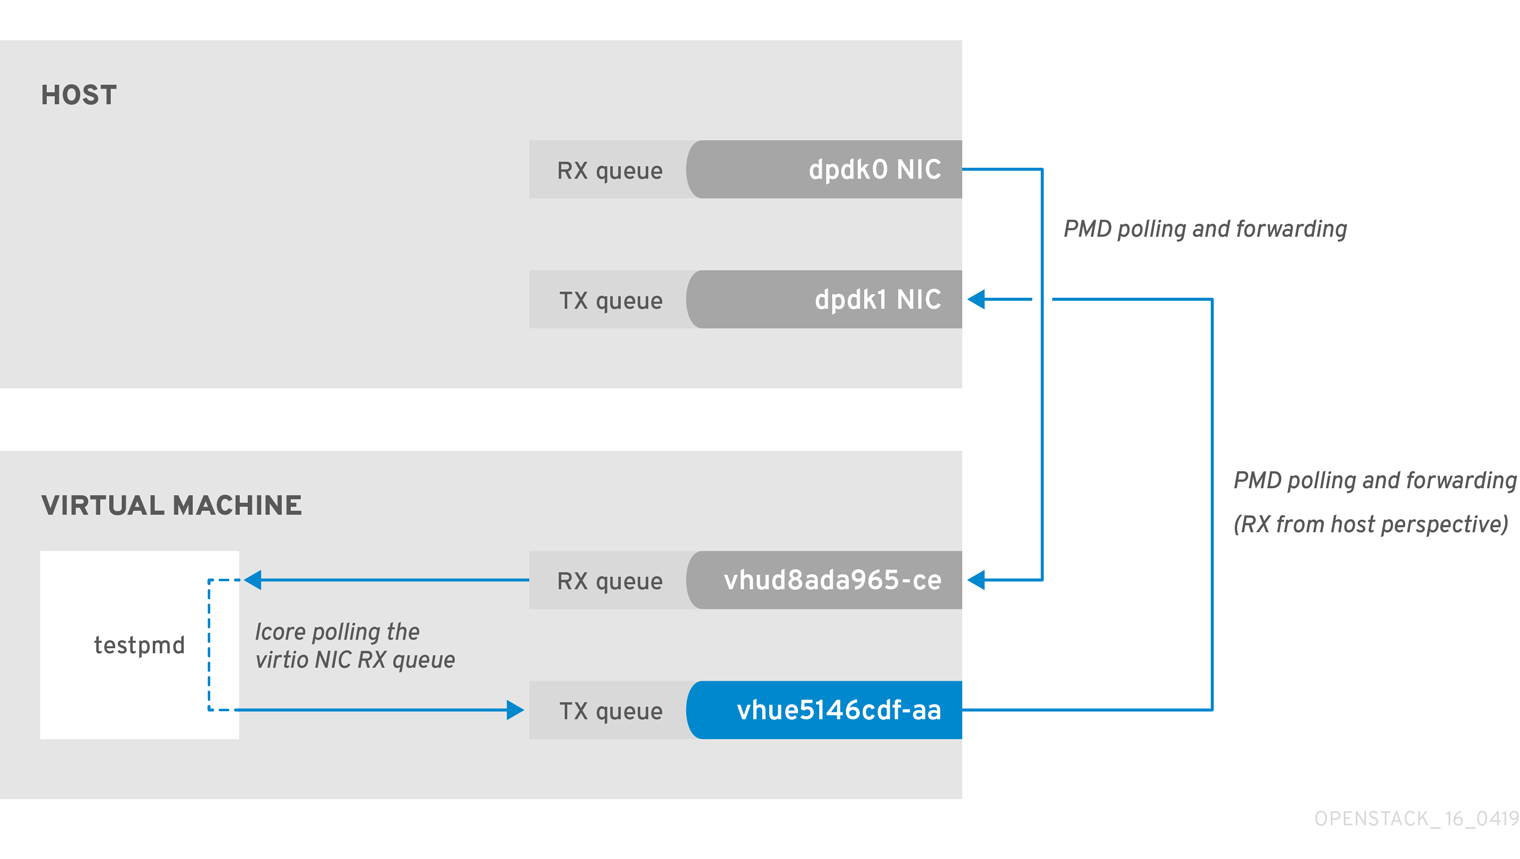
The trace the return path of the packets from the VM and provides values from drop counters on both the host (tx_dropped) and VM (rx_dropped) sides, run the following command:
ovs-vsctl --column statistics list interface vhue5146cdf-aa

statistics          : {"rx_1024_to_1522_packets"=0, "rx_128_to_255_packets"=0, "rx_1523_to_max_packets"=0,
"rx_1_to_64_packets"=0, "rx_256_to_511_packets"=0, "rx_512_to_1023_packets"=0, "rx_65_to_127_packets"=0,
rx_bytes=0, rx_dropped=0, rx_errors=0, rx_packets=0, tx_bytes=0, tx_dropped=0, tx_packets=0}
ovs-vsctl --column statistics list interface vhue5146cdf-aa

statistics          : {"rx_1024_to_1522_packets"=0, "rx_128_to_255_packets"=0, "rx_1523_to_max_packets"=0,
"rx_1_to_64_packets"=0, "rx_256_to_511_packets"=0, "rx_512_to_1023_packets"=0, "rx_65_to_127_packets"=0,
rx_bytes=0, rx_dropped=0, rx_errors=0, rx_packets=0, tx_bytes=0, tx_dropped=0, tx_packets=0}2.6.4. Packet Loss on Egress Physical Interface
A slow transfer rate between the PCIe and RAM can result in the physical adapter dropping packets from the TX queue. While this is infrequent, it’s important to know how to identify and resolve this issue.
Figure 2.4. Polling the physical adapter TX queue
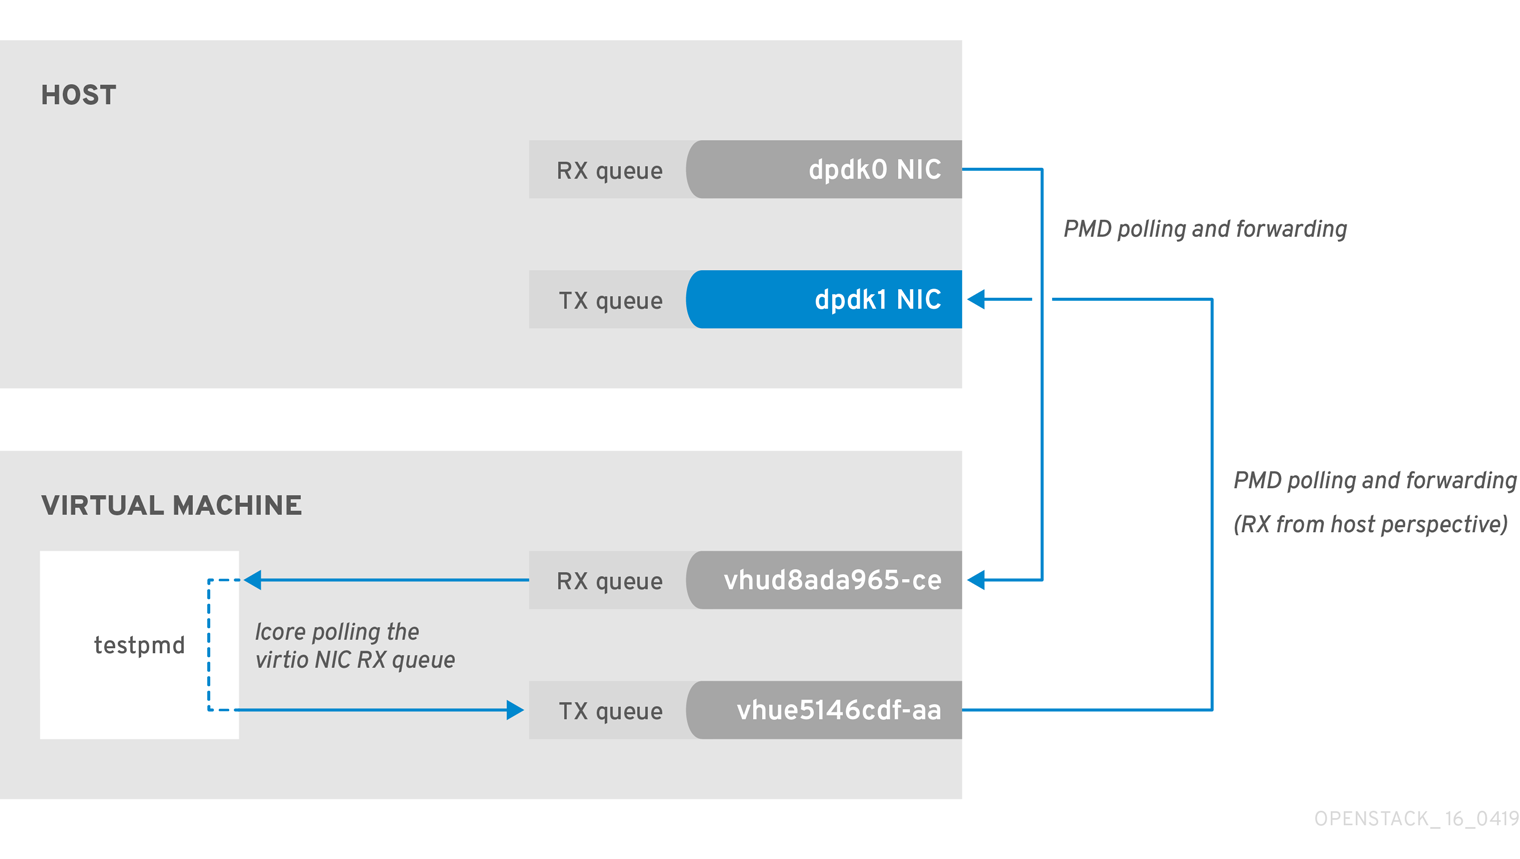
The following command shows statistics from the dpdk1 interface. If tx_dropped is greater than zero and growing rapidly, open a support case with Red Hat.
If you see these types of packet losses, consider reconfiguring the memory channels.
- To calculate memory channels, see: Memory parameters in the Network Functions Virtualization Planning and Conifguration Guide.
- To determine the number of memory channels, see: How to determine the number of memory channels for NeutronDpdkMemoryChannels or OvsDpdkMemoryChannels in Red Hat OpenStack Platform.
Chapter 3. NFV Command Cheatsheet
This chapter contains many of the most commonly used commands for Red Hat OpenStack Platform 10 system observability.
Some of the commands below may not be available by default. To install the required tools for a given node, run the following command:sudo yum install tuna qemu-kvm-tools perf kernel-tools dmidecode
3.1. UNIX Sockets
Use these commands to show process ports and UNIX socket domains.
| Action | Command |
|---|---|
| Show all TCP and UDP SOCKETS in all states (LISTEN, ESTABLISHED, CLOSE_WAIT, etc) without hostname lookup | # lsof -ni |
| Show all TCP SOCKETS in all states (LISTEN, ESTABLISHED, CLOSE_WAIT, etc) without hostname lookup | # lsof -nit |
| Show all UDP SOCKETS in all states (LISTEN, ESTABLISHED, CLOSE_WAIT, etc) without hostname lookup | # lsof -niu |
| Show all TCP and UDP SOCKETS in all states (LISTEN, ESTABLISHED, CLOSE_WAIT, etc) without hostname lookup for IPv4 | # lsof -ni4 |
| Show all TCP and UDP SOCKETS in all states (LISTEN, ESTABLISHED, CLOSE_WAIT, etc) without hostname lookup for IPv6 | # lsof -ni6 |
| Show all related SOCKETS (LISTEN, ESTABLISHED, CLOSE_WAIT, etc) without hostname lookup for a given port | # lsof -ni :4789 |
| Show all SOCKETS in LISTEN state without hostname lookup | # ss -ln |
| Show all SOCKETS in LISTEN state without hostname lookup for IPv4 | # ss -ln4 |
| Show all SOCKETS in LISTEN state without hostname lookup for IPv6 | # ss -ln6 |
3.2. IP
Use these commands to show IP L2 and L3 configs, drivers, PCI busses, and network statistics.
| Action | Command |
|---|---|
| Show all L2 (both physical and virtual) interfaces and their statistics | # ip -s link show |
| Show all L3 interfaces and their statistics | # ip -s addr show |
| Show default (main) IP routing table | # ip route show |
| Show routing rules of a given routing table | # ip route show table external |
| Show all routing tables | # ip rule show |
| Show routing rules for a given destination | # ip route get 1.1.1.1 |
| Show all Linux namespaces | # ip netns show |
| Log in into a Linux namespace | # ip netns exec ns0 bash |
| Show detailed network interface counters of a given interface | # tail /sys/class/net/ens6/statistics/* |
| Show detailed bonding information of a given bond device | # cat /proc/net/bonding/bond1 |
| Show global network interface counter view | # cat /proc/net/dev |
| Show physical connection type (TP, FIBER etc), link speed mode supported and connected for a given network interface | # ethtool ens6 |
| Show Linux driver, driver version, firmware, and PCIe BUS ID of a given network interface | # ethtool -i ens6 |
| Show default, enabled, and disabled hardware offloads for a given network interface | # ethtool -k ens6 |
| Show MQ (multiqueue) configuration for a given network interface | # ethtool -l ens6 |
| Change MQ setup for both RX and TX for a given network interface | # ethtool -L ens6 combined 8 |
| Change MQ setup only for TX for a given network interface | # ethtool -L ens6 tx 8 |
| Show queue size for a given network interface | # ethtool -g ens6 |
| Change RX queue size for a given network interface | # ethtool -G ens6 rx 4096 |
| Show enhanced network statistics | # cat /proc/net/softnet_stat |
| Show quick important network device info (Interface name, MAC, NUMA, PCIe slot, firmware, kernel driver) | # biosdevname -d |
| Show kernel internal drop counters. For more information, see: Monitoring network data processing. | # cat /proc/net/softnet_stat |
3.3. OVS
Use these commands to show Open vSwitch related information.
| Action | Command |
|---|---|
| OVS DPDK human readable statistics | |
| Show OVS basic info (version, dpdk enabled, PMD cores, lcore, ODL bridge mapping, balancing, auto-balancing etc) | # ovs-vsctl list Open_vSwitch |
| Show OVS global switching view | # ovs-vsctl show |
| Show OVS all detailed interfaces | # ovs-vsctl list interface |
| Show OVS details for one interface (link speed, MAC, status, stats, etc) | # ovs-vsctl list interface dpdk0 |
| Show OVS counters for a given interface | # ovs-vsctl get interface dpdk0 statistics |
| Show OVS all detailed ports | # ovs-vsctl list port |
| Show OVS details for one port (link speed, MAC, status, stats, etc) | # ovs-vsctl list port vhu3gf0442-00 |
| Show OVS details for one bridge (datapath type, multicast snooping, stp status etc) | # ovs-vsctl list bridge br-int |
| Show OVS log status | # ovs-appctl vlog/list |
| Change all OVS log to debug | # ovs-appctl vlog/set dbg |
| Change one specific OVS subsystem to debug mode for the file log output | # ovs-appctl vlog/set file:backtrace:dbg |
| Disable all OVS logs | # ovs-appctl vlog/set off |
| Change all OVS subsystems to debug for file log output only | # ovs-appctl vlog/set file:dbg |
| Show all OVS advanced commands | # ovs-appctl list-commands |
| Show all OVS bonds | # ovs-appctl bond/list |
| Show details about a specific OVS bond (status, bond mode, forwarding mode, LACP status, bond members, bond member status, link status) | # ovs-appctl bond/show bond1 |
| Show advanced LACP information for members, bond and partner switch | # ovs-appctl lacp/show |
| Show OVS interface counters | # ovs-appctl dpctl/show -s |
| Show OVS interface counters highlighting differences between iterations | # watch -d -n1 "ovs-appctl dpctl/show -s|grep -A4 -E '(dpdk|dpdkvhostuser)'|grep -v '\-\-'" |
| Show OVS mempool info for a given port | # ovs-appctl netdev-dpdk/get-mempool-info dpdk0 |
| Show PMD performance statistics | # ovs-appctl dpif-netdev/pmd-stats-show |
| Show PMD performance statistics in a consistent way | # ovs-appctl dpif-netdev/pmd-stats-clear && sleep 60s && ovs-appctl dpif-netdev/pmd-stats-show |
| Show DPDK interface statistics human readable | # ovs-vsctl get interface dpdk0 statistics|sed -e "s/,/\n/g" -e "s/[\",\{,\}, ]//g" -e "s/=/ =⇒ /g" |
| Show OVS mapping between ports/queue and PMD threads | # ovs-appctl dpif-netdev/pmd-rxq-show |
| Trigger OVS PMD rebalance (based on PMD cycles utilization) | # ovs-appctl dpif-netdev/pmd-rxq-rebalance |
| Create affinity between an OVS port and a specific PMD (disabling the PMD from any balancing) | # ovs-vsctl set interface dpdk other_config:pmd-rxq-affinity="0:2,1:4" |
| (OVS 2.11+ and FDP18.09) Set PMD balancing based on cycles | # ovs-vsctl set Open_vSwitch . other_config:pmd-rxq-assign=cycles |
| (OVS 2.11+ and FDP18.09) Set PMD balancing in round robin | # ovs-vsctl set Open_vSwitch . other_config:pmd-rxq-assign=roundrobin |
| Set number of OVS-DPDK Physical ports queues | # ovs-vsctl set interface dpdk options:n_rxq=2 |
| Set number of OVS-DPDK Physical ports queue sizes | # ovs-vsctl set Interface dpdk0 options:n_rxq_desc=4096 # ovs-vsctl set Interface dpdk0 options:n_txq_desc=4096 |
| Show OVS MAC address table (used for action=normal) | # ovs-appctl fdb/show br-provider |
| Set OVS vSwitch MAC Address table aging time (default 300s) | # ovs-vsctl set bridge br-provider other_config:mac-aging-time=900 |
| Set OVS vSwitch MAC Address table size (default 2048s) | # ovs-vsctl set bridge br-provider other_config:mac-table-size=204800 |
| Show OVS datapath flows (kernel space) | # ovs-dpctl dump-flows -m |
| Show OVS datapath flows (dpdk) | # ovs-appctl dpif/dump-flows -m br-provider |
| Show mapping between datapath flows port number and port name | # ovs-dpctl show |
| Show OVS OpenFlow rules in a given bridge | # ovs-ofctl dump-flows br-provider |
| Show mapping between OpenFlow flows port number and port name | # ovs-ofctl show br-provider |
| (OVS 2.11+) - Enable auto-rebalance | # ovs-vsctl set Open_vSwitch . other_config:pmd-auto-lb="true" |
| (OVS 2.11+) - Change auto-rebalance interval to a different value (default 1 minute) | # ovs-vsctl set Open_vSwitch . other_config:pmd-auto-lb-rebalance-intvl="5" |
| Detailed OVS internal configs | # man ovs-vswitchd.conf.db |
| To download OVS tcpdump | # curl -O -L ovs-tcpdump.in |
| To perform a packet capture from a DPDK interface | # ovs-tcpdump.py --db-sock unix:/var/run/openvswitch/db.sock -i <bond/vhu> <tcpdump standard arguments such as -v -nn -e -w <path/to/file>> |
| (OVS 2.10+) Detailed PMD performance stats | # ovs-appctl dpif-netdev/pmd-perf-show |
3.4. IRQ
Use these commands to show Interrupt Request Line (IRQ) software and hardware interrupts.
| Action | Command |
|---|---|
| Show SoftIRQ balancing per CPU executed by the ksoftirqd workers | # cat /proc/softirqs | less -S |
| Show SoftIRQ balancing per CPU executed by the ksoftirqd workers every second | # watch -n1 -d -t "cat /proc/softirqs" |
| Show hardware and software interrupts (NMI, LOC, TLB, RSE, PIN, NPI, PIW) balancing per CPU | # cat /proc/interrupts | less -S |
| Show hardware and software interrupts (NMI, LOC, TLB, RSE, PIN, NPI, PIW) balancing per CPU every second | # watch -n1 -d -t "cat /proc/interrupts" |
| Show Timer interrupts | # cat /proc/interrupts | grep -E "LOC|CPU" | less -S |
| Show Timer interrupts every second | # watch -n1 -d -t "cat /proc/interrupts | grep -E 'LOC|CPU'" |
| Show default IRQ CPU affinity | # cat /proc/irq/default_smp_affinity |
| Show IRQ affinity for a given IRQ (CPUMask) | # cat /proc/irq/89/smp_affinity |
| Show IRQ affinity for a given IRQ (DEC) | # cat /proc/irq/89/smp_affinity_list |
| Set IRQ affinity for a given IRQ (CPUMask) | # echo -n 1000 > /proc/irq/89/smp_affinity |
| Set IRQ affinity for a given IRQ (DEC) | # echo -n 12 > /proc/irq/89/smp_affinity_list |
| Show hardware interrupts CPU affinity | # tuna --show_irqs |
| Set IRQ affinity for a given IRQ (DEC supporting rage, e.g. 0-4 means from 0 to 4) | # tuna --irqs=<IRQ> --cpus=<CPU> --move |
| Show IRQ CPU utilization distribution | # mpstat -I CPU | less -S |
| Show IRQ CPU utilization distribution for a given CPU | # mpstat -I CPU -P 4 | less -S |
| Show SoftIRQ CPU utilization distribution | # mpstat -I SCPU | less -S |
| Show SoftIRQ CPU utilization distribution for a given CPU | # mpstat -I SCPU -P 4 | less -S |
3.5. Processes
Use these commands to show processes and threads in Linux, Process Scheduler, and CPU Affinity.
| Action | Command |
|---|---|
| Show for a given process name distribution CPU usage and CPU affinity including all process threads | # pidstat -p $(pidof qemu-kvm) -t |
| Show for a given process name distribution CPU usage and CPU affinity including all process threads, every 10 seconds for 30 iterations | # pidstat -p $(pidof qemu-kvm) -t 10 30 |
| Show for a given process name page faults and memory utilization including all process threads | # pidstat -p $(pidof qemu-kvm) -t -r |
| Show for a given process name I/O statistics including all process threads | # pidstat -p $(pidof qemu-kvm) -t -d |
| Show for a given process name its PID, all the child PID(s) including the process name, and the CPU Time | # ps -T -C qemu-kvm |
| Show for a given process and all the child PID(s) real-time performance statistics | # top -H -p $(pidof qemu-kvm) |
| Show all system threads with process scheduler type, priority, command, CPU Affinity, and Context Switching information | # tuna --show_threads |
| Set for a given PID RealTime (FIFO) scheduling with highest priority | # tuna --threads=<PID> --priority=FIFO:99 |
| Show PMD and CPU threads rescheduling activities | # watch -n1 -d "grep -E 'pmd|CPU' /proc/sched_debug" |
| Browser scheduler internal operation statistics | # less /proc/sched_debug |
| Show comprehensive process statistics and affinity view:
| # top |
| Show all system processes and their CPU affinity | # ps -eF |
| Show all system processes displaying sleeping and running processes and, when sleeping, at which function | # ps -elfL |
| Show CPU Affinity for a given PID | # taskset --pid $(pidof qemu-kvm) |
| Set a CPU Affinity for a given PID | # taskset --pid --cpu-list 0-9,20-29 $(pidof <Process>) |
3.6. KVM
Use these commands to show Kernel-based Virtual Machine (KVM) related domain statistics.
| Action | Command |
|---|---|
| Show real-time KVM hypervisor statistics (VMExit, VMEntry, vCPU wakeup, context switching, timer, Halt Pool, vIRQ) | # kvm_stat |
| Show deep KVM hypervisor statistics | # kvm_stat --once |
| Show real-time KVM hypervisor statistics for a given guest (VMExit, VMEntry, vCPU wakeup, context switching, timer, Halt Pool, vIRQ) | # kvm_stat --guest=<VM name> |
| Show deep KVM hypervisor statistics for a given guest | # kvm_stat --once --guest=<VM name> |
| Show KVM profiling trap statistics | # perf kvm stat live |
| Show KVM profiling statistics | # perf kvm top |
| Show vCPU Pinning for a given VM | # virsh vcpupin <Domain name/ID> |
| Show QEMU Emulator Thread for a given VM | # virsh emulatorpin <Domain name/ID> |
| Show NUMA Pinning for a given VM | # virsh numatune <Domain name/ID> |
| Show memory statistics for a given VM | # virsh dommemstat <Domain name/ID> |
| Show vCPU statistics for a given VM | # virsh nodecpustats <Domain name/ID> |
| Show all vNIC for a given VM | # virsh domiflist <Domain name/ID> |
| Show vNIC statistics for a given VM (does not work with DPDK VHU) | # virsh domifstat <Domain name/ID> <vNIC> |
| Show all vDisk for a given VM | # virsh domblklist <Domain name/ID> |
| Show vDisk statistics for a given VM | # virsh domblkstat <Domain name/ID> <vDisk> |
| Show all statistics for a given VM | # virsh domstats <Domain name/ID> |
3.7. CPU
Use these commands to show CPU utilization, process CPU distribution, frequency, and SMI.
| Action | Command |
|---|---|
| Show for a given process name distribution CPU usage and CPU affinity including all process threads | # pidstat -p $(pidof qemu-kvm) -t |
| Show virtual memory, I/O, and CPU statistics | # vmstat 1 |
| Show detailed CPU usage aggregated | # mpstat |
| Show detailed CPU usage distribution | # mpstat -P ALL |
| Show detailed CPU usage distribution for a given CPU (it does not support a range) | # mpstat -P 2,3,4,5 |
| Show detailed CPU usage distribution for a given CPU every 10 seconds for 30 iteration | # mpstat -P 2,3,4,5 10 30 |
| Show hardware limits and frequency policy for a given CPU frequency | # cpupower -c 24 frequency-info |
| Show current CPU frequency information | # cpupower -c all frequency-info|grep -E "current CPU frequency|analyzing CPU" |
| Show frequency and CPU % C-States stats for all CPU(s) | # cpupower monitor |
| Show real-time frequency and CPU % C-States stats for all CPUs highlighting any variation | # watch -n1 -d "cpupower monitor" |
| Show more detailed frequency and CPU % C-States stats for all CPU including SMI (useful for RT) | # turbostat --interval 1 |
| Show more detailed frequency and CPU % C-States stats for a given CPU including SMI (useful for RT) | # turbostat --interval 1 --cpu 4 |
| Show CPU details and ISA supported | # lscpu |
| Specific for Intel CPU: Display very low-level details about CPU Usage, CPU IPC, CPU Execution in %, L3 and L2 Cache Hit, Miss, Miss per instruction, Temperature, Memory channel usage, and QPI/UPI Usage | git clone Processor Counter Monitor make ./pcm.x" |
3.8. NUMA
Use these commands to show Non-Uniform Memory Access (NUMA) statistics and process distribution.
| Action | Command |
|---|---|
| Show hardware NUMA topology | # numactl -H |
| Show NUMA statistics | # numastat -n |
| Show meminfo like system-wide memory usage | # numastat -m |
| Show NUMA memory details and balancing for a given process name | # numastat qemu-kvm |
| Show for a given NUMA node specific statistics | # /sys/devices/system/node/node<NUMA node number>/numastat |
| Show in a very clear why NUMA topology with NUMA nodes and PCI devices | # lstopo --physical |
| Generate an graph (svg format) of the physical NUMA topology with related devices | # lstopo --physical --output-format svg > topology.svg |
3.9. Memory
Use these commands to show memory statistics, huge pages, DPC, physical DIMM, and frequency.
| Action | Command |
|---|---|
| Show meminfo like system-wide memory usage | # numastat -m |
| Show virtual memory, I/O, and CPU statistics | # vmstat 1 |
| Show global memory information | # cat /proc/meminfo |
| Show the total number of 2MB huge pages for a given NUMA node | # /sys/devices/system/node/node<NUMA node number>/hugepages/hugepages-2048kB/nr_hugepages |
| Show the total number of 1GB huge pages for a given NUMA node | # /sys/devices/system/node/node<NUMA node number>/hugepages/hugepages-1048576kB/nr_hugepages |
| Show the total free 2MB huge pages for a given NUMA node | # /sys/devices/system/node/node<NUMA node number>/hugepages/hugepages-2048kB/free_hugepages |
| Show the total free 1GB huge pages for a given NUMA node | # /sys/devices/system/node/node<NUMA node number>/hugepages/hugepages-1048576kB/free_hugepages |
| Allocate 100x 2MB huge pages in real-time to NUMA0 (NUMA node can be changed) | # echo 100 > /sys/devices/system/node/node0/hugepages/hugepages-2048kB/nr_hugepages |
| Allocate 100x 1GB huge pages in real-time to NUMA0 (NUMA node can be changed) | # echo 100 > /sys/devices/system/node/node0/hugepages/hugepages-1048576kB/nr_hugepages |
| Show real-time SLAB information | # slabtop |
| Show detailed SLAB information | # cat /proc/slabinfo |
| Show total installed memory DIMM | # dmidecode -t memory | grep Locator |
| Show installed memory DIMM Speed | # dmidecode -t memory | grep Speed |
3.10. PCI
Use these commands to show PCI statistics, PCI details, and PCI driver override.
| Action | Command |
|---|---|
| Show detailed PCI device information in system | # lspci -vvvnn |
| Show PCI tree view | # lspci -vnnt |
| Show PCI device NUMA information | # lspci -vmm |
| Show PCIe max link speed for a given device | # lspci -s 81:00.0 -vv | grep LnkCap |
| Show PCIe link speed status for a given device | # lspci -s 81:00.0 -vv | grep LnkSta |
| Show PCI device and kernel driver | # driverctl list-devices |
| Show PCI device driver override (typical for DPDK and SR-IOV interfaces) | # driverctl list-overrides |
| Set different kernel driver for PCI device (reboot persistent) | # driverctl set-override 0000:81:00.0 vfio-pci |
| Unset overridden kernel driver for PCI device (if device is in use the command will hang) | # driverctl unset-override 0000:81:00.0 |
3.11. Tuned
Use these commands to show tuned profiles, verification, and logs.
| Action | Command |
|---|---|
| Show tuned current enabled profile and description | # tuned-adm profile_info |
| Show tuned available profiles and current enabled profiles | # tuned-adm list |
| Enabled a specific tuned profile | # tuned-adm profile realtime-virtual-host |
| Verify current enabled profile | # tuned-adm verify |
| Tuned’s log | # less /var/log/tuned/tuned.log |
3.12. Profiling Process
Use these commands to show CPU profiling, process profiling, and KVM profiling.
| Section | Action | Command |
|---|---|---|
| Process | Profiling on specific PID | # perf record -F 99 -p PID |
| Process | Profiling on specific PID for 30 seconds | # perf record -F 99 -p PID sleep 30 |
| Process | Profiling real-time on specific PID | # perf top -F 99 -p PID |
| CPU | Profiling on specific CPU Core list for 30 seconds for any events | # perf record -F 99 -g -C <CPU Core(s)> — sleep 30s |
| CPU | Profiling real-time on specific CPU Core list for any events | # perf top -F 99 -g -C <CPU Core(s)> |
| Context Switching | Profiling on specific CPU Core list for 30 seconds and looking only for Context Switching | # perf record -F 99 -g -e sched:sched_switch -C <CPU Core(s)> — sleep 30 |
| KVM | Profiling KVM guest for a given time | # perf kvm stat record sleep 30s |
| Cache | Profiling on specific CPU Core list for 5 seconds looking for the cache efficiency | # perf stat -C <CPU Core(s)> -B -e cache-references,cache-misses,cycles,instructions,branches,faults,migrations sleep 5 |
| Report | Analyze perf profiling | # perf report |
| Report | Report perf profiling in stdout | # perf report --stdio |
| Report | Report KVM profiling in stdout | # perf kvm stat report |
3.13. Block I/O
Use these commands to show storage I/O distribution and I/O profiling.
| Action | Command |
|---|---|
| Show I/O details for all system device | # iostat |
| Show advanced I/O details for all system device | # iostat -x |
| Show advanced I/O details for all system device every 10 seconds for 30 iterations | # iostat -x 10 30 |
| Generate advanced I/O profiling for a given block device | # blktrace -d /dev/sda -w 10 && blkparse -i sda.* -d sda.bin |
| Report blktrace profiling | # btt -i sda.bin |
3.14. Real Time
Use these commands to show Real Time tests related, SMI, and latency.
| Action | Command |
|---|---|
| Identify if any SMI are blocking the normal RT kernel execution exercising the defined threshold. | # hwlatdetect --duration=3600 --threshold=25 |
| Verify maximum scheduling latency for a given time with a number of additional options:
| # cyclictest --duration=3600 \ --mlockall \ --priority=99 \ --nanosleep \ --interval=200 \ --histogram=5000 \ --histfile=./output \ --threads \ --numa \ --notrace |
3.15. Security
Use these commands to verify speculative executions and the GRUB boot parameter.
| Action | Command |
|---|---|
| Check all current Speculative execution security status | See: Spectre & Meltdown vulnerability/mitigation checker for Linux & BSD. |
| GRUB parameter to disable all Speculative Execution remediation | spectre_v2=off spec_store_bypass_disable=off pti=off l1tf=off kvm-intel.vmentry_l1d_flush=never |
| Verify CVE-2017-5753 (Spectre variant 1) status | # cat /sys/devices/system/cpu/vulnerabilities/spectre_v1 |
| Verify IBPB and Retpoline (CVE-2017-5715 Spectre variant 2) status | # cat /sys/devices/system/cpu/vulnerabilities/spectre_v2 |
| Verify KPTI (CVE-2017-5754 Meltdown) status | # cat /sys/devices/system/cpu/vulnerabilities/meltdown |
| Verify Spectre-NG (CVE-2018-3639 Spectre Variant 4) status | # cat /sys/devices/system/cpu/vulnerabilities/spec_store_bypass |
| Verify Foreshadow (CVE-2018-3615 Spectre Varian 5 also known as L1TF) status | # cat /sys/devices/system/cpu/vulnerabilities/l1tf |
| Verify Foreshadow VMEntry L1 cache effect | # cat /sys/module/kvm_intel/parameters/vmentry_l1d_flush |
| Verify SMT status | # cat /sys/devices/system/cpu/smt/control |
3.16. Juniper Contrail vRouter
Use these commands to show vRouter VIF, MPLS, Nexthost, VRF, VRF’s routes, flows, and dump information.
| Action | Command |
|---|---|
| vRouter Kernel space human readable statistics | |
| vRouter DPDK human readable statistics | |
| To perform a packet capture from a DPDK interface (do not use grep after vifdump) | # vifdump vif0/234 <tcpdump standard arguments such as -v -nn -e -w <path/to/file>> |
| Display all vRouter interfaces and sub-interfaces statistics and details | # vif --list |
| Display vRouter statistics and details for a given interface | # vif --list --get 234 |
| Display vRouter packer rate for all interfaces and sub-interfaces | # vif --list --rate |
| Display vRouter packer rate for a given interfaces | # vif --list --rate --get 234 |
| Display vRouter packet drop statistics for a given interface | # vif --list --get 234 --get-drop-stats |
| Display vRouter flows | # flow -l |
| Display real-time vRouter flow actions | # flow -r |
| Display vRouter packet statistics for a given VRF (you can find VRF number from vif --list) | # vrfstats --get 0 |
| Display vRouter packet statistics for all VRF | # vrfstats --dump |
| Display vRouter routing table for a given VRF (you can find the VRF number from vif --list) | # rt --dump 0 |
| Display vRouter IPv4 routing table for a given VRF (you can find the VRF number from vif --list) | # rt --dump 0 --family inet |
| Display vRouter IPv6 routing table for a given VRF (you can find the VRF number from vif --list) | # rt --dump 0 --family inet6 |
| Display vRouter forwarding table for a given VRF (you can find the VRF number from vif --list) | # rt --dump 0 --family bridge |
| Display vRouter route target in a given VRF for a given address | # rt --get 0.0.0.0/0 --vrf 0 --family inet |
| Display vRouter drop statistics | # dropstats |
| Display vRouter drop statistics for a given DPDK core | # dropstats --core 11 |
| Display vRouter MPLS labels | # mpls --dump |
| Display vRouter nexthop for a given one (can be found from mpls --dump output) | # nh --get 21 |
| Display all vRouter nexthops | # nh --list |
| Display all vRouter VXLAN VNID | # vxlan --dump |
| Display vRouter agents (supervisor, xmmp connection, vrouter agent etc) status | # contrail-status |
| Restart vRouter (and all Contrail local compute node components) | # systemctl restart supervisor-vrouter |
3.17. OpenStack
Use these OpenStack commands to show VM compute nodes.
| Action | Command |
|---|---|
| Show list of all VMs on their compute nodes sorted by compute nodes | $ nova list --fields name,OS-EXT-SRV-ATTR:host --sort host |
| Show list of all VMs on their compute nodes sorted by vm name | $ nova list --fields name,OS-EXT-SRV-ATTR:host |
Chapter 4. High Packet Loss in the TX Queue of the Instance’s Tap Interface
Use this section to troubleshoot packet loss in the TX queue.
4.1. Symptom
During a test of a virtual network function (VNF) using host-only networking, high packet loss can be observed in the TX queue of the instance’s tap interface. The test setup sends packets from one VM on a node to another VM on the same node. The packet loss appears in bursts.
The following example shows a high number of dropped packets in the tap’s TX queue.
4.2. Diagnosis
This section examines packet drop on tap (kernel path) interfaces. For packet drops on vhost user interfaces in the user datapath, see https://access.redhat.com/solutions/3381011
TX drops occur because of interference between the instance’s vCPU and other processes on the hypervisor. The TX queue of the tap interface is a buffer that can store packets for a short while in case that the instance cannot pick up the packets. This happens if the instance’s CPU is prevented from running (or freezes) for a long enough time.
A TUN/TAP device is a virtual device where one end is a kernel network interface, and the other end is a user space file descriptor.
A TUN/TAP interface can run in one of two modes:
- Tap mode feeds L2 ethernet frames with L2 header into the device, and expects to receive the same out from user space. This mode is used for VMs.
- Tun mode feeds L3 IP packets with L3 header into the device, and expects to receive the same out from user space. This mode is mostly used for VPN clients.
In KVM networking, the user space file descriptor is owned by the qemu-kvm process. Frames that are sent into the tap (TX from the hypervisor’s perspective) end up as L2 frames inside qemu-kvm, which can then feed those frames to the virtual network device in the VM as network packets received into the virtual network interface (RX from the VM’s perspective).
A key concept with TUN/TAP is that the transmit direction from the hypervisor is the receive direction for the virtual machine. This same is true of the opposite direction; receive for the hypervisor is equal to transmit from the virtual machine.
There is no "ring buffer" of packets on a virtio-net device. This means that if the TUN/TAP device’s TX queue fills up because the VM is not receiving (either fast enough or at all) then there is nowhere for new packets to go, and the hypervisor sees TX loss on the tap.
If you notice TX loss on a TUN/TAP, increase the tap txqueuelen to avoid that, similar to increasing the RX ring buffer to stop receive loss on a physical NIC.
However, this assumes the VM is just "slow" and "bursty" at receive. If the VM is not executing fast enough all the time, or otherwise not receiving at all, tuning the TX queue length won’t help. You must find out why the VM is not running or receiving.
If the only need is to improve VM packet handling performance, complete the following steps:
-
Enable
virtio-net multiqueueon the hypervisor. - Balance those multiple virtual device interrupts on difference cores inside the VM.
This is documented in the libvirt domain spec for KVM and can be done with virsh edit on a RHEL KVM hypervisor.
If you cannot configure virtio-net multiqueue in Red Hat OpenStack Platform, consider configuring RPS inside the VM to balance receive load across multiple CPU cores with software. For more information, see scaling.txt in the kernel-doc package, or see the RPS section in the RHEL product documentation.
4.2.1. Workaround
To alleviate small freezes at the cost of higher latency and other disadvantages, increase the TX queue.
To temporarily increase txqueuelen, use the following command:
/sbin/ip link set tap<uuid> txqueuelen <new queue length>
/sbin/ip link set tap<uuid> txqueuelen <new queue length>
To permanently increase txqueulen, create a udev rule:
cat <<'EOF'>/etc/udev/rules.d/71-net-txqueuelen.rules
SUBSYSTEM=="net", ACTION=="add", KERNEL=="tap*", ATTR{tx_queue_len}="10000"
EOF
cat <<'EOF'>/etc/udev/rules.d/71-net-txqueuelen.rules
SUBSYSTEM=="net", ACTION=="add", KERNEL=="tap*", ATTR{tx_queue_len}="10000"
EOFAfter reloading udev or rebooting the system, new tap interfaces will come up with a queue length of 10000. For example:
ip link ls | grep tap
[root@overcloud-compute-0 ~]# ip link ls | grep tap
29: tap122be807-cd: <BROADCAST,MULTICAST,UP,LOWER_UP> mtu 5505
qdisc pfifo_fast master qbr122be807-cd state UNKNOWN mode DEFAULT
group default qlen 100004.2.2. Diagnostic Steps
Use the following script to view the effects of CPU time being stolen from the hypervisor.
Log in to the instance and start dd if=/dev/zero of=/dev/null to generate additional load on its only vCPU. Note that this is for demonstration purposes. You can repeat the same test with and without load from within the VM. TX drop only occurs when another process on the hypervisor is stealing time from the instance’s vCPU.
The following example shows an instance before the test:
Run the following script and observe the dropped packages in the TX queue. These only occur when the dd process consumes a significant amount of processing time from the instance’s CPU.
The following example shows the effects of dd on the hypervisor during the test. The st label identifies the percentage of time stolen from the hypervisor.
Note that ssh can become sluggish during the second half of the test on the instance, including the possibility of timing out if the test runs too long.
4.3. Solution
While increasing the TX queue helps to mitigate these small freezes, complete isolation with CPU pinning and isolcpus in the kernel parameters is the best solution. Form more information, see Configure CPU pinning with NUMA in OpenStack for further details.
Chapter 5. TX Drops on Instance VHU Interfaces with Open vSwitch DPDK
Use this procedure to troubleshoot transmit drops on instance vhost-user (VHU) interface.
5.1. Symptom
Packets go from the vswitch to the guest using the virtio transport without passing through the kernel or qemu processes. This is done by exchanging packets with the VHU interface.
The VHU is mostly implemented by DPDK librte_vhost that also offers functions to send or receive batches of packets. The backend of VHU is a virtio ring provided by qemu to exchange packets with the virtual machine. The virtio ring has a special format comprised of descriptors and buffers.
The TX/RX (transmit/receive) statistics are for OpenvSwitch (OVS). This means that transmit statistics relate directly to receive statistics for the VM.
If the VM does not process packets fast enough, the OVS TX queue overflows and drops packets.
5.1.1. Explanation for Packet Drops
A saturated virtio ring causes TX drops on the vhost-user device. The virtio ring is located in the guest’s memory and it works like a queue where the vhost-user pushes packets and the VM consumes them. If the VM is not fast enough to consume the packets, the virtio ring runs out of buffers and the vhost-user drops packets.
Use the Perf and Ftrace tools to troubleshoot packet drops.
- Use Perf to count the number of scheduler switches, which could show whether the qemu thread preempted.
- Use Ftrace to show the reason for preemption, as well as how long it took.
Reasons for preemption include:
Time Interrupt (kernel ticks):
These add the cost of at least two context switches. The timer interrupt can also run read-copy update (RCU) callbacks which can take an unpredictable amount of time.
- CPU power management and hyperthreading
You can find these tools in the following packages:
-
PERF:
perf rpm in rhel-7-server-rpms/7Server/x86_64. For more information, see About Perf -
FTRACE:
trace-cmd info rhel-7-server-rpms/7Server/x86_64. For more information, see About Ftrace
5.1.2. Explanation for other drops
Prior to OVS 2.9, vHost user ports were created in dpdkvhostuser mode. In this mode, OVS acts as the vhost server, and QEMU acts as the client. When an instance goes down or restarts, the vhost user port on the OVS bridge, still active, drops packets destined for the VM. This increases the tx_drop_counter:
In the following example, the VM was stopped with nova stop <UUID>:
ovs-vsctl list interface vhubd172106-73 | grep _state
[root@overcloud-compute-0 network-scripts]# ovs-vsctl list interface vhubd172106-73 | grep _state
admin_state         : up
link_state          : down
This is similar to what happens when the kernel port is shut down with ip link set dev <br internal port name> down and frames are dropped in userspace.
When the VM is up, it connects to the same vhu socket and will start emptying the virtio ring buffer. TX is no longer interrupted and normal network traffic resumes.
5.1.3. Increasing the TX and RX queue lengths for DPDK
You can change TX and RX queue lengths for DPDK with the following OpenStack director template modifications:
NovaComputeExtraConfig:
        nova::compute::libvirt::rx_queue_size: '"1024"'
        nova::compute::libvirt::tx_queue_size: '"1024"'
NovaComputeExtraConfig:
        nova::compute::libvirt::rx_queue_size: '"1024"'
nova::compute::libvirt::tx_queue_size: '"1024"'The following example shows validation checks:
Due to kernel limitations, you cannot increase the queue size beyond 1024.
If you plan for PXE boot to be available for neutron networks over DPDK, you must verify that the PXE version supports 1024 bytes.
5.2. Diagnosis
You can see TX drops towards the vhost user ports when the guest cannot receive packets. TCP is designed to recover from packet loss, which occurs in normal network conditions. NFVi has strict requirements with less tolerance for packet drops.
Use DPDK-accelerated OVS, as the kernel datapath is too slow for NFVi. Additionally, it is important to deploy DPDK-enabled guests that can match the packet processing speed of the host.
5.3. Solution
Ensure that the vCPUs allocated to the VM are only processing tasks for the guests.
Check that the cluster was deployed with the heat following template parameters:
-
IsolcpusList: Removes CPUs from scheduling -
NovaVcpuPinSet: Assigns CPUs for pinning -
NovaComputeCpuSharedSet: Allocates CPUs for emulator thread pinning
-
Example:
- Ensure that VMs are deployed with a flavor that takes advantage of pinned CPUs and the emulator pool set.
Example:
openstack flavor create --ram <size_mb> --disk <size_gb> -\
-vcpus <vcpus> --property dpdk=true \
--property hw:mem_page_size=1G \
--property hw:cpu_policy=dedicated \
--property hw:emulator_threads_policy=share <flavor>
openstack flavor create --ram <size_mb> --disk <size_gb> -\
-vcpus <vcpus> --property dpdk=true \
--property hw:mem_page_size=1G \
--property hw:cpu_policy=dedicated \
--property hw:emulator_threads_policy=share <flavor>- Ensure that these settings are operating as intended. For more information, see Simple Compute Node CPU Partitioning and Memory Checks for details.
If you allocate completely dedicated CPU resources to the instance and still observe network packet loss, ensure that the instance is properly tuned and DPDK enabled.
Chapter 6. Interpreting the output of the pmd-stats-show command in Open vSwitch with DPDK
Use this section to interpret the output of the pmd-stats-show command (ovs-appctl dpif-netdev/pmd-stats-show) in Open vSwitch (OVS) with DPDK.
6.1. Symptom
The ovs-appctl dpif-netdev/pmd-stats-show command provides an inaccurate measurement. This is due to gathered statistics that have been charted since PMD was started.
6.2. Diagnosis
To obtain useful output, put the system into a steady state and reset the statistics that you want to measure:
put system into steady state
wait <x> seconds
# put system into steady state
ovs-appctl dpif-netdev/pmd-stats-clear
# wait <x> seconds
sleep <x>
ovs-appctl dpif-netdev/pmd-stats-showHere’s an example of the output:
Note that core_id 2 is mainly busy, spending 70% of the time processing and 30% of the time polling.
polling cycles:5460724802 (29.10%)
processing cycles:13305794333 (70.90%)
polling cycles:5460724802 (29.10%)
processing cycles:13305794333 (70.90%)
In this example, miss indicates packets that were not classified in the DPDK datapath ('emc' or 'dp' classifier). Under normal circumstances, they would then be sent to the ofproto layer. On rare occasions, due to a flow revalidation lock or if the ofproto layer returns an error, the packet is dropped. In this case, the value of lost will also be incremented to indicate the loss.
emc hits:14874381
megaflow hits:0
avg. subtable lookups per hit:0.00
miss:0
lost:0
emc hits:14874381
megaflow hits:0
avg. subtable lookups per hit:0.00
miss:0
lost:0For more information, see OVS-DPDK Datapath Classifier.
6.3. Solution
This section shows the procedures for viewing traffic flow using the ovs-appctl command.
6.3.1. Idle PMD
The following example shows a system where the core_ids serve the PMDs that are pinned to dpdk0, with only management traffic flowing through dpdk0:
6.3.2. PMD under load test with packet drop
The following example shows a system where the core_ids serve the PMDs that are pinned to dpdk0, with a load test flowing through dpdk0, causing a high number of RX drops:
Where packet drops occur, you can see a high ratio of processing cycles vs polling cycles (more than 90% processing cycles):
polling cycles:1497174615 (6.85%)
processing cycles:20354613261 (93.15%)
polling cycles:1497174615 (6.85%)
processing cycles:20354613261 (93.15%)Check the average cycles per packet (CPP) and average processing cycles per packet (PCPP). You can expect a PCPP/CPP ratio of 1 for a fully loaded PMD as there will be no idle cycles counted.
avg cycles per packet: 723.96 (21851787876/30183584)
avg processing cycles per packet: 674.36 (20354613261/30183584)
avg cycles per packet: 723.96 (21851787876/30183584)
avg processing cycles per packet: 674.36 (20354613261/30183584)6.3.3. PMD under loadtest with 50% of mpps capacity
The following example shows a system where the core_ids serve the PMDs that are pinned to dpdk0, with a load test flowing through dpdk0, sending 6.4 Mpps (around 50% of the maximum capacity) of this dpdk0 interface (around 12.85 Mpps):
Where the pps are about half of the maximum for the interface, you can see a lower ratio of processing cycles vs polling cycles (approximately 70% processing cycles):
polling cycles:5460724802 (29.10%)
processing cycles:13305794333 (70.90%)
polling cycles:5460724802 (29.10%)
processing cycles:13305794333 (70.90%)6.3.4. Hit vs miss vs lost
The following examples shows the man pages regarding the subject:
Some of the documentation is referring to the kernel datapath, so when it says user space processing it means the packet is not classified in the kernel sw caches (equivalents to emc & dpcls) and sent to the ofproto layer in userspace.
Chapter 7. Attaching and Detaching SR-IOV ports in nova
Use the following section to attach and detach SR-IOV ports.
7.1. Symptom
You are unable to attach or detach SR-IOV ports in nova in Red Hat OpenStack Platform 10 and later. Nova logs report No conversion for VIF type hw_veb yet.
7.2. Diagnosis
You cannot attach or detach SR-IOV ports to an instance that has already been created. SR-IOV ports need to be attached at instance creation.
7.3. Solution
The following example shows an attempt to attach interfaces after an instance boot:
This fails with the following error:
ERROR (ClientException): Unexpected API Error. Please report this at http://bugs.launchpad.net/nova/ and attach the Nova API log if possible.
<type 'exceptions.KeyError'> (HTTP 500) (Request-ID: req-36b544f4-91a6-442e-a30d-6148220d1449)
ERROR (ClientException): Unexpected API Error. Please report this at http://bugs.launchpad.net/nova/ and attach the Nova API log if possible.
<type 'exceptions.KeyError'> (HTTP 500) (Request-ID: req-36b544f4-91a6-442e-a30d-6148220d1449)The correct method is to spawn an instance directly with SR-IOV ports:
Chapter 8. Configure and Test LACP Bonding with Open vSwitch DPDK
OVS bonds with LACP might not be supported depending on the version of Red Hat OpenStack Platform (RHOSP) you are using. Check the product documentation to verify that OVS bonds with LACP are supported.
To use Open vSwitch DPDK to configure and test LACP bonding, complete the following tasks:
- Configure the switch ports for LACP.
- Configure Linux kernel bonding for LACP as a baseline.
- Configure OVS DPDK bonding for LACP.
This topic describes switch configuration with a Dell S4048-ON switch. Whereas configuration of RHEL and OVS remains the same, different switch vendors' operating systems will use a different syntax to configure LACP.
8.1. Configuring the Switch Ports for LACP
Reset the switch interfaces to their default settings:
S4048-ON-sw#config t
S4048-ON-sw(conf)#default int te1/2
S4048-ON-sw(conf)#default int te1/7
S4048-ON-sw#config t
S4048-ON-sw(conf)#default int te1/2
S4048-ON-sw(conf)#default int te1/7
Copy to Clipboard Copied! Toggle word wrap Toggle overflow Configure the port-channel and other port settings:
Copy to Clipboard Copied! Toggle word wrap Toggle overflow Configure the VLANs:
S4048-ON-sw#config t
S4048-ON-sw(conf)#int range vlan901-909
S4048-ON-sw(conf-if-range-vl-901-909)#tagged Port-channel 1
S4048-ON-sw(conf-if-range-vl-901-909)#end
S4048-ON-sw#
S4048-ON-sw#config t
S4048-ON-sw(conf)#int range vlan901-909
S4048-ON-sw(conf-if-range-vl-901-909)#tagged Port-channel 1
S4048-ON-sw(conf-if-range-vl-901-909)#end
S4048-ON-sw#
Copy to Clipboard Copied! Toggle word wrap Toggle overflow Verify VLAN tagging:
Copy to Clipboard Copied! Toggle word wrap Toggle overflow Verify the LACP configuration:
Copy to Clipboard Copied! Toggle word wrap Toggle overflow
8.2. Configuring Linux Kernel Bonding for LACP as a Baseline
Configure Linux kernel bonding as a baseline, then verify that the host can form an LACP bond with the switch.
Move all interfaces to the kernel space and test with kernel space bonding. In this example, p1p1 maps to bus address
0000:04:00.0and p1p2 maps to bus address0000:04:00.1.driverctl unset-override 0000:04:00.0 driverctl unset-override 0000:04:00.1
[root@baremetal ~]# driverctl unset-override 0000:04:00.0
[root@baremetal ~]# driverctl unset-override 0000:04:00.1
Copy to Clipboard Copied! Toggle word wrap Toggle overflow Load the bonding driver, configure a bond interface (
bond10) and enslave interfacesp1p1andp1p2:Copy to Clipboard Copied! Toggle word wrap Toggle overflow Verify LACP from RHEL:
Copy to Clipboard Copied! Toggle word wrap Toggle overflow Verify LACP from the switch:
Copy to Clipboard Copied! Toggle word wrap Toggle overflow Remove the bonding configuration:
ip link del dev bond10
[root@baremetal ~]# ip link del dev bond10
[root@baremetal ~]#
Copy to Clipboard Copied! Toggle word wrap Toggle overflow
For information about changing the bonding mode, see: How to change the bonding mode without rebooting the system?
8.3. Configuring OVS DPDK Bonding for LACP
The next objective is to configure an LACP bond within OVS DPDK.
8.3.1. Prepare Open vSwitch
Ensure that huge pages and other values are configured in RHEL:
Copy to Clipboard Copied! Toggle word wrap Toggle overflow Configure OVS for DPDK:
ovs-vsctl list Open_vSwitch | grep other
ovs-vsctl --no-wait set Open_vSwitch . other_config:pmd-cpu-mask=0x17c0017c
ovs-vsctl --no-wait set Open_vSwitch . other_config:dpdk-lcore-mask=0x00000001
ovs-vsctl --no-wait set Open_vSwitch . other_config:dpdk-init="true"
[root@baremetal bonding]# ovs-vsctl list Open_vSwitch | grep other
other_config        : {}
[root@baremetal bonding]# ovs-vsctl --no-wait set Open_vSwitch . other_config:pmd-cpu-mask=0x17c0017c
[root@baremetal bonding]# ovs-vsctl --no-wait set Open_vSwitch . other_config:dpdk-lcore-mask=0x00000001
[root@baremetal bonding]# ovs-vsctl --no-wait set Open_vSwitch . other_config:dpdk-init="true"
Copy to Clipboard Copied! Toggle word wrap Toggle overflow Switch interfaces into user space:
Copy to Clipboard Copied! Toggle word wrap Toggle overflow Restart Open vSwitch,
journalctl -u ovs-vswitchd -f &running in the background:Copy to Clipboard Copied! Toggle word wrap Toggle overflow
8.3.2. Configure LACP Bond
Add the bond:
ovs-vsctl add-br ovsbr0  -- set bridge ovsbr0  datapath_type=netdev
ovs-vsctl add-bond ovsbr0 dpdkbond dpdk0 dpdk1     bond_mode=balance-tcp     lacp=active -- set
[root@baremetal bonding]# ovs-vsctl add-br ovsbr0  -- set bridge ovsbr0  datapath_type=netdev
[root@baremetal bonding]# ovs-vsctl add-bond ovsbr0 dpdkbond dpdk0 dpdk1     bond_mode=balance-tcp     lacp=active -- set
interface dpdk0 type=dpdk     -- set Interface dpdk1 type=dpdk
Copy to Clipboard Copied! Toggle word wrap Toggle overflow Verify from Open vSwitch:
Copy to Clipboard Copied! Toggle word wrap Toggle overflow Verify from the switch:
Copy to Clipboard Copied! Toggle word wrap Toggle overflow
8.3.3. Enabling / Disabling Ports from OVS
You can enable or disable ports with ovs-ofctl mod-port <bridge> <port> [up|down]
Shut down a port:
ovs-ofctl mod-port ovsbr0 dpdk1 down
[root@baremetal bonding]# ovs-ofctl mod-port ovsbr0 dpdk1 downCopy to Clipboard Copied! Toggle word wrap Toggle overflow Verify the shutdown:
Copy to Clipboard Copied! Toggle word wrap Toggle overflow Verify on the switch:
Copy to Clipboard Copied! Toggle word wrap Toggle overflow Re-enable the port:
ovs-ofctl mod-port ovsbr0 dpdk1 up
[root@baremetal bonding]# ovs-ofctl mod-port ovsbr0 dpdk1 upCopy to Clipboard Copied! Toggle word wrap Toggle overflow Verify from RHEL:
Copy to Clipboard Copied! Toggle word wrap Toggle overflow Verify from the switch:
Copy to Clipboard Copied! Toggle word wrap Toggle overflow
Chapter 9. Deploying different bond modes with OVS DPDK
Use this procedure to deploy different bond modes with OVS-DPDK in Red Hat OpenStack Platform.
9.1. Solution
Make the following changes to the compute.yaml environment file. Note that this example also sets the MTU value to 2000.
Deploy or redeploy the overcloud with the template changes made above. When complete, perform the following steps on an overcloud node.
Verify the os-net-config configuration:
Verify the bond:
Chapter 10. Receiving the Could not open network device dpdk0 (No such device) in ovs-vsctl show message
10.1. Symptom
You receive the Could not open network device dpdk0 (No such device) in ovs-vsctl show message.
10.2. Diagnosis
Red Hat supports a subset of the Poll Mode Drivers (PMDs) listed in DPDK Supported Hardware. Red Hat disabled unsupported PMDs in August of 2017.
Upstream PMDs might have security or performance issues. Therefore, a PMD needs to go through significant testing to pass Red Hat’s qualification tests.
You can see a list of all enabled PMDs in /usr/share/doc/openvswitch-<version>/README.DPDK-PMDS. This list might contain PMDs not supported by Red Hat. Poll Mode Drivers not listed in README.DPDK-PMDS are not supported.
10.3. Solution
The following example shows the supported PMDs for openvswitch-2.6.1:
This example shows the supported PMDs for openvswitch-2.9.0:
Chapter 11. Insufficient Free Host Memory Pages Available to Allocate Guest RAM with Open vSwitch DPDK
11.1. Symptom
When deploying an instance and scheduling it onto a compute node which still has sufficient pCPUs for the instance and also sufficient free huge pages for the instance memory, nova returns:
And /var/log/nova/nova-compute.log on the compute node gives the following ERROR message:
2017-11-23 19:53:21.021 153615 ERROR nova.compute.manager [instance: 1b72e7a1-c298-4c92-8d2c-0a9fe886e9bc]
2017-11-23T19:53:20.477183Z qemu-kvm: -object memory-backend-file,id=ram-node0,prealloc=yes,mem-path=/dev/hugepages/libvirt
/qemu/7-instance-00000006,share=yes,size=536870912,host-nodes=0,policy=bind: os_mem_prealloc: Insufficient free host memory
pages available to allocate guest RAM
2017-11-23 19:53:21.021 153615 ERROR nova.compute.manager [instance: 1b72e7a1-c298-4c92-8d2c-0a9fe886e9bc]
2017-11-23T19:53:20.477183Z qemu-kvm: -object memory-backend-file,id=ram-node0,prealloc=yes,mem-path=/dev/hugepages/libvirt
/qemu/7-instance-00000006,share=yes,size=536870912,host-nodes=0,policy=bind: os_mem_prealloc: Insufficient free host memory
pages available to allocate guest RAMAdditionally, libvirt creates the following log file:
11.2. Diagnosis
Without additional settings, nova does not know that a certain amount of huge page memory is used by other processes. By default, nova assumes that all huge page memory is available for instances. Nova will first fill up NUMA node 0 if it believes that there are still free pCPUs and free hugepage memory on this NUMA node. This issue can occur due to the following causes:
- The requested pCPUs still fit into NUMA 0
- The combined memory of all existing instances plus the memory of the instance to be spawned still fit into NUMA node 0
- Another process such as OVS holds a certain amount of hugepage memory on NUMA node 0
11.2.1. Diagnostic Steps
Check
meminfo. The following show a hypervisor with 2MB hugepages and 512 free hugepages per NUMA node:Copy to Clipboard Copied! Toggle word wrap Toggle overflow Check the NUMA architecture:
lscpu | grep -i NUMA
[root@overcloud-compute-1 nova]# lscpu  | grep -i NUMA
NUMA node(s):          2
NUMA node0 CPU(s):     0-3
NUMA node1 CPU(s):     4-7
Copy to Clipboard Copied! Toggle word wrap Toggle overflow Check the huge pages reserved by OVS. In the following output, OVS reserves 512MB of huge pages per NUMA node:
ovs-vsctl list Open_vSwitch | grep mem
[root@overcloud-compute-1 virt]# ovs-vsctl list Open_vSwitch | grep mem
other_config        : {dpdk-init="true", dpdk-lcore-mask="3", dpdk-socket-mem="512,512", pmd-cpu-mask="1e"}
Copy to Clipboard Copied! Toggle word wrap Toggle overflow Deploy instances with the following flavor (1 vCPU and 512 MB or memory):
Copy to Clipboard Copied! Toggle word wrap Toggle overflow The new instance will boot and will use memory from NUMA 1:
nova list | grep d98772d1-119e-48fa-b1d9-8a68411cba0b
[stack@undercloud-4 ~]$ nova list | grep d98772d1-119e-48fa-b1d9-8a68411cba0b
| d98772d1-119e-48fa-b1d9-8a68411cba0b | cirros-test0 | ACTIVE | -          | Running     |
provider1=2000:10::f816:3eff:fe8d:a6ef, 10.0.0.102 |
Copy to Clipboard Copied! Toggle word wrap Toggle overflow Copy to Clipboard Copied! Toggle word wrap Toggle overflow nova boot --nic net-id=$NETID --image cirros --flavor m1.tiny --key-name id_rsa cirros-test0
nova boot --nic net-id=$NETID --image cirros --flavor m1.tiny --key-name id_rsa cirros-test0Copy to Clipboard Copied! Toggle word wrap Toggle overflow This instance fails to boot:
Copy to Clipboard Copied! Toggle word wrap Toggle overflow From the compute node, check that free huge pages on NUMA Node 0 are exhausted. There is, however, enough space on NUMA node 1:
Copy to Clipboard Copied! Toggle word wrap Toggle overflow The information in
/var/log/nova/nova-compute.logreveals that the instance CPU is pinned to NUMA node 0:Copy to Clipboard Copied! Toggle word wrap Toggle overflow
In the numatune section, nodeset="0" indicates that memory will be claimed from NUMA 0.
11.3. Solution
Administrators can input the amount of huge page memory not used by instances into nova.
grep reserved_huge /etc/nova/nova.conf -B1
[root@overcloud-compute-1 virt]# grep reserved_huge /etc/nova/nova.conf  -B1
[DEFAULT]
reserved_huge_pages=node:0,size:2048,count:512
reserved_huge_pages=node:1,size:2048,count:512The size parameter is the huge page size in KiB. The count parameter is the number of huge pages that are used by OVS per NUMA node. For example, for 4096 of socket memory used by Open vSwitch, use the following values:
[DEFAULT]
reserved_huge_pages=node:0,size:1GB,count:4
reserved_huge_pages=node:1,size:1GB,count:4
[DEFAULT]
reserved_huge_pages=node:0,size:1GB,count:4
reserved_huge_pages=node:1,size:1GB,count:4See How to set reserved_huge_pages in /etc/nova/nova.conf in Red Hat OpenStack Platform 10 for details about how to implement this with OpenStack director.
This option is undocumented in Red Hat OpenStack Platform 10: OpenStack nova.conf - configuration options
In Red Hat OpenStack Platform 11, this is documented here: OpenStack nova.conf - configuration options
With debug enabled in /etc/nova/nova.conf, you should see the following information in the logs after a restart of openstack-nova-compute:
Chapter 12. Troubleshoot OVS DPDK PMD CPU Usage with perf and Collect and Send the Troubleshooting Data
- Prerequisites Use the steps in this section to install troubleshooting tools.
Install
perfon the compute node:yum install perf -y
yum install perf -yCopy to Clipboard Copied! Toggle word wrap Toggle overflow Install Open vSwitch debug RPMs:
subscription-manager repos --enable=rhel-7-server-openstack-10-debug-rpms
subscription-manager repos --enable=rhel-7-server-openstack-10-debug-rpmsCopy to Clipboard Copied! Toggle word wrap Toggle overflow Install sysstat (needed for the
pidstatcommand):yum install sysstat -y
yum install sysstat -yCopy to Clipboard Copied! Toggle word wrap Toggle overflow
12.1. Diagnosis
Use the steps in this section to troubleshoot and collect data.
12.1.1. PMD Threads
Determine the location of PMD threads:
IFS=$'\n' ; for l in $(ps -T -p `pidof ovs-vswitchd` | grep pmd);do PID=`echo $l | awk '{print $2}'`; PMD=`echo $l | awk
'{print $NF}'` ; PCPU=`taskset -c -p $PID | awk '{print $NF}'` ; echo "$PMD with PID $PID in on pCPU $PCPU"; done
IFS=$'\n' ; for l in $(ps -T -p `pidof ovs-vswitchd` | grep pmd);do PID=`echo $l | awk '{print $2}'`; PMD=`echo $l | awk '{print $NF}'` ; PCPU=`taskset -c -p $PID | awk '{print $NF}'` ; echo "$PMD with PID $PID in on pCPU $PCPU"; doneCopy to Clipboard Copied! Toggle word wrap Toggle overflow For example:
Copy to Clipboard Copied! Toggle word wrap Toggle overflow While reproducing the issue, run perf record and perf report and save the output.
Create the script
gather_perf_data_a.sh:Copy to Clipboard Copied! Toggle word wrap Toggle overflow Run the script:
chmod +x gather_perf_data_a.sh
./gather_perf_data_a.sh
chmod +x gather_perf_data_a.sh
./gather_perf_data_a.sh
Copy to Clipboard Copied! Toggle word wrap Toggle overflow
The report can be read using perf report -i ${archive_name}. If this is for a case that was opened with Red Hat support, attach the resulting tar archive to the case.
12.1.2. Additional Data
Create the script
gather_perf_data_b.shto collect additional data:Copy to Clipboard Copied! Toggle word wrap Toggle overflow Execute the script:
chmod +x gather_perf_data_b.sh
./gather_perf_data_b.sh
chmod +x gather_perf_data_b.sh
./gather_perf_data_b.sh
Copy to Clipboard Copied! Toggle word wrap Toggle overflow NoteMake sure that there is sufficient disk space. The 'perf.data' file can take up several Gigabytes of disk space.
If this is for a Red Hat support ticket, attach the resulting tar archive to the case.
12.1.3. Open vSwitch Logs
Provide all Open vSwitch (OVS) logs. Ensure that
/varhas sufficient disk space. Usedf -hto determine free disk space on /var anddu -sh /var/log/openvswitchto determine the total size of OVS logs.tar -cvzf /var/openvswitch_`hostname`_`date +"%F_%H%M%S"`.tar.gz /var/log/openvswitch
tar -cvzf /var/openvswitch_`hostname`_`date +"%F_%H%M%S"`.tar.gz /var/log/openvswitchCopy to Clipboard Copied! Toggle word wrap Toggle overflow -
Attach the resulting file, for example,
/var/openvswitch_overcloud-compute-0_2018-02-27_153713.tar.gz, to the support case for analysis. Generate and provide an sosreport. Ensure that
/varhas sufficient disk space. Usedf -hto determine free disk space on/var.sosreport --batch --all-logs
sosreport --batch --all-logsCopy to Clipboard Copied! Toggle word wrap Toggle overflow
Chapter 13. Using virsh emulatorpin in virtual environments with NFV
Use this procedure to determine the impact of using virsh emulatorpin in Red Hat OpenStack Platform with NFV.
13.1. Symptom
You experience packet loss in Red Hat OpenStack Platform {vernum} NFV environment, and have not configured emulator thread pinning.
In Red Hat OpenStack Platform 10, customers need a support exception to pin emulator threads. However, pinning emulator threads is strongly recommended by Red Hat in almost all NFV cases. You can significantly increase performance by changing the default emulator thread configuration. Open a ticket with Red Hat support and request a support exception if needed.
13.2. Solution
Use this section to investigate and configure emulator thread pinning.
13.2.1. qemu-kvm Emulator Threads
Emulator threads handle interrupt requests and non-blocking processes for virtual machine hardware emulation. Threads not running vCPUs are qemu-kvm emulator threads. See the following example.
Due to the Linux CFS (completely fair scheduler), emulator threads normally move periodically from one pCPU to another, within the defined in libvirt’s emulator pin set.
In NFV contexts, you might experience issues if you configure emulator threads when using the isolcpus parameter, because this kernel configuration disables the CFS scheduling on those CPUs. If you are not using the isolcpus parameter, you can experience packet loss when the emulator threads interrupt CPUs that are processing packets.
Examples of emulator threads include:
- qemu-kvm threads
- vnc_worker threads
- vhost-<qemu-kvm PID> kernel threads (When virtio-net is used (kernel networking on the hypervisor)
13.2.2. Default Behavior for Emulator Thread Pinning
By default, nova will configure an emulator thread pin set which spans the pCPUs assigned to all vCPUs. If you are not using the isolcpus parameter, then emulator threads can be scheduled on any pCPU, and will periodically move from one pCPU to another.
Therefore any of these CPUs can be preempted by qemu’s emulator threads, risking packet drops.
13.2.3. The Current Implementation for Emulator Thread Pinning in OpenStack nova (OpenStack Platform 10)
In Red Hat OpenStack Platforms 10, there is no officially supported way to pin emulator threads. Temporarily, you can move emulator threads to a set of pCPUs by using virsh emulatorpin (…) --live, as shown in the following example.
to pin emulator threads of instance instance-0000001d to CPU 34
to pin emulator threads of instance instance-0000001d to CPUs 32,34
# to pin emulator threads of instance instance-0000001d to CPU 34
virsh emulatorpin instance-0000001d 34 -live
# to pin emulator threads of instance instance-0000001d to CPUs 32,34
virsh emulatorpin instance-0000001d 32,34 --liveThese changes only last for the runtime of the instance. Permanent modifications require an external mechanism, such as a cron job, bash script or Ansible task. This has to be the subject of a support exception.
13.2.4. About the Impact of isolcpus on Emulator Thread Scheduling
When isolcpus is used, CFS scheduler is disabled and all emulator threads will run on the first available, lowest indexed pCPU. As a consequence, without intervention or further configuration, one vCPU of the instance runs a high risk for resource contention with the emulator threads.
Further details can be found at Kernel.org Bugzilla – Bug 116701.
Use the following algorithm to determine which vCPU the emulator threads are using:
PCPU=MIN([EMULATORPINSET])
VCPU=REVERSE_CPUSET(PCPU)

REVERSE_CPUSET :=  SELECT pcpu from `virsh dumpxml <instance name> | grep "cpuset=$PCPU"`
PCPU=MIN([EMULATORPINSET])
VCPU=REVERSE_CPUSET(PCPU)

REVERSE_CPUSET := SELECT pcpu from `virsh dumpxml <instance name> | grep "cpuset=$PCPU"`For example, in this instance, all emulator threads and children inherit affinity 1-3 from the default emulator pin set:
In combination with isolcpus, all emulator threads and the vhost-* threads execute on pCPU1 and are never rescheduled:
13.2.5. Optimal Location of Emulator Threads
This section provides descriptions for placing emulator threads on the following networks:
- DPDK networking within the instance and netdev datapath in Open vSwitch
- DPDK networking within the instance, system datapath in Open vSwitch and kernel space networking on the hypervisor
- Kernel networking within the instance and netdev datapath in Open vSwitch
13.2.5.1. Optimal Placement of Emulator Threads with DPDK Networking Within the Instance and netdev datapath in Open vSwitch
If DPDK runs within the instance, packet processing is done entirely in the user space. Do not schedule PMDs to run on vCPU0, as this should remain for the OS and interrupt handling. Because PMD CPUs within the instance run an active loop and need 100% of the CPU, they should not be preempted. Packet loss can occur if one of these vCPUs is preempted. Thus, the emulatorpin cpuset needs to be configured in such a way that it does not overlap with the physical CPUs that handle the virtual CPUs numbered 1 and above.
With DPDK networking within the instance, the optimal location for emulator threads is either the pCPU that is handling vCPU 0 or a dedicated physical CPU that is not handling any virtual CPUs at all.
If OVS-DPDK is used on the hypervisor and DPDK within the instance, place the emulator thread on vCPU 0.
13.2.5.2. Optimal Placement of Emulator Threads with DPDK Networking Within the Instance and System datapath in Open vSwitch
If kernel space networking is used on the hypervisor, then packet processing on the hypervisor is executed within the kernel.
With DPDK networking within the instance, the optimal location for emulator threads is either the pCPU that is handling vCPU 0, or a dedicated physical CPU that is not handling any virtual CPUs.
Note that in this scenario, packet processing for the vNIC queues is executed within vhost-<qemu-kvm PID> kernel threads of the hypervisor. Under high traffic, these kernel threads can generate a significant CPU load. The optimal location of the emulator threads needs to be determined on a case-by-case basis.
ps aux | grep vhost-
[root@overcloud-compute-0 ~]# ps aux | grep vhost-
root      364948  0.0  0.0      0     0 ?        S    20:32   0:00 [vhost-364936]
root      364949  0.0  0.0      0     0 ?        S    20:32   0:00 [vhost-364936]
root 364950 0.0 0.0 0 0 ? S 20:32 0:00 [vhost-364936]13.2.5.3. Optimal Placement of Emulator Threads with Kernel Networking within the Instance and netdev datapath in Open vSwitch
With kernel networking within the instance, there are two options:
- Optimize the interrupt distribution, for example, softirqs within the instance. In such a case, you do not have to allocate an additional pCPU for emulator threads and can assign the emulator threads to a pCPU that is not handling any network interrupts.
- Use a dedicated pCPU on the same NUMA node for emulator threads.
Due to the complexity of the first option, the second option is recommended.
13.3. Diagnosis
13.3.1. The Demonstration Environment
The demonstration environment runs one instance: instance-0000001d. Its associated qemu-kvm thread has the following PID:
pidof qemu-kvm
[root@overcloud-compute-0 ~]# pidof qemu-kvm
7351713.3.2. How Emulatorpin works
By default, a Red Hat OpenStack Platform deployment uses the following settings:
This leads to an unpredictable allocation of the emulator threads, such as qemu-kvm, vnc_worker, and so on:
The emulator threads can be moved by using virsh emulatorpin:
virsh emulatorpin instance-0000001d 34
virsh emulatorpin instance-0000001d 34Note that the affinity for all non-CPU threads changes.
Note the number of switches in the historic data in /proc/sched_debug. In the following example, PID 73517 already moved to cpu#34. The other emulator workers did not run since the last output, and therefore still show on cpu#10:
Note how thread 73517 moves to cpu#34. If you now interact with a VNC session, you can see that /proc/sched_debug shows the vnc_worker threads on cpu#34 as well.