Service Telemetry Framework 1.5
Installing and deploying Service Telemetry Framework 1.5
Abstract
Making open source more inclusive
Red Hat is committed to replacing problematic language in our code, documentation, and web properties. We are beginning with these four terms: master, slave, blacklist, and whitelist. Because of the enormity of this endeavor, these changes will be implemented gradually over several upcoming releases. For more details, see our CTO Chris Wright’s message.
Chapter 1. Introduction to Service Telemetry Framework 1.5
Service Telemetry Framework (STF) collects monitoring data from Red Hat OpenStack Platform (RHOSP) or third-party nodes. You can use STF to perform the following tasks:
- Store or archive the monitoring data for historical information.
- View the monitoring data graphically on the dashboard.
- Use the monitoring data to trigger alerts or warnings.
The monitoring data can be either metric or event:
- Metric
- A numeric measurement of an application or system.
- Event
- Irregular and discrete occurrences that happen in a system.
The components of STF use a message bus for data transport. Other modular components that receive and store data are deployed as containers on Red Hat OpenShift Container Platform.
STF is compatible with Red Hat OpenShift Container Platform version 4.10 through 4.12.
Additional resources
1.1. Support for Service Telemetry Framework
Red Hat supports the core Operators and workloads, including AMQ Interconnect, Service Telemetry Operator, and Smart Gateway Operator. Red Hat does not support the community Operators or workload components, such as Elasticsearch, Prometheus, Alertmanager, Grafana, and their Operators.
You can only deploy STF in a fully connected network environment. You cannot deploy STF in Red Hat OpenShift Container Platform-disconnected environments or network proxy environments.
For more information about STF life cycle and support status, see the Service Telemetry Framework Supported Version Matrix.
1.2. Service Telemetry Framework architecture
Service Telemetry Framework (STF) uses a client-server architecture, in which Red Hat OpenStack Platform (RHOSP) is the client and Red Hat OpenShift Container Platform is the server.
STF consists of the following components:
Data collection
- collectd: Collects infrastructure metrics and events.
- Ceilometer: Collects RHOSP metrics and events.
Transport
- AMQ Interconnect: An AMQP 1.x compatible messaging bus that provides fast and reliable data transport to transfer the metrics to STF for storage.
- Smart Gateway: A Golang application that takes metrics and events from the AMQP 1.x bus to deliver to Elasticsearch or Prometheus.
Data storage
- Prometheus: Time-series data storage that stores STF metrics received from the Smart Gateway.
- Elasticsearch: Events data storage that stores STF events received from the Smart Gateway.
Observation
- Alertmanager: An alerting tool that uses Prometheus alert rules to manage alerts.
- Grafana: A visualization and analytics application that you can use to query, visualize, and explore data.
The following table describes the application of the client and server components:
| Component | Client | Server |
|---|---|---|
| An AMQP 1.x compatible messaging bus | yes | yes |
| Smart Gateway | no | yes |
| Prometheus | no | yes |
| Elasticsearch | no | yes |
| collectd | yes | no |
| Ceilometer | yes | no |
To ensure that the monitoring platform can report operational problems with your cloud, do not install STF on the same infrastructure that you are monitoring.
Figure 1.1. Service Telemetry Framework architecture overview
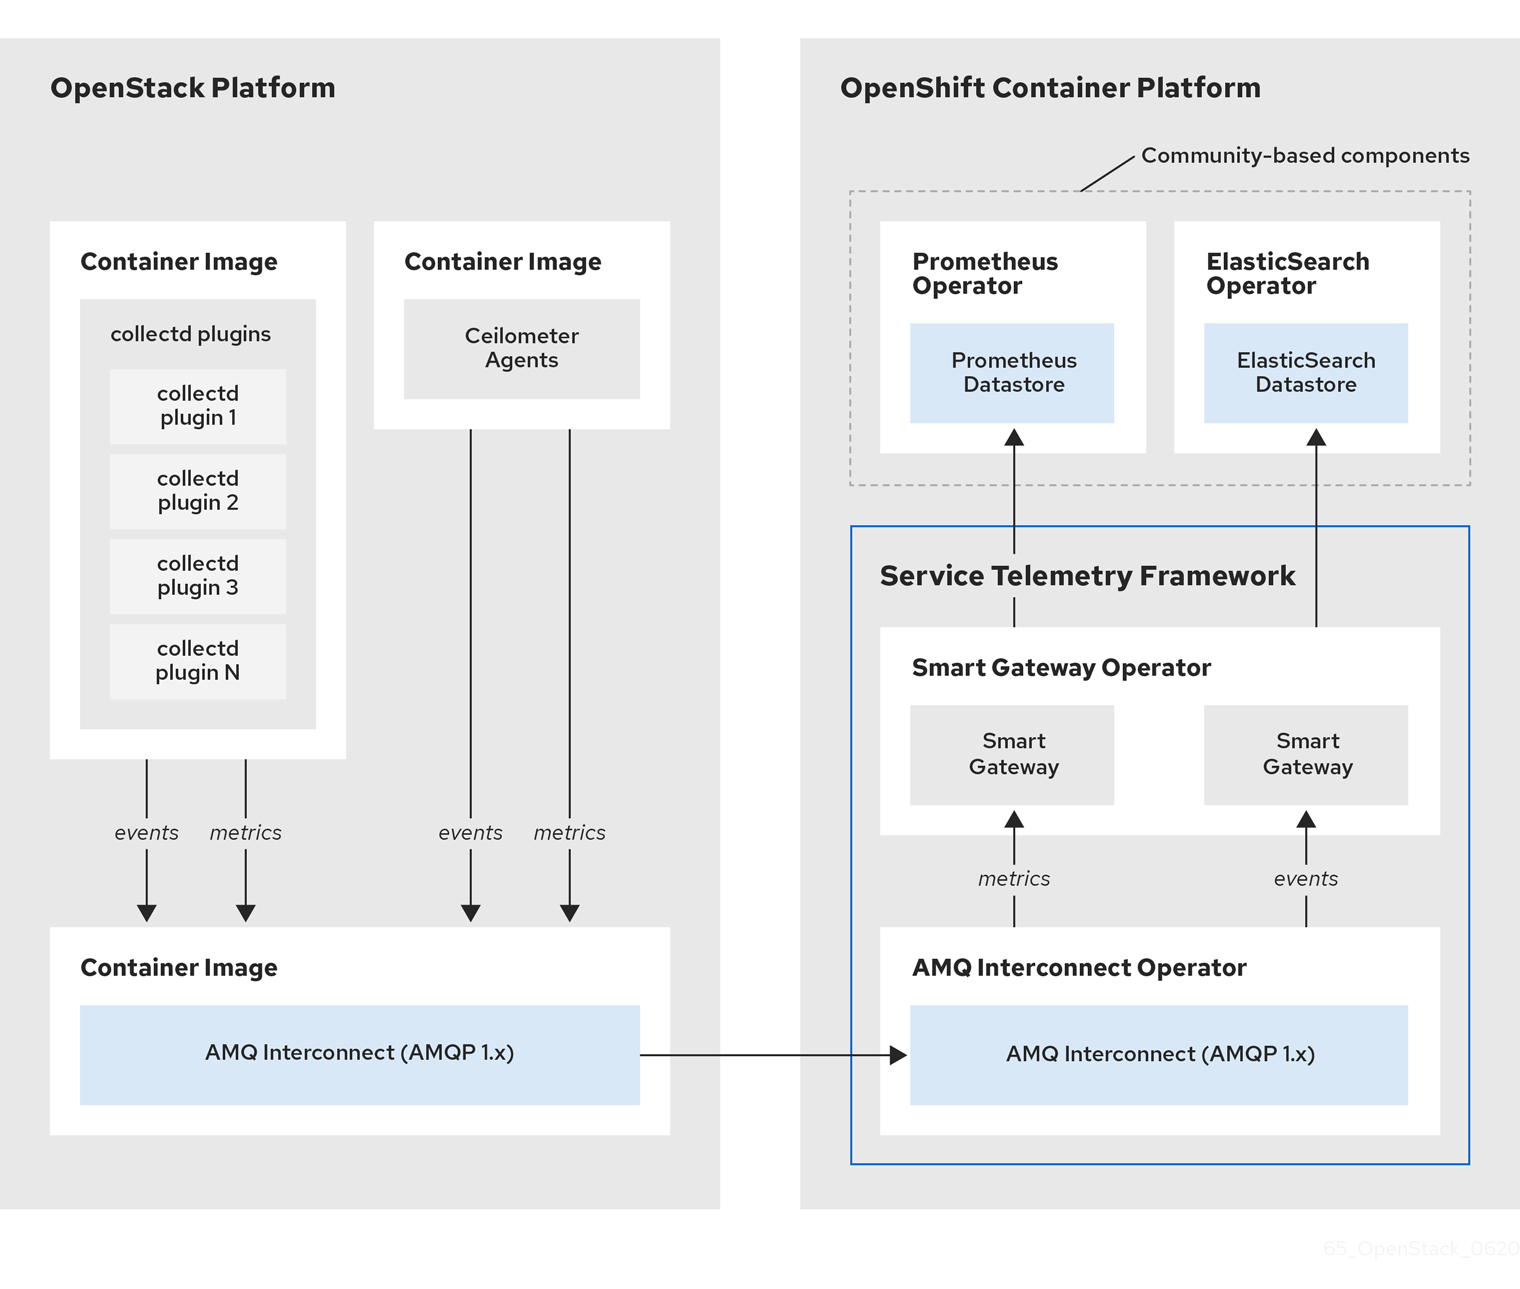
For client side metrics, collectd provides infrastructure metrics without project data, and Ceilometer provides RHOSP platform data based on projects or user workload. Both Ceilometer and collectd deliver data to Prometheus by using the AMQ Interconnect transport, delivering the data through the message bus. On the server side, a Golang application called the Smart Gateway takes the data stream from the bus and exposes it as a local scrape endpoint for Prometheus.
If you plan to collect and store events, collectd and Ceilometer deliver event data to the server side by using the AMQ Interconnect transport. Another Smart Gateway writes the data to the Elasticsearch datastore.
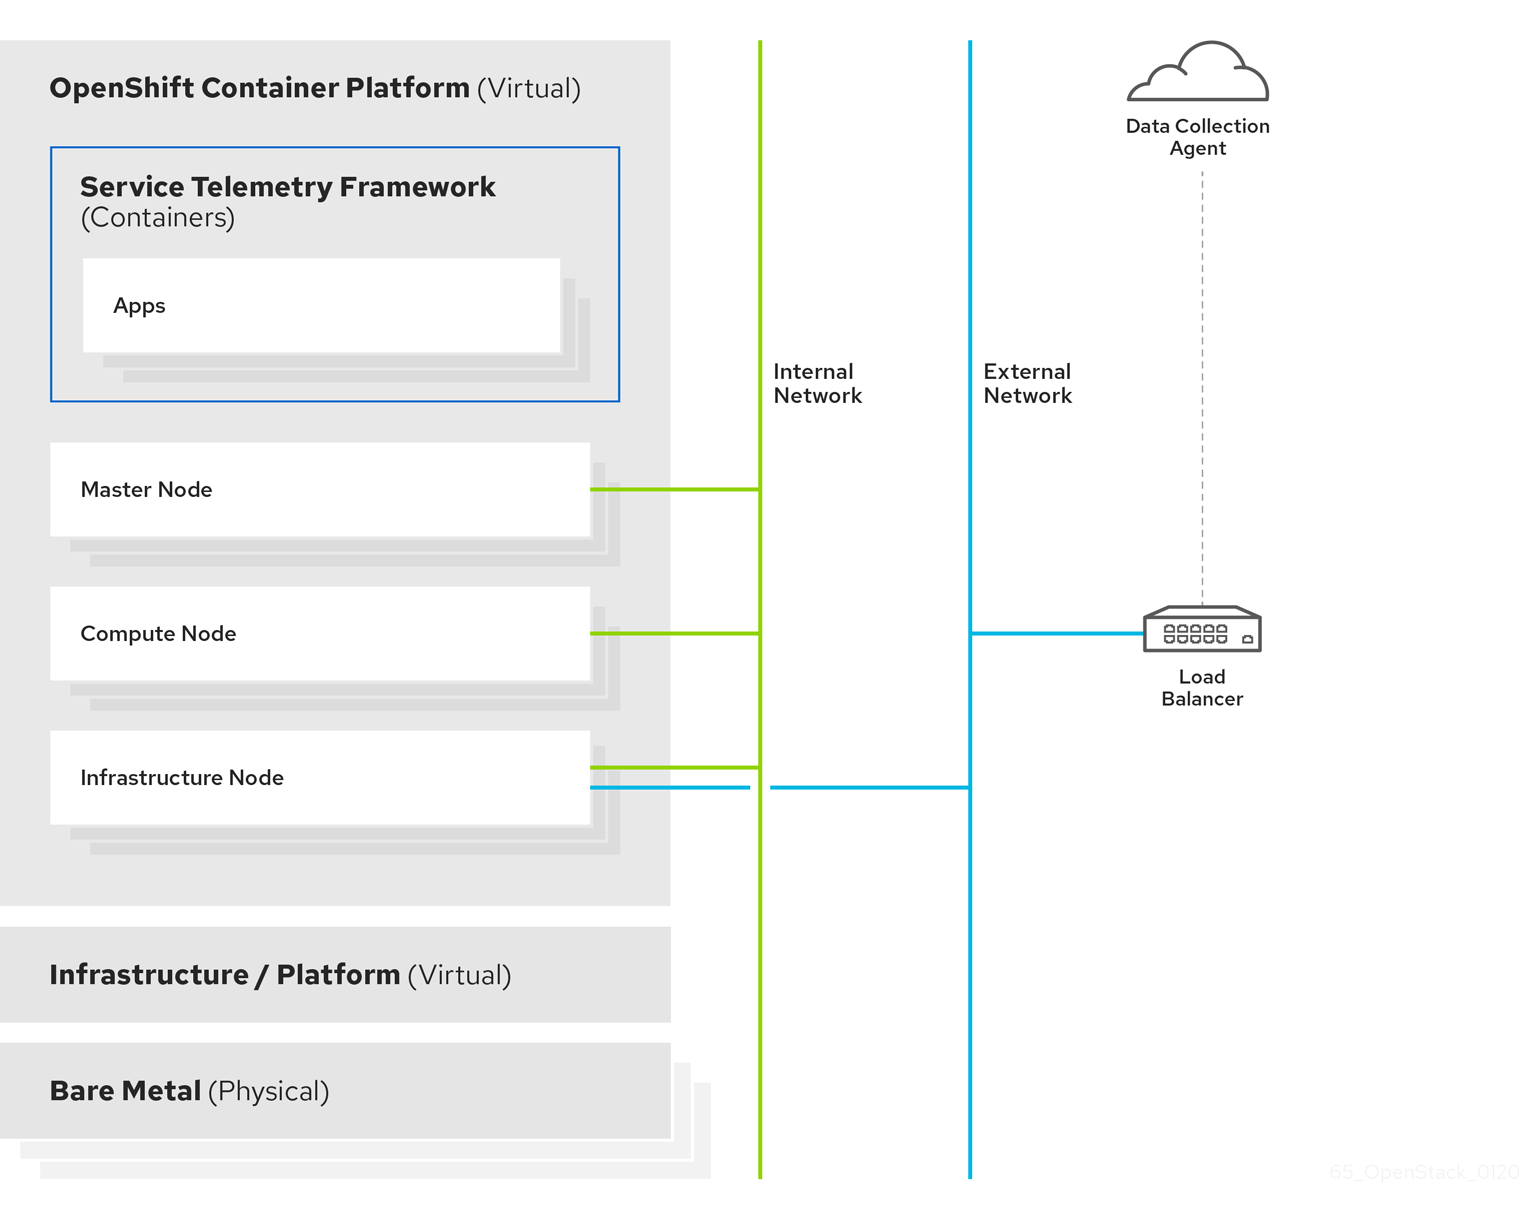
Server-side STF monitoring infrastructure consists of the following layers:
- Service Telemetry Framework 1.5
- Red Hat OpenShift Container Platform 4.10 through 4.12
- Infrastructure platform
Figure 1.2. Server-side STF monitoring infrastructure
1.3. Installation size of Red Hat OpenShift Container Platform
The size of your Red Hat OpenShift Container Platform installation depends on the following factors:
- The infrastructure that you select.
- The number of nodes that you want to monitor.
- The number of metrics that you want to collect.
- The resolution of metrics.
- The length of time that you want to store the data.
Installation of Service Telemetry Framework (STF) depends on an existing Red Hat OpenShift Container Platform environment.
For more information about minimum resources requirements when you install Red Hat OpenShift Container Platform on baremetal, see Minimum resource requirements in the Installing a cluster on bare metal guide. For installation requirements of the various public and private cloud platforms that you can install, see the corresponding installation documentation for your cloud platform of choice.
Chapter 2. Preparing your Red Hat OpenShift Container Platform environment for Service Telemetry Framework
To prepare your Red Hat OpenShift Container Platform environment for Service Telemetry Framework (STF), you must plan for persistent storage, adequate resources, event storage, and network considerations:
- Ensure that you have persistent storage available in your Red Hat OpenShift Container Platform cluster for a production-grade deployment. For more information, see Section 2.2, “Persistent volumes”.
- Ensure that enough resources are available to run the Operators and the application containers. For more information, see Section 2.3, “Resource allocation”.
- Ensure that you have a fully connected network environment. For more information, see Section 2.4, “Network considerations for Service Telemetry Framework”.
2.1. Observability Strategy in Service Telemetry Framework
Service Telemetry Framework (STF) does not include storage backends and alerting tools. STF uses community operators to deploy Prometheus, Alertmanager, Grafana, and Elasticsearch. STF makes requests to these community operators to create instances of each application configured to work with STF.
Instead of having Service Telemetry Operator create custom resource requests, you can use your own deployments of these applications or other compatible applications, and scrape the metrics Smart Gateways for delivery to your own Prometheus-compatible system for telemetry storage. If you set the observabilityStrategy to none, then storage backends will not be deployed so persistent storage will not be required by STF.
2.2. Persistent volumes
Service Telemetry Framework (STF) uses persistent storage in Red Hat OpenShift Container Platform to request persistent volumes so that Prometheus and Elasticsearch can store metrics and events.
When you enable persistent storage through the Service Telemetry Operator, the Persistent Volume Claims (PVC) requested in an STF deployment results in an access mode of RWO (ReadWriteOnce). If your environment contains pre-provisioned persistent volumes, ensure that volumes of RWO are available in the Red Hat OpenShift Container Platform default configured storageClass.
Additional resources
- For more information about configuring persistent storage for Red Hat OpenShift Container Platform, see Understanding persistent storage.
- For more information about recommended configurable storage technology in Red Hat OpenShift Container Platform, see Recommended configurable storage technology.
- For more information about configuring persistent storage for Prometheus in STF, see the section called “Configuring persistent storage for Prometheus”.
- For more information about configuring persistent storage for Elasticsearch in STF, see the section called “Configuring persistent storage for Elasticsearch”.
2.3. Resource allocation
To enable the scheduling of pods within the Red Hat OpenShift Container Platform infrastructure, you need resources for the components that are running. If you do not allocate enough resources, pods remain in a Pending state because they cannot be scheduled.
The amount of resources that you require to run Service Telemetry Framework (STF) depends on your environment and the number of nodes and clouds that you want to monitor.
Additional resources
- For recommendations about sizing for metrics collection, see Service Telemetry Framework Performance and Scaling.
- For information about sizing requirements for Elasticsearch, see https://www.elastic.co/guide/en/cloud-on-k8s/current/k8s-managing-compute-resources.html.
2.4. Network considerations for Service Telemetry Framework
You can only deploy Service Telemetry Framework (STF) in a fully connected network environment. You cannot deploy STF in Red Hat OpenShift Container Platform-disconnected environments or network proxy environments.
Chapter 3. Installing the core components of Service Telemetry Framework
You can use Operators to load the Service Telemetry Framework (STF) components and objects. Operators manage each of the following STF core and community components:
- cert-manager
- AMQ Interconnect
- Smart Gateway
- Prometheus and AlertManager
- Elasticsearch
- Grafana
Prerequisites
- An Red Hat OpenShift Container Platform version inclusive of 4.10 through 4.12 is running.
- You have prepared your Red Hat OpenShift Container Platform environment and ensured that there is persistent storage and enough resources to run the STF components on top of the Red Hat OpenShift Container Platform environment. For more information, see Service Telemetry Framework Performance and Scaling.
- Your environment is fully connected. STF does not work in a Red Hat OpenShift Container Platform-disconnected environments or network proxy environments.
STF is compatible with Red Hat OpenShift Container Platform version 4.10 through 4.12.
Additional resources
- For more information about Operators, see the Understanding Operators guide.
- For more information about Operator catalogs, see Red Hat-provided Operator catalogs.
3.1. Deploying Service Telemetry Framework to the Red Hat OpenShift Container Platform environment
Deploy Service Telemetry Framework (STF) to collect, store, and monitor events:
Procedure
Create a namespace to contain the STF components, for example,
service-telemetry:oc new-project service-telemetry
$ oc new-project service-telemetryCopy to Clipboard Copied! Toggle word wrap Toggle overflow Create an OperatorGroup in the namespace so that you can schedule the Operator pods:
Copy to Clipboard Copied! Toggle word wrap Toggle overflow For more information, see OperatorGroups.
Create a namespace for the cert-manager Operator:
Copy to Clipboard Copied! Toggle word wrap Toggle overflow Create an OperatorGroup for the cert-manager Operator:
Copy to Clipboard Copied! Toggle word wrap Toggle overflow Subscribe to the cert-manager Operator by using the redhat-operators CatalogSource:
Copy to Clipboard Copied! Toggle word wrap Toggle overflow Validate your ClusterServiceVersion. Ensure that cert-manager Operator displays a phase of
Succeeded:oc get csv --namespace openshift-cert-manager-operator --selector=operators.coreos.com/openshift-cert-manager-operator.openshift-cert-manager-operator NAME DISPLAY VERSION REPLACES PHASE openshift-cert-manager.v1.7.1 cert-manager Operator for Red Hat OpenShift 1.7.1-1 Succeeded
$ oc get csv --namespace openshift-cert-manager-operator --selector=operators.coreos.com/openshift-cert-manager-operator.openshift-cert-manager-operator

NAME                            DISPLAY                                       VERSION   REPLACES   PHASE
openshift-cert-manager.v1.7.1   cert-manager Operator for Red Hat OpenShift   1.7.1-1              Succeeded
Copy to Clipboard Copied! Toggle word wrap Toggle overflow Subscribe to the AMQ Interconnect Operator by using the redhat-operators CatalogSource:
Copy to Clipboard Copied! Toggle word wrap Toggle overflow Validate your ClusterServiceVersion. Ensure that amq7-interconnect-operator.v1.10.x displays a phase of
Succeeded:oc get csv --selector=operators.coreos.com/amq7-interconnect-operator.service-telemetry NAME DISPLAY VERSION REPLACES PHASE amq7-interconnect-operator.v1.10.15 Red Hat Integration - AMQ Interconnect 1.10.15 amq7-interconnect-operator.v1.10.4 Succeeded
$ oc get csv --selector=operators.coreos.com/amq7-interconnect-operator.service-telemetry

NAME                                  DISPLAY                                  VERSION   REPLACES                             PHASE
amq7-interconnect-operator.v1.10.15   Red Hat Integration - AMQ Interconnect   1.10.15   amq7-interconnect-operator.v1.10.4   Succeeded
Copy to Clipboard Copied! Toggle word wrap Toggle overflow To store metrics in Prometheus, you must enable the Prometheus Operator by using the community-operators CatalogSource:
WarningCommunity Operators are Operators which have not been vetted or verified by Red Hat. Community Operators should be used with caution because their stability is unknown. Red Hat provides no support for community Operators.
Learn more about Red Hat’s third party software support policy
Copy to Clipboard Copied! Toggle word wrap Toggle overflow Verify that the ClusterServiceVersion for Prometheus
Succeeded:oc get csv --selector=operators.coreos.com/prometheus.service-telemetry NAME DISPLAY VERSION REPLACES PHASE prometheusoperator.0.56.3 Prometheus Operator 0.56.3 prometheusoperator.0.47.0 Succeeded
$ oc get csv --selector=operators.coreos.com/prometheus.service-telemetry

NAME                        DISPLAY               VERSION   REPLACES                    PHASE
prometheusoperator.0.56.3   Prometheus Operator   0.56.3    prometheusoperator.0.47.0   Succeeded
Copy to Clipboard Copied! Toggle word wrap Toggle overflow To store events in Elasticsearch, you must enable the Elastic Cloud on Kubernetes (ECK) Operator by using the certified-operators CatalogSource:
WarningCertified Operators are Operators from leading independent software vendors (ISVs). Red Hat partners with ISVs to package and ship, but not support, the certified Operators. Supported is provided by the ISV.
Learn more about Red Hat’s third party software support policy
Copy to Clipboard Copied! Toggle word wrap Toggle overflow Verify that the ClusterServiceVersion for Elastic Cloud on Kubernetes
Succeeded:oc get csv --selector=operators.coreos.com/elasticsearch-eck-operator-certified.service-telemetry NAME DISPLAY VERSION REPLACES PHASE elasticsearch-eck-operator-certified.v2.8.0 Elasticsearch (ECK) Operator 2.8.0 elasticsearch-eck-operator-certified.v2.7.0 Succeeded
$ oc get csv --selector=operators.coreos.com/elasticsearch-eck-operator-certified.service-telemetry

NAME                                          DISPLAY                        VERSION   REPLACES                                      PHASE
elasticsearch-eck-operator-certified.v2.8.0   Elasticsearch (ECK) Operator   2.8.0     elasticsearch-eck-operator-certified.v2.7.0   Succeeded
Copy to Clipboard Copied! Toggle word wrap Toggle overflow Create the Service Telemetry Operator subscription to manage the STF instances:
Copy to Clipboard Copied! Toggle word wrap Toggle overflow Validate the Service Telemetry Operator and the dependent operators have their phase as Succeeded:
Copy to Clipboard Copied! Toggle word wrap Toggle overflow
3.2. Creating a ServiceTelemetry object in Red Hat OpenShift Container Platform
Create a ServiceTelemetry object in Red Hat OpenShift Container Platform to result in the Service Telemetry Operator creating the supporting components for a Service Telemetry Framework (STF) deployment. For more information, see Section 3.2.1, “Primary parameters of the ServiceTelemetry object”.
Procedure
To create a
ServiceTelemetryobject that results in an STF deployment that uses the default values, create aServiceTelemetryobject with an emptyspecparameter:Copy to Clipboard Copied! Toggle word wrap Toggle overflow Creating a
ServiceTelemetryobject with an emptyspecparameter results in an STF deployment with the following default settings:Copy to Clipboard Copied! Toggle word wrap Toggle overflow To override these defaults, add the configuration to the
specparameter.View the STF deployment logs in the Service Telemetry Operator:
Copy to Clipboard Copied! Toggle word wrap Toggle overflow
Verification
To determine that all workloads are operating correctly, view the pods and the status of each pod.
NoteIf you set the
backends.events.elasticsearch.enabledparameter totrue, the notification Smart Gateways reportErrorandCrashLoopBackOfferror messages for a period of time before Elasticsearch starts.Copy to Clipboard Copied! Toggle word wrap Toggle overflow
3.2.1. Primary parameters of the ServiceTelemetry object
The ServiceTelemetry object comprises the following primary configuration parameters:
-
alerting -
backends -
clouds -
graphing -
highAvailability -
transports
You can configure each of these configuration parameters to provide different features in an STF deployment.
The backends parameter
Use the backends parameter to control which storage back ends are available for storage of metrics and events, and to control the enablement of Smart Gateways that the clouds parameter defines. For more information, see the section called “The clouds parameter”.
You can use Prometheus as the metrics storage back end and Elasticsearch as the events storage back end. You can use the Service Telemetry Operator to create other custom resource objects that the Prometheus Operator and Elastic Cloud on Kubernetes Operator watch to create Prometheus and Elasticsearch workloads.
Enabling Prometheus as a storage back end for metrics
To enable Prometheus as a storage back end for metrics, you must configure the ServiceTelemetry object.
Procedure
Edit the
ServiceTelemetryobject:oc edit stf default
$ oc edit stf defaultCopy to Clipboard Copied! Toggle word wrap Toggle overflow Set the value of the backends.metrics.prometheus.enabled parameter to
true:Copy to Clipboard Copied! Toggle word wrap Toggle overflow
Configuring persistent storage for Prometheus
Use the additional parameters that are defined in backends.metrics.prometheus.storage.persistent to configure persistent storage options for Prometheus, such as storage class and volume size.
Use storageClass to define the back end storage class. If you do not set this parameter, the Service Telemetry Operator uses the default storage class for the Red Hat OpenShift Container Platform cluster.
Use the pvcStorageRequest parameter to define the minimum required volume size to satisfy the storage request. If volumes are statically defined, it is possible that a volume size larger than requested is used. By default, Service Telemetry Operator requests a volume size of 20G (20 Gigabytes).
Procedure
List the available storage classes:
oc get storageclasses
NAME                 PROVISIONER                RECLAIMPOLICY   VOLUMEBINDINGMODE      ALLOWVOLUMEEXPANSION   AGE
csi-manila-ceph      manila.csi.openstack.org   Delete          Immediate              false                  20h
standard (default)   kubernetes.io/cinder       Delete          WaitForFirstConsumer   true                   20h
standard-csi         cinder.csi.openstack.org   Delete          WaitForFirstConsumer   true                   20h
$ oc get storageclasses
NAME                 PROVISIONER                RECLAIMPOLICY   VOLUMEBINDINGMODE      ALLOWVOLUMEEXPANSION   AGE
csi-manila-ceph      manila.csi.openstack.org   Delete          Immediate              false                  20h
standard (default)   kubernetes.io/cinder       Delete          WaitForFirstConsumer   true                   20h
standard-csi         cinder.csi.openstack.org   Delete          WaitForFirstConsumer   true                   20h
Copy to Clipboard Copied! Toggle word wrap Toggle overflow Edit the
ServiceTelemetryobject:oc edit stf default
$ oc edit stf defaultCopy to Clipboard Copied! Toggle word wrap Toggle overflow Set the value of the backends.metrics.prometheus.enabled parameter to
trueand the value of backends.metrics.prometheus.storage.strategy topersistent:Copy to Clipboard Copied! Toggle word wrap Toggle overflow
Enabling Elasticsearch as a storage back end for events
To enable Elasticsearch as a storage back end for events, you must configure the ServiceTelemetry object.
Procedure
Edit the
ServiceTelemetryobject:oc edit stf default
$ oc edit stf defaultCopy to Clipboard Copied! Toggle word wrap Toggle overflow Set the value of the backends.events.elasticsearch.enabled parameter to
true:Copy to Clipboard Copied! Toggle word wrap Toggle overflow
Configuring persistent storage for Elasticsearch
Use the additional parameters defined in backends.events.elasticsearch.storage.persistent to configure persistent storage options for Elasticsearch, such as storage class and volume size.
Use storageClass to define the back end storage class. If you do not set this parameter, the Service Telemetry Operator uses the default storage class for the Red Hat OpenShift Container Platform cluster.
Use the pvcStorageRequest parameter to define the minimum required volume size to satisfy the storage request. If volumes are statically defined, it is possible that a volume size larger than requested is used. By default, Service Telemetry Operator requests a volume size of 20Gi (20 Gibibytes).
Procedure
List the available storage classes:
oc get storageclasses
NAME                 PROVISIONER                RECLAIMPOLICY   VOLUMEBINDINGMODE      ALLOWVOLUMEEXPANSION   AGE
csi-manila-ceph      manila.csi.openstack.org   Delete          Immediate              false                  20h
standard (default)   kubernetes.io/cinder       Delete          WaitForFirstConsumer   true                   20h
standard-csi         cinder.csi.openstack.org   Delete          WaitForFirstConsumer   true                   20h
$ oc get storageclasses
NAME                 PROVISIONER                RECLAIMPOLICY   VOLUMEBINDINGMODE      ALLOWVOLUMEEXPANSION   AGE
csi-manila-ceph      manila.csi.openstack.org   Delete          Immediate              false                  20h
standard (default)   kubernetes.io/cinder       Delete          WaitForFirstConsumer   true                   20h
standard-csi         cinder.csi.openstack.org   Delete          WaitForFirstConsumer   true                   20h
Copy to Clipboard Copied! Toggle word wrap Toggle overflow Edit the
ServiceTelemetryobject:oc edit stf default
$ oc edit stf defaultCopy to Clipboard Copied! Toggle word wrap Toggle overflow Set the value of the backends.events.elasticsearch.enabled parameter to
trueand the value of backends.events.elasticsearch.storage.strategy topersistent:Copy to Clipboard Copied! Toggle word wrap Toggle overflow
The clouds parameter
Use the clouds parameter to define which Smart Gateway objects deploy, thereby providing the interface for multiple monitored cloud environments to connect to an instance of STF. If a supporting back end is available, then metrics and events Smart Gateways for the default cloud configuration are created. By default, the Service Telemetry Operator creates Smart Gateways for cloud1.
You can create a list of cloud objects to control which Smart Gateways are created for the defined clouds. Each cloud consists of data types and collectors. Data types are metrics or events. Each data type consists of a list of collectors, the message bus subscription address, and a parameter to enable debugging. Available collectors are collectd, and ceilometer. Ensure that the subscription address for each of these collectors is unique for every cloud, data type, and collector combination.
The default cloud1 configuration is represented by the following ServiceTelemetry object, which provides subscriptions and data storage of metrics and events for collectd, and data collectors for a particular cloud instance:
Each item of the clouds parameter represents a cloud instance. A cloud instance consists of three top-level parameters: name, metrics, and events. The metrics and events parameters represent the corresponding back end for storage of that data type. The collectors parameter specifies a list of objects made up of two required parameters, collectorType and subscriptionAddress, and these represent an instance of the Smart Gateway. The collectorType parameter specifies data collected by either collectd, or Ceilometer. The subscriptionAddress parameter provides the AMQ Interconnect address to which a Smart Gateway subscribes.
You can use the optional Boolean parameter debugEnabled within the collectors parameter to enable additional console debugging in the running Smart Gateway pod.
Additional resources
- For more information about deleting default Smart Gateways, see Section 4.4.3, “Deleting the default Smart Gateways”.
- For more information about how to configure multiple clouds, see Section 4.4, “Configuring multiple clouds”.
The alerting parameter
Use the alerting parameter to control creation of an Alertmanager instance and the configuration of the storage back end. By default, alerting is enabled. For more information, see Section 5.3, “Alerts in Service Telemetry Framework”.
The graphing parameter
Use the graphing parameter to control the creation of a Grafana instance. By default, graphing is disabled. For more information, see Section 5.1, “Dashboards in Service Telemetry Framework”.
The highAvailability parameter
Use the highAvailability parameter to control the instantiation of multiple copies of STF components to reduce recovery time of components that fail or are rescheduled. By default, highAvailability is disabled. For more information, see Section 5.6, “High availability”.
The transports parameter
Use the transports parameter to control the enablement of the message bus for a STF deployment. The only transport currently supported is AMQ Interconnect. By default, the qdr transport is enabled.
3.3. Accessing user interfaces for STF components
In Red Hat OpenShift Container Platform, applications are exposed to the external network through a route. For more information about routes, see Configuring ingress cluster traffic.
In Service Telemetry Framework (STF), HTTPS routes are exposed for each service that has a web-based interface. These routes are protected by Red Hat OpenShift Container Platform RBAC and any user that has a ClusterRoleBinding that enables them to view Red Hat OpenShift Container Platform Namespaces can log in. For more information about RBAC, see Using RBAC to define and apply permissions.
Procedure
- Log in to Red Hat OpenShift Container Platform.
Change to the
service-telemetrynamespace:oc project service-telemetry
$ oc project service-telemetryCopy to Clipboard Copied! Toggle word wrap Toggle overflow List the available web UI routes in the
service-telemetryproject:oc get routes | grep web default-alertmanager-proxy default-alertmanager-proxy-service-telemetry.apps.infra.watch default-alertmanager-proxy web reencrypt/Redirect None default-prometheus-proxy default-prometheus-proxy-service-telemetry.apps.infra.watch default-prometheus-proxy web reencrypt/Redirect None
$ oc get routes | grep web
default-alertmanager-proxy   default-alertmanager-proxy-service-telemetry.apps.infra.watch          default-alertmanager-proxy   web     reencrypt/Redirect   None
default-prometheus-proxy     default-prometheus-proxy-service-telemetry.apps.infra.watch            default-prometheus-proxy     web     reencrypt/Redirect   None
Copy to Clipboard Copied! Toggle word wrap Toggle overflow - In a web browser, navigate to https://<route_address> to access the web interface for the corresponding service.
3.4. Configuring an alternate observability strategy
To configure STF to skip the deployment of storage, visualization, and alerting backends, add observabilityStrategy: none to the ServiceTelemetry spec. In this mode, only AMQ Interconnect routers and metrics Smart Gateways are deployed, and you must configure an external Prometheus-compatible system to collect metrics from the STF Smart Gateways.
Currently, only metrics are supported when you set observabilityStrategy to none. Events Smart Gateways are not deployed.
Procedure
Create a
ServiceTelemetryobject with the propertyobservabilityStrategy: nonein thespecparameter. The manifest shows results in a default deployment of STF that is suitable for receiving telemetry from a single cloud with all metrics collector types.Copy to Clipboard Copied! Toggle word wrap Toggle overflow Delete the left over objects that are managed by community operators
for o in alertmanager/default prometheus/default elasticsearch/elasticsearch grafana/default; do oc delete $o; done
$ for o in alertmanager/default prometheus/default elasticsearch/elasticsearch grafana/default; do oc delete $o; doneCopy to Clipboard Copied! Toggle word wrap Toggle overflow To verify that all workloads are operating correctly, view the pods and the status of each pod:
Copy to Clipboard Copied! Toggle word wrap Toggle overflow
Additional resources
For more information about configuring additional clouds or to change the set of supported collectors, see Section 4.4.2, “Deploying Smart Gateways”
Chapter 4. Configuring Red Hat OpenStack Platform director for Service Telemetry Framework
To collect metrics, events, or both, and to send them to the Service Telemetry Framework (STF) storage domain, you must configure the Red Hat OpenStack Platform (RHOSP) overcloud to enable data collection and transport.
STF can support both single and multiple clouds. The default configuration in RHOSP and STF set up for a single cloud installation.
- For a single RHOSP overcloud deployment with default configuration, see Section 4.1, “Deploying Red Hat OpenStack Platform overcloud for Service Telemetry Framework using director”.
- To plan your RHOSP installation and configuration STF for multiple clouds, see Section 4.4, “Configuring multiple clouds”.
As part of an RHOSP overcloud deployment, you might need to configure additional features in your environment:
- To disable the data collector services, see Section 4.2, “Disabling Red Hat OpenStack Platform services used with Service Telemetry Framework”.
- If you synchronized container images to a local registry, you must create an environment file and include the paths to the container images. For more information, see Section 4.3, “Adding Red Hat OpenStack Platform container images to the undercloud”.
4.1. Deploying Red Hat OpenStack Platform overcloud for Service Telemetry Framework using director
As part of the Red Hat OpenStack Platform (RHOSP) overcloud deployment using director, you must configure the data collectors and the data transport to Service Telemetry Framework (STF).
Procedure
Additional resources
- For more information about deploying an OpenStack cloud using director, see Director Installation and Usage.
4.1.1. Getting CA certificate from Service Telemetry Framework for overcloud configuration
To connect your Red Hat OpenStack Platform (RHOSP) overcloud to Service Telemetry Framework (STF), retrieve the CA certificate of AMQ Interconnect that runs within STF and use the certificate in RHOSP configuration.
Procedure
View a list of available certificates in STF:
oc get secrets
$ oc get secretsCopy to Clipboard Copied! Toggle word wrap Toggle overflow Retrieve and note the content of the
default-interconnect-selfsignedSecret:oc get secret/default-interconnect-selfsigned -o jsonpath='{.data.ca\.crt}' | base64 -d$ oc get secret/default-interconnect-selfsigned -o jsonpath='{.data.ca\.crt}' | base64 -dCopy to Clipboard Copied! Toggle word wrap Toggle overflow
4.1.2. Retrieving the AMQ Interconnect route address
When you configure the Red Hat OpenStack Platform (RHOSP) overcloud for Service Telemetry Framework (STF), you must provide the AMQ Interconnect route address in the STF connection file.
Procedure
- Log in to your Red Hat OpenShift Container Platform environment where STF is hosted.
Change to the
service-telemetryproject:oc project service-telemetry
$ oc project service-telemetryCopy to Clipboard Copied! Toggle word wrap Toggle overflow Retrieve the AMQ Interconnect route address:
oc get routes -ogo-template='{{ range .items }}{{printf "%s\n" .spec.host }}{{ end }}' | grep "\-5671"
default-interconnect-5671-service-telemetry.apps.infra.watch
$ oc get routes -ogo-template='{{ range .items }}{{printf "%s\n" .spec.host }}{{ end }}' | grep "\-5671" default-interconnect-5671-service-telemetry.apps.infra.watchCopy to Clipboard Copied! Toggle word wrap Toggle overflow
4.1.3. Creating the base configuration for STF
To configure the base parameters to provide a compatible data collection and transport for Service Telemetry Framework (STF), you must create a file that defines the default data collection values.
Procedure
-
Log in to the undercloud host as the
stackuser. Create a configuration file called
enable-stf.yamlin the/home/stackdirectory.ImportantSetting
EventPipelinePublishersandPipelinePublishersto empty lists results in no event or metric data passing to RHOSP telemetry components, such as Gnocchi or Panko. If you need to send data to additional pipelines, the Ceilometer polling interval of30seconds, that you specify inExtraConfig, might overwhelm the RHOSP telemetry components. You must increase the interval to a larger value, such as300, which results in less telemetry resolution in STF.enable-stf.yaml
Copy to Clipboard Copied! Toggle word wrap Toggle overflow
4.1.4. Configuring the STF connection for the overcloud
To configure the Service Telemetry Framework (STF) connection, you must create a file that contains the connection configuration of the AMQ Interconnect for the overcloud to the STF deployment. Enable the collection of events and storage of the events in STF and deploy the overcloud. The default configuration is for a single cloud instance with the default message bus topics. For configuration of multiple cloud deployments, see Section 4.4, “Configuring multiple clouds”.
Prerequisites
- Retrieve the CA certificate from the AMQ Interconnect deployed by STF. For more information, see Section 4.1.1, “Getting CA certificate from Service Telemetry Framework for overcloud configuration”.
- Retrieve the AMQ Interconnect route address. For more information, see Section 4.1.2, “Retrieving the AMQ Interconnect route address”.
Procedure
-
Log in to the undercloud host as the
stackuser. -
Create a configuration file called
stf-connectors.yamlin the/home/stackdirectory. In the
stf-connectors.yamlfile, configure theMetricsQdrConnectorsaddress to connect the AMQ Interconnect on the overcloud to the STF deployment. You configure the topic addresses for Ceilometer and collectd in this file to match the defaults in STF. For more information about customizing topics and cloud configuration, see Section 4.4, “Configuring multiple clouds”.stf-connectors.yaml
Copy to Clipboard Copied! Toggle word wrap Toggle overflow -
The
resource_registryconfiguration directly loads the collectd service because you do not include thecollectd-write-qdr.yamlenvironment file for multiple cloud deployments. -
Replace the
hostparameter with the value that you retrieved in Section 4.1.2, “Retrieving the AMQ Interconnect route address”. -
Replace the
caCertFileContentparameter with the contents retrieved in Section 4.1.1, “Getting CA certificate from Service Telemetry Framework for overcloud configuration”. -
Replace the
hostsub-parameter ofMetricsQdrConnectorswith the value that you retrieved in Section 4.1.2, “Retrieving the AMQ Interconnect route address”. -
Set
topicvalue ofCeilometerQdrEventsConfigto define the topic for Ceilometer events. The value is a unique topic idenifier for the cloud such ascloud1-event. -
Set
topicvalue ofCeilometerQdrMetricsConfig.topicto define the topic for Ceilometer metrics. The value is a unique topic identifier for the cloud such ascloud1-metering. -
Set
CollectdAmqpInstancessub-paramter to define the topic for collectd events. The section name is a unique topic identifier for the cloud such ascloud1-notify. -
Set
CollectdAmqpInstancessub-parameter to define the topic for collectd metrics. The section name is a unique topic identifier for the cloud such ascloud1-telemetry.
-
The
When you define the topics for collectd and Ceilometer, the value you provide is transposed into the full topic that the Smart Gateway client uses to listen for messages.
Ceilometer topic values are transposed into the topic address anycast/ceilometer/<TOPIC>.sample and collectd topic values are transposed into the topic address collectd/<TOPIC>.
For an example of a cloud configuration in the ServiceTelemetry object referring to the full topic address, see the section called “The clouds parameter”.
4.1.5. Deploying the overcloud
Deploy or update the overcloud with the required environment files so that data is collected and transmitted to Service Telemetry Framework (STF).
Procedure
-
Log in to the undercloud host as the
stackuser. Source the
stackrcundercloud credentials file:source ~/stackrc
$ source ~/stackrcCopy to Clipboard Copied! Toggle word wrap Toggle overflow Add your data collection and AMQ Interconnect environment files to the stack with your other environment files and deploy the overcloud:
Copy to Clipboard Copied! Toggle word wrap Toggle overflow -
Include the
ceilometer-write-qdr.yamlfile to ensure that Ceilometer telemetry and events are sent to STF. -
Include the
qdr-edge-only.yamlfile to ensure that the message bus is enabled and connected to STF message bus routers. -
Include the
enable-stf.yamlenvironment file to ensure that the defaults are configured correctly. -
Include the
stf-connectors.yamlenvironment file to define the connection to STF.
-
Include the
4.1.6. Validating client-side installation
To validate data collection from the Service Telemetry Framework (STF) storage domain, query the data sources for delivered data. To validate individual nodes in the Red Hat OpenStack Platform (RHOSP) deployment, use SSH to connect to the console.
Some telemetry data is available only when RHOSP has active workloads.
Procedure
- Log in to an overcloud node, for example, controller-0.
Ensure that the
metrics_qdrand collection agent containers are running on the node:sudo docker container inspect --format '{{.State.Status}}' metrics_qdr collectd ceilometer_agent_notification ceilometer_agent_central running running running running$ sudo docker container inspect --format '{{.State.Status}}' metrics_qdr collectd ceilometer_agent_notification ceilometer_agent_central running running running runningCopy to Clipboard Copied! Toggle word wrap Toggle overflow NoteUse this command on compute nodes:
sudo docker container inspect --format '{{.State.Status}}' metrics_qdr collectd ceilometer_agent_compute$ sudo docker container inspect --format '{{.State.Status}}' metrics_qdr collectd ceilometer_agent_computeCopy to Clipboard Copied! Toggle word wrap Toggle overflow Return the internal network address on which AMQ Interconnect is running, for example,
172.17.1.44listening on port5666:Copy to Clipboard Copied! Toggle word wrap Toggle overflow Return a list of connections to the local AMQ Interconnect:
Copy to Clipboard Copied! Toggle word wrap Toggle overflow There are four connections:
- Outbound connection to STF
- Inbound connection from ceilometer
- Inbound connection from collectd
Inbound connection from our
qdstatclientThe outbound STF connection is provided to the
MetricsQdrConnectorshost parameter and is the route for the STF storage domain. The other hosts are internal network addresses of the client connections to this AMQ Interconnect.
To ensure that messages are delivered, list the links, and view the
_edgeaddress in thedelivcolumn for delivery of messages:Copy to Clipboard Copied! Toggle word wrap Toggle overflow To list the addresses from RHOSP nodes to STF, connect to Red Hat OpenShift Container Platform to retrieve the AMQ Interconnect pod name and list the connections. List the available AMQ Interconnect pods:
oc get pods -l application=default-interconnect

NAME                                    READY   STATUS    RESTARTS   AGE
default-interconnect-7458fd4d69-bgzfb   1/1     Running   0          6d21h
$ oc get pods -l application=default-interconnect

NAME                                    READY   STATUS    RESTARTS   AGE
default-interconnect-7458fd4d69-bgzfb   1/1     Running   0          6d21h
Copy to Clipboard Copied! Toggle word wrap Toggle overflow Connect to the pod and list the known connections. In this example, there are three
edgeconnections from the RHOSP nodes with connectionid22, 23, and 24:Copy to Clipboard Copied! Toggle word wrap Toggle overflow To view the number of messages delivered by the network, use each address with the
oc execcommand:Copy to Clipboard Copied! Toggle word wrap Toggle overflow
4.2. Disabling Red Hat OpenStack Platform services used with Service Telemetry Framework
Disable the services used when deploying Red Hat OpenStack Platform (RHOSP) and connecting it to Service Telemetry Framework (STF). There is no removal of logs or generated configuration files as part of the disablement of the services.
Procedure
-
Log in to the undercloud host as the
stackuser. Source the
stackrcundercloud credentials file:source ~/stackrc
$ source ~/stackrcCopy to Clipboard Copied! Toggle word wrap Toggle overflow Create the
disable-stf.yamlenvironment file:Copy to Clipboard Copied! Toggle word wrap Toggle overflow Remove the following files from your RHOSP director deployment:
-
ceilometer-write-qdr.yaml -
qdr-edge-only.yaml -
enable-stf.yaml -
stf-connectors.yaml
-
Update the RHOSP overcloud. Ensure that you use the
disable-stf.yamlfile early in the list of environment files. By addingdisable-stf.yamlearly in the list, other environment files can override the configuration that would disable the service:openstack overcloud deploy --templates \ -e /home/stack/disable-stf.yaml \ -e [your environment files]
(undercloud)$ openstack overcloud deploy --templates \
-e /home/stack/disable-stf.yaml \
-e [your environment files]
Copy to Clipboard Copied! Toggle word wrap Toggle overflow
4.3. Adding Red Hat OpenStack Platform container images to the undercloud
If you synchronized container images to a local registry, you must create an environment file and include the paths to the container images.
Procedure
Create a new environment file, for example,
container-images.yaml, and insert the following container images and paths:parameter_defaults: DockerCollectdConfigImage: <image-registry-path>/rhosp{vernum}/openstack-collectd:latest DockerCollectdImage: <image-registry-path>/rhosp{vernum}/openstack-collectd:latest DockerMetricsQdrConfigImage: <image-registry-path>/rhosp{vernum}/openstack-qdrouterd:latest DockerMetricsQdrImage: <image-registry-path>/rhosp{vernum}/openstack-qdrouterd:latestparameter_defaults: DockerCollectdConfigImage: <image-registry-path>/rhosp{vernum}/openstack-collectd:latest DockerCollectdImage: <image-registry-path>/rhosp{vernum}/openstack-collectd:latest DockerMetricsQdrConfigImage: <image-registry-path>/rhosp{vernum}/openstack-qdrouterd:latest DockerMetricsQdrImage: <image-registry-path>/rhosp{vernum}/openstack-qdrouterd:latestCopy to Clipboard Copied! Toggle word wrap Toggle overflow Replace
<image-registry-path>with the path to the image registry.To deploy collectd and AMQ Interconnect to your overcloud, include the
/usr/share/local-container-images/container-images.yamlenvironment file so Red Hat OpenStack Platform director can prepare the images. The following snippet is an example of how to include this environment file:openstack overcloud container image prepare \ ... -e /usr/share/local-container-images/container-images.yaml \ ...
$ openstack overcloud container image prepare \
  ...
  -e /usr/share/local-container-images/container-images.yaml \
  ...
Copy to Clipboard Copied! Toggle word wrap Toggle overflow
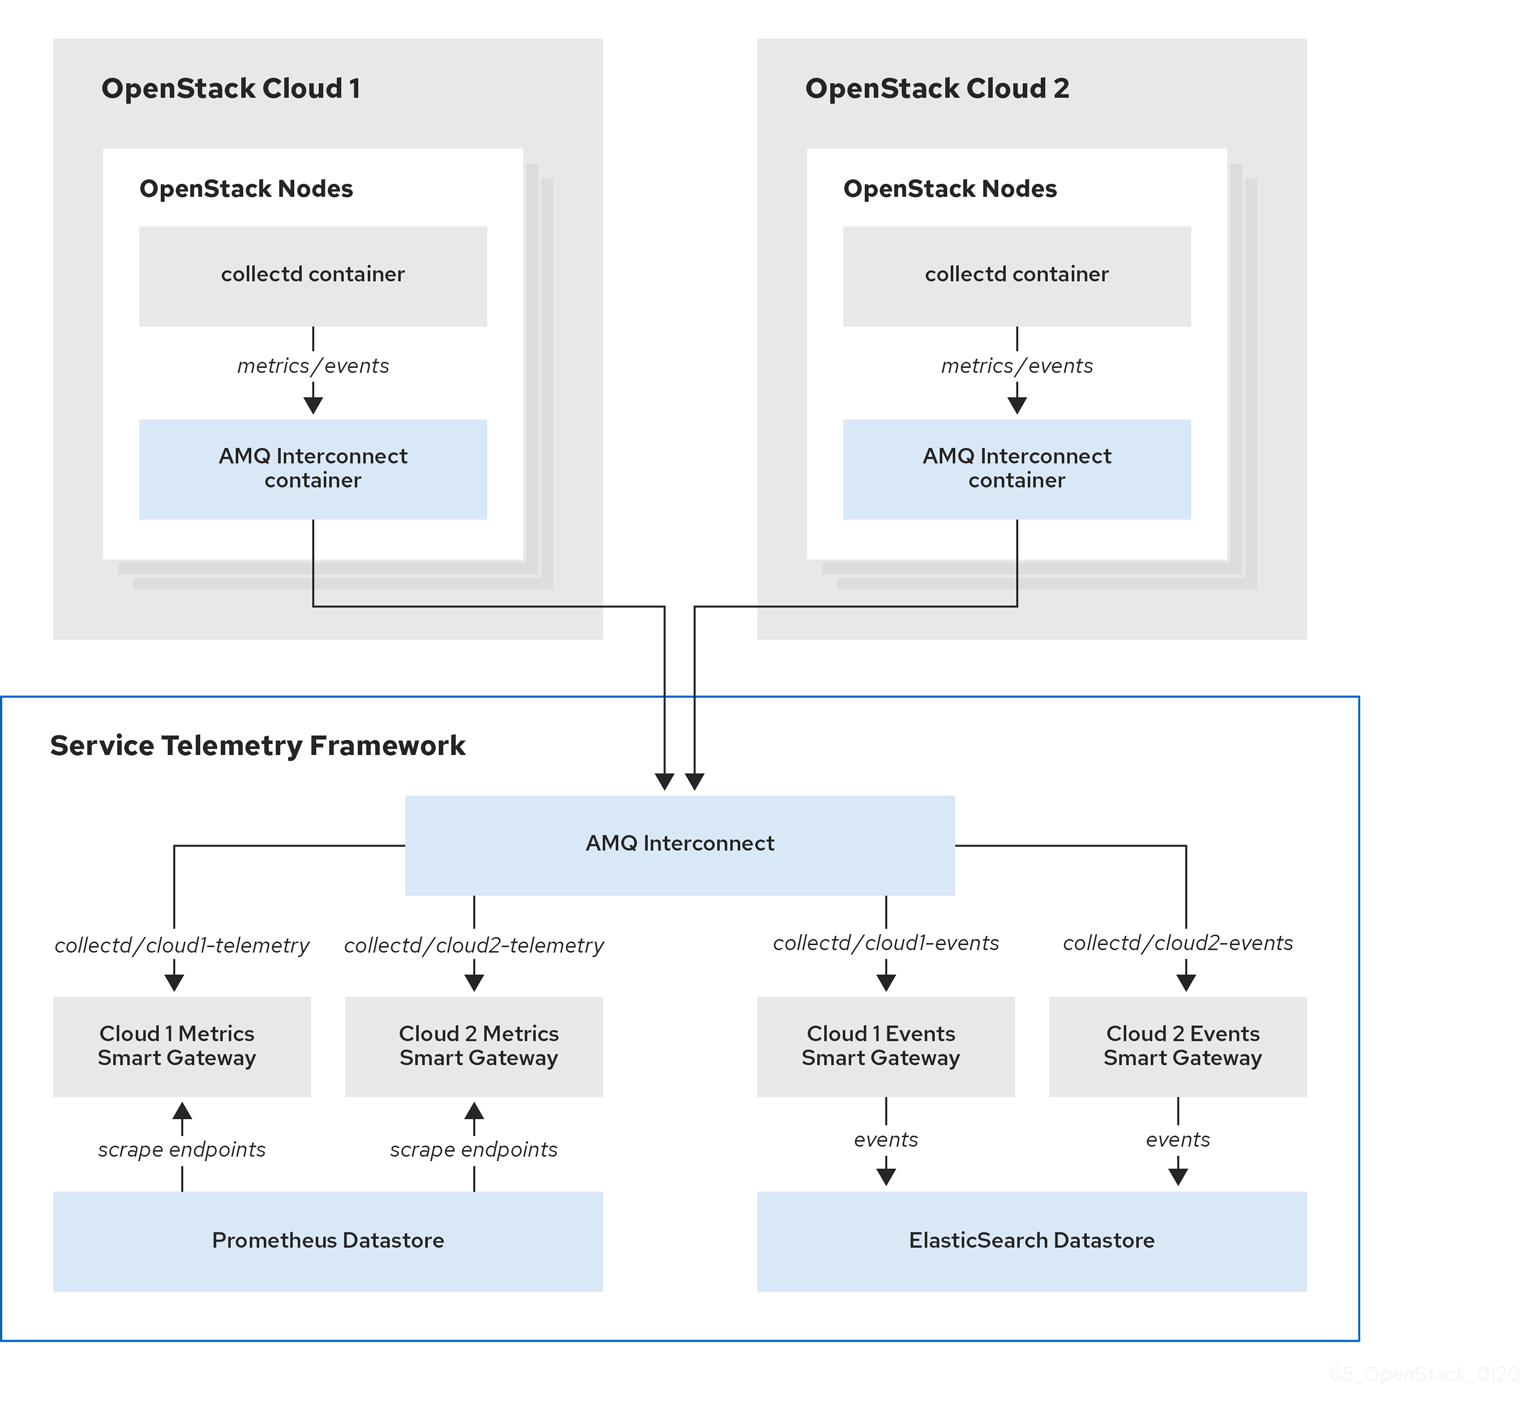
4.4. Configuring multiple clouds
You can configure multiple Red Hat OpenStack Platform (RHOSP) clouds to target a single instance of Service Telemetry Framework (STF). When you configure multiple clouds, every cloud must send metrics and events on their own unique message bus topic. In the STF deployment, Smart Gateway instances listen on these topics to save information to the common data store. Data that is stored by the Smart Gateway in the data storage domain is filtered by using the metadata that each of Smart Gateways creates.
Figure 4.1. Two RHOSP clouds connect to STF
To configure the RHOSP overcloud for a multiple cloud scenario, complete the following tasks:
- Plan the AMQP address prefixes that you want to use for each cloud. For more information, see Section 4.4.1, “Planning AMQP address prefixes”.
- Deploy metrics and events consumer Smart Gateways for each cloud to listen on the corresponding address prefixes. For more information, see Section 4.4.2, “Deploying Smart Gateways”.
- Configure each cloud with a unique domain name. For more information, see Section 4.4.4, “Setting a unique cloud domain”.
- Create the base configuration for STF. For more information, see Section 4.1.3, “Creating the base configuration for STF”.
- Configure each cloud to send its metrics and events to STF on the correct address. For more information, see Section 4.4.5, “Creating the Red Hat OpenStack Platform environment file for multiple clouds”.
4.4.1. Planning AMQP address prefixes
By default, Red Hat OpenStack Platform nodes receive data through two data collectors; collectd and Ceilometer. These components send telemetry data or notifications to the respective AMQP addresses, for example, collectd/telemetry. STF Smart Gateways listen on the AMQP addresses for monitoring data. To support multiple clouds and to identify which cloud generated the monitoring data, configure each cloud to send data to a unique address. Add a cloud identifier prefix to the second part of the address. The following list shows some example addresses and identifiers:
-
collectd/cloud1-telemetry -
collectd/cloud1-notify -
anycast/ceilometer/cloud1-metering.sample -
anycast/ceilometer/cloud1-event.sample -
collectd/cloud2-telemetry -
collectd/cloud2-notify -
anycast/ceilometer/cloud2-metering.sample -
anycast/ceilometer/cloud2-event.sample -
collectd/us-east-1-telemetry -
collectd/us-west-3-telemetry
4.4.2. Deploying Smart Gateways
You must deploy a Smart Gateway for each of the data collection types for each cloud; one for collectd metrics, one for collectd events, one for Ceilometer metrics, and one for Ceilometer events. Configure each of the Smart Gateways to listen on the AMQP address that you define for the corresponding cloud. To define Smart Gateways, configure the clouds parameter in the ServiceTelemetry manifest.
When you deploy STF for the first time, Smart Gateway manifests are created that define the initial Smart Gateways for a single cloud. When you deploy Smart Gateways for multiple cloud support, you deploy multiple Smart Gateways for each of the data collection types that handle the metrics and the events data for each cloud. The initial Smart Gateways are defined in cloud1 with the following subscription addresses:
| collector | type | default subscription address |
| collectd | metrics | collectd/telemetry |
| collectd | events | collectd/notify |
| Ceilometer | metrics | anycast/ceilometer/metering.sample |
| Ceilometer | events | anycast/ceilometer/event.sample |
Prerequisites
- You have determined your cloud naming scheme. For more information about determining your naming scheme, see Section 4.4.1, “Planning AMQP address prefixes”.
-
You have created your list of clouds objects. For more information about creating the content for the
cloudsparameter, see the section called “The clouds parameter”.
Procedure
- Log in to Red Hat OpenShift Container Platform.
Change to the
service-telemetrynamespace:oc project service-telemetry
$ oc project service-telemetryCopy to Clipboard Copied! Toggle word wrap Toggle overflow Edit the
defaultServiceTelemetry object and add acloudsparameter with your configuration:WarningLong cloud names might exceed the maximum pod name of 63 characters. Ensure that the combination of the
ServiceTelemetrynamedefaultand theclouds.namedoes not exceed 19 characters. Cloud names cannot contain any special characters, such as-. Limit cloud names to alphanumeric (a-z, 0-9).Topic addresses have no character limitation and can be different from the
clouds.namevalue.oc edit stf default
$ oc edit stf defaultCopy to Clipboard Copied! Toggle word wrap Toggle overflow Copy to Clipboard Copied! Toggle word wrap Toggle overflow - Save the ServiceTelemetry object.
Verify that each Smart Gateway is running. This can take several minutes depending on the number of Smart Gateways:
Copy to Clipboard Copied! Toggle word wrap Toggle overflow
4.4.3. Deleting the default Smart Gateways
After you configure Service Telemetry Framework (STF) for multiple clouds, you can delete the default Smart Gateways if they are no longer in use. The Service Telemetry Operator can remove SmartGateway objects that were created but are no longer listed in the ServiceTelemetry clouds list of objects. To enable the removal of SmartGateway objects that are not defined by the clouds parameter, you must set the cloudsRemoveOnMissing parameter to true in the ServiceTelemetry manifest.
If you do not want to deploy any Smart Gateways, define an empty clouds list by using the clouds: [] parameter.
The cloudsRemoveOnMissing parameter is disabled by default. If you enable the cloudsRemoveOnMissing parameter, you remove any manually-created SmartGateway objects in the current namespace without any possibility to restore.
Procedure
-
Define your
cloudsparameter with the list of cloud objects that you want the Service Telemetry Operator to manage. For more information, see the section called “The clouds parameter”. Edit the ServiceTelemetry object and add the
cloudsRemoveOnMissingparameter:Copy to Clipboard Copied! Toggle word wrap Toggle overflow - Save the modifications.
Verify that the Operator deleted the Smart Gateways. This can take several minutes while the Operators reconcile the changes:
oc get smartgateways
$ oc get smartgatewaysCopy to Clipboard Copied! Toggle word wrap Toggle overflow
4.4.4. Setting a unique cloud domain
To ensure that AMQ Interconnect router connections from Red Hat OpenStack Platform (RHOSP) to Service Telemetry Framework (STF) are unique and do not conflict, configure the CloudDomain parameter.
Ensure that you do not change host or domain names in an existing deployment. Host and domain name configuration is supported in new cloud deployments only.
Procedure
-
Create a new environment file, for example,
hostnames.yaml. Set the
CloudDomainparameter in the environment file, as shown in the following example:hostnames.yaml
parameter_defaults: CloudDomain: newyork-west-04 CephStorageHostnameFormat: 'ceph-%index%' ObjectStorageHostnameFormat: 'swift-%index%' ComputeHostnameFormat: 'compute-%index%'parameter_defaults: CloudDomain: newyork-west-04 CephStorageHostnameFormat: 'ceph-%index%' ObjectStorageHostnameFormat: 'swift-%index%' ComputeHostnameFormat: 'compute-%index%'Copy to Clipboard Copied! Toggle word wrap Toggle overflow - Add the new environment file to your deployment.
Additional resources
- Section 4.4.5, “Creating the Red Hat OpenStack Platform environment file for multiple clouds”
- Core Overcloud Parameters in the Overcloud Parameters guide
4.4.5. Creating the Red Hat OpenStack Platform environment file for multiple clouds
To label traffic according to the cloud of origin, you must create a configuration with cloud-specific instance names. Create an stf-connectors.yaml file and adjust the values of CeilometerQdrEventsConfig, CeilometerQdrMetricsConfig and CollectdAmqpInstances to match the AMQP address prefix scheme.
Prerequisites
- You have retrieved the CA certificate from the AMQ Interconnect deployed by STF. For more information, see Section 4.1.1, “Getting CA certificate from Service Telemetry Framework for overcloud configuration”.
- You have created your list of clouds objects. For more information about creating the content for the clouds parameter, see the clouds configuration parameter.
- You have retrieved the AMQ Interconnect route address. For more information, see Section 4.1.2, “Retrieving the AMQ Interconnect route address”.
- You have created the base configuration for STF. For more information, see Section 4.1.3, “Creating the base configuration for STF”.
- You have created a unique domain name environment file. For more information, see Section 4.4.4, “Setting a unique cloud domain”.
Procedure
-
Log in to the undercloud host as the
stackuser. -
Create a configuration file called
stf-connectors.yamlin the/home/stackdirectory. In the
stf-connectors.yamlfile, configure theMetricsQdrConnectorsaddress to connect to the AMQ Interconnect on the overcloud deployment. Configure theCeilometerQdrEventsConfig,CeilometerQdrMetricsConfig, andCollectdAmqpInstancestopic values to match the AMQP address that you want for this cloud deployment.stf-connectors.yaml
Copy to Clipboard Copied! Toggle word wrap Toggle overflow -
The
resource_registryconfiguration directly loads the collectd service because you do not include thecollectd-write-qdr.yamlenvironment file for multiple cloud deployments. -
Replace the
hostparameter with the value that you retrieved in Section 4.1.2, “Retrieving the AMQ Interconnect route address”. -
Replace the
caCertFileContentparameter with the contents retrieved in Section 4.1.1, “Getting CA certificate from Service Telemetry Framework for overcloud configuration”. -
Replace the
hostsub-parameter ofMetricsQdrConnectorswith the value that you retrieved in Section 4.1.2, “Retrieving the AMQ Interconnect route address”. -
Set
topicvalue ofCeilometerQdrEventsConfigto define the topic for Ceilometer events. The value is a unique topic idenifier for the cloud such ascloud1-event. -
Set
topicvalue ofCeilometerQdrMetricsConfig.topicto define the topic for Ceilometer metrics. The value is a unique topic identifier for the cloud such ascloud1-metering. -
Set
CollectdAmqpInstancessub-paramter to define the topic for collectd events. The section name is a unique topic identifier for the cloud such ascloud1-notify. Set
CollectdAmqpInstancessub-parameter to define the topic for collectd metrics. The section name is a unique topic identifier for the cloud such ascloud1-telemetry.NoteWhen you define the topics for collectd and Ceilometer, the value you provide is transposed into the full topic that the Smart Gateway client uses to listen for messages.
Ceilometer topic values are transposed into the topic address
anycast/ceilometer/<TOPIC>.sampleand collectd topic values are transposed into the topic addresscollectd/<TOPIC>.For an example of a cloud configuration in the
ServiceTelemetryobject referring to the full topic address, see the section called “The clouds parameter”.
-
The
-
Ensure that the naming convention in the
stf-connectors.yamlfile aligns with thespec.bridge.amqpUrlfield in the Smart Gateway configuration. For example, configure theCeilometerQdrEventsConfig.topicfield to a value ofcloud1-event. -
Log in to the undercloud host as the
stackuser. Source the
stackrcundercloud credentials file:source stackrc
$ source stackrcCopy to Clipboard Copied! Toggle word wrap Toggle overflow Include the
stf-connectors.yamlfile and unique domain name environment filehostnames.yamlin theopenstack overcloud deploymentcommand, with any other environment files relevant to your environment:WarningIf you use the
collectd-write-qdr.yamlfile with a customCollectdAmqpInstancesparameter, data publishes to the custom and default topics. In a multiple cloud environment, the configuration of theresource_registryparameter in thestf-connectors.yamlfile loads the collectd service.Copy to Clipboard Copied! Toggle word wrap Toggle overflow - Deploy the Red Hat OpenStack Platform overcloud.
Additional resources
- For information about how to validate the deployment, see Section 4.1.6, “Validating client-side installation”.
4.4.6. Querying metrics data from multiple clouds
Data stored in Prometheus has a service label according to the Smart Gateway it was scraped from. You can use this label to query data from a specific cloud.
To query data from a specific cloud, use a Prometheus promql query that matches the associated service label; for example: collectd_uptime{service="default-cloud1-coll-meter"}.
Chapter 5. Using operational features of Service Telemetry Framework
You can use the following operational features to provide additional functionality to the Service Telemetry Framework (STF):
5.1. Dashboards in Service Telemetry Framework
Use the third-party application, Grafana, to visualize system-level metrics that the data collectors collectd and Ceilometer gather for each individual host node.
For more information about configuring data collectors, see Section 4.1, “Deploying Red Hat OpenStack Platform overcloud for Service Telemetry Framework using director”.
5.1.1. Configuring Grafana to host the dashboard
Grafana is not included in the default Service Telemetry Framework (STF) deployment, so you must deploy the Grafana Operator from community-operators CatalogSource. If you use the Service Telemetry Operator to deploy Grafana, it results in a Grafana instance and the configuration of the default data sources for the local STF deployment.
Procedure
- Log in to Red Hat OpenShift Container Platform.
Change to the
service-telemetrynamespace:oc project service-telemetry
$ oc project service-telemetryCopy to Clipboard Copied! Toggle word wrap Toggle overflow Subscribe to the Grafana Operator by using the community-operators CatalogSource:
WarningCommunity Operators are Operators which have not been vetted or verified by Red Hat. Community Operators should be used with caution because their stability is unknown. Red Hat provides no support for community Operators.
Learn more about Red Hat’s third party software support policy
Copy to Clipboard Copied! Toggle word wrap Toggle overflow Verify that the Operator launched successfully. In the command output, if the value of the
PHASEcolumn isSucceeded, the Operator launched successfully:oc get csv --selector operators.coreos.com/grafana-operator.service-telemetry NAME DISPLAY VERSION REPLACES PHASE grafana-operator.v4.10.1 Grafana Operator 4.10.1 grafana-operator.v4.10.0 Succeeded
$ oc get csv --selector operators.coreos.com/grafana-operator.service-telemetry

NAME                       DISPLAY            VERSION   REPLACES                   PHASE
grafana-operator.v4.10.1   Grafana Operator   4.10.1    grafana-operator.v4.10.0   Succeeded
Copy to Clipboard Copied! Toggle word wrap Toggle overflow To launch a Grafana instance, create or modify the
ServiceTelemetryobject. Setgraphing.enabledandgraphing.grafana.ingressEnabledtotrue. Optionally, set the value ofgraphing.grafana.baseImageto the Grafana workload container image that will be deployed:Copy to Clipboard Copied! Toggle word wrap Toggle overflow Verify that the Grafana instance deployed:
oc get pod -l app=grafana

NAME                                  READY   STATUS    RESTARTS   AGE
grafana-deployment-7fc7848b56-sbkhv   1/1     Running   0          1m
$ oc get pod -l app=grafana

NAME                                  READY   STATUS    RESTARTS   AGE
grafana-deployment-7fc7848b56-sbkhv   1/1     Running   0          1m
Copy to Clipboard Copied! Toggle word wrap Toggle overflow Verify that the Grafana data sources installed correctly:
oc get grafanadatasources

NAME                    AGE
default-datasources     20h
$ oc get grafanadatasources

NAME                    AGE
default-datasources     20h
Copy to Clipboard Copied! Toggle word wrap Toggle overflow Verify that the Grafana route exists:
oc get route grafana-route

NAME            HOST/PORT                                          PATH   SERVICES          PORT   TERMINATION   WILDCARD
grafana-route   grafana-route-service-telemetry.apps.infra.watch          grafana-service   3000   edge          None
$ oc get route grafana-route

NAME            HOST/PORT                                          PATH   SERVICES          PORT   TERMINATION   WILDCARD
grafana-route   grafana-route-service-telemetry.apps.infra.watch          grafana-service   3000   edge          None
Copy to Clipboard Copied! Toggle word wrap Toggle overflow
5.1.2. Retrieving and setting Grafana login credentials
When Grafana is enabled, you can login using openshift authentication, or the default username and password set by the Grafana Operator.
You can override the credentials in the ServiceTelemetry object to have Service Telemetry Framework (STF) set the username and password for Grafana instead.
Procedure
- Log in to Red Hat OpenShift Container Platform.
Change to the
service-telemetrynamespace:oc project service-telemetry
$ oc project service-telemetryCopy to Clipboard Copied! Toggle word wrap Toggle overflow Retrieve the existing username and password from the STF object:
oc get stf default -o jsonpath="{.spec.graphing.grafana['adminUser','adminPassword']}"$ oc get stf default -o jsonpath="{.spec.graphing.grafana['adminUser','adminPassword']}"Copy to Clipboard Copied! Toggle word wrap Toggle overflow To modify the default values of the Grafana administrator username and password through the ServiceTelemetry object, use the
graphing.grafana.adminUserandgraphing.grafana.adminPasswordparameters.oc edit stf default
$ oc edit stf defaultCopy to Clipboard Copied! Toggle word wrap Toggle overflow Wait for the grafana pod to restart with the new credentials in place
oc get po -l app=grafana -w
$ oc get po -l app=grafana -wCopy to Clipboard Copied! Toggle word wrap Toggle overflow
5.2. Metrics retention time period in Service Telemetry Framework
The default retention time for metrics stored in Service Telemetry Framework (STF) is 24 hours, which provides enough data for trends to develop for the purposes of alerting.
For long-term storage, use systems designed for long-term data retention, for example, Thanos.
Additional resources
- To adjust STF for additional metrics retention time, see Section 5.2.1, “Editing the metrics retention time period in Service Telemetry Framework”.
- For recommendations about Prometheus data storage and estimating storage space, see https://prometheus.io/docs/prometheus/latest/storage/#operational-aspects
- For more information about Thanos, see https://thanos.io/
5.2.1. Editing the metrics retention time period in Service Telemetry Framework
You can adjust Service Telemetry Framework (STF) for additional metrics retention time.
Procedure
- Log in to Red Hat OpenShift Container Platform.
Change to the service-telemetry namespace:
oc project service-telemetry
$ oc project service-telemetryCopy to Clipboard Copied! Toggle word wrap Toggle overflow Edit the ServiceTelemetry object:
oc edit stf default
$ oc edit stf defaultCopy to Clipboard Copied! Toggle word wrap Toggle overflow Add
retention: 7dto the storage section of backends.metrics.prometheus.storage to increase the retention period to seven days:NoteIf you set a long retention period, retrieving data from heavily populated Prometheus systems can result in queries returning results slowly.
Copy to Clipboard Copied! Toggle word wrap Toggle overflow - Save your changes and close the object.
Wait for prometheus to restart with the new settings.
oc get po -l app.kubernetes.io/name=prometheus -w
$ oc get po -l app.kubernetes.io/name=prometheus -wCopy to Clipboard Copied! Toggle word wrap Toggle overflow Verify the new retention setting by checking the command line arguments used in the pod.
oc describe po prometheus-default-0 | grep retention.time
      --storage.tsdb.retention.time=24h
$ oc describe po prometheus-default-0 | grep retention.time --storage.tsdb.retention.time=24hCopy to Clipboard Copied! Toggle word wrap Toggle overflow
Additional resources
- For more information about the metrics retention time, see Section 5.2, “Metrics retention time period in Service Telemetry Framework”.
5.3. Alerts in Service Telemetry Framework
You create alert rules in Prometheus and alert routes in Alertmanager. Alert rules in Prometheus servers send alerts to an Alertmanager, which manages the alerts. Alertmanager can silence, inhibit, or aggregate alerts, and send notifications by using email, on-call notification systems, or chat platforms.
To create an alert, complete the following tasks:
- Create an alert rule in Prometheus. For more information, see Section 5.3.1, “Creating an alert rule in Prometheus”.
Create an alert route in Alertmanager. There are two ways in which you can create an alert route:
Additional resources
For more information about alerts or notifications with Prometheus and Alertmanager, see https://prometheus.io/docs/alerting/overview/
To view an example set of alerts that you can use with Service Telemetry Framework (STF), see https://github.com/infrawatch/service-telemetry-operator/tree/master/deploy/alerts
5.3.1. Creating an alert rule in Prometheus
Prometheus evaluates alert rules to trigger notifications. If the rule condition returns an empty result set, the condition is false. Otherwise, the rule is true and it triggers an alert.
Procedure
- Log in to Red Hat OpenShift Container Platform.
Change to the
service-telemetrynamespace:oc project service-telemetry
$ oc project service-telemetryCopy to Clipboard Copied! Toggle word wrap Toggle overflow Create a
PrometheusRuleobject that contains the alert rule. The Prometheus Operator loads the rule into Prometheus:Copy to Clipboard Copied! Toggle word wrap Toggle overflow To change the rule, edit the value of the
exprparameter.To verify that the Operator loaded the rules into Prometheus, run the
curlcommand against the default-prometheus-proxy route with basic authentication:curl -k --user "internal:$(oc get secret default-prometheus-htpasswd -ogo-template='{{ .data.password | base64decode }}')" https://$(oc get route default-prometheus-proxy -ogo-template='{{ .spec.host }}')/api/v1/rules {"status":"success","data":{"groups":[{"name":"./openstack.rules","file":"/etc/prometheus/rules/prometheus-default-rulefiles-0/service-telemetry-prometheus-alarm-rules.yaml","rules":[{"state":"inactive","name":"Collectd metrics receive count is zero","query":"rate(sg_total_collectd_msg_received_count[1m]) == 0","duration":0,"labels":{},"annotations":{},"alerts":[],"health":"ok","evaluationTime":0.00034627,"lastEvaluation":"2021-12-07T17:23:22.160448028Z","type":"alerting"}],"interval":30,"evaluationTime":0.000353787,"lastEvaluation":"2021-12-07T17:23:22.160444017Z"}]}}$ curl -k --user "internal:$(oc get secret default-prometheus-htpasswd -ogo-template='{{ .data.password | base64decode }}')" https://$(oc get route default-prometheus-proxy -ogo-template='{{ .spec.host }}')/api/v1/rules {"status":"success","data":{"groups":[{"name":"./openstack.rules","file":"/etc/prometheus/rules/prometheus-default-rulefiles-0/service-telemetry-prometheus-alarm-rules.yaml","rules":[{"state":"inactive","name":"Collectd metrics receive count is zero","query":"rate(sg_total_collectd_msg_received_count[1m]) == 0","duration":0,"labels":{},"annotations":{},"alerts":[],"health":"ok","evaluationTime":0.00034627,"lastEvaluation":"2021-12-07T17:23:22.160448028Z","type":"alerting"}],"interval":30,"evaluationTime":0.000353787,"lastEvaluation":"2021-12-07T17:23:22.160444017Z"}]}}Copy to Clipboard Copied! Toggle word wrap Toggle overflow
Additional resources
- For more information on alerting, see https://github.com/coreos/prometheus-operator/blob/master/Documentation/user-guides/alerting.md
5.3.2. Configuring custom alerts
You can add custom alerts to the PrometheusRule object that you created in Section 5.3.1, “Creating an alert rule in Prometheus”.
Procedure
Use the
oc editcommand:oc edit prometheusrules prometheus-alarm-rules
$ oc edit prometheusrules prometheus-alarm-rulesCopy to Clipboard Copied! Toggle word wrap Toggle overflow -
Edit the
PrometheusRulesmanifest. - Save and close the manifest.
Additional resources
- For more information about how to configure alerting rules, see https://prometheus.io/docs/prometheus/latest/configuration/alerting_rules/.
- For more information about PrometheusRules objects, see https://github.com/coreos/prometheus-operator/blob/master/Documentation/user-guides/alerting.md
5.3.3. Creating a standard alert route in Alertmanager
Use Alertmanager to deliver alerts to an external system, such as email, IRC, or other notification channel. The Prometheus Operator manages the Alertmanager configuration as a Red Hat OpenShift Container Platform secret. By default, Service Telemetry Framework (STF) deploys a basic configuration that results in no receivers:
To deploy a custom Alertmanager route with STF, you must add a alertmanagerConfigManifest parameter to the Service Telemetry Operator that results in an updated secret, managed by the Prometheus Operator.
If your alertmanagerConfigManifest contains a custom template, for example, to construct the title and text of the sent alert, you must deploy the contents of the alertmanagerConfigManifest using a base64-encoded configuration. For more information, see Section 5.3.4, “Creating an alert route with templating in Alertmanager”.
Procedure
- Log in to Red Hat OpenShift Container Platform.
Change to the
service-telemetrynamespace:oc project service-telemetry
$ oc project service-telemetryCopy to Clipboard Copied! Toggle word wrap Toggle overflow Edit the
ServiceTelemetryobject for your STF deployment:oc edit stf default
$ oc edit stf defaultCopy to Clipboard Copied! Toggle word wrap Toggle overflow Add the new parameter
alertmanagerConfigManifestand theSecretobject contents to define thealertmanager.yamlconfiguration for Alertmanager:NoteThis step loads the default template that the Service Telemetry Operator manages. To verify that the changes are populating correctly, change a value, return the
alertmanager-defaultsecret, and verify that the new value is loaded into memory. For example, change the value of the parameterglobal.resolve_timeoutfrom5mto10m.Copy to Clipboard Copied! Toggle word wrap Toggle overflow Verify that the configuration has been applied to the secret:
Copy to Clipboard Copied! Toggle word wrap Toggle overflow Run the
wgetcommand from the prometheus pod against thealertmanager-proxyservice to retrieve the status andconfigYAMLcontents, and verify that the supplied configuration matches the configuration in Alertmanager:oc exec -it prometheus-default-0 -c prometheus -- sh -c "wget --header \"Authorization: Bearer \$(cat /var/run/secrets/kubernetes.io/serviceaccount/token)\" https://default-alertmanager-proxy:9095/api/v1/status -q -O -" {"status":"success","data":{"configYAML":"...",...}}$ oc exec -it prometheus-default-0 -c prometheus -- sh -c "wget --header \"Authorization: Bearer \$(cat /var/run/secrets/kubernetes.io/serviceaccount/token)\" https://default-alertmanager-proxy:9095/api/v1/status -q -O -" {"status":"success","data":{"configYAML":"...",...}}Copy to Clipboard Copied! Toggle word wrap Toggle overflow -
Verify that the
configYAMLfield contains the changes you expect. To clean up the environment, delete the
curlpod:oc delete pod curl pod "curl" deleted
$ oc delete pod curl

pod "curl" deleted
Copy to Clipboard Copied! Toggle word wrap Toggle overflow
Additional resources
- For more information about the Red Hat OpenShift Container Platform secret and the Prometheus operator, see Prometheus user guide on alerting.
5.3.4. Creating an alert route with templating in Alertmanager
Use Alertmanager to deliver alerts to an external system, such as email, IRC, or other notification channel. The Prometheus Operator manages the Alertmanager configuration as a Red Hat OpenShift Container Platform secret. By default, Service Telemetry Framework (STF) deploys a basic configuration that results in no receivers:
If the alertmanagerConfigManifest parameter contains a custom template, for example, to construct the title and text of the sent alert, you must deploy the contents of the alertmanagerConfigManifest by using a base64-encoded configuration.
Procedure
- Log in to Red Hat OpenShift Container Platform.
Change to the
service-telemetrynamespace:oc project service-telemetry
$ oc project service-telemetryCopy to Clipboard Copied! Toggle word wrap Toggle overflow Create the necessary alertmanager config in a file called alertmanager.yaml, for example:
Copy to Clipboard Copied! Toggle word wrap Toggle overflow Generate the config manifest and add it to the
ServiceTelemetryobject for your STF deployment:CONFIG_MANIFEST=$(oc create secret --dry-run=client generic alertmanager-default --from-file=alertmanager.yaml -o json) oc patch stf default --type=merge -p '{"spec":{"alertmanagerConfigManifest":'"$CONFIG_MANIFEST"'}}'$ CONFIG_MANIFEST=$(oc create secret --dry-run=client generic alertmanager-default --from-file=alertmanager.yaml -o json) $ oc patch stf default --type=merge -p '{"spec":{"alertmanagerConfigManifest":'"$CONFIG_MANIFEST"'}}'Copy to Clipboard Copied! Toggle word wrap Toggle overflow Verify that the configuration has been applied to the secret:
NoteThere will be a short delay as the operators update each object
Copy to Clipboard Copied! Toggle word wrap Toggle overflow Run the
wgetcommand from the prometheus pod against thealertmanager-proxyservice to retrieve the status andconfigYAMLcontents, and verify that the supplied configuration matches the configuration in Alertmanager:oc exec -it prometheus-default-0 -c prometheus -- /bin/sh -c "wget --header \"Authorization: Bearer \$(cat /var/run/secrets/kubernetes.io/serviceaccount/token)\" https://default-alertmanager-proxy:9095/api/v1/status -q -O -" {"status":"success","data":{"configYAML":"...",...}}$ oc exec -it prometheus-default-0 -c prometheus -- /bin/sh -c "wget --header \"Authorization: Bearer \$(cat /var/run/secrets/kubernetes.io/serviceaccount/token)\" https://default-alertmanager-proxy:9095/api/v1/status -q -O -" {"status":"success","data":{"configYAML":"...",...}}Copy to Clipboard Copied! Toggle word wrap Toggle overflow -
Verify that the
configYAMLfield contains the changes you expect.
Additional resources
- For more information about the Red Hat OpenShift Container Platform secret and the Prometheus operator, see Prometheus user guide on alerting.
5.4. Sending alerts as SNMP traps
To enable SNMP traps, modify the ServiceTelemetry object and configure the snmpTraps parameters. SNMP traps are sent using version 2c.
5.4.1. Configuration parameters for snmpTraps
The snmpTraps parameter contains the following sub-parameters for configuring the alert receiver:
- enabled
- Set the value of this sub-parameter to true to enable the SNMP trap alert receiver. The default value is false.
- target
-
Target address to send SNMP traps. Value is a string. Default is
192.168.24.254. - port
-
Target port to send SNMP traps. Value is an integer. Default is
162. - community
-
Target community to send SNMP traps to. Value is a string. Default is
public. - retries
-
SNMP trap retry delivery limit. Value is an integer. Default is
5. - timeout
-
SNMP trap delivery timeout defined in seconds. Value is an integer. Default is
1. - alertOidLabel
-
Label name in the alert that defines the OID value to send the SNMP trap as. Value is a string. Default is
oid. - trapOidPrefix
-
SNMP trap OID prefix for variable bindings. Value is a string. Default is
1.3.6.1.4.1.50495.15. - trapDefaultOid
-
SNMP trap OID when no alert OID label has been specified with the alert. Value is a string. Default is
1.3.6.1.4.1.50495.15.1.2.1. - trapDefaultSeverity
- SNMP trap severity when no alert severity has been set. Value is a string. Defaults to an empty string.
Configure the snmpTraps parameter as part of the alerting.alertmanager.receivers definition in the ServiceTelemetry object:
5.4.2. Overview of the MIB definition
Delivery of SNMP traps uses object identifier (OID) value 1.3.6.1.4.1.50495.15.1.2.1 by default. The management information base (MIB) schema is available at https://github.com/infrawatch/prometheus-webhook-snmp/blob/master/PROMETHEUS-ALERT-CEPH-MIB.txt.
The OID number is comprised of the following component values: * The value 1.3.6.1.4.1 is a global OID defined for private enterprises. * The next identifier 50495 is a private enterprise number assigned by IANA for the Ceph organization. * The other values are child OIDs of the parent.
- 15
- prometheus objects
- 15.1
- prometheus alerts
- 15.1.2
- prometheus alert traps
- 15.1.2.1
- prometheus alert trap default
The prometheus alert trap default is an object comprised of several other sub-objects to OID 1.3.6.1.4.1.50495.15 which is defined by the alerting.alertmanager.receivers.snmpTraps.trapOidPrefix parameter:
- <trapOidPrefix>.1.1.1
- alert name
- <trapOidPrefix>.1.1.2
- status
- <trapOidPrefix>.1.1.3
- severity
- <trapOidPrefix>.1.1.4
- instance
- <trapOidPrefix>.1.1.5
- job
- <trapOidPrefix>.1.1.6
- description
- <trapOidPrefix>.1.1.7
- labels
- <trapOidPrefix>.1.1.8
- timestamp
- <trapOidPrefix>.1.1.9
- rawdata
The following is example output from a simple SNMP trap receiver that outputs the received trap to the console:
5.4.3. Configuring SNMP traps
Prerequisites
- Ensure that you know the IP address or hostname of the SNMP trap receiver where you want to send the alerts to.
Procedure
- Log in to Red Hat OpenShift Container Platform.
Change to the
service-telemetrynamespace:oc project service-telemetry
$ oc project service-telemetryCopy to Clipboard Copied! Toggle word wrap Toggle overflow To enable SNMP traps, modify the
ServiceTelemetryobject:oc edit stf default
$ oc edit stf defaultCopy to Clipboard Copied! Toggle word wrap Toggle overflow Set the
alerting.alertmanager.receivers.snmpTrapsparameters:Copy to Clipboard Copied! Toggle word wrap Toggle overflow -
Ensure that you set the value of
targetto the IP address or hostname of the SNMP trap receiver.
Additional Information
For more information about available parameters for snmpTraps, see Section 5.4.1, “Configuration parameters for snmpTraps”.
5.4.4. Creating alerts for SNMP traps
You can create alerts that are configured for delivery by SNMP traps by adding labels that are parsed by the prometheus-webhook-snmp middleware to define the trap information and delivered object identifiers (OID). Adding the oid or severity labels is only required if you need to change the default values for a particular alert definition.
- NOTE
-
When you set the oid label, the top-level SNMP trap OID changes, but the sub-OIDs remain defined by the global
trapOidPrefixvalue plus the child OID values.1.1.1through.1.1.9. For more information about the MIB definition, see Section 5.4.2, “Overview of the MIB definition”.
Procedure
- Log in to Red Hat OpenShift Container Platform.
Change to the
service-telemetrynamespace:oc project service-telemetry
$ oc project service-telemetryCopy to Clipboard Copied! Toggle word wrap Toggle overflow Create a
PrometheusRuleobject that contains the alert rule and anoidlabel that contains the SNMP trap OID override value:Copy to Clipboard Copied! Toggle word wrap Toggle overflow
Additional information
For more information about configuring alerts, see Section 5.3, “Alerts in Service Telemetry Framework”.
5.5. Configuring the duration for the TLS certificates
To configure the duration of the TLS certificates that you use for the connections with Elasticsearch and AMQ Interconnect in Service Telemetry Framework (STF), modify the ServiceTelemetry object and configure the certificates parameters.
5.5.1. Configuration parameters for the TLS certificates
You can configure the duration of the certificate with the following sub-parameters of the certificates parameter:
- endpointCertDuration
-
The requested duration or lifetime of the endpoint Certificate. Minimum accepted duration is 1 hour. Value must be in units accepted by Go time.ParseDuration https://golang.org/pkg/time/#ParseDuration. The default value is
70080h. - caCertDuration
-
The requested duration or lifetime of the CA Certificate. Minimum accepted duration is 1 hour. Value must be in units accepted by Go time.ParseDuration https://golang.org/pkg/time/#ParseDuration. Default value is
70080h. - NOTE
- The default duration of certificates is long, because you usually copy a subset of them in the Red Hat OpenStack Platform deployment when the certificates renew. For more information about the QDR CA Certificate renewal process, see Chapter 6, Renewing the AMQ Interconnect certificate
The certificates parameter for Elasticsearch is part of the backends.events.elasticsearch definition and is configured in the ServiceTelemetry object:
You can configure the certificates parameter for QDR that is part of the transports.qdr definition in the ServiceTelemetry object:
5.5.2. Configuring TLS certificates duration
To configure the duration of the TLS certificates to use with Service Telemetry Framework (STF), modify the ServiceTelemetry object and configure the certificates parameter.
Prerequisites
You didn’t deploy an instance of Service Telemetry Operator already.
- NOTE
-
When you create the
ServiceTelemetryobject, the required certificates and their secrets for STF are also created. For more information about how to modify the certificates and the secrets, see: Chapter 6, Renewing the AMQ Interconnect certificate The following procedure is valid for new STF deployments.
Procedure
To edit the duration of the TLS certificates, you can set the Elasticsearch endpointCertDuration, for example 26280h for 3 years, and set the QDR caCertDuration, for example 87600h for 10 years. You can use the default value of 8 years for the CA certificate for Elasticsearch and endpoint certificate:
+
Verification
Verify that the expiry date for the certificates is correct:
oc get secret elasticsearch-es-cert -o jsonpath='{.data.tls\.crt}' | base64 -d  | openssl x509 -in - -text | grep "Not After"
            Not After : Mar  9 21:00:16 2026 GMT

oc get secret  default-interconnect-selfsigned -o jsonpath='{.data.tls\.crt}' | base64 -d  | openssl x509 -in - -text | grep "Not After"
            Not After : Mar  9 21:00:16 2033 GMT
$ oc get secret elasticsearch-es-cert -o jsonpath='{.data.tls\.crt}' | base64 -d | openssl x509 -in - -text | grep "Not After" Not After : Mar 9 21:00:16 2026 GMT $ oc get secret default-interconnect-selfsigned -o jsonpath='{.data.tls\.crt}' | base64 -d | openssl x509 -in - -text | grep "Not After" Not After : Mar 9 21:00:16 2033 GMTCopy to Clipboard Copied! Toggle word wrap Toggle overflow
5.6. High availability
With high availability, Service Telemetry Framework (STF) can rapidly recover from failures in its component services. Although Red Hat OpenShift Container Platform restarts a failed pod if nodes are available to schedule the workload, this recovery process might take more than one minute, during which time events and metrics are lost. A high availability configuration includes multiple copies of STF components, which reduces recovery time to approximately 2 seconds. To protect against failure of an Red Hat OpenShift Container Platform node, deploy STF to an Red Hat OpenShift Container Platform cluster with three or more nodes.
STF is not yet a fully fault tolerant system. Delivery of metrics and events during the recovery period is not guaranteed.
Enabling high availability has the following effects:
- Three Elasticsearch pods run instead of the default one.
The following components run two pods instead of the default one:
- AMQ Interconnect
- Alertmanager
- Prometheus
- Events Smart Gateway
- Metrics Smart Gateway
- Recovery time from a lost pod in any of these services reduces to approximately 2 seconds.
5.6.1. Configuring high availability
To configure Service Telemetry Framework (STF) for high availability, add highAvailability.enabled: true to the ServiceTelemetry object in Red Hat OpenShift Container Platform. You can set this parameter at installation time or, if you already deployed STF, complete the following steps:
Procedure
- Log in to Red Hat OpenShift Container Platform.
Change to the
service-telemetrynamespace:oc project service-telemetry
$ oc project service-telemetryCopy to Clipboard Copied! Toggle word wrap Toggle overflow Use the oc command to edit the ServiceTelemetry object:
oc edit stf default
$ oc edit stf defaultCopy to Clipboard Copied! Toggle word wrap Toggle overflow Add
highAvailability.enabled: trueto thespecsection:Copy to Clipboard Copied! Toggle word wrap Toggle overflow - Save your changes and close the object.
5.7. Observability Strategy in Service Telemetry Framework
Service Telemetry Framework (STF) does not include storage backends and alerting tools. STF uses community operators to deploy Prometheus, Alertmanager, Grafana, and Elasticsearch. STF makes requests to these community operators to create instances of each application configured to work with STF.
Instead of having Service Telemetry Operator create custom resource requests, you can use your own deployments of these applications or other compatible applications, and scrape the metrics Smart Gateways for delivery to your own Prometheus-compatible system for telemetry storage. If you set the observabilityStrategy to none, then storage backends will not be deployed so persistent storage will not be required by STF.
5.7.1. Configuring an alternate observability strategy
To configure STF to skip the deployment of storage, visualization, and alerting backends, add observabilityStrategy: none to the ServiceTelemetry spec. In this mode, only AMQ Interconnect routers and metrics Smart Gateways are deployed, and you must configure an external Prometheus-compatible system to collect metrics from the STF Smart Gateways.
Currently, only metrics are supported when you set observabilityStrategy to none. Events Smart Gateways are not deployed.
Procedure
Create a
ServiceTelemetryobject with the propertyobservabilityStrategy: nonein thespecparameter. The manifest shows results in a default deployment of STF that is suitable for receiving telemetry from a single cloud with all metrics collector types.Copy to Clipboard Copied! Toggle word wrap Toggle overflow Delete the left over objects that are managed by community operators
for o in alertmanager/default prometheus/default elasticsearch/elasticsearch grafana/default; do oc delete $o; done
$ for o in alertmanager/default prometheus/default elasticsearch/elasticsearch grafana/default; do oc delete $o; doneCopy to Clipboard Copied! Toggle word wrap Toggle overflow To verify that all workloads are operating correctly, view the pods and the status of each pod:
Copy to Clipboard Copied! Toggle word wrap Toggle overflow
Additional resources
For more information about configuring additional clouds or to change the set of supported collectors, see Section 4.4.2, “Deploying Smart Gateways”
Chapter 6. Renewing the AMQ Interconnect certificate
Periodically, you must renew the CA certificate that secures the AMQ Interconnect connection between Red Hat OpenStack Platform (RHOSP) and Service Telemetry Framework (STF) when the certificate expires. The renewal is handled automatically by the cert-manager component in Red Hat OpenShift Container Platform, but you must manually copy the renewed certificate to your RHOSP nodes.
6.1. Checking for an expired AMQ Interconnect CA certificate
When the CA certificate expires, the AMQ Interconnect connections remain up, but cannot reconnect if they are interrupted. Eventually, some or all of the connections from your Red Hat OpenStack Platform (RHOSP) dispatch routers fail, showing errors on both sides, and the expiry or Not After field in your CA certificate is in the past.
Procedure
- Log in to Red Hat OpenShift Container Platform.
Change to the
service-telemetrynamespace:oc project service-telemetry
$ oc project service-telemetryCopy to Clipboard Copied! Toggle word wrap Toggle overflow Verify that some or all dispatch router connections have failed:
oc exec -it $(oc get po -l application=default-interconnect -o jsonpath='{.items[0].metadata.name}') -- qdstat --connections | grep Router | wc
      0       0       0
$ oc exec -it $(oc get po -l application=default-interconnect -o jsonpath='{.items[0].metadata.name}') -- qdstat --connections | grep Router | wc 0 0 0Copy to Clipboard Copied! Toggle word wrap Toggle overflow Check for this error in the Red Hat OpenShift Container Platform-hosted AMQ Interconnect logs:
oc logs -l application=default-interconnect | tail
[...]
2022-11-10 20:51:22.863466 +0000 SERVER (info) [C261] Connection from 10.10.10.10:34570 (to 0.0.0.0:5671) failed: amqp:connection:framing-error SSL Failure: error:140940E5:SSL routines:ssl3_read_bytes:ssl handshake failure
$ oc logs -l application=default-interconnect | tail
[...]
2022-11-10 20:51:22.863466 +0000 SERVER (info) [C261] Connection from 10.10.10.10:34570 (to 0.0.0.0:5671) failed: amqp:connection:framing-error SSL Failure: error:140940E5:SSL routines:ssl3_read_bytes:ssl handshake failure
Copy to Clipboard Copied! Toggle word wrap Toggle overflow - Log into your RHOSP undercloud.
Check for this error in the RHOSP-hosted AMQ Interconnect logs of a node with a failed connection:
ssh controller-0.ctlplane -- sudo tail /var/log/containers/metrics_qdr/metrics_qdr.log
[...]
2022-11-10 20:50:44.311646 +0000 SERVER (info) [C137] Connection to default-interconnect-5671-service-telemetry.apps.mycluster.com:443 failed: amqp:connection:framing-error SSL Failure: error:0A000086:SSL routines::certificate verify failed
$ ssh controller-0.ctlplane -- sudo tail /var/log/containers/metrics_qdr/metrics_qdr.log
[...]
2022-11-10 20:50:44.311646 +0000 SERVER (info) [C137] Connection to default-interconnect-5671-service-telemetry.apps.mycluster.com:443 failed: amqp:connection:framing-error SSL Failure: error:0A000086:SSL routines::certificate verify failed
Copy to Clipboard Copied! Toggle word wrap Toggle overflow Confirm that the CA certificate has expired by examining the file on an RHOSP node:
ssh controller-0.ctlplane -- cat /var/lib/config-data/puppet-generated/metrics_qdr/etc/pki/tls/certs/CA_sslProfile.pem | openssl x509 -text | grep "Not After"
            Not After : Nov 10 20:31:16 2022 GMT

$ date
Mon Nov 14 11:10:40 EST 2022
$ ssh controller-0.ctlplane -- cat /var/lib/config-data/puppet-generated/metrics_qdr/etc/pki/tls/certs/CA_sslProfile.pem | openssl x509 -text | grep "Not After" Not After : Nov 10 20:31:16 2022 GMT $ date Mon Nov 14 11:10:40 EST 2022Copy to Clipboard Copied! Toggle word wrap Toggle overflow
6.2. Updating the AMQ Interconnect CA certificate
To update the AMQ Interconnect certificate, you must export it from Red Hat OpenShift Container Platform and copy it to your Red Hat OpenStack Platform (RHOSP) nodes.
Procedure
- Log in to Red Hat OpenShift Container Platform.
Change to the
service-telemetrynamespace:oc project service-telemetry
$ oc project service-telemetryCopy to Clipboard Copied! Toggle word wrap Toggle overflow Export the CA certificate to
STFCA.pem:oc get secret/default-interconnect-selfsigned -o jsonpath='{.data.ca\.crt}' | base64 -d > STFCA.pem$ oc get secret/default-interconnect-selfsigned -o jsonpath='{.data.ca\.crt}' | base64 -d > STFCA.pemCopy to Clipboard Copied! Toggle word wrap Toggle overflow -
Copy
STFCA.pemto your RHOSP undercloud. - Log into your RHOSP undercloud.
-
Edit the
stf-connectors.yamlfile to contain the new caCertFileContent. For more information, see Section 4.1.4, “Configuring the STF connection for the overcloud”. Generate an inventory file:
tripleo-ansible-inventory --static-yaml-inventory ./tripleo-ansible-inventory.yaml
[stack@undercloud-0 ~]$ tripleo-ansible-inventory --static-yaml-inventory ./tripleo-ansible-inventory.yamlCopy to Clipboard Copied! Toggle word wrap Toggle overflow Copy the
STFCA.pemfile to each RHOSP overcloud node:ansible -i tripleo-ansible-inventory.yaml overcloud -b -m copy -a "src=STFCA.pem dest=/var/lib/config-data/puppet-generated/metrics_qdr/etc/pki/tls/certs/CA_sslProfile.pem"
[stack@undercloud-0 ~]$ ansible -i tripleo-ansible-inventory.yaml overcloud -b -m copy -a "src=STFCA.pem dest=/var/lib/config-data/puppet-generated/metrics_qdr/etc/pki/tls/certs/CA_sslProfile.pem"Copy to Clipboard Copied! Toggle word wrap Toggle overflow Restart the metrics_qdr container on each RHOSP overcloud node:
ansible -i tripleo-ansible-inventory.yaml overcloud -m shell -a "sudo {containerbin} restart metrics_qdr"[stack@undercloud-0 ~]$ ansible -i tripleo-ansible-inventory.yaml overcloud -m shell -a "sudo {containerbin} restart metrics_qdr"Copy to Clipboard Copied! Toggle word wrap Toggle overflow NoteYou do not need to deploy the overcloud after you copy the
STFCA.pemfile and restart themetrics_qdrcontainer. You edit thestf-connectors.yamlfile so that future deployments do not overwrite the new CA certificate.
Chapter 7. Removing Service Telemetry Framework from the Red Hat OpenShift Container Platform environment
Remove Service Telemetry Framework (STF) from an Red Hat OpenShift Container Platform environment if you no longer require the STF functionality.
To remove STF from the Red Hat OpenShift Container Platform environment, you must perform the following tasks:
- Delete the namespace.
- Remove the cert-manager Operator.
7.1. Deleting the namespace
To remove the operational resources for STF from Red Hat OpenShift Container Platform, delete the namespace.
Procedure
Run the
oc deletecommand:oc delete project service-telemetry
$ oc delete project service-telemetryCopy to Clipboard Copied! Toggle word wrap Toggle overflow Verify that the resources have been deleted from the namespace:
oc get all
No resources found.
$ oc get all
No resources found.
Copy to Clipboard Copied! Toggle word wrap Toggle overflow
7.2. Removing the cert-manager Operator
If you are not using the cert-manager Operator for any other applications, delete the Subscription, ClusterServiceVersion, and CustomResourceDefinitions.
Procedure
Delete the Subscription from the
openshift-cert-manager-operatornamespace:oc delete --namespace=openshift-cert-manager-operator subscription openshift-cert-manager-operator subscription.operators.coreos.com "openshift-cert-manager-operator" deleted
$ oc delete --namespace=openshift-cert-manager-operator subscription openshift-cert-manager-operator

subscription.operators.coreos.com "openshift-cert-manager-operator" deleted
Copy to Clipboard Copied! Toggle word wrap Toggle overflow Retrieve the version number of your installed ClusterServiceVersion:
oc get --namespace=openshift-cert-manager-operator subscription openshift-cert-manager-operator -oyaml | grep currentCSV
$ oc get --namespace=openshift-cert-manager-operator subscription openshift-cert-manager-operator -oyaml | grep currentCSVCopy to Clipboard Copied! Toggle word wrap Toggle overflow Example output:
currentCSV: openshift-cert-manager.v1.7.1
currentCSV: openshift-cert-manager.v1.7.1Copy to Clipboard Copied! Toggle word wrap Toggle overflow Delete the ClusterServiceVersion from the
openshift-cert-manager-operatornamespace:oc delete --namespace=openshift-cert-manager-operator csv openshift-cert-manager.v1.7.1
$ oc delete --namespace=openshift-cert-manager-operator csv openshift-cert-manager.v1.7.1Copy to Clipboard Copied! Toggle word wrap Toggle overflow Example output:
clusterserviceversion.operators.coreos.com "openshift-cert-manager.v1.7.1" deleted
clusterserviceversion.operators.coreos.com "openshift-cert-manager.v1.7.1" deletedCopy to Clipboard Copied! Toggle word wrap Toggle overflow Get the current list of CustomResourceDefinitions provided by the Operator so they can be deleted after removal of the ClusterServiceVersion:
oc get csv -n openshift-cert-manager-operator openshift-cert-manager.v1.7.1 -oyaml | grep "kind: CustomResourceDefinition" -A2 | grep name | awk '{print $2}'$ oc get csv -n openshift-cert-manager-operator openshift-cert-manager.v1.7.1 -oyaml | grep "kind: CustomResourceDefinition" -A2 | grep name | awk '{print $2}'Copy to Clipboard Copied! Toggle word wrap Toggle overflow Example output:
Copy to Clipboard Copied! Toggle word wrap Toggle overflow Delete the CustomResourceDefinitions related to the cert-manager Operator:
oc delete crd certificaterequests.cert-manager.io certificates.cert-manager.io certmanagers.config.openshift.io certmanagers.operator.openshift.io challenges.acme.cert-manager.io clusterissuers.cert-manager.io issuers.cert-manager.io orders.acme.cert-manager.io
$ oc delete crd certificaterequests.cert-manager.io certificates.cert-manager.io certmanagers.config.openshift.io certmanagers.operator.openshift.io challenges.acme.cert-manager.io clusterissuers.cert-manager.io issuers.cert-manager.io orders.acme.cert-manager.ioCopy to Clipboard Copied! Toggle word wrap Toggle overflow Example output:
Copy to Clipboard Copied! Toggle word wrap Toggle overflow Delete the namespaces owned by the cert-manager Operator:
oc delete project openshift-cert-manager openshift-cert-manager-operator
$ oc delete project openshift-cert-manager openshift-cert-manager-operatorCopy to Clipboard Copied! Toggle word wrap Toggle overflow Example output:
project.project.openshift.io "openshift-cert-manager" deleted
project.project.openshift.io "openshift-cert-manager-operator" deleted
project.project.openshift.io "openshift-cert-manager" deleted
project.project.openshift.io "openshift-cert-manager-operator" deleted
Copy to Clipboard Copied! Toggle word wrap Toggle overflow
Additional information
Chapter 8. Upgrading Service Telemetry Framework to version 1.5
To upgrade Service Telemetry Framework (STF) 1.4 to STF 1.5, you must complete the following steps:
- Replace AMQ Certificate Manager with Certificate Manager.
-
Remove the
ClusterServiceVersionandSubscriptionobjects for Smart Gateway Operator and Service Telemetry Operator in theservice-telemetrynamespace on your Red Hat OpenShift Container Platform environment. - Upgrade Red Hat OpenShift Container Platform from 4.8 to 4.10.
- Re-enable the operators that you removed.
- Update the AMQ Interconnect CA Certificate on Red Hat OpenStack Platform (RHOSP).
Prerequisites
-
You have backed up your data. There is an outage during the Red Hat OpenShift Container Platform upgrade. You cannot reconfigure the
ServiceTelemetryandSmartGatewayobjects during the Operators replacement. - You have prepared your environment for upgrade from Red Hat OpenShift Container Platform 4.8 to the supported version, 4.10.
- The Red Hat OpenShift Container Platform cluster is fully-connected. STF does not support disconnected or restricted-network clusters.
8.1. Removing the Service Telemetry Framework 1.4 Operators
Remove the Service Telemetry Framework (STF) 1.4 Operators and the AMQ Certificate Manager Operator from the Red Hat OpenShift Container Platform 4.8.
Procedure
- Remove the Service Telemetry Operator.
- Remove the Smart Gateway Operator.
- Remove the AMQ Certificate Manager Operator.
- Remove the Grafana Operator.
8.1.1. Removing the Service Telemetry Operator
As part of upgrading your Service Telemetry Framework (STF) installation, you must remove the Service Telemetry Operator in the service-telemetry namespace on your Red Hat OpenShift Container Platform environment.
Procedure
Change to the
service-telemetryproject:oc project service-telemetry
$ oc project service-telemetryCopy to Clipboard Copied! Toggle word wrap Toggle overflow Remove the Service Telemetry Operator Subscription:
oc delete sub --selector=operators.coreos.com/service-telemetry-operator.service-telemetry

subscription.operators.coreos.com "service-telemetry-operator" deleted
$ oc delete sub --selector=operators.coreos.com/service-telemetry-operator.service-telemetry

subscription.operators.coreos.com "service-telemetry-operator" deleted
Copy to Clipboard Copied! Toggle word wrap Toggle overflow Remove the Service Telemetry Operator
ClusterServiceVersion:oc delete csv --selector=operators.coreos.com/service-telemetry-operator.service-telemetry clusterserviceversion.operators.coreos.com "service-telemetry-operator.v1.4.1669718959" deleted
$ oc delete csv --selector=operators.coreos.com/service-telemetry-operator.service-telemetry

clusterserviceversion.operators.coreos.com "service-telemetry-operator.v1.4.1669718959" deleted
Copy to Clipboard Copied! Toggle word wrap Toggle overflow
Verification
Verify that the Service Telemetry Operator deployment is not running:
oc get deploy --selector=operators.coreos.com/service-telemetry-operator.service-telemetry

No resources found in service-telemetry namespace.
$ oc get deploy --selector=operators.coreos.com/service-telemetry-operator.service-telemetry

No resources found in service-telemetry namespace.
Copy to Clipboard Copied! Toggle word wrap Toggle overflow Verify the Service Telemetry Operator subscription is absent:
oc get sub --selector=operators.coreos.com/service-telemetry-operator.service-telemetry

No resources found in service-telemetry namespace.
$ oc get sub --selector=operators.coreos.com/service-telemetry-operator.service-telemetry

No resources found in service-telemetry namespace.
Copy to Clipboard Copied! Toggle word wrap Toggle overflow Verify the Service Telemetry Operator ClusterServiceVersion is absent:
oc get csv --selector=operators.coreos.com/service-telemetry-operator.service-telemetry

No resources found in service-telemetry namespace.
$ oc get csv --selector=operators.coreos.com/service-telemetry-operator.service-telemetry

No resources found in service-telemetry namespace.
Copy to Clipboard Copied! Toggle word wrap Toggle overflow
8.1.2. Removing the Smart Gateway Operator
As part of upgrading your Service Telemetry Framework (STF) installation, you must remove the Smart Gateway Operator in the service-telemetry namespace on your Red Hat OpenShift Container Platform environment.
Procedure
Change to the
service-telemetryproject:oc project service-telemetry
$ oc project service-telemetryCopy to Clipboard Copied! Toggle word wrap Toggle overflow Remove the Smart Gateway Operator Subscription:
oc delete sub --selector=operators.coreos.com/smart-gateway-operator.service-telemetry

subscription.operators.coreos.com "smart-gateway-operator-stable-1.4-redhat-operators-openshift-marketplace" deleted
$ oc delete sub --selector=operators.coreos.com/smart-gateway-operator.service-telemetry

subscription.operators.coreos.com "smart-gateway-operator-stable-1.4-redhat-operators-openshift-marketplace" deleted
Copy to Clipboard Copied! Toggle word wrap Toggle overflow Remove the Smart Gateway Operator
ClusterServiceVersion:oc delete csv --selector=operators.coreos.com/smart-gateway-operator.service-telemetry clusterserviceversion.operators.coreos.com "smart-gateway-operator.v4.0.1669718962" deleted
$ oc delete csv --selector=operators.coreos.com/smart-gateway-operator.service-telemetry

clusterserviceversion.operators.coreos.com "smart-gateway-operator.v4.0.1669718962" deleted
Copy to Clipboard Copied! Toggle word wrap Toggle overflow
Verification
Verify that the Smart Gateway Operator deployment is not running:
oc get deploy --selector=operators.coreos.com/smart-gateway-operator.service-telemetry

No resources found in service-telemetry namespace.
$ oc get deploy --selector=operators.coreos.com/smart-gateway-operator.service-telemetry

No resources found in service-telemetry namespace.
Copy to Clipboard Copied! Toggle word wrap Toggle overflow Verify the Smart Gateway Operator subscription is absent:
oc get sub --selector=operators.coreos.com/smart-gateway-operator.service-telemetry

No resources found in service-telemetry namespace.
$ oc get sub --selector=operators.coreos.com/smart-gateway-operator.service-telemetry

No resources found in service-telemetry namespace.
Copy to Clipboard Copied! Toggle word wrap Toggle overflow Verify the Smart Gateway Operator ClusterServiceVersion is absent:
oc get csv --selector=operators.coreos.com/smart-gateway-operator.service-telemetry

No resources found in service-telemetry namespace.
$ oc get csv --selector=operators.coreos.com/smart-gateway-operator.service-telemetry

No resources found in service-telemetry namespace.
Copy to Clipboard Copied! Toggle word wrap Toggle overflow
8.1.3. Removing the AMQ Certificate Manager Operator
Procedure
Remove the AMQ Certificate Manager Operator Subscription:
oc delete sub --namespace openshift-operators --selector=operators.coreos.com/amq7-cert-manager-operator.openshift-operators

subscription.operators.coreos.com "amq7-cert-manager-operator" deleted
$ oc delete sub --namespace openshift-operators --selector=operators.coreos.com/amq7-cert-manager-operator.openshift-operators

subscription.operators.coreos.com "amq7-cert-manager-operator" deleted
Copy to Clipboard Copied! Toggle word wrap Toggle overflow Remove the AMQ Certificate Manager Operator
ClusterServiceVersion:oc delete csv --namespace openshift-operators --selector=operators.coreos.com/amq7-cert-manager-operator.openshift-operators clusterserviceversion.operators.coreos.com "amq7-cert-manager.v1.0.11" deleted
$ oc delete csv --namespace openshift-operators --selector=operators.coreos.com/amq7-cert-manager-operator.openshift-operators

clusterserviceversion.operators.coreos.com "amq7-cert-manager.v1.0.11" deleted
Copy to Clipboard Copied! Toggle word wrap Toggle overflow
Verification
Verify that the AMQ Certificate Manager Operator deployment is not running:
oc get deploy --namespace openshift-operators --selector=operators.coreos.com/amq7-cert-manager-operator.openshift-operators No resources found in openshift-operators namespace.
$ oc get deploy --namespace openshift-operators --selector=operators.coreos.com/amq7-cert-manager-operator.openshift-operators No resources found in openshift-operators namespace.Copy to Clipboard Copied! Toggle word wrap Toggle overflow Verify that the AMQ Certificate Manager Operator subscription is absent:
oc get sub --namespace openshift-operators --selector=operators.coreos.com/amq7-cert-manager-operator.service-telemetry No resources found in openshift-operators namespace.
$ oc get sub --namespace openshift-operators --selector=operators.coreos.com/amq7-cert-manager-operator.service-telemetry No resources found in openshift-operators namespace.Copy to Clipboard Copied! Toggle word wrap Toggle overflow Verify that the AMQ Certificate Manager Operator Cluster Service Version is absent:
oc get csv --namespace openshift-operators --selector=operators.coreos.com/amq7-cert-manager-operator.openshift-operators No resources found in openshift-operators namespace.
$ oc get csv --namespace openshift-operators --selector=operators.coreos.com/amq7-cert-manager-operator.openshift-operators No resources found in openshift-operators namespace.Copy to Clipboard Copied! Toggle word wrap Toggle overflow
8.1.4. Removing the Grafana Operator
Procedure
Remove the Grafana Operator Subscription:
oc delete sub --selector=operators.coreos.com/grafana-operator.service-telemetry subscription.operators.coreos.com "grafana-operator" deleted
$ oc delete sub --selector=operators.coreos.com/grafana-operator.service-telemetry subscription.operators.coreos.com "grafana-operator" deletedCopy to Clipboard Copied! Toggle word wrap Toggle overflow Remove the Grafana Operator
ClusterServiceVersion:oc delete csv --selector=operators.coreos.com/grafana-operator.service-telemetry clusterserviceversion.operators.coreos.com "grafana-operator.v3.10.3" deleted
$ oc delete csv --selector=operators.coreos.com/grafana-operator.service-telemetry clusterserviceversion.operators.coreos.com "grafana-operator.v3.10.3" deletedCopy to Clipboard Copied! Toggle word wrap Toggle overflow
Verification
Verify the Grafana Operator deployment is not running:
oc get deploy --selector=operators.coreos.com/grafana-operator.service-telemetry No resources found in service-telemetry namespace.
$ oc get deploy --selector=operators.coreos.com/grafana-operator.service-telemetry No resources found in service-telemetry namespace.Copy to Clipboard Copied! Toggle word wrap Toggle overflow Verify the Grafana Operator subscription is absent:
oc get sub --selector=operators.coreos.com/grafana-operator.service-telemetry No resources found in service-telemetry namespace.
$ oc get sub --selector=operators.coreos.com/grafana-operator.service-telemetry No resources found in service-telemetry namespace.Copy to Clipboard Copied! Toggle word wrap Toggle overflow Verify the Grafana Operator Cluster Service Version is absent:
oc get csv --selector=operators.coreos.com/grafana-operator.service-telemetry No resources found in service-telemetry namespace.
$ oc get csv --selector=operators.coreos.com/grafana-operator.service-telemetry No resources found in service-telemetry namespace.Copy to Clipboard Copied! Toggle word wrap Toggle overflow
8.2. Upgrading Red Hat OpenShift Container Platform to 4.10
Service Telemetry Framework (STF) 1.5 is only compatible with Red Hat OpenShift Container Platform 4.10. For more information about upgrading your Red Hat OpenShift Container Platform from 4.8 to 4.10, see Updating clusters overview.
Prerequisites
- You removed the STF 1.4 Operators.
- You removed the AMQ Certificate Manager Operator and Grafana Operator. You must remove the Operators before you upgrade Red Hat OpenShift Container Platform because the Operator APIs are incompatible with 4.10. For more information about preparing your Red Hat OpenShift Container Platform for upgrade from 4.8 to 4.10, see Understanding OpenShift Container Platform updates.
Verify the suitability of your Red Hat OpenShift Container Platform upgrade:
oc adm upgrade
$ oc adm upgradeCopy to Clipboard Copied! Toggle word wrap Toggle overflow You cannot upgrade the cluster if you encounter the following error message:
Cluster operator operator-lifecycle-manager should not be upgraded between minor versions: ClusterServiceVersions blocking cluster upgrade: service-telemetry/grafana-operator.v3.10.3 is incompatible with OpenShift minor versions greater than 4.8,openshift-operators/amq7-cert-manager.v1.0.11 is incompatible with OpenShift minor versions greater than 4.8
Cluster operator operator-lifecycle-manager should not be upgraded between minor versions: ClusterServiceVersions blocking cluster upgrade: service-telemetry/grafana-operator.v3.10.3 is incompatible with OpenShift minor versions greater than 4.8,openshift-operators/amq7-cert-manager.v1.0.11 is incompatible with OpenShift minor versions greater than 4.8Copy to Clipboard Copied! Toggle word wrap Toggle overflow
8.3. Installing the Service Telemetry Framework 1.5 Operators
Install the Service Telemetry Framework (STF) 1.5 Operators and the Certificate Manager for OpenShift Operator on your Red Hat OpenShift Container Platform environment. See Section 1.1, “Support for Service Telemetry Framework” for more information about STF support status and life cycle.
After a successful STF 1.5 install, you must retrieve and apply the AMQ Interconnect CA certificate to the Red Hat OpenStack Platform environment, or the transport layer and telemetry data becomes unavailable.
For more information about updating the AMQ Interconnect CA certificate, see Section 8.4, “Updating the AMQ Interconnect CA Certificate on Red Hat OpenStack Platform”.
Prerequisites
- You have upgraded your Red Hat OpenShift Container Platform environment to 4.10. For more information about upgrading Red Hat OpenShift Container Platform, see Section 8.2, “Upgrading Red Hat OpenShift Container Platform to 4.10”.
- Your Red Hat OpenShift Container Platform environment network is fully-connected.
Procedure
Change to the
service-telemetryproject:oc project service-telemetry
$ oc project service-telemetryCopy to Clipboard Copied! Toggle word wrap Toggle overflow Create a
namespacefor thecert-managerOperator:Copy to Clipboard Copied! Toggle word wrap Toggle overflow Create an
OperatorGroupfor the cert-manager Operator:Copy to Clipboard Copied! Toggle word wrap Toggle overflow Subscribe to the
cert-managerOperator with theredhat-operatorsCatalogSource:Copy to Clipboard Copied! Toggle word wrap Toggle overflow Validate your
ClusterServiceVersion. Ensure that the phase ofcert-managerOperator isSucceeded:oc get csv --namespace openshift-cert-manager-operator --selector=operators.coreos.com/openshift-cert-manager-operator.openshift-cert-manager-operator NAME DISPLAY VERSION REPLACES PHASE openshift-cert-manager.v1.7.1 cert-manager Operator for Red Hat OpenShift 1.7.1-1 Succeeded
$ oc get csv --namespace openshift-cert-manager-operator --selector=operators.coreos.com/openshift-cert-manager-operator.openshift-cert-manager-operator NAME DISPLAY VERSION REPLACES PHASE openshift-cert-manager.v1.7.1 cert-manager Operator for Red Hat OpenShift 1.7.1-1 SucceededCopy to Clipboard Copied! Toggle word wrap Toggle overflow - Optional: Resubscribe to the Grafana Operator. For more information, see: test Section 5.1.1, “Configuring Grafana to host the dashboard”.
Create the Service Telemetry Operator subscription to manage the STF instances:
Copy to Clipboard Copied! Toggle word wrap Toggle overflow Validate the Service Telemetry Operator and the dependent operators:
Copy to Clipboard Copied! Toggle word wrap Toggle overflow
Verification
Verify that the Service Telemetry Operator has successfully reconciled.
Copy to Clipboard Copied! Toggle word wrap Toggle overflow
8.4. Updating the AMQ Interconnect CA Certificate on Red Hat OpenStack Platform
After you upgrade to Service Telemetry Framework (STF) v1.5, the CA certificate for AMQ Interconnect regenerates. In STF v1.4 the CA certificate for AMQ Interconnect is valid for three months and must be updated periodically in Red Hat OpenStack Platform (RHOSP). In STF v1.5, the generated certificates are valid for the lifetime of the RHOSP lifecycle, 70080 hours by default.
Prerequisites
- You have successfully installed STF v1.5 and updated the CA certificate for AMQ Interconnect.
Procedure
- For more information about how to update the CA certificate in your RHOSP environment, see Chapter 6, Renewing the AMQ Interconnect certificate