Operational Measurements
Tracking physical and virtual resources, and collecting metrics
Abstract
Chapter 1. Introduction to operational measurements
With the components of the Telemetry service in the Red Hat OpenStack Platform environment, you can track physical and virtual resources, and collect metrics such as CPU usage and resource availability in your deployment with a data collection daemon that stores the aggregates on a Gnocchi backend.
1.1. Understanding operational measurements
Use operational tools to help you measure and maintain your Red Hat OpenStack Platform environment. These measuring tools perform the following functions:
- Availability monitoring: Monitors all components in the Red Hat OpenStack Platform (RHOSP) environment and determines if any components are currently experiencing outages or are not functional. You can also configure the system to alert you when problems are identified.
- Performance monitoring: Collects system information periodically and provides a mechanism to store and monitor the values in a variety of ways using a data collecting daemon. This daemon stores the data it collects, for example operating system and log files, or makes the data available over the network. You can use statistics gathered from the data to monitor systems, find performance bottlenecks, and predict future system load.
1.2. Telemetry architecture
Red Hat OpenStack Platform (RHOSP) Telemetry provides user-level usage data for OpenStack-based clouds. You can use the data for customer billing, system monitoring, or alerts. You can configure Telemetry components to collect data from notifications sent by existing RHOSP components, such as Compute usage events, or by polling RHOSP infrastructure resources, such as libvirt. Telemetry publishes collected data to various targets including data stores and message queues.
Telemetry consists of the following components:
- Data collection: Telemetry uses Ceilometer to gather metric and event data. For more information, see Section 1.3.1, “Ceilometer”.
- Storage: Telemetry stores metric data in Gnocchi and event data in Panko. For more information, see Section 1.4, “Storage with Gnocchi”.
- Alarm service: Telemetry uses Aodh to trigger actions based on defined rules against metric or event data collected by Ceilometer.
When you have gathered the data, you can use a third-party tool, for example Red Hat Cloudforms, to display and analyze metric data, and you can use the alarm service Aodh to configure alarms for events.
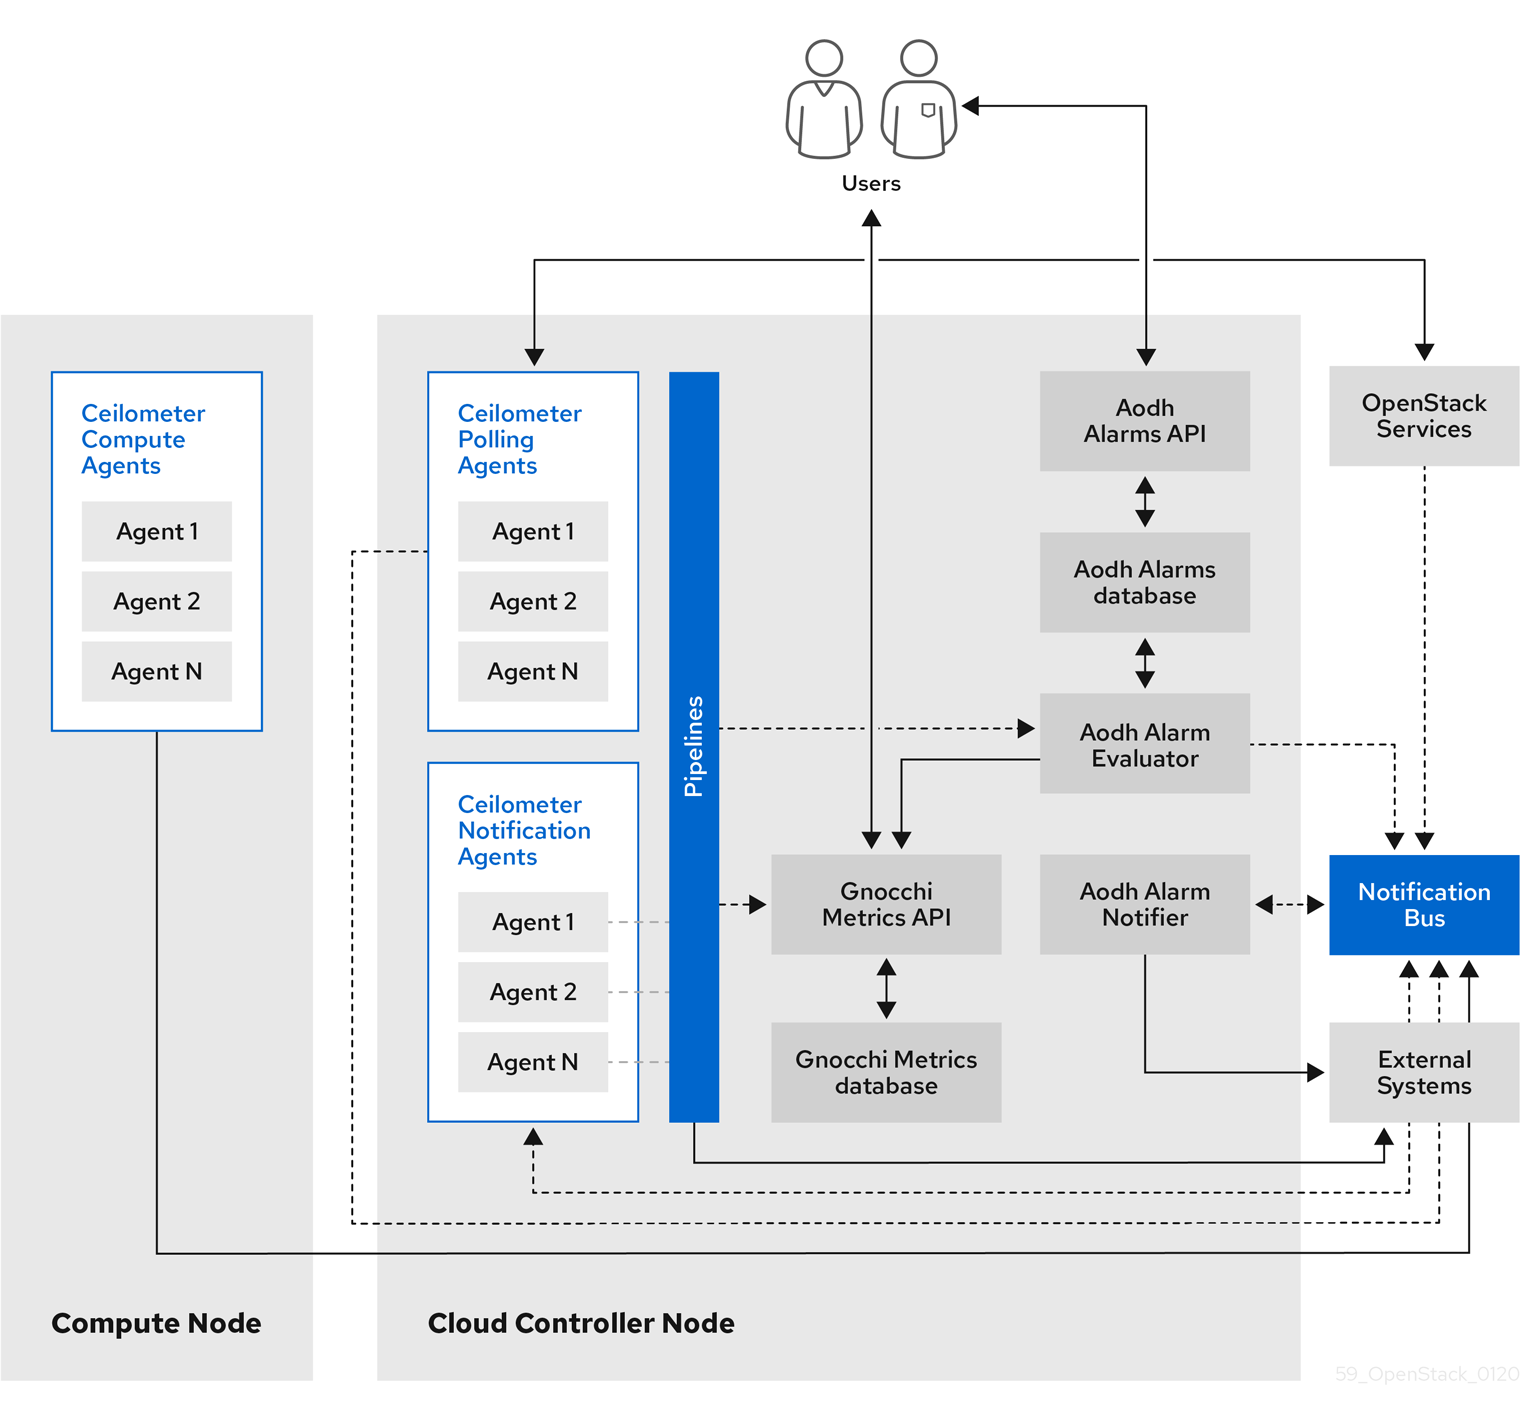
Figure 1.1. Telemetry architecture
1.3. Data collection
Red Hat OpenStack Platform (RHOSP) supports two types of data collection:
- collectd for infrastructure monitoring. For more information, see Section 1.3.2, “collectd”.
- Ceilometer for the OpenStack component-level monitoring. For more information, see Section 1.3.1, “Ceilometer”.
1.3.1. Ceilometer
Ceilometer is the default data collection component of the OpenStack Telemetry service that provides the ability to normalize and transform data across all of the current OpenStack core components. Ceilometer collects metering and event data relating to OpenStack services. Collected data is accessible to users based on the deployment configuration.
The Ceilometer service uses three agents to collect data from Red Hat OpenStack Platform (RHOSP) components:
-
A compute agent (ceilometer-agent-compute): Runs on each Compute node and polls for resource utilization statistics. This agent is the same as polling agent
ceilometer-pollingrunning with parameter--polling namespace-compute. -
A central agent (ceilometer-agent-central): Runs on a central management server to poll for resource utilization statistics for resources not tied to instances or compute nodes. You can start multiple agents to scale service horizontally. This is the same as polling agent
ceilometer-pollingrunning with parameter--polling namespace-central. - A notification agent (ceilometer-agent-notification): Runs on a central management server and consumes messages from the message queues to build event and metering data. Data is then published to defined targets. By default, the data is pushed to Gnocchi. These services communicate using the RHOSP notification bus.
The Ceilometer agents use publishers to send data to the corresponding end points, for example Gnocchi. You can configure this information in the pipeline.yaml file.
Additional resources
- For more information about publishers, see Section 1.3.1.1, “Publishers”.
1.3.1.1. Publishers
The Telemetry service provides several transport methods to transfer the data collected to an external system. The consumers of this data are different, for example, monitoring systems, for which data loss is acceptable, and billing systems, which require reliable data transportation. Telemetry provides methods to fulfil the requirements of both system types. You can use the publisher component of the service to save the data into persistent storage through the message bus or to send it to one or more external consumers. One chain can contain multiple publishers.
The following publisher types are supported:
- Gnocchi (default): When the Gnocchi publisher is enabled, measurement and resource information is pushed to Gnocchi for time-series optimized storage. Ensure that you register Gnocchi in the Identity service as Ceilometer discovers the exact path through the Identity service.
-
panko: You can store event data from Ceilometer in panko, which provides an HTTP REST interface to query system events in Red Hat OpenStack Platform. To push data to panko, set the publisher to
direct://?dispatcher=panko.
1.3.1.1.1. Configuring publisher parameters
You can configure the multi-publisher for each data point within the Telemetry service, allowing the same technical meter or event to be published multiple times to multiple destinations, each potentially using a different transport method.
Procedure
Create a YAML file to describe the possible publisher parameters and defaults, for example,
ceilometer-publisher.yaml. Insert the following parameters inparameter_defaults:parameter_defaults: ManagePipeline: true ManageEventPipeline: true EventPipelinePublishers: - gnocchi://?archive_policy=high PipelinePublishers: - gnocchi://?archive_policy=highDeploy your customised overcloud. There are two ways to deploy the overcloud:
Include the modified YAML files in the
openstack overcloud deploycommand to define a publisher. In the following example, replace<environment-files>with the other YAML files that you want to include in the deployment:$ openstack overcloud deploy --templates \ -e /home/custom/ceilometer-publisher.yaml -e <environment-files>Create a YAML file to include all of your local modifications, for example,
local_modifications.yaml. You can use a script to execute the deployment, as shown in the following example:$ sh deploy.sh: #!/bin/bash openstack overcloud deploy -e <environment-files> \ -e local_modifications.yaml \ ....
Additional resources
- For more information about parameters, see Telemetry parameters in the Overcloud Parameters guide and Parameters in the Advanced Overcloud Customization guide.
1.3.2. collectd
Performance monitoring collects system information periodically and provides a mechanism to store and monitor the values in a variety of ways using a data collecting agent. Red Hat supports the collectd daemon as a data collection agent. This daemon stores the data in a time-series database. One of the Red Hat supported databases is called Gnocchi. You can use this stored data to monitor systems, find performance bottlenecks, and predict future system load.
Additional resources
- For more information about Gnocchi, see Section 1.4, “Storage with Gnocchi”.
- For more information about collectd, see Section 3.1, “Installing collectd”.
1.4. Storage with Gnocchi
Gnocchi is an open-source time-series database. It stores metrics at a very large scale and provides access to metrics and resources to operators and users. Gnocchi uses an archive policy to define which aggregations to compute and how many aggregates to retain; and an indexer driver to store the index of all resources, archive policies, and metrics.
1.4.1. Archive policies: Storing both short and long-term data in a time-series database
An archive policy defines which aggregations to compute and how many aggregates to retain. Gnocchi supports different aggregation methods, such as minimum, maximum, average, Nth percentile, and standard deviation. These aggregations are computed over a period of time called granularity and retained for a specific timespan.
The archive policy defines how the metrics are aggregated and for how long they are stored. Each archive policy is defined as the number of points over a timespan.
For example, if your archive policy defines a policy of 10 points with a granularity of 1 second, the time-series archive keeps up to 10 seconds, each representing an aggregation over 1 second. This means that the time series, at a maximum, retains 10 seconds of data between the more recent point and the older point.
The archive policy also defines which aggregate methods are used. The default is set to the parameter default_aggregation_methods whose values by default are set to mean, min, max. sum, std, count. So, depending on the use case, the archive policy and the granularity vary.
Additional resources
- For more information about archive policies, see Planning and managing archive policies.
1.4.2. Indexer driver
The indexer is responsible for storing the index of all resources, archive policies, and metrics along with their definitions, types, and properties. It is also responsible for linking resources with metrics. Red Hat OpenStack Platform director installs the indexer driver by default. You need a database to index all the resources and metrics that Gnocchi handles. The supported driver is MySQL.
1.4.3. Gnocchi Metric-as-a-Service terminology
This table contains definitions of the commonly used terms for the Metric-as-a-Service features.
| Term | Definition |
|---|---|
| Aggregation method | A function used to aggregate multiple measures into an aggregate. For example, the min aggregation method aggregates the values of different measures to the minimum value of all the measures in the time range. |
| Aggregate | A data point tuple generated from several measures according to the archive policy. An aggregate is composed of a timestamp and a value. |
| Archive policy | An aggregate storage policy attached to a metric. An archive policy determines how long aggregates are kept in a metric and how aggregates are aggregated (the aggregation method). |
| Granularity | The time between two aggregates in an aggregated time series of a metric. |
| Measure | An incoming data point tuple sent to the Time series database by the API. A measure is composed of a timestamp and a value. |
| Metric | An entity storing aggregates identified by an UUID. A metric can be attached to a resource using a name. How a metric stores its aggregates is defined by the archive policy to which the metric is associated. |
| Resource | An entity representing anything in your infrastructure that you associate a metric with. A resource is identified by a unique ID and can contain attributes. |
| Time series | A list of aggregates ordered by time. |
| Timespan | The time period for which a metric keeps its aggregates. It is used in the context of archive policy. |
1.5. Displaying metric data
You can use the following tools to display and analyze metric data:
- Grafana: An open source metric analytics and visualization suite. Grafana is most commonly used for visualizing time series data for infrastructure and application analytics.
- Red Hat CloudForms: An infrastructure management platform that IT departments use to control the self-service abilities of users to provision, manage, and ensure compliance across virtual machines and private clouds.
Additional resources
- For more information about Grafana, see Section 1.5.1, “Using and connecting Grafana to display data”.
- For more information about Red Hat Cloudforms, see the product documentation.
1.5.1. Using and connecting Grafana to display data
You can use third-party software, for example Grafana, to view a graphical representation of the metrics gathered and stored.
Grafana is an open source metric analytics, monitoring, and visualization suite. To install and configure Grafana, see the official Grafana documentation.
Chapter 2. Planning for operational measurements
The resources that you monitor depend on your business requirements. You can use Ceilometer or collectd to monitor your resources.
- For more information on collectd measurements, see Section 2.2, “Collectd measurements”.
- For more information on Ceilometer measurements, see Section 2.1, “Ceilometer measurements”.
2.1. Ceilometer measurements
For a full list of Ceilometer measures, see https://docs.openstack.org/ceilometer/queens/admin/telemetry-measurements.html
2.2. Collectd measurements
The following measurements are the most commonly used collectd metrics:
- disk
- interface
- load
- memory
- processes
- tcpconns
For a full list of measurements, see collectd metrics and events.
2.3. Monitoring Gnocchi and Ceilometer performance
You can use the openstack metric command to manage archive policies, benchmarks, measures, metrics, and resources on your deployment.
Procedure
On the command line, enter
openstack metric statusto monitor the Gnocchi installation on your deployment and to check the status of the measurements:(overcloud) [stack@undercloud-0 ~]$ openstack metric status +-----------------------------------------------------+-------+ | Field | Value | +-----------------------------------------------------+-------+ | storage/number of metric having measures to process | 0 | | storage/total number of measures to process | 0 | +-----------------------------------------------------+-------+
2.4. Planning for data storage
Gnocchi stores a collection of data points, where each data point is an aggregate. The storage format is compressed using different techniques. As a result, to calculate the size of a time-series database, you estimate the size based on the worst-case scenario.
Procedure
Calculate the number of data points:
number of points = timespan / granularity
For example, if you want to retain a year of data with one-minute resolution, use the formula:
number of data points = (365 days X 24 hours X 60 minutes) / 1 minute number of data points = 525600
Calculate the size of the time-series database:
size in bytes = number of data points X 8 bytes
If you apply this formula to the example, the result is 4.1 MB:
size in bytes = 525600 points X 8 bytes = 4204800 bytes = 4.1 MB
This value is an estimated storage requirement for a single aggregated time-series database. If your archive policy uses multiple aggregation methods (min, max, mean, sum, std, count), multiply this value by the number of aggregation methods you use.
Additional resources
- For more information, see Section 1.4.1, “Archive policies: Storing both short and long-term data in a time-series database”.
2.5. Planning and managing archive policies
An archive policy defines how you aggregate the metrics and for how long you store the metrics in the time-series database. An archive policy is defined as the number of points over a timespan.
If your archive policy defines a policy of 10 points with a granularity of 1 second, the time series archive keeps up to 10 seconds, each representing an aggregation over 1 second. This means that the time series retains, at a maximum, 10 seconds of data between the more recent point and the older point. The archive policy also defines the aggregate method to use. The default is set to the parameter default_aggregation_methods, where the default values are set to mean, min, max. sum, std, count. So, depending on the use case, the archive policy and the granularity can vary.
To plan an archive policy, ensure that you are familiar with the following concepts:
- Metrics. For more information, see Section 2.5.1, “Metrics”.
- Measures. For more information, see Section 2.5.2, “Creating custom measures”.
- Aggregation. For more information, see Section 2.5.4, “Calculating the size of a time-series aggregate”.
- Metricd workers. For more information, see Section 2.5.5, “Metricd workers”.
To create and manage an archive police, complete the following tasks:
- Create an archive policy. For more information, see Section 2.5.6, “Creating an archive policy”.
- Manage an archive policy. For more information, see Section 2.5.7, “Managing archive policies”.
- Create an archive policy rule. For more information, see Section 2.5.8, “Creating an archive policy rule”.
2.5.1. Metrics
Gnocchi provides an object type called metric. A metric is anything that you can measure, for example, the CPU usage of a server, the temperature of a room, or the number of bytes sent by a network interface. A metric has the following properties:
- A UUID to identify it
- A name
- The archive policy used to store and aggregate the measures
Additional resources
- For terminology definitions, see Gnocchi Metric-as-a-Service terminology.
2.5.1.1. Creating a metric
Procedure
Create a resource. Replace <resource_name> with the name of the resource:
$ openstack metric resource create <resource_name>Create the metric. Replace <resource_name> with the name of the resource and <metric_name> with the name of the metric:
$ openstack metric metric create -r <resource_name> <metric_name>When you create the metric, the archive policy attribute is fixed and unchangeable. You can change the definition of the archive policy through the
archive_policyendpoint.
2.5.2. Creating custom measures
A measure is an incoming datapoint tuple that the API sends to Gnocchi. It is composed of a timestamp and a value. You can create your own custom measures.
Procedure
Create a custom measure:
$ openstack metric measures add -m <MEASURE1> -m <MEASURE2> .. -r <RESOURCE_NAME> <METRIC_NAME>
2.5.3. Default archive policies
By default, Gnocchi has the following archive policies:
low
- 5 minutes granularity over 30 days
-
aggregation methods used:
default_aggregation_methods - maximum estimated size per metric: 406 KiB
medium
- 1 minute granularity over 7 days
- 1 hour granularity over 365 days
-
aggregation methods used:
default_aggregation_methods - maximum estimated size per metric: 887 KiB
high
- 1 second granularity over 1 hour
- 1 minute granularity over 1 week
- 1 hour granularity over 1 year
-
aggregation methods used:
default_aggregation_methods - maximum estimated size per metric: 1 057 KiB
bool
- 1 second granularity over 1 year
- aggregation methods used: last
- maximum optimistic size per metric: 1 539 KiB
- maximum pessimistic size per metric: 277 172 KiB
2.5.4. Calculating the size of a time-series aggregate
Gnocchi stores a collection of data points, where each point is an aggregate. The storage format is compressed using different techniques. As a result, calculating the size of a time-series is estimated based on a worst case scenario, as shown in the following example.
Procedure
Use this formula to calculate the number of points:
number of points = timespan / granularity
For example, if you want to keep a year of data with one-minute resolution:
number of points = (365 days X 24 hours X 60 minutes) / 1 minute
number of points = 525600
To calculate the point size in bytes, use this formula:
size in bytes = number of points X 8 bytes
size in bytes = 525600 points X 8 bytes = 4204800 bytes = 4.1 MB
This value is an estimated storage requirement for a single aggregated time-series. If your archive policy uses multiple aggregation methods - min, max, mean, sum, std, count - multiply this value by the number of aggregation methods you use.
2.5.5. Metricd workers
You can use the metricd daemon to processes measures, create aggregates, store measures in aggregate storage and delete metrics. The metricd daemon is responsible for most CPU usage and I/O jobs in Gnocchi. The archive policy of each metric determines how fast the metricd daemon performs. Metricd checks the incoming storage for new measures periodically. To configure the delay between each check, you can use the [metricd]metric_processing_delay configuration option.
2.5.6. Creating an archive policy
Procedure
Create an archive policy. Replace <archive-policy-name> with the name of the policy and <aggregation-method> with the method of aggregation.
# openstack metric archive policy create <archive-policy-name> --definition <definition> \ --aggregation-method <aggregation-method>Note<definition> is the policy definition. Separate multiple attributes with a comma (,). Separate the name and value of the archive policy definition with a colon (:).
2.5.7. Managing archive policies
To delete an archive policy:
openstack metric archive policy delete <archive-policy-name>To view all archive policies:
# openstack metric archive policy listTo view the details of an archive policy:
# openstack metric archive-policy show <archive-policy-name>
2.5.8. Creating an archive policy rule
An archive policy rule defines a mapping between a metric and an archive policy. This gives users the ability to predefine rules so an archive policy is assigned to metrics based on a matched pattern.
Procedure
Create an archive policy rule. Replace <rule-name> with the name of the rule and <archive-policy-name> with the name of the archive policy:
# openstack metric archive-policy-rule create <rule-name> /
--archive-policy-name  <archive-policy-name>
Chapter 3. Installing and configuring operational measurement tools
You must install the data collecting agent, collectd, and the time-series database, Gnocchi.
3.1. Installing collectd
When you install collectd, you can configure multiple collectd plug-ins to suit your environment.
Procedure
-
Copy the file
/usr/share/openstack-tripleo-heat-templates/environments/collectd-environment.yamlto your local directory. Open
collectd-environment.yamland list the plug-ins you want underCollectdExtraPlugins. You can also provide parameters in theExtraConfigsection:parameter_defaults: CollectdExtraPlugins: - disk - df - virt ExtraConfig: collectd::plugin::virt::connection: "qemu:///system" collectd::plugin::virt::hostname_format: "hostname uuid"By default, collectd comes with the
disk,interface,load,memory,processes, andtcpconnsplug-ins. You can add additional plug-ins using theCollectdExtraPluginsparameter. You can also provide additional configuration information for the CollectdExtraPlugins using theExtraConfigoption as shown. This example adds thevirtplug-in and configures the connection string and the hostname format.Include the modified YAML files in the
openstack overcloud deploycommand to install the collectd daemon on all overcloud nodes:$ openstack overcloud deploy --templates \/home/templates/environments/collectd.yaml \ -e /path-to-copied/collectd-environment.yaml
Additional resources
- For more information about collectd, see Section 1.3.2, “collectd”.
- To view the collectd plug-ins and configurations, see collectd plug-ins in the Service Telemetry Framework guide.
3.2. Installing Gnocchi
By default, Gnocchi is not enabled on the undercloud. Red Hat does not recommend that you enable Telemetry on the undercloud as it generates a lot of data that the undercloud cannot handle due to limited resources and single point of failure.
By default, Telemetry and Gnocchi are installed on the controller and Compute nodes. The default storage back end for Gnocchi is file.
You can deploy Gnocchi on the overcloud in one of two ways:
- Internally. For more information, see Section 3.2.1, “Deploying Gnocchi internally”.
- Externally. For more information, see Section 3.2.2, “Deploying Gnocchi externally”.
3.2.1. Deploying Gnocchi internally
The default deployment is internal.
Procedure
-
To deploy collectd to send metrics data to internal Gnocchi, add
/usr/share/openstack-tripleo-heat-templates/environments/services/collectd.yamlto theovercloud deploycommand.
Additional resources
- For more information, see Section 3.1, “Installing collectd”.
3.2.2. Deploying Gnocchi externally
Procedure
Create a custom YAML file in your local directory, for example
ExternalGnocchi.yaml, and ensure that you include the following details:CollectdGnocchiServer: <IPofExternalServer> CollectdGnocchiUser: admin CollectdGnocchiAuth: basicTo deploy Gnocchi, add the custom YAML file to the
overcloud deploycommand. Replace<existing_overcloud_environment_files>with the list of environment files that are part of your existing deployment.openstack overcloud deploy \ -e <existing_overcloud_environment_files> \ -e /usr/share/openstack-tripleo-heat-templates/environments/services/collectd.yaml \ -e /home/templates/environments/ExternalGnocchi.yaml \ ...NoteYou can find all of the Gnocchi parameters in the following YAML file:
/usr/share/openstack-tripleo-heat-templates/puppet/services/metrics/collectd.yaml
3.2.3. Verifying the Gnocchi deployment
Procedure
List the new resources and metrics:
$ (overcloud) [stack@undercloud-0 ~]$ openstack metric  metric list |more
+--------------------------------------+---------------------+--------------------------------------------------+------+-------------------------------------+
| id                            | archive_policy/name | name                                   | unit | resource_id                      	|
+--------------------------------------+---------------------+--------------------------------------------------+------+-------------------------------------+
| 001715fe-8ad1-4f21-b0fa-1dee2b1c8201 | low   | interface-eth4@if_packets-rx 	| None | e1357192-e563-5524-b0f0-b30fd11ea8df |
| 003057df-0271-4c59-b793-f885fe09668a | low   | pconns-6000-local@tcp_connections-LISTEN   | None | 33ac72d9-ab4d-54f1-9fcf-56e02f770b70 |
| 0030a5ba-0e4a-4cce-a48b-4122bfbc4e7a | low  | tcpconns-8004-local@tcp_connections-CLOSING  	| None | 54b1ecb3-5ccf-533f-84ab-e86eb426606f |
| 0030e0a7-2cea-42db-860c-fa9ab175c8e1 | low  | tcpconns-25-local@tcp_connections-CLOSING    	| None | 54b1ecb3-5ccf-533f-84ab-e86eb426606f |
| 007ec848-f16a-48b8-8706-742a28e2efcf | low    | memcached-local@memcached_command-get        	| None | 8900c37d-501a-565d-b38c-85e5a07a0463 |
| 009d08c7-7483-4e0a-b1bd-0b1451a3b2ab | low | tcpconns-8041-local@tcp_connections-TIME_WAIT	| None | caac8e14-0a2f-5e31-b4bd-e07a14361d81 |
| 00a8183c-910e-4849-8d08-9401fbe82029 | low  | tcpconns-11211-local@tcp_connections-CLOSING 	| None | 54b1ecb3-5ccf-533f-84ab-e86eb426606f |
| 010af93c-62be-442a-94da-5cb426053fe8 | low   | tcpconns-4567-local@tcp_connections-FIN_WAIT2	| None | caac8e14-0a2f-5e31-b4bd-e07a14361d81 |
| 0113b4f3-786d-4a0a-bb4b-59417d63b60f | low   | tcpconns-38857-local@tcp_connections-LAST_ACK	| None | caac8e14-0a2f-5e31-b4bd-e07a14361d81 |
| 0128dac7-b237-4e4c-8d5f-83f6e53771b4 | low   | tcpconns-37871-local@tcp_connections-SYN_SENT	| None | caac8e14-0a2f-5e31-b4bd-e07a14361d81 |
| 014ca1f7-565d-4ce7-b35f-52fd916a8b06 | low    | tcpconns-43752-local@tcp_connections-TIME_WAIT   | None | caac8e14-0a2f-5e31-b4bd-e07a14361d81 |
| 0154f901-18c2-4dd9-a593-db26d356611a | low  | tcpconns-1993-local@tcp_connections-CLOSED   	| None | 54b1ecb3-5ccf-533f-84ab-e86eb426606f |
| 0158d618-d3ba-45e8-bce8-33411d6f35e3 | low    | tcpconns-111-local@tcp_connections-CLOSED    	| None | e1357192-e563-5524-b0f0-b30fd11ea8df |
| 016fe93f-2794-490e-8057-fd5ab75eb4ec | low      | tcpconns-6001-local@tcp_connections-SYN_RECV 	| None | 54b1ecb3-5ccf-533f-84ab-e86eb426606f |
| 01ce3b82-98ad-4f61-88d0-ba46b9862688 | low    | interface-br-tenant@if_dropped-rx            	| None | caac8e14-0a2f-5e31-b4bd-e07a14361d81 |
| 01d4d186-cf26-4264-87a0-9f5deb8872b5 | low     | tcpconns-8774-local@tcp_connections-ESTABLISHED  | None | 33ac72d9-ab4d-54f1-9fcf-56e02f770b70 |
| 01f19617-3ef6-43e8-9ad8-8c84b923f13f | low       | tcpconns-43394-local@tcp_connections-FIN_WAIT2   | None | 33ac72d9-ab4d-54f1-9fcf-56e02f770b70 |
| 020646e9-2d50-4126-9a63-a5f36180cc0b | low     | tcpconns-6000-local@tcp_connections-CLOSE_WAIT   | None | caac8e14-0a2f-5e31-b4bd-e07a14361d81 |
| 02155fd3-0d68-4eec-8cd5-8b158f5f03a4 | low        | tcpconns-6633-local@tcp_connections-LISTEN   	| None | 33ac72d9-ab4d-54f1-9fcf-56e02f770b70 |
| 0236355e-3415-4a72-99f2-38ada7b3db68 | low      | tcpconns-43806-local@tcp_connections-FIN_WAIT2   | None | 54b1ecb3-5ccf-533f-84ab-e86eb426606f |
| 024e89d2-aa77-49c0-ae6e-65a665db01b3 | low      | tcpconns-35357-local@tcp_connections-FIN_WAIT2   | None | caac8e14-0a2f-5e31-b4bd-e07a14361d81 |
| 027adb62-272f-4331-8167-28c3489d3b44 | low       | tcpconns-9292-local@tcp_connections-LISTEN   	| None | 33ac72d9-ab4d-54f1-9fcf-56e02f770b70 |
| 0290d15e-7687-4683-bd25-4c030cad12cf | low       | tcpconns-37378-local@tcp_connections-CLOSE_WAIT  | None | 54b1ecb3-5ccf-533f-84ab-e86eb426606f |
| 02a5383f-b061-4422-9570-bfd3b2532832 | low        | processes@ps_state-zombies                   	| None | 33ac72d9-ab4d-54f1-9fcf-56e02f770b70 |
| 02c959d5-8ae2-4d14-a140-189530b4e8f6 | low        | disk-vda2@disk_merged-write                  	| None | caac8e14-0a2f-5e31-b4bd-e07a14361d81 |
| 02d174b5-6783-4db5-bfe7-8d45931aa0b0 | low        | interface-br-tun@if_octets-rx                	| None | 54b1ecb3-5ccf-533f-84ab-e86eb426606f |
| 02d8c001-90da-4997-bfa5-e5d3afe599fa | low          | tcpconns-25672-local@tcp_connections-CLOSING 	| None | 54b1ecb3-5ccf-533f-84ab-e86eb426606f |
| 02d932f0-5745-4694-86d9-84e365789a7d | low       | tcpconns-9292-local@tcp_connections-CLOSING  	| None | caac8e14-0a2f-5e31-b4bd-e07a14361d81 |
| 02e1a5e2-194d-4e49-8b36-a843b5dbdc3d | low       | tcpconns-45228-local@tcp_connections-CLOSE_WAIT  | None | caac8e14-0a2f-5e31-b4bd-e07a14361d81 |
| 02e5dcec-f5b7-41e9-9f3c-714ade502836 | low         | load@load-5min                               	| None | 54b1ecb3-5ccf-533f-84ab-e86eb426606f |
| 02fe05ed-e4a5-4a18-ad6c-64f8787225c9 | low         | tcpconns-8774-local@tcp_connections-SYN_SENT 	| None | 33ac72d9-ab4d-54f1-9fcf-56e02f770b70 |
| 03129089-7bbd-47f3-ab14-9cd583d775ae | low        | tcpconns-6379-local@tcp_connections-LAST_ACK 	| None | 54b1ecb3-5ccf-533f-84ab-e86eb426606f |
| 032b1771-93c4-4051-bbec-9115c9d329c4 | low        | tcpconns-8042-local@tcp_connections-TIME_WAIT	| None | 54b1ecb3-5ccf-533f-84ab-e86eb426606f |
| 033516d5-ac15-4767-b005-cff52276badd | low        | tcpconns-22-local@tcp_connections-CLOSED     	| None | 54b1ecb3-5ccf-533f-84ab-e86eb426606f |
| 03589183-efa7-43ed-aea6-9d3c8accf97a | low         | interface-br-tun@if_errors-tx                	| None | 54b1ecb3-5ccf-533f-84ab-e86eb426606f |
| 0360077f-729d-4591-a9fc-d96fbb7e0326 | low          | tcpconns-6080-local@tcp_connections-CLOSING  	| None | 33ac72d9-ab4d-54f1-9fcf-56e02f770b70 |
| 0365f5a1-4a98-435e-a809-c8706b0671bd | low        | tcpconns-34296-local@tcp_connections-LAST_ACK	| None | 33ac72d9-ab4d-54f1-9fcf-56e02f770b70 |
| 039c57b7-ae5b-4f13-846e-8e5f184cdc4d | low         | tcpconns-111-local@tcp_connections-CLOSE_WAIT	| None | 926d87fe-b388-501d-afa6-dc6af55ce4ad |
| 04169046-80c4-478e-b263-b9529b5ca739 | low       | interface-br-tenant@if_packets-tx            	| None | 54b1ecb3-5ccf-533f-84ab-e86eb426606f |
| 0432314d-eb8b-4bf9-ab8f-5ecc5b30592d | low         | tcpconns-37415-local@tcp_connections-CLOSE_WAIT  | None | caac8e14-0a2f-5e31-b4bd-e07a14361d81 |
| 043d9d6e-5db0-40e4-83b1-b8120506e9ec | low        | tcpconns-6379-local@tcp_connections-ESTABLISHED  | None | caac8e14-0a2f-5e31-b4bd-e07a14361d81 |
| 04639fe9-6dc1-46eb-8b86-9b39e8fd782d | low          | tcpconns-35357-local@tcp_connections-SYN_RECV	| None | caac8e14-0a2f-5e31-b4bd-e07a14361d81 |
| 04871c86-b176-45ed-9f37-bb6fae27e930 | low          | tcpconns-8042-local@tcp_connections-CLOSE_WAIT   | None | caac8e14-0a2f-5e31-b4bd-e07a14361d81 |
| 049c50c4-bf5e-4098-988a-fb867649ee17 | low          | tcpconns-11211-local@tcp_connections-SYN_SENT	| None | 54b1ecb3-5ccf-533f-84ab-e86eb426606f |
| 04e37efb-fc67-418e-b53b-6b8055967a2a | low          | tcpconns-8004-local@tcp_connections-CLOSING  	| None | 33ac72d9-ab4d-54f1-9fcf-56e02f770b70 |
| 04ef0d0f-db22-4501-ae4a-4bc9ee719075 | low           | tcpconns-9200-local@tcp_connections-SYN_RECV 	| None | 33ac72d9-ab4d-54f1-9fcf-56e02f770b70 |
Chapter 4. Managing operational measurements
4.1. Modifying the environment variables based on your deployment
Procedure
-
Copy the
/usr/share/openstack-tripleo-heat-templates/environments/gnocchi-environment.yamlfile to your home directory. Modify the parameters to suit your environment. You can modify the following primary parameters in the YAML file:
-
GnocchiIndexerBackend: The database indexer backend to use, for example,
mysql. See https://github.com/openstack/tripleo-heat-templates/blob/stable/queens/puppet/services/gnocchi-base.yaml#L33 -
GnocchiBackend: The type of transient storage. The value can be
rbd,swift, orfile(ceph). For more information, see https://github.com/openstack/tripleo-heat-templates/blob/stable/queens/environments/storage-environment.yaml#L29-L30 - NumberOfStorageSacks: The number of storage sacks. For more information, see Section 4.1.2, “Number of sacks”.
-
GnocchiIndexerBackend: The database indexer backend to use, for example,
Add
gnocchi-environment.yamlto theovercloud deploycommand with any other environment files that are relevant to your environment and deploy. Replace<existing_overcloud_environment_files>with the list of environment files that are part of your existing deployment:$ openstack overcloud deploy \ <existing_overcloud_environment_files> \ -e ~gnocchi-environment.yaml \ ...
4.1.1. Running metricd workers
By default, the gnocchi-metricd daemon spans your CPU power to maximize CPU use when computing metric aggregation.
Procedure
Use the
openstack metric statuscommand to query the HTTP API and retrieve the status for metric processing:# openstack metric statusThe command output shows you the processing backlog for the
gnocchi-metriddaemon. As long as this backlog is not continuously increasing, it means thatgnocchi-metricdcan cope with the amount of metrics that are being gathered. If the number of measures to process is continuously increasing, increase the number ofgnocchi-metricddaemons. You can run any number of metricd daemons on any number of servers.
4.1.2. Number of sacks
Incoming metrics data in Gnocchi are pushed into different sacks and each sack is assigned to one or more gnocchi-metricd daemons for processing. The number of sacks depends on the active metrics the system captures.
Red Hat recommends that the number of sacks is greater than the total number of active gnocchi-metricd workers.
4.1.3. Changing the sack size
You can change the sack size if you want to collect more metrics than originally anticipated.
Measurement data that is pushed to Gnocchi is divided into sacks for better distribution. Incoming metrics are pushed to specific sacks and each sack is assigned to one or more gnocchi-metricd daemons for processing. To set the number of sacks, use the number of active metrics the system captures. The number of sacks should be higher than the total number of active gnocchi-metricd workers.
Procedure
To determine the appropriate sacks value to set, use the following equation:
sacks value = number of active metrics / 300
NoteIf the estimated number of metrics is the absolute maximum, divide the value by 500. If the estimated number of active metrics is conservative and expected to grow, divide the value by 100 to accommodate growth.
4.2. Monitoring the time-series database service
The /v1/status endpoint of the HTTP API returns information, such as the number of measures to process (measures backlog), which you can monitor. The following conditions indicate a healthy system:
-
The HTTP server and
gnocchi-metricdare running -
The HTTP server and
gnocchi-metricdare not writing error messages to the log files.
Procedure
View the status of the time-series database:
# openstack metric statusThe output shows the status of the time-series database, as well as the number of metrics to process. Lower values are better here, ideally, they are near 0.
4.3. Backing up and restoring the time-series database
To be able to recover from an unfortunate event, backup the index and the storage. You must create a database dump using PostgreSQL or MySQL, and take snapshots or copies of your data storage, using Ceph, Swift, or your file system.
Procedure
- Restore your index and storage backups.
- Reinstall Gnocchi, if necessary.
- Restart Gnocchi.
4.4. Viewing measures
You can view a list of measures for a particular resource:
Procedure
Use the
metric measurescommand:# openstack metric measures show --resource-id UUID <METER_NAME>List measures for a particular resource within a range of timestamps:
# openstack metric measures show --aggregation mean --start <START_TIME> --stop <STOP_TIME> --resource-id UUID <METER_NAME>Timestamp variables <START_TIME> and <END_TIME> use the format iso-dateThh:mm:ss.
4.5. Managing resource types
You can create, view, and delete resource types. The default resource type is generic, but you can create your own resource type with any extra number of attributes.
Procedure
Create a new resource type:
$ openstack metric resource-type create testResource01 -a bla:string:True:min_length=123
----------------------------------------------------------------------------+
| Field          | Value                                                      |
----------------------------------------------------------------------------+
| attributes/bla | max_length=255, min_length=123, required=True, type=string |
| name           | testResource01                                             |
| state          | active                                                     |
----------------------------------------------------------------------------+
Review the configuration of the resource type:
$ openstack metric resource-typegnocchi resource-type show testResource01
----------------------------------------------------------------------------+
| Field          | Value                                                      |
----------------------------------------------------------------------------+
| attributes/bla | max_length=255, min_length=123, required=True, type=string |
| name           | testResource01                                             |
| state          | active                                                     |
----------------------------------------------------------------------------+
Delete the resource type:
$ openstack metric resource-type delete testResource01
You cannot delete a resource type if a resource is using it.
4.6. Viewing cloud usage measures
Procedure
View the average memory usage of all instances for each project:
openstack metrics measures aggregation --resource-type instance --groupby project_id -m “memoryView L3” --resource-id UUID
4.6.1. Enabling L3 cache monitoring
If your Intel hardware and libvirt version supports Cache Monitoring Technology (CMT), you can use the cpu_l3_cache meter to monitor the amount of L3 cache used by an instance.
To monitor the L3 cache, you must have the following parameters and files:
-
cmtin theLibvirtEnabledPerfEventsparameter. -
cpu_l3_cachein thegnocchi_resources.yamlfile. -
cpu_l3_cachein the Ceilometerpolling.yamlfile.
Procedure
-
Create a YAML file for Telemetry, for example,
ceilometer-environment.yaml. -
In the
ceilometer-environment.yamlfile, addcmtto theLibvirtEnabledPerfEventsparameter. For more information, see/usr/share/openstack-triple-heat-templates/puppet/services/nova_libvirt.yaml. Deploy the overcloud with this YAML file. Replace
<existing_overcloud_environment_files>with the list of environment files that are part of your existing deployment:#!/bin/bash openstack overcloud deploy \ --templates \ <existing_overcloud_environment_files> \ -e /home/stack/ceilometer-environment.yaml \ ...Verify that
cpu_l3_cacheis enabled in Gnocchi on the Compute node.$ sudo -i # docker exec -ti ceilometer_agent_compute cat /etc/ceilometer/gnocchi_resources.yaml | grep cpu_l3_cache //Verify that cpu_l3_cache is enabled for Telemetry polling. # docker exec -ti ceilometer_agent_compute cat /etc/ceilometer/polling.yaml | grep cpu_l3_cache //If cpu_l3_cache is not enabled for Telemetry, enable it and restart the service. # docker exec -ti ceilometer_agent_compute echo " - cpu_l3_cache" >> /etc/ceilometer/polling.yaml # docker exec -ti ceilometer_agent_compute pkill -HUP -f "ceilometer.*master process"NoteChanging the setting in the container image does not persist over a reboot.
After you launch a guest instance on this Compute node, monitor the
CMTmetrics:(overcloud) [stack@undercloud-0 ~]$ openstack metric measures show --resource-id a6491d92-b2c8-4f6d-94ba-edc9dfde23ac cpu_l3_cache --------------------------------------------------- | timestamp | granularity | value | --------------------------------------------------- | 2017-10-25T09:40:00+00:00 | 300.0 | 1966080.0 | | 2017-10-25T09:45:00+00:00 | 300.0 | 1933312.0 | | 2017-10-25T09:50:00+00:00 | 300.0 | 2129920.0 | | 2017-10-25T09:55:00+00:00 | 300.0 | 1966080.0 | | 2017-10-25T10:00:00+00:00 | 300.0 | 1933312.0 | | 2017-10-25T10:05:00+00:00 | 300.0 | 2195456.0 | | 2017-10-25T10:10:00+00:00 | 300.0 | 1933312.0 | | 2017-10-25T10:15:00+00:00 | 300.0 | 1998848.0 | | 2017-10-25T10:20:00+00:00 | 300.0 | 2097152.0 | | 2017-10-25T10:25:00+00:00 | 300.0 | 1933312.0 | | 2017-10-25T10:30:00+00:00 | 300.0 | 1966080.0 | | 2017-10-25T10:35:00+00:00 | 300.0 | 1933312.0 | | 2017-10-25T10:40:00+00:00 | 300.0 | 1933312.0 | | 2017-10-25T10:45:00+00:00 | 300.0 | 1933312.0 | | 2017-10-25T10:50:00+00:00 | 300.0 | 2850816.0 | | 2017-10-25T10:55:00+00:00 | 300.0 | 2359296.0 | | 2017-10-25T11:00:00+00:00 | 300.0 | 2293760.0 | ---------------------------------------------------
4.7. Upgrading Gnocchi
By default, upgrading your deployment using Red Hat OpenStack Platform director upgrades Gnocchi. For information on upgrading your deployment, see Upgrading Red Hat OpenStack Platform. If you are using Red Hat OpenStack Platform 10 and want to upgrade to Red Hat OpenStack Platform 13, see Fast Forward Upgrades.
Chapter 5. Managing alarms
You can use the alarm service called aodh to trigger actions based on defined rules against metric or event data collected by Ceilometer or Gnocchi.
5.1. Viewing existing alarms
Procedure
List the existing Telemetry alarms:
# openstack alarm list
+--------------------------------------+--------------------------------------------+----------------------------+-------------------+----------+---------+
| alarm_id                             | type                                       | name                       | state             | severity | enabled |
+--------------------------------------+--------------------------------------------+----------------------------+-------------------+----------+---------+
| 922f899c-27c8-4c7d-a2cf-107be51ca90a | gnocchi_aggregation_by_resources_threshold | iops-monitor-read-requests | insufficient data | low      | True    |
+--------------------------------------+--------------------------------------------+----------------------------+-------------------+----------+---------+
To list the meters assigned to a resource, specify the UUID of the resource. For example:
# openstack resource show 5e3fcbe2-7aab-475d-b42c-a440aa42e5ad
5.2. Creating an alarm
You can use aodh to create an alarm that activates when a threshold value is reached. In this example, the alarm activates and adds a log entry when the average CPU utilization for an individual instance exceeds 80%.
Procedure
Create an alarm and use a query to isolate the specific id of the instance (94619081-abf5-4f1f-81c7-9cedaa872403) for monitoring purposes:
# openstack alarm create --type gnocchi_aggregation_by_resources_threshold --name cpu_usage_high --metric cpu_util --threshold 80 --aggregation-method sum --resource-type instance --query '{"=": {"id": "94619081-abf5-4f1f-81c7-9cedaa872403"}}' --alarm-action 'log://'
+---------------------------+-------------------------------------------------------+
| Field                     | Value                                                 |
+---------------------------+-------------------------------------------------------+
| aggregation_method        | sum                                                   |
| alarm_actions             | [u'log://']                                           |
| alarm_id                  | b794adc7-ed4f-4edb-ace4-88cbe4674a94                  |
| comparison_operator       | eq                                                    |
| description               | gnocchi_aggregation_by_resources_threshold alarm rule |
| enabled                   | True                                                  |
| evaluation_periods        | 1                                                     |
| granularity               | 60                                                    |
| insufficient_data_actions | []                                                    |
| metric                    | cpu_util                                              |
| name                      | cpu_usage_high                                        |
| ok_actions                | []                                                    |
| project_id                | 13c52c41e0e543d9841a3e761f981c20                      |
| query                     | {"=": {"id": "94619081-abf5-4f1f-81c7-9cedaa872403"}} |
| repeat_actions            | False                                                 |
| resource_type             | instance                                              |
| severity                  | low                                                   |
| state                     | insufficient data                                     |
| state_timestamp           | 2016-12-09T05:18:53.326000                            |
| threshold                 | 80.0                                                  |
| time_constraints          | []                                                    |
| timestamp                 | 2016-12-09T05:18:53.326000                            |
| type                      | gnocchi_aggregation_by_resources_threshold            |
| user_id                   | 32d3f2c9a234423cb52fb69d3741dbbc                      |
+---------------------------+-------------------------------------------------------+
To edit an existing threshold alarm, use the aodh alarm update command. For example, to increase the alarm threshold to 75%, use the following command:
# openstack alarm update --name cpu_usage_high --threshold 75
5.3. Disabling an alarm
Procedure
To disable an alarm, enter the following command:
# openstack alarm update --name cpu_usage_high --enabled=false
5.4. Deleting an alarm
Procedure
To delete an alarm, enter the following command:
# openstack alarm delete --name cpu_usage_high
5.5. Example: Monitoring the disk activity of instances
The following example demonstrates how to use an aodh alarm to monitor the cumulative disk activity for all the instances contained within a particular project.
Procedure
Review the existing projects and select the appropriate UUID of the project you want to monitor. This example uses the
admintenant:$ openstack project list +----------------------------------+----------+ | ID | Name | +----------------------------------+----------+ | 745d33000ac74d30a77539f8920555e7 | admin | | 983739bb834a42ddb48124a38def8538 | services | | be9e767afd4c4b7ead1417c6dfedde2b | demo | +----------------------------------+----------+Use the project UUID to create an alarm that analyses the
sum()of all read requests generated by the instances in theadmintenant. You can further restrain the query by using the--queryparameter:# openstack alarm create --type gnocchi_aggregation_by_resources_threshold --name iops-monitor-read-requests --metric disk.read.requests.rate --threshold 42000 --aggregation-method sum --resource-type instance --query '{"=": {"project_id": "745d33000ac74d30a77539f8920555e7"}}' +---------------------------+-----------------------------------------------------------+ | Field | Value | +---------------------------+-----------------------------------------------------------+ | aggregation_method | sum | | alarm_actions | [] | | alarm_id | 192aba27-d823-4ede-a404-7f6b3cc12469 | | comparison_operator | eq | | description | gnocchi_aggregation_by_resources_threshold alarm rule | | enabled | True | | evaluation_periods | 1 | | granularity | 60 | | insufficient_data_actions | [] | | metric | disk.read.requests.rate | | name | iops-monitor-read-requests | | ok_actions | [] | | project_id | 745d33000ac74d30a77539f8920555e7 | | query | {"=": {"project_id": "745d33000ac74d30a77539f8920555e7"}} | | repeat_actions | False | | resource_type | instance | | severity | low | | state | insufficient data | | state_timestamp | 2016-11-08T23:41:22.919000 | | threshold | 42000.0 | | time_constraints | [] | | timestamp | 2016-11-08T23:41:22.919000 | | type | gnocchi_aggregation_by_resources_threshold | | user_id | 8c4aea738d774967b4ef388eb41fef5e | +---------------------------+-----------------------------------------------------------+
5.6. Example: Monitoring CPU use
To monitor the performance of an instance, examine the Gnocchi database to identify which metrics you can monitor, such as memory or CPU usage.
Procedure
Enter the
openstack metric resource showcommand with an instance UUID to identify the metrics you can monitor:$ openstack metric resource show --type instance d71cdf9a-51dc-4bba-8170-9cd95edd3f66 +-----------------------+---------------------------------------------------------------------+ | Field | Value | +-----------------------+---------------------------------------------------------------------+ | created_by_project_id | 44adccdc32614688ae765ed4e484f389 | | created_by_user_id | c24fa60e46d14f8d847fca90531b43db | | creator | c24fa60e46d14f8d847fca90531b43db:44adccdc32614688ae765ed4e484f389 | | display_name | test-instance | | ended_at | None | | flavor_id | 14c7c918-df24-481c-b498-0d3ec57d2e51 | | flavor_name | m1.tiny | | host | overcloud-compute-0 | | id | d71cdf9a-51dc-4bba-8170-9cd95edd3f66 | | image_ref | e75dff7b-3408-45c2-9a02-61fbfbf054d7 | | metrics | compute.instance.booting.time: c739a70d-2d1e-45c1-8c1b-4d28ff2403ac | | | cpu.delta: 700ceb7c-4cff-4d92-be2f-6526321548d6 | | | cpu: 716d6128-1ea6-430d-aa9c-ceaff2a6bf32 | | | cpu_l3_cache: 3410955e-c724-48a5-ab77-c3050b8cbe6e | | | cpu_util: b148c392-37d6-4c8f-8609-e15fc15a4728 | | | disk.allocation: 9dd464a3-acf8-40fe-bd7e-3cb5fb12d7cc | | | disk.capacity: c183d0da-e5eb-4223-a42e-855675dd1ec6 | | | disk.ephemeral.size: 15d1d828-fbb4-4448-b0f2-2392dcfed5b6 | | | disk.iops: b8009e70-daee-403f-94ed-73853359a087 | | | disk.latency: 1c648176-18a6-4198-ac7f-33ee628b82a9 | | | disk.read.bytes.rate: eb35828f-312f-41ce-b0bc-cb6505e14ab7 | | | disk.read.bytes: de463be7-769b-433d-9f22-f3265e146ec8 | | | disk.read.requests.rate: 588ca440-bd73-4fa9-a00c-8af67262f4fd | | | disk.read.requests: 53e5d599-6cad-47de-b814-5cb23e8aaf24 | | | disk.root.size: cee9d8b1-181e-4974-9427-aa7adb3b96d9 | | | disk.usage: 4d724c99-7947-4c6d-9816-abbbc166f6f3 | | | disk.write.bytes.rate: 45b8da6e-0c89-4a6c-9cce-c95d49d9cc8b | | | disk.write.bytes: c7734f1b-b43a-48ee-8fe4-8a31b641b565 | | | disk.write.requests.rate: 96ba2f22-8dd6-4b89-b313-1e0882c4d0d6 | | | disk.write.requests: 553b7254-be2d-481b-9d31-b04c93dbb168 | | | memory.bandwidth.local: 187f29d4-7c70-4ae2-86d1-191d11490aad | | | memory.bandwidth.total: eb09a4fc-c202-4bc3-8c94-aa2076df7e39 | | | memory.resident: 97cfb849-2316-45a6-9545-21b1d48b0052 | | | memory.swap.in: f0378d8f-6927-4b76-8d34-a5931799a301 | | | memory.swap.out: c5fba193-1a1b-44c8-82e3-9fdc9ef21f69 | | | memory.usage: 7958d06d-7894-4ca1-8c7e-72ba572c1260 | | | memory: a35c7eab-f714-4582-aa6f-48c92d4b79cd | | | perf.cache.misses: da69636d-d210-4b7b-bea5-18d4959e95c1 | | | perf.cache.references: e1955a37-d7e4-4b12-8a2a-51de4ec59efd | | | perf.cpu.cycles: 5d325d44-b297-407a-b7db-cc9105549193 | | | perf.instructions: 973d6c6b-bbeb-4a13-96c2-390a63596bfc | | | vcpus: 646b53d0-0168-4851-b297-05d96cc03ab2 | | original_resource_id | d71cdf9a-51dc-4bba-8170-9cd95edd3f66 | | project_id | 3cee262b907b4040b26b678d7180566b | | revision_end | None | | revision_start | 2017-11-16T04:00:27.081865+00:00 | | server_group | None | | started_at | 2017-11-16T01:09:20.668344+00:00 | | type | instance | | user_id | 1dbf5787b2ee46cf9fa6a1dfea9c9996 | +-----------------------+---------------------------------------------------------------------+In this result, the metrics value lists the components you can monitor using aodh alarms, for example
cpu_util.To monitor CPU usage, use the
cpu_utilmetric:$ openstack metric show --resource-id d71cdf9a-51dc-4bba-8170-9cd95edd3f66 cpu_util +------------------------------------+-------------------------------------------------------------------+ | Field | Value | +------------------------------------+-------------------------------------------------------------------+ | archive_policy/aggregation_methods | std, count, min, max, sum, mean | | archive_policy/back_window | 0 | | archive_policy/definition | - points: 8640, granularity: 0:05:00, timespan: 30 days, 0:00:00 | | archive_policy/name | low | | created_by_project_id | 44adccdc32614688ae765ed4e484f389 | | created_by_user_id | c24fa60e46d14f8d847fca90531b43db | | creator | c24fa60e46d14f8d847fca90531b43db:44adccdc32614688ae765ed4e484f389 | | id | b148c392-37d6-4c8f-8609-e15fc15a4728 | | name | cpu_util | | resource/created_by_project_id | 44adccdc32614688ae765ed4e484f389 | | resource/created_by_user_id | c24fa60e46d14f8d847fca90531b43db | | resource/creator | c24fa60e46d14f8d847fca90531b43db:44adccdc32614688ae765ed4e484f389 | | resource/ended_at | None | | resource/id | d71cdf9a-51dc-4bba-8170-9cd95edd3f66 | | resource/original_resource_id | d71cdf9a-51dc-4bba-8170-9cd95edd3f66 | | resource/project_id | 3cee262b907b4040b26b678d7180566b | | resource/revision_end | None | | resource/revision_start | 2017-11-17T00:05:27.516421+00:00 | | resource/started_at | 2017-11-16T01:09:20.668344+00:00 | | resource/type | instance | | resource/user_id | 1dbf5787b2ee46cf9fa6a1dfea9c9996 | | unit | None | +------------------------------------+-------------------------------------------------------------------+- archive_policy: Defines the aggregation interval for calculating the std, count, min, max, sum, mean values.
Use aodh to create a monitoring task that queries
cpu_util. This task triggers events based on the settings that you specify. For example, to raise a log entry when an instance’s CPU spikes over 80% for an extended duration, use the following command:$ openstack alarm create \ --project-id 3cee262b907b4040b26b678d7180566b \ --name high-cpu \ --type gnocchi_resources_threshold \ --description 'High CPU usage' \ --metric cpu_util \ --threshold 80.0 \ --comparison-operator ge \ --aggregation-method mean \ --granularity 300 \ --evaluation-periods 1 \ --alarm-action 'log://' \ --ok-action 'log://' \ --resource-type instance \ --resource-id d71cdf9a-51dc-4bba-8170-9cd95edd3f66 +---------------------------+--------------------------------------+ | Field | Value | +---------------------------+--------------------------------------+ | aggregation_method | mean | | alarm_actions | [u'log://'] | | alarm_id | 1625015c-49b8-4e3f-9427-3c312a8615dd | | comparison_operator | ge | | description | High CPU usage | | enabled | True | | evaluation_periods | 1 | | granularity | 300 | | insufficient_data_actions | [] | | metric | cpu_util | | name | high-cpu | | ok_actions | [u'log://'] | | project_id | 3cee262b907b4040b26b678d7180566b | | repeat_actions | False | | resource_id | d71cdf9a-51dc-4bba-8170-9cd95edd3f66 | | resource_type | instance | | severity | low | | state | insufficient data | | state_reason | Not evaluated yet | | state_timestamp | 2017-11-16T05:20:48.891365 | | threshold | 80.0 | | time_constraints | [] | | timestamp | 2017-11-16T05:20:48.891365 | | type | gnocchi_resources_threshold | | user_id | 1dbf5787b2ee46cf9fa6a1dfea9c9996 | +---------------------------+--------------------------------------+- comparison-operator: The ge operator defines that the alarm triggers if the CPU usage is greater than or equal to 80%.
- granularity: Metrics have an archive policy associated with them; the policy can have various granularities. For example, 5 minutes aggregation for 1 hour + 1 hour aggregation over a month. The granularity value must match the duration described in the archive policy.
- evaluation-periods: Number of granularity periods that need to pass before the alarm triggers. For example, if you set this value to 2, the CPU usage must be over 80% for two polling periods before the alarm triggers.
[u’log://']: When you set
alarm_actionsorok_actionsto[u’log://'], events, for example, the alarm is triggered or returns to a normal state, are recorded to the aodh log file.NoteYou can define different actions to run when an alarm is triggered (alarm_actions), and when it returns to a normal state (ok_actions), such as a webhook URL.
5.7. Viewing alarm history
To check if your alarm has been triggered, you can query the alarm history.
Procedure
Use the
openstack alarm-history showcommand:openstack alarm-history show 1625015c-49b8-4e3f-9427-3c312a8615dd --fit-width +----------------------------+------------------+---------------------------------------------------------------------------------------------------------------------------------------------------+--------------------------------------+ | timestamp | type | detail | event_id | +----------------------------+------------------+---------------------------------------------------------------------------------------------------------------------------------------------------+--------------------------------------+ | 2017-11-16T05:21:47.850094 | state transition | {"transition_reason": "Transition to ok due to 1 samples inside threshold, most recent: 0.0366665763", "state": "ok"} | 3b51f09d-ded1-4807-b6bb-65fdc87669e4 | +----------------------------+------------------+---------------------------------------------------------------------------------------------------------------------------------------------------+--------------------------------------+
Chapter 6. Logs
Red Hat OpenStack Platform (RHOSP) writes informational messages to specific log files; you can use these messages for troubleshooting and monitoring system events.
You do not need to attach the individual log files to your support cases manually. The sosreport utility gathers the required logs automatically.
6.1. Location of log files for OpenStack services
Each OpenStack component has a separate logging directory containing files specific to a running service.
6.1.1. Bare Metal Provisioning (ironic) log files
| Service | Service Name | Log Path |
|---|---|---|
| OpenStack Ironic API | openstack-ironic-api.service | /var/log/containers/ironic/ironic-api.log |
| OpenStack Ironic Conductor | openstack-ironic-conductor.service | /var/log/containers/ironic/ironic-conductor.log |
6.1.2. Block Storage (cinder) log files
| Service | Service Name | Log Path |
|---|---|---|
| Block Storage API | openstack-cinder-api.service | /var/log/containers/cinder-api.log |
| Block Storage Backup | openstack-cinder-backup.service | /var/log/containers/cinder/backup.log |
| Informational messages | The cinder-manage command | /var/log/containers/cinder/cinder-manage.log |
| Block Storage Scheduler | openstack-cinder-scheduler.service | /var/log/containers/cinder/scheduler.log |
| Block Storage Volume | openstack-cinder-volume.service | /var/log/containers/cinder/volume.log |
6.1.3. Compute (nova) log files
| Service | Service Name | Log Path |
|---|---|---|
| OpenStack Compute API service | openstack-nova-api.service | /var/log/containers/nova/nova-api.log |
| OpenStack Compute certificate server | openstack-nova-cert.service | /var/log/containers/nova/nova-cert.log |
| OpenStack Compute service | openstack-nova-compute.service | /var/log/containers/nova/nova-compute.log |
| OpenStack Compute Conductor service | openstack-nova-conductor.service | /var/log/containers/nova/nova-conductor.log |
| OpenStack Compute VNC console authentication server | openstack-nova-consoleauth.service | /var/log/containers/nova/nova-consoleauth.log |
| Informational messages | nova-manage command | /var/log/containers/nova/nova-manage.log |
| OpenStack Compute NoVNC Proxy service | openstack-nova-novncproxy.service | /var/log/containers/nova/nova-novncproxy.log |
| OpenStack Compute Scheduler service | openstack-nova-scheduler.service | /var/log/containers/nova/nova-scheduler.log |
6.1.4. Dashboard (horizon) log files
| Service | Service Name | Log Path |
|---|---|---|
| Log of certain user interactions | Dashboard interface | /var/log/containers/horizon/horizon.log |
The Apache HTTP server uses several additional log files for the Dashboard web interface, which you can access by using a web browser or command-line client, for example, keystone and nova. The following log files can be helpful in tracking the usage of the Dashboard and diagnosing faults:
| Purpose | Log Path |
|---|---|
| All processed HTTP requests | /var/log/containers/httpd/horizon_access.log |
| HTTP errors | /var/log/containers/httpd/horizon_error.log |
| Admin-role API requests | /var/log/containers/httpd/keystone_wsgi_admin_access.log |
| Admin-role API errors | /var/log/containers/httpd/keystone_wsgi_admin_error.log |
| Member-role API requests | /var/log/containers/httpd/keystone_wsgi_main_access.log |
| Member-role API errors | /var/log/containers/httpd/keystone_wsgi_main_error.log |
There is also /var/log/containers/httpd/default_error.log, which stores errors reported by other web services running on the same host.
6.1.5. Data Processing (sahara) log files
| Service | Service Name | Log Path |
|---|---|---|
| Sahara API Server |
openstack-sahara-all.service |
/var/log/containers/sahara/sahara-all.log |
| Sahara Engine Server | openstack-sahara-engine.service | /var/log/containers/messages |
6.1.6. Database as a Service (trove) log files
| Service | Service Name | Log Path |
|---|---|---|
| OpenStack Trove API Service | openstack-trove-api.service | /var/log/containers/trove/trove-api.log |
| OpenStack Trove Conductor Service | openstack-trove-conductor.service | /var/log/containers/trove/trove-conductor.log |
| OpenStack Trove guestagent Service | openstack-trove-guestagent.service | /var/log/containers/trove/logfile.txt |
| OpenStack Trove taskmanager Service | openstack-trove-taskmanager.service | /var/log/containers/trove/trove-taskmanager.log |
6.1.7. Identity Service (keystone) log files
| Service | Service Name | Log Path |
|---|---|---|
| OpenStack Identity Service | openstack-keystone.service | /var/log/containers/keystone/keystone.log |
6.1.8. Image Service (glance) log files
| Service | Service Name | Log Path |
|---|---|---|
| OpenStack Image Service API server | openstack-glance-api.service | /var/log/containers/glance/api.log |
| OpenStack Image Service Registry server | openstack-glance-registry.service | /var/log/containers/glance/registry.log |
6.1.9. Networking (neutron) log files
| Service | Service Name | Log Path |
|---|---|---|
| OpenStack Neutron DHCP Agent | neutron-dhcp-agent.service | /var/log/containers/neutron/dhcp-agent.log |
| OpenStack Networking Layer 3 Agent | neutron-l3-agent.service | /var/log/containers/neutron/l3-agent.log |
| Metadata agent service | neutron-metadata-agent.service | /var/log/containers/neutron/metadata-agent.log |
| Metadata namespace proxy | n/a | /var/log/containers/neutron/neutron-ns-metadata-proxy-UUID.log |
| Open vSwitch agent | neutron-openvswitch-agent.service | /var/log/containers/neutron/openvswitch-agent.log |
| OpenStack Networking service | neutron-server.service | /var/log/containers/neutron/server.log |
6.1.10. Object Storage (swift) log files
OpenStack Object Storage sends logs to the system logging facility only.
By default, all Object Storage log files go to /var/log/containers/swift/swift.log, using the local0, local1, and local2 syslog facilities.
The log messages of Object Storage are classified in to two broad categories: those by REST API services and those by background daemons. The API service messages contain one line per API request, in a manner similar to popular HTTP servers; both the frontend (Proxy) and backend (Account, Container, Object) services post such messages. The daemon messages are less structured and typically contain human-readable information about daemons performing their periodic tasks. However, regardless of which part of Object Storage produces the message, the source identity is always at the beginning of the line.
Here is an example of a proxy message:
Apr 20 15:20:34 rhev-a24c-01 proxy-server: 127.0.0.1 127.0.0.1 20/Apr/2015/19/20/34 GET /v1/AUTH_zaitcev%3Fformat%3Djson%26marker%3Dtestcont HTTP/1.0 200 - python-swiftclient-2.1.0 AUTH_tk737d6... - 2 - txc454fa8ea4844d909820a-0055355182 - 0.0162 - - 1429557634.806570053 1429557634.822791100Here is an example of ad-hoc messages from background daemons:
Apr 27 17:08:15 rhev-a24c-02 object-auditor: Object audit (ZBF). Since Mon Apr 27 21:08:15 2015: Locally: 1 passed, 0 quarantined, 0 errors files/sec: 4.34 , bytes/sec: 0.00, Total time: 0.23, Auditing time: 0.00, Rate: 0.00
Apr 27 17:08:16 rhev-a24c-02 object-auditor: Object audit (ZBF) "forever" mode completed: 0.56s. Total quarantined: 0, Total errors: 0, Total files/sec: 14.31, Total bytes/sec: 0.00, Auditing time: 0.02, Rate: 0.04
Apr 27 17:08:16 rhev-a24c-02 account-replicator: Beginning replication run
Apr 27 17:08:16 rhev-a24c-02 account-replicator: Replication run OVER
Apr 27 17:08:16 rhev-a24c-02 account-replicator: Attempted to replicate 5 dbs in 0.12589 seconds (39.71876/s)
Apr 27 17:08:16 rhev-a24c-02 account-replicator: Removed 0 dbs
Apr 27 17:08:16 rhev-a24c-02 account-replicator: 10 successes, 0 failures
6.1.11. Orchestration (heat) log files
| Service | Service Name | Log Path |
|---|---|---|
| OpenStack Heat API Service | openstack-heat-api.service | /var/log/containers/heat/heat-api.log |
| OpenStack Heat Engine Service | openstack-heat-engine.service | /var/log/containers/heat/heat-engine.log |
| Orchestration service events | n/a | /var/log/containers/heat/heat-manage.log |
6.1.13. Telemetry (ceilometer) log files
| Service | Service Name | Log Path |
|---|---|---|
| OpenStack ceilometer notification agent | openstack-ceilometer-notification.service | /var/log/containers/ceilometer/agent-notification.log |
| OpenStack ceilometer alarm evaluation | openstack-ceilometer-alarm-evaluator.service | /var/log/containers/ceilometer/alarm-evaluator.log |
| OpenStack ceilometer alarm notification | openstack-ceilometer-alarm-notifier.service | /var/log/containers/ceilometer/alarm-notifier.log |
| OpenStack ceilometer API | httpd.service | /var/log/containers/ceilometer/api.log |
| Informational messages | MongoDB integration | /var/log/containers/ceilometer/ceilometer-dbsync.log |
| OpenStack ceilometer central agent | openstack-ceilometer-central.service | /var/log/containers/ceilometer/central.log |
| OpenStack ceilometer collection | openstack-ceilometer-collector.service | /var/log/containers/ceilometer/collector.log |
| OpenStack ceilometer compute agent | openstack-ceilometer-compute.service | /var/log/containers/ceilometer/compute.log |
6.1.14. Log files for supporting services
The following services are used by the core OpenStack components and have their own log directories and files.
| Service | Service Name | Log Path |
|---|---|---|
| Message broker (RabbitMQ) | rabbitmq-server.service |
/var/log/rabbitmq/rabbit@short_hostname.log |
| Database server (MariaDB) | mariadb.service | /var/log/mariadb/mariadb.log |
| Document-oriented database (MongoDB) | mongod.service | /var/log/mongodb/mongodb.log |
| Virtual network switch (Open vSwitch) | openvswitch-nonetwork.service |
/var/log/openvswitch/ovsdb-server.log |
6.2. The centralized log system architecture and components
Monitoring tools use a client-server model with the client deployed onto the Red Hat OpenStack Platform (RHOSP) overcloud nodes. The Fluentd service provides client-side centralized logging (CL). All RHOSP services generate and update log files. These log files record actions, errors, warnings, and other events. In a distributed environment like OpenStack, collecting these logs in a central location simplifies debugging and administration. Centralized logging allows you to have one central place to view logs across your entire OpenStack environment. These logs come from the operating system, such as syslog and audit log files, infrastructure components such as RabbitMQ and MariaDB, and OpenStack services such as Identity, Compute, and others. The centralized logging toolchain consists of the following components:
- Log Collection Agent (Fluentd)
- Log Relay/Transformer (Fluentd)
- Data Store (ElasticSearch)
- API/Presentation Layer (Kibana)
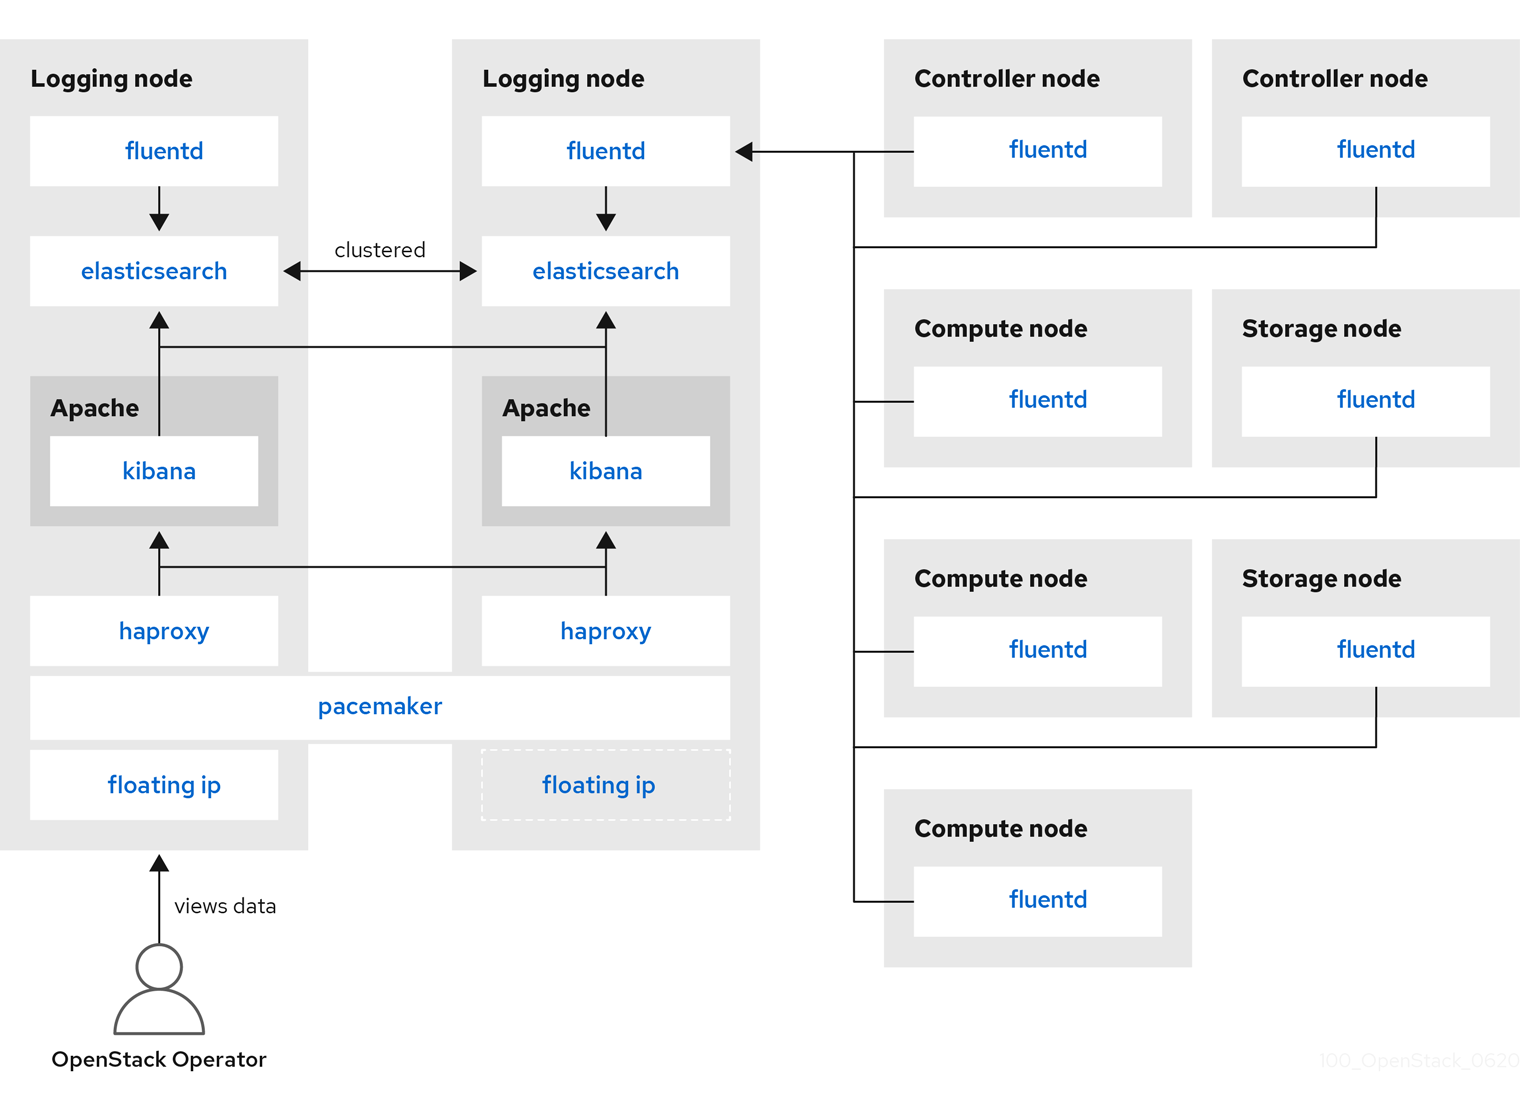
Red Hat OpenStack Platform director does not deploy the server-side components for centralized logging. Red Hat does not support the server-side components, including the ElasticSearch database, Kibana, and Fluentd with plug-ins running as a log aggregator. The centralized logging components and their interactions are described in the following diagrams.
Items shown in blue denote Red Hat-supported components.
Figure 6.1. Single HA deployment for Red Hat OpenStack Platform
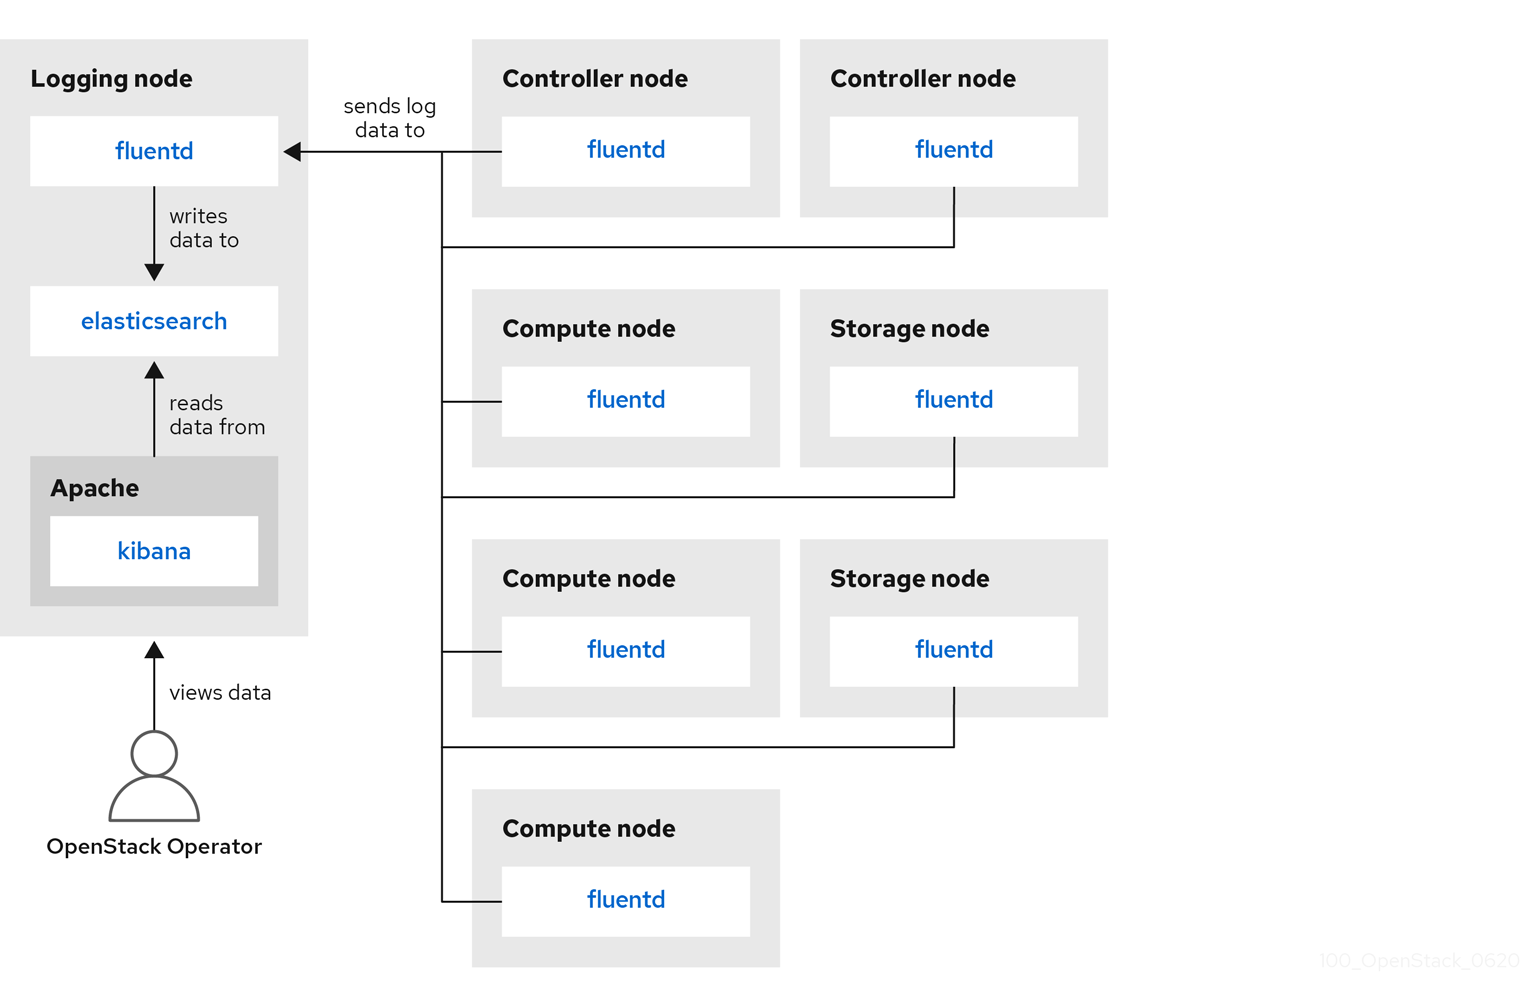
Figure 6.2. HA deployment for Red Hat OpenStack Platform
6.3. Overview of the installation of the logs service
The log collection agent Fluentd collects logs on the client side and sends these logs to a Fluentd instance running on the server side. This Fluentd instance redirects log records to Elasticsearch for storage.
6.4. Deploying Fluentd on all machines
Fluentd is a log collection agent and is part of the centralized logging toolchain. To deploy Fluentd on all machines, you must modify the LoggingServers parameter in the logging-environment.yaml file:
Prerequisites
- Ensure that Elasticsearch and Fluentd relay are installed on the server side. For more information, see the example deployment in the opstools-ansible project with which our client-side integration is compatible.
Procedure
-
Copy the
tripleo-heat-templates/environments/logging-environment.yamlfile to your home directory. In the copied file, create entries in the
LoggingServersparameter to suit your environment. The following snippet is an example configuration of theLoggingServersparameter:parameter_defaults: Simple configuration LoggingServers: - host: log0.example.com port: 24224 - host: log1.example.com port: 24224Include the modified environment file in the
openstack overcloud deploycommand with any other environment files that are relevant to your environment and deploy. Replace<existing_overcloud_environment_files>with the list of environment files that are part of your existing deployment:$ openstack overcloud deploy \ <existing_overcloud_environment_files> \ -e /home/templates/environments/logging-environment.yaml \ ...s .Additional resources
- For more information, see Section 6.5, “Configurable logging parameters”.
6.5. Configurable logging parameters
This table contains descriptions of the logging parameters that you can configure. You can find these parameters in the tripleo-heat-templates/puppet/services/logging/fluentd-config.yaml file.
| Parameter | Description |
|---|---|
| LoggingDefaultFormat | Default format used to parse messages from log files. |
| LoggingPosFilePath |
Directory in which to place Fluentd |
| LoggingDefaultGroups |
Add the Fluentd user to these groups. Override this parameter if you want to modify the default list of groups. Use the |
| LoggingExtraGroups |
Add the Fluentd user to these groups, in addition to the |
| LoggingDefaultFilters |
A list of Fluentd default filters. This list is passed verbatim to the |
| LoggingExtraFilters |
A list of additional Fluentd filters. This list is passed verbatim to the |
| LoggingUsesSSL |
A boolean value indicating whether or not to forward log messages using the |
| LoggingSSLKey |
PEM-encoded key for Fluentd CA certificate. The |
| LoggingSSLCertificate | PEM-encoded SSL CA certificate for Fluentd. |
| LoggingSSLKeyPassphrase |
Passphrase for the |
| LoggingSharedKey |
Shared secret for Fluentd |
| LoggingDefaultSources |
A list of default logging sources for Fluentd. Override this parameter to disable the default logging sources. Use the |
| LoggingExtraSources |
This list combines with the |
6.6. Overriding the default path for a log file
If you modify the default containers and the modification includes the path to the service log file, you must also modify the default log file path. Every composable service has a <service_name>LoggingSource parameter. For example, for nova-compute service, the parameter is NovaComputeLoggingSource.
Procedure
To override the default path for the nova-compute service, add the path to the
NovaComputeLoggingSourceparameter in your configuration file.NovaComputeLoggingSource: tag: openstack.nova.compute path: /some/other/path/nova-compute.logThe tag and path attributes are mandatory elements of the
<service_name>LoggingSourceparameter. On each service, the tag and the path are defined and the rest of the values are derived by default.You can modify the format for a specific service. This passes directly to the Fluentd configuration. The default format for the
LoggingDefaultFormatparameter is /(?<time>\d{4}-\d{2}-\d{2} \d{2}:\d{2}:\d{2}.\d+) (?<pid>\d+) (?<priority>\S+) (?<message>.*)$/ Use the following syntax:<service_name>LoggingSource: tag: <service_name>.tag path: <service_name>.path format: <service_name>.formatThe following snippet is an example of a more complex transformation:
 ServiceLoggingSource:
    tag: openstack.Service
    path: /var/log/containers/service/service.log
    format: multiline
    format_firstline: '/^\d{4}-\d{2}-\d{2} \d{2}:\d{2}:\d{2}.\d{3} \d+ \S+ \S+ \[(req-\S+ \S+ \S+ \S+ \S+ \S+|-)\]/'
    format1: '/^(?<Timestamp>\S+ \S+) (?<Pid>\d+) (?<log_level>\S+) (?<python_module>\S+) (\[(req-(?<request_id>\S+) (?<user_id>\S+) (?<tenant_id>\S+) (?<domain_id>\S+) (?<user_domain>\S+) (?<project_domain>\S+)|-)\])? (?<Payload>.*)?$/'
6.7. Verifying a successful deployment
To verify that centralized logging deployed successfully, view logs to see if the output matches expectations. You can use third-party visualization software, for example, Kibana.