Logging, Monitoring, and Troubleshooting Guide
An In-Depth Guide to OpenStack Logging, Monitoring, and Troubleshooting
Abstract
Making open source more inclusive
Red Hat is committed to replacing problematic language in our code, documentation, and web properties. We are beginning with these four terms: master, slave, blacklist, and whitelist. Because of the enormity of this endeavor, these changes will be implemented gradually over several upcoming releases. For more details, see our CTO Chris Wright’s message.
Providing feedback on Red Hat documentation
We appreciate your input on our documentation. Tell us how we can make it better.
Using the Direct Documentation Feedback (DDF) function
Use the Add Feedback DDF function for direct comments on specific sentences, paragraphs, or code blocks.
- View the documentation in the Multi-page HTML format.
- Ensure that you see the Feedback button in the upper right corner of the document.
- Highlight the part of text that you want to comment on.
- Click Add Feedback.
- Complete the Add Feedback field with your comments.
- Optional: Add your email address so that the documentation team can contact you for clarification on your issue.
- Click Submit.
Chapter 1. About This Guide
Red Hat is currently reviewing the information and procedures provided in this guide for this release.
This document is based on the Red Hat OpenStack Platform 12 document, available at Logging, Monitoring, and Troubleshooting Guide.
If you require assistance for the current Red Hat OpenStack Platform release, please contact Red Hat support.
Chapter 2. Installing and configuring the logs service
Red Hat OpenStack Platform (RHOSP) writes informational messages to specific log files; you can use these messages for troubleshooting and monitoring system events. The log collection agent Rsyslog collects logs on the client side and sends these logs to an instance of Rsyslog that is running on the server side. The server-side Rsyslog instance redirects log records to Elasticsearch for storage.
You do not need to attach the individual log files to your support cases manually. The sosreport utility gathers the required logs automatically.
2.1. The centralized log system architecture and components
Monitoring tools use a client-server model with the client deployed onto the Red Hat OpenStack Platform (RHOSP) overcloud nodes. The Rsyslog service provides client-side centralized logging (CL).
All RHOSP services generate and update log files. These log files record actions, errors, warnings, and other events. In a distributed environment like OpenStack, collecting these logs in a central location simplifies debugging and administration.
With centralized logging, there is one central place to view logs across your entire RHOSP environment. These logs come from the operating system, such as syslog and audit log files, infrastructure components, such as RabbitMQ and MariaDB, and OpenStack services such as Identity, Compute, and others. The centralized logging toolchain consists of the following components:
- Log Collection Agent (Rsyslog)
- Data Store (ElasticSearch)
- API/Presentation Layer (Grafana)
Red Hat OpenStack Platform director does not deploy the server-side components for centralized logging. Red Hat does not support the server-side components, including the Elasticsearch database and Grafana.
2.2. Enabling centralized logging with Elasticsearch
To enable centralized logging, you must specify the implementation of the OS::TripleO::Services::Rsyslog composable service.
The Rsyslog service uses only Elasticsearch as a data store for centralized logging.
Prerequisites
- Elasticsearch is installed on the server side.
Procedure
Add the file path of the logging environment file to the
overcloud deploymentcommand with any other environment files that are relevant to your environment and deploy, as shown in the following example:openstack overcloud deploy \ <existing_overcloud_environment_files> \ -e /usr/share/openstack-tripleo-heat-templates/environments/logging-environment-rsyslog.yamlReplace
<existing_overcloud_environment_files>with the list of environment files that are part of your existing deployment.
2.3. Configuring logging features
To configure logging features, modify the RsyslogElasticsearchSetting parameter in the logging-environment-rsyslog.yaml file.
Procedure
-
Copy the
tripleo-heat-templates/environments/logging-environment-rsyslog.yamlfile to your home directory. Create entries in the
RsyslogElasticsearchSettingparameter to suit your environment. The following snippet is an example configuration of theRsyslogElasticsearchSettingparameter:parameter_defaults: RsyslogElasticsearchSetting: uid: "elastic" pwd: "yourownpassword" skipverifyhost: "on" allowunsignedcerts: "on" server: "https://log-store-service-telemetry.apps.stfcloudops1.lab.upshift.rdu2.redhat.com" serverport: 443
Additional resources
- For more information about the configurable parameters, see Section 2.3.1, “Configurable logging parameters”.
2.3.1. Configurable logging parameters
This table contains descriptions of logging parameters that you use to configure logging features in Red Hat OpenStack Platform (RHOSP). You can find these parameters in the tripleo-heat-templates/deployment/logging/rsyslog-container-puppet.yaml file.
| Parameter | Description |
|---|---|
|
|
Configuration for |
|
| Contains the content of the CA cert for the CA that issued the Elasticsearch server cert. |
|
| Contains the content of the client cert for doing client cert authorization against Elasticsearch. |
|
|
Contains the content of the private key corresponding to the cert |
2.4. Overriding the default path for a log file
If you modify the default containers and the modification includes the path to the service log file, you must also modify the default log file path. Every composable service has a <service_name>LoggingSource parameter. For example, for the nova-compute service, the parameter is NovaComputeLoggingSource.
Procedure
To override the default path for the nova-compute service, add the path to the
NovaComputeLoggingSourceparameter in your configuration file:NovaComputeLoggingSource: tag: openstack.nova.compute file: /some/other/path/nova-compute.logNoteFor each service, define the
tagandfile. Other values are derived by default.You can modify the format for a specific service. This passes directly to the Rsyslog configuration. The default format for the
LoggingDefaultFormatparameter is /(?<time>\d{4}-\d{2}-\d{2} \d{2}:\d{2}:\d{2}.\d+) (?<pid>\d+) (?<priority>\S+) (?<message>.*)$/ Use the following syntax:<service_name>LoggingSource: tag: <service_name>.tag path: <service_name>.path format: <service_name>.formatThe following snippet is an example of a more complex transformation:
 ServiceLoggingSource:
    tag: openstack.Service
    path: /var/log/containers/service/service.log
    format: multiline
    format_firstline: '/^\d{4}-\d{2}-\d{2} \d{2}:\d{2}:\d{2}.\d{3} \d+ \S+ \S+ \[(req-\S+ \S+ \S+ \S+ \S+ \S+|-)\]/'
    format1: '/^(?<Timestamp>\S+ \S+) (?<Pid>\d+) (?<log_level>\S+) (?<python_module>\S+) (\[(req-(?<request_id>\S+) (?<user_id>\S+) (?<tenant_id>\S+) (?<domain_id>\S+) (?<user_domain>\S+) (?<project_domain>\S+)|-)\])? (?<Payload>.*)?$/'
2.5. Modifying the format of a log record
You can modify the format of the start of the log record for a specific service. This passes directly to the Rsyslog configuration.
The default format for the Red Hat OpenStack Platform (RHOSP) log record is ('^[0-9]{4}-[0-9]{2}-[0-9]{2} [0-9]{2}:[0-9]{2}:[0-9]{2}(.[0-9]+ [0-9]+)? (DEBUG|INFO|WARNING|ERROR) ').
Procedure
To add a different regular expression for parsing the start of log records, add
startmsg.regexto the configuration:NovaComputeLoggingSource: tag: openstack.nova.compute file: /some/other/path/nova-compute.log startmsg.regex: "^[0-9]{4}-[0-9]{2}-[0-9]{2} [0-9]{2}:[0-9]{2}:[0-9]{2}(.[0-9]+ \\+[0-9]+)? [A-Z]+ \\([a-z]+\\)
2.6. Testing the connection between Rsyslog and Elasticsearch
On the client side, you can verify communication between Rsyslog and Elasticsearch.
Procedure
-
Navigate to the Elasticsearch connection log file,
/var/log/rsyslog/omelasticsearch.login the Rsyslog container or/var/log/containers/rsyslog/omelasticsearch.logon the host. If this log file does not exist or if the log file exists but does not contain logs, there is no connection problem. If the log file is present and contains logs, Rsyslog has not connected successfully.
To test the connection from the server side, view the Elasticsearch logs for connection issues.
2.7. Server-side logging
If you have an Elasticsearch cluster running, you must configure the RsyslogElasticsearchSetting parameter in the logging-environment-rsyslog.yaml file to connect Rsyslog that is running on overcloud nodes. To configure the RsyslogElasticsearchSetting parameter, see https://www.rsyslog.com/doc/v8-stable/configuration/modules/omelasticsearch.html
2.8. Tracebacks
When you encounter an issue and you start troubleshooting, you can use a traceback log to diagnose the issue. In log files, tracebacks usually have several lines of information, all relating to the same issue.
Rsyslog provides a regular expression to define how a log record starts. Each log record usually starts with a timestamp and the first line of the traceback is the only line that contains this information. Rsyslog bundles the indented records with the first line and sends them as one log record.
For that behaviour configuration option startmsg.regex in <Service>LoggingSource is used. The following regular expression is the default value for all <service>LoggingSource parameters in director:
startmsg.regex='^[0-9]{4}-[0-9]{2}-[0-9]{2} [0-9]{2}:[0-9]{2}:[0-9]{2}(.[0-9]+ [0-9]+)? (DEBUG|INFO|WARNING|ERROR) '
When this default does not match log records of your added or modified LoggingSource, you must change startmsg.regex accordingly.
2.9. Location of log files for OpenStack services
Each OpenStack component has a separate logging directory containing files specific to a running service.
2.9.1. Bare Metal Provisioning (ironic) log files
| Service | Service name | Log path |
|---|---|---|
| OpenStack Ironic API | openstack-ironic-api.service | /var/log/containers/ironic/ironic-api.log |
| OpenStack Ironic Conductor | openstack-ironic-conductor.service | /var/log/containers/ironic/ironic-conductor.log |
2.9.2. Block Storage (cinder) log files
| Service | Service name | Log path |
|---|---|---|
| Block Storage API | openstack-cinder-api.service | /var/log/containers/cinder-api.log |
| Block Storage Backup | openstack-cinder-backup.service | /var/log/containers/cinder/backup.log |
| Informational messages | The cinder-manage command | /var/log/containers/cinder/cinder-manage.log |
| Block Storage Scheduler | openstack-cinder-scheduler.service | /var/log/containers/cinder/scheduler.log |
| Block Storage Volume | openstack-cinder-volume.service | /var/log/containers/cinder/volume.log |
2.9.3. Compute (nova) log files
| Service | Service name | Log path |
|---|---|---|
| OpenStack Compute API service | openstack-nova-api.service | /var/log/containers/nova/nova-api.log |
| OpenStack Compute certificate server | openstack-nova-cert.service | /var/log/containers/nova/nova-cert.log |
| OpenStack Compute service | openstack-nova-compute.service | /var/log/containers/nova/nova-compute.log |
| OpenStack Compute Conductor service | openstack-nova-conductor.service | /var/log/containers/nova/nova-conductor.log |
| OpenStack Compute VNC console authentication server | openstack-nova-consoleauth.service | /var/log/containers/nova/nova-consoleauth.log |
| Informational messages | nova-manage command | /var/log/containers/nova/nova-manage.log |
| OpenStack Compute NoVNC Proxy service | openstack-nova-novncproxy.service | /var/log/containers/nova/nova-novncproxy.log |
| OpenStack Compute Scheduler service | openstack-nova-scheduler.service | /var/log/containers/nova/nova-scheduler.log |
2.9.4. Dashboard (horizon) log files
| Service | Service name | Log path |
|---|---|---|
| Log of certain user interactions | Dashboard interface | /var/log/containers/horizon/horizon.log |
The Apache HTTP server uses several additional log files for the Dashboard web interface, which you can access by using a web browser or command-line client, for example, keystone and nova. The log files in the following table can be helpful in tracking the use of the Dashboard and diagnosing faults:
| Purpose | Log path |
|---|---|
| All processed HTTP requests | /var/log/containers/httpd/horizon_access.log |
| HTTP errors | /var/log/containers/httpd/horizon_error.log |
| Admin-role API requests | /var/log/containers/httpd/keystone_wsgi_admin_access.log |
| Admin-role API errors | /var/log/containers/httpd/keystone_wsgi_admin_error.log |
| Member-role API requests | /var/log/containers/httpd/keystone_wsgi_main_access.log |
| Member-role API errors | /var/log/containers/httpd/keystone_wsgi_main_error.log |
There is also /var/log/containers/httpd/default_error.log, which stores errors reported by other web services that are running on the same host.
2.9.5. Identity Service (keystone) log files
| Service | Service name | Log Path |
|---|---|---|
| OpenStack Identity Service | openstack-keystone.service | /var/log/containers/keystone/keystone.log |
2.9.6. Image Service (glance) log files
| Service | Service name | Log path |
|---|---|---|
| OpenStack Image Service API server | openstack-glance-api.service | /var/log/containers/glance/api.log |
| OpenStack Image Service Registry server | openstack-glance-registry.service | /var/log/containers/glance/registry.log |
2.9.7. Networking (neutron) log files
| Service | Service name | Log path |
|---|---|---|
| OpenStack Neutron DHCP Agent | neutron-dhcp-agent.service | /var/log/containers/neutron/dhcp-agent.log |
| OpenStack Networking Layer 3 Agent | neutron-l3-agent.service | /var/log/containers/neutron/l3-agent.log |
| Metadata agent service | neutron-metadata-agent.service | /var/log/containers/neutron/metadata-agent.log |
| Metadata namespace proxy | n/a | /var/log/containers/neutron/neutron-ns-metadata-proxy-UUID.log |
| Open vSwitch agent | neutron-openvswitch-agent.service | /var/log/containers/neutron/openvswitch-agent.log |
| OpenStack Networking service | neutron-server.service | /var/log/containers/neutron/server.log |
2.9.8. Object Storage (swift) log files
OpenStack Object Storage sends logs to the system logging facility only.
By default, all Object Storage log files go to /var/log/containers/swift/swift.log, using the local0, local1, and local2 syslog facilities.
The log messages of Object Storage are classified into two broad categories: those by REST API services and those by background daemons. The API service messages contain one line per API request, in a manner similar to popular HTTP servers; both the frontend (Proxy) and backend (Account, Container, Object) services post such messages. The daemon messages are less structured and typically contain human-readable information about daemons performing their periodic tasks. However, regardless of which part of Object Storage produces the message, the source identity is always at the beginning of the line.
Here is an example of a proxy message:
Apr 20 15:20:34 rhev-a24c-01 proxy-server: 127.0.0.1 127.0.0.1 20/Apr/2015/19/20/34 GET /v1/AUTH_zaitcev%3Fformat%3Djson%26marker%3Dtestcont HTTP/1.0 200 - python-swiftclient-2.1.0 AUTH_tk737d6... - 2 - txc454fa8ea4844d909820a-0055355182 - 0.0162 - - 1429557634.806570053 1429557634.822791100Here is an example of ad-hoc messages from background daemons:
Apr 27 17:08:15 rhev-a24c-02 object-auditor: Object audit (ZBF). Since Mon Apr 27 21:08:15 2015: Locally: 1 passed, 0 quarantined, 0 errors files/sec: 4.34 , bytes/sec: 0.00, Total time: 0.23, Auditing time: 0.00, Rate: 0.00
Apr 27 17:08:16 rhev-a24c-02 object-auditor: Object audit (ZBF) "forever" mode completed: 0.56s. Total quarantined: 0, Total errors: 0, Total files/sec: 14.31, Total bytes/sec: 0.00, Auditing time: 0.02, Rate: 0.04
Apr 27 17:08:16 rhev-a24c-02 account-replicator: Beginning replication run
Apr 27 17:08:16 rhev-a24c-02 account-replicator: Replication run OVER
Apr 27 17:08:16 rhev-a24c-02 account-replicator: Attempted to replicate 5 dbs in 0.12589 seconds (39.71876/s)
Apr 27 17:08:16 rhev-a24c-02 account-replicator: Removed 0 dbs
Apr 27 17:08:16 rhev-a24c-02 account-replicator: 10 successes, 0 failures
2.9.9. Orchestration (heat) log files
| Service | Service name | Log path |
|---|---|---|
| OpenStack Heat API Service | openstack-heat-api.service | /var/log/containers/heat/heat-api.log |
| OpenStack Heat Engine Service | openstack-heat-engine.service | /var/log/containers/heat/heat-engine.log |
| Orchestration service events | n/a | /var/log/containers/heat/heat-manage.log |
2.9.11. Telemetry (ceilometer) log files
| Service | Service name | Log path |
|---|---|---|
| OpenStack ceilometer notification agent | ceilometer_agent_notification | /var/log/containers/ceilometer/agent-notification.log |
| OpenStack ceilometer central agent | ceilometer_agent_central | /var/log/containers/ceilometer/central.log |
| OpenStack ceilometer collection | openstack-ceilometer-collector.service | /var/log/containers/ceilometer/collector.log |
| OpenStack ceilometer compute agent | ceilometer_agent_compute | /var/log/containers/ceilometer/compute.log |
2.9.12. Log files for supporting services
The following services are used by the core OpenStack components and have their own log directories and files.
| Service | Service name | Log path |
|---|---|---|
| Message broker (RabbitMQ) | rabbitmq-server.service |
/var/log/rabbitmq/rabbit@short_hostname.log |
| Database server (MariaDB) | mariadb.service | /var/log/mariadb/mariadb.log |
| Virtual network switch (Open vSwitch) | openvswitch-nonetwork.service |
/var/log/openvswitch/ovsdb-server.log |
2.9.13. aodh (alarming service) log files
| Service | Container name | Log path |
|---|---|---|
| Alarming API | aodh_api | /var/log/containers/httpd/aodh-api/aodh_wsgi_access.log |
| Alarm evaluator log | aodh_evaluator | /var/log/containers/aodh/aodh-evaluator.log |
| Alarm listener | aodh_listener | /var/log/containers/aodh/aodh-listener.log |
| Alarm notification | aodh_notifier | /var/log/containers/aodh/aodh-notifier.log |
2.9.14. gnocchi (metric storage) log files
| Service | Container name | Log path |
|---|---|---|
| Gnocchi API | gnocchi_api | /var/log/containers/httpd/gnocchi-api/gnocchi_wsgi_access.log |
| Gnocchi metricd | gnocchi_metricd | /var/log/containers/gnocchi/gnocchi-metricd.log |
| Gnocchi statsd | gnocchi_statsd | /var/log/containers/gnocchi/gnocchi-statsd.log |
Chapter 3. Configuring the Time Series Database (Gnocchi) for Telemetry
Time series database (Gnocchi) is a multi-project, metrics, and resource database. It is designed to store metrics at a very large scale while providing access to metrics and resources information to operators and users.
3.1. Understanding the Time Series Database
This section defines the commonly used terms for the Time series database (Gnocchi)features.
- Aggregation method
-
A function used to aggregate multiple measures into an aggregate. For example, the
minaggregation method aggregates the values of different measures to the minimum value of all the measures in the time range. - Aggregate
- A data point tuple generated from several measures according to the archive policy. An aggregate is composed of a time stamp and a value.
- Archive policy
- An aggregate storage policy attached to a metric. An archive policy determines how long aggregates are kept in a metric and how aggregates are aggregated (the aggregation method).
- Granularity
- The time between two aggregates in an aggregated time series of a metric.
- Measure
- An incoming data point tuple sent to the Time series database by the API. A measure is composed of a time stamp and a value.
- Metric
- An entity storing aggregates identified by an UUID. A metric can be attached to a resource using a name. How a metric stores its aggregates is defined by the archive policy that the metric is associated to.
- Resource
- An entity representing anything in your infrastructure that you associate a metric with. A resource is identified by a unique ID and can contain attributes.
- Time series
- A list of aggregates ordered by time.
- Timespan
- The time period for which a metric keeps its aggregates. It is used in the context of archive policy.
3.2. Metrics
The Time series database (Gnocchi) stores metrics from Telemetry that designate anything that can be measured, for example, the CPU usage of a server, the temperature of a room or the number of bytes sent by a network interface.
A metric has the following properties:
- UUID to identify the metric
- Metric name
- Archive policy used to store and aggregate the measures
The Time series database stores the following metrics by default, as defined in the etc/ceilometer/polling.yaml file:
[root@controller-0 ~]# podman exec -ti ceilometer_agent_central cat /etc/ceilometer/polling.yaml
---
sources:
    - name: some_pollsters
      interval: 300
      meters:
        - cpu
        - memory.usage
        - network.incoming.bytes
        - network.incoming.packets
        - network.outgoing.bytes
        - network.outgoing.packets
        - disk.read.bytes
        - disk.read.requests
        - disk.write.bytes
        - disk.write.requests
        - hardware.cpu.util
        - hardware.memory.used
        - hardware.memory.total
        - hardware.memory.buffer
        - hardware.memory.cached
        - hardware.memory.swap.avail
        - hardware.memory.swap.total
        - hardware.system_stats.io.outgoing.blocks
        - hardware.system_stats.io.incoming.blocks
        - hardware.network.ip.incoming.datagrams
        - hardware.network.ip.outgoing.datagrams
The polling.yaml file also specifies the default polling interval of 300 seconds (5 minutes).
3.3. Time Series Database Components
Currently, Gnocchi uses the Identity service for authentication and Redis for incoming measure storage. To store the aggregated measures, Gnocchi relies on either Swift or Ceph (Object Storage). Gnocchi also leverages MySQL to store the index of resources and metrics.
The time series database provides the statsd deamon (gnocchi-statsd) that is compatible with the statsd protocol and can listen to the metrics sent over the network. To enable statsd support in Gnocchi, configure the [statsd] option in the configuration file. The resource ID parameter is used as the main generic resource where all the metrics are attached, a user and project ID that are associated with the resource and metrics, and an archive policy name that is used to create the metrics.
All the metrics are created dynamically as the metrics are sent to gnocchi-statsd, and attached with the provided name to the resource ID you configured.
3.4. Running the Time Series Database
Run the time series database by running the HTTP server and metric daemon:
# gnocchi-api
# gnocchi-metricd
3.5. Running As A WSGI Application
You can run Gnocchi through a WSGI service such as mod_wsgi or any other WSGI application. You can use the gnocchi/rest/app.wsgi file, which is provided with Gnocchi, to enable Gnocchi as a WSGI application.
The Gnocchi API tier runs using WSGI. This means it can be run using Apache httpd and mod_wsgi, or another HTTP daemon such as uwsgi. Configure the number of processes and threads according to the number of CPUs you have, usually around 1.5 × number of CPUs. If one server is not enough, you can spawn any number of new API servers to scale Gnocchi out, even on different machines.
3.6. metricd Workers
By default, the gnocchi-metricd daemon spans all your CPU power to maximize CPU utilization when computing metric aggregation. You can use the gnocchi status command to query the HTTP API and get the cluster status for metric processing. This command displays the number of metrics to process, known as the processing backlog for the gnocchi-metricd. As long as this backlog is not continuously increasing, that means that gnocchi-metricd can cope with the amount of metric that are being sent. If the number of measure to process is continuously increasing, you might need to temporarily increase the number of the gnocchi-metricd daemons. You can run any number of metricd daemons on any number of servers.
For director-based deployments, you can adjust certain metric processing parameters in your environment file:
-
MetricProcessingDelay- Adjusts the delay period between iterations of metric processing. -
GnocchiMetricdWorkers- Configure the number ofmetricdworkers.
3.7. Monitoring the Time Series Database
The /v1/status endpoint of the HTTP API returns various information, such as the number of measures to process (measures backlog), which you can easily monitor. To verify good health of the overall system, ensure that the HTTP server and the gnocchi-metricd daemon are running and are not writing errors in their log files.
3.8. Backing up and Restoring the Time Series Database
To recover from an unfortunate event, backup both the index and the storage. You must create a database dump (PostgreSQL or MySQL), and create snapshots or copies of your data storage (Ceph, Swift or your file system). The procedure to restore is: restore your index and storage backups, re-install Gnocchi if necessary, and restart it.
3.9. Batch deleting old resources from Gnocchi
To remove outdated measures, create the archive policy to suit your requirements. To batch delete resources, metrics and measures, use the CLI or REST API. For example, to delete resources and all their associated metrics that were terminated 30 days ago, run the following command:
openstack metric resource batch delete "ended_at < '-30days'"3.10. Capacity metering using the Telemetry service
The OpenStack Telemetry service provides usage metrics that you can use for billing, charge-back, and show-back purposes. Such metrics data can also be used by third-party applications to plan for capacity on the cluster and can also be leveraged for auto-scaling virtual instances using OpenStack Heat. For more information, see Auto Scaling for Instances.
You can use the combination of Ceilometer and Gnocchi for monitoring and alarms. This is supported on small-size clusters and with known limitations. For real-time monitoring, Red Hat OpenStack Platform ships with agents that provide metrics data, and can be consumed by separate monitoring infrastructure and applications. For more information, see Monitoring Tools Configuration.
3.10.1. Viewing measures
List all the measures for a particular resource:
# openstack metric measures show --resource-id UUID METER_NAMEList only measures for a particular resource, within a range of timestamps:
# openstack metric measures show --aggregation mean --start <START_TIME> --stop <STOP_TIME> --resource-id UUID METER_NAMEThe timestamp variables <START_TIME> and <STOP_TIME> use the format iso-dateThh:mm:ss.
3.10.2. Creating new measures
You can use measures to send data to the Telemetry service, and they do not need to correspond to a previously-defined meter. For example:
# openstack metrics measures add -m 2015-01-12T17:56:23@42 --resource-id UUID METER_NAME3.10.3. Example: Viewing cloud usage measures
This example shows the average memory usage of all instances for each project.
# openstack metric measures aggregation --resource-type instance --groupby project_id -m memory3.10.4. View Existing Alarms
To list the existing Telemetry alarms, use the aodh command. For example:
# aodh alarm list
+--------------------------------------+--------------------------------------------+----------------------------+-------------------+----------+---------+
| alarm_id                             | type                                       | name                       | state             | severity | enabled |
+--------------------------------------+--------------------------------------------+----------------------------+-------------------+----------+---------+
| 922f899c-27c8-4c7d-a2cf-107be51ca90a | gnocchi_aggregation_by_resources_threshold | iops-monitor-read-requests | insufficient data | low      | True    |
+--------------------------------------+--------------------------------------------+----------------------------+-------------------+----------+---------+
To list the meters assigned to a resource, specify the UUID of the resource (an instance, image, or volume, among others). For example:
# gnocchi resource show 5e3fcbe2-7aab-475d-b42c-a440aa42e5ad3.10.5. Create an Alarm
You can use aodh to create an alarm that activates when a threshold value is reached. In this example, the alarm activates and adds a log entry when the average CPU utilization for an individual instance exceeds 80%. A query is used to isolate the specific instance’s id (94619081-abf5-4f1f-81c7-9cedaa872403) for monitoring purposes:
# aodh alarm create --type gnocchi_aggregation_by_resources_threshold --name cpu_usage_high --metric cpu_util --threshold 80 --aggregation-method sum --resource-type instance --query '{"=": {"id": "94619081-abf5-4f1f-81c7-9cedaa872403"}}' --alarm-action 'log://'
+---------------------------+-------------------------------------------------------+
| Field                     | Value                                                 |
+---------------------------+-------------------------------------------------------+
| aggregation_method        | sum                                                   |
| alarm_actions             | [u'log://']                                           |
| alarm_id                  | b794adc7-ed4f-4edb-ace4-88cbe4674a94                  |
| comparison_operator       | eq                                                    |
| description               | gnocchi_aggregation_by_resources_threshold alarm rule |
| enabled                   | True                                                  |
| evaluation_periods        | 1                                                     |
| granularity               | 60                                                    |
| insufficient_data_actions | []                                                    |
| metric                    | cpu_util                                              |
| name                      | cpu_usage_high                                        |
| ok_actions                | []                                                    |
| project_id                | 13c52c41e0e543d9841a3e761f981c20                      |
| query                     | {"=": {"id": "94619081-abf5-4f1f-81c7-9cedaa872403"}} |
| repeat_actions            | False                                                 |
| resource_type             | instance                                              |
| severity                  | low                                                   |
| state                     | insufficient data                                     |
| state_timestamp           | 2016-12-09T05:18:53.326000                            |
| threshold                 | 80.0                                                  |
| time_constraints          | []                                                    |
| timestamp                 | 2016-12-09T05:18:53.326000                            |
| type                      | gnocchi_aggregation_by_resources_threshold            |
| user_id                   | 32d3f2c9a234423cb52fb69d3741dbbc                      |
+---------------------------+-------------------------------------------------------+
To edit an existing threshold alarm, use the aodh alarm update command. For example, to increase the alarm threshold to 75%:
# aodh alarm update --name cpu_usage_high --threshold 753.10.6. Disable or Delete an Alarm
To disable an alarm:
# aodh alarm update --name cpu_usage_high --enabled=falseTo delete an alarm:
# aodh alarm delete --name cpu_usage_high3.10.7. Example: Monitor the disk activity of instances
The following example demonstrates how to use an Aodh alarm to monitor the cumulative disk activity for all the instances contained within a particular project.
1. Review the existing projects, and select the appropriate UUID of the project you need to monitor. This example uses the admin project:
$ openstack project list
+----------------------------------+----------+
| ID                               | Name     |
+----------------------------------+----------+
| 745d33000ac74d30a77539f8920555e7 | admin    |
| 983739bb834a42ddb48124a38def8538 | services |
| be9e767afd4c4b7ead1417c6dfedde2b | demo     |
+----------------------------------+----------+
2. Use the project’s UUID to create an alarm that analyses the sum() of all read requests generated by the instances in the admin project (the query can be further restrained with the --query parameter).
# aodh alarm create --type gnocchi_aggregation_by_resources_threshold --name iops-monitor-read-requests --metric disk.read.requests.rate --threshold 42000 --aggregation-method sum --resource-type instance --query '{"=": {"project_id": "745d33000ac74d30a77539f8920555e7"}}'
+---------------------------+-----------------------------------------------------------+
| Field                     | Value                                                     |
+---------------------------+-----------------------------------------------------------+
| aggregation_method        | sum                                                       |
| alarm_actions             | []                                                        |
| alarm_id                  | 192aba27-d823-4ede-a404-7f6b3cc12469                      |
| comparison_operator       | eq                                                        |
| description               | gnocchi_aggregation_by_resources_threshold alarm rule     |
| enabled                   | True                                                      |
| evaluation_periods        | 1                                                         |
| granularity               | 60                                                        |
| insufficient_data_actions | []                                                        |
| metric                    | disk.read.requests.rate                                   |
| name                      | iops-monitor-read-requests                                |
| ok_actions                | []                                                        |
| project_id                | 745d33000ac74d30a77539f8920555e7                          |
| query                     | {"=": {"project_id": "745d33000ac74d30a77539f8920555e7"}} |
| repeat_actions            | False                                                     |
| resource_type             | instance                                                  |
| severity                  | low                                                       |
| state                     | insufficient data                                         |
| state_timestamp           | 2016-11-08T23:41:22.919000                                |
| threshold                 | 42000.0                                                   |
| time_constraints          | []                                                        |
| timestamp                 | 2016-11-08T23:41:22.919000                                |
| type                      | gnocchi_aggregation_by_resources_threshold                |
| user_id                   | 8c4aea738d774967b4ef388eb41fef5e                          |
+---------------------------+-----------------------------------------------------------+
3.10.8. Example: Monitor CPU usage
If you want to monitor an instance’s performance, you would start by examining the gnocchi database to identify which metrics you can monitor, such as memory or CPU usage. For example, run gnocchi resource show against an instance to identify which metrics can be monitored:
Query the available metrics for a particular instance UUID:
$ gnocchi resource show --type instance d71cdf9a-51dc-4bba-8170-9cd95edd3f66
--------------------------------------------------------------------------------------------+
| Field                 | Value                                                               |
--------------------------------------------------------------------------------------------+
| created_by_project_id | 44adccdc32614688ae765ed4e484f389                                    |
| created_by_user_id    | c24fa60e46d14f8d847fca90531b43db                                    |
| creator               | c24fa60e46d14f8d847fca90531b43db:44adccdc32614688ae765ed4e484f389   |
| display_name          | test-instance                                                       |
| ended_at              | None                                                                |
| flavor_id             | 14c7c918-df24-481c-b498-0d3ec57d2e51                                |
| flavor_name           | m1.tiny                                                             |
| host                  | overcloud-compute-0                                                 |
| id                    | d71cdf9a-51dc-4bba-8170-9cd95edd3f66                                |
| image_ref             | e75dff7b-3408-45c2-9a02-61fbfbf054d7                                |
| metrics               | compute.instance.booting.time: c739a70d-2d1e-45c1-8c1b-4d28ff2403ac |
|                       | cpu.delta: 700ceb7c-4cff-4d92-be2f-6526321548d6                     |
|                       | cpu: 716d6128-1ea6-430d-aa9c-ceaff2a6bf32                           |
|                       | cpu_l3_cache: 3410955e-c724-48a5-ab77-c3050b8cbe6e                  |
|                       | cpu_util: b148c392-37d6-4c8f-8609-e15fc15a4728                      |
|                       | disk.allocation: 9dd464a3-acf8-40fe-bd7e-3cb5fb12d7cc               |
|                       | disk.capacity: c183d0da-e5eb-4223-a42e-855675dd1ec6                 |
|                       | disk.ephemeral.size: 15d1d828-fbb4-4448-b0f2-2392dcfed5b6           |
|                       | disk.iops: b8009e70-daee-403f-94ed-73853359a087                     |
|                       | disk.latency: 1c648176-18a6-4198-ac7f-33ee628b82a9                  |
|                       | disk.read.bytes.rate: eb35828f-312f-41ce-b0bc-cb6505e14ab7          |
|                       | disk.read.bytes: de463be7-769b-433d-9f22-f3265e146ec8               |
|                       | disk.read.requests.rate: 588ca440-bd73-4fa9-a00c-8af67262f4fd       |
|                       | disk.read.requests: 53e5d599-6cad-47de-b814-5cb23e8aaf24            |
|                       | disk.root.size: cee9d8b1-181e-4974-9427-aa7adb3b96d9                |
|                       | disk.usage: 4d724c99-7947-4c6d-9816-abbbc166f6f3                    |
|                       | disk.write.bytes.rate: 45b8da6e-0c89-4a6c-9cce-c95d49d9cc8b         |
|                       | disk.write.bytes: c7734f1b-b43a-48ee-8fe4-8a31b641b565              |
|                       | disk.write.requests.rate: 96ba2f22-8dd6-4b89-b313-1e0882c4d0d6      |
|                       | disk.write.requests: 553b7254-be2d-481b-9d31-b04c93dbb168           |
|                       | memory.bandwidth.local: 187f29d4-7c70-4ae2-86d1-191d11490aad        |
|                       | memory.bandwidth.total: eb09a4fc-c202-4bc3-8c94-aa2076df7e39        |
|                       | memory.resident: 97cfb849-2316-45a6-9545-21b1d48b0052               |
|                       | memory.swap.in: f0378d8f-6927-4b76-8d34-a5931799a301                |
|                       | memory.swap.out: c5fba193-1a1b-44c8-82e3-9fdc9ef21f69               |
|                       | memory.usage: 7958d06d-7894-4ca1-8c7e-72ba572c1260                  |
|                       | memory: a35c7eab-f714-4582-aa6f-48c92d4b79cd                        |
|                       | perf.cache.misses: da69636d-d210-4b7b-bea5-18d4959e95c1             |
|                       | perf.cache.references: e1955a37-d7e4-4b12-8a2a-51de4ec59efd         |
|                       | perf.cpu.cycles: 5d325d44-b297-407a-b7db-cc9105549193               |
|                       | perf.instructions: 973d6c6b-bbeb-4a13-96c2-390a63596bfc             |
|                       | vcpus: 646b53d0-0168-4851-b297-05d96cc03ab2                         |
| original_resource_id  | d71cdf9a-51dc-4bba-8170-9cd95edd3f66                                |
| project_id            | 3cee262b907b4040b26b678d7180566b                                    |
| revision_end          | None                                                                |
| revision_start        | 2017-11-16T04:00:27.081865+00:00                                    |
| server_group          | None                                                                |
| started_at            | 2017-11-16T01:09:20.668344+00:00                                    |
| type                  | instance                                                            |
| user_id               | 1dbf5787b2ee46cf9fa6a1dfea9c9996                                    |
--------------------------------------------------------------------------------------------+
In this result, the
metricsvalue lists the components you can monitor using Aodh alarms, for examplecpu_util.To monitor CPU usage, you will need the
cpu_utilmetric. To see more information on this metric:$ gnocchi metric show --resource d71cdf9a-51dc-4bba-8170-9cd95edd3f66 cpu_util -------------------------------------------------------------------------------------------------------+ | Field | Value | -------------------------------------------------------------------------------------------------------+ | archive_policy/aggregation_methods | std, count, min, max, sum, mean | | archive_policy/back_window | 0 | | archive_policy/definition | - points: 8640, granularity: 0:05:00, timespan: 30 days, 0:00:00 | | archive_policy/name | low | | created_by_project_id | 44adccdc32614688ae765ed4e484f389 | | created_by_user_id | c24fa60e46d14f8d847fca90531b43db | | creator | c24fa60e46d14f8d847fca90531b43db:44adccdc32614688ae765ed4e484f389 | | id | b148c392-37d6-4c8f-8609-e15fc15a4728 | | name | cpu_util | | resource/created_by_project_id | 44adccdc32614688ae765ed4e484f389 | | resource/created_by_user_id | c24fa60e46d14f8d847fca90531b43db | | resource/creator | c24fa60e46d14f8d847fca90531b43db:44adccdc32614688ae765ed4e484f389 | | resource/ended_at | None | | resource/id | d71cdf9a-51dc-4bba-8170-9cd95edd3f66 | | resource/original_resource_id | d71cdf9a-51dc-4bba-8170-9cd95edd3f66 | | resource/project_id | 3cee262b907b4040b26b678d7180566b | | resource/revision_end | None | | resource/revision_start | 2017-11-17T00:05:27.516421+00:00 | | resource/started_at | 2017-11-16T01:09:20.668344+00:00 | | resource/type | instance | | resource/user_id | 1dbf5787b2ee46cf9fa6a1dfea9c9996 | | unit | None | -------------------------------------------------------------------------------------------------------+-
archive_policy- Defines the aggregation interval for calculating thestd, count, min, max, sum, meanvalues.
-
Use Aodh to create a monitoring task that queries
cpu_util. This task will trigger events based on the settings you specify. For example, to raise a log entry when an instance’s CPU spikes over 80% for an extended duration:aodh alarm create \ --project-id 3cee262b907b4040b26b678d7180566b \ --name high-cpu \ --type gnocchi_resources_threshold \ --description 'High CPU usage' \ --metric cpu_util \ --threshold 80.0 \ --comparison-operator ge \ --aggregation-method mean \ --granularity 300 \ --evaluation-periods 1 \ --alarm-action 'log://' \ --ok-action 'log://' \ --resource-type instance \ --resource-id d71cdf9a-51dc-4bba-8170-9cd95edd3f66 +---------------------------+--------------------------------------+ | Field | Value | +---------------------------+--------------------------------------+ | aggregation_method | mean | | alarm_actions | [u'log://'] | | alarm_id | 1625015c-49b8-4e3f-9427-3c312a8615dd | | comparison_operator | ge | | description | High CPU usage | | enabled | True | | evaluation_periods | 1 | | granularity | 300 | | insufficient_data_actions | [] | | metric | cpu_util | | name | high-cpu | | ok_actions | [u'log://'] | | project_id | 3cee262b907b4040b26b678d7180566b | | repeat_actions | False | | resource_id | d71cdf9a-51dc-4bba-8170-9cd95edd3f66 | | resource_type | instance | | severity | low | | state | insufficient data | | state_reason | Not evaluated yet | | state_timestamp | 2017-11-16T05:20:48.891365 | | threshold | 80.0 | | time_constraints | [] | | timestamp | 2017-11-16T05:20:48.891365 | | type | gnocchi_resources_threshold | | user_id | 1dbf5787b2ee46cf9fa6a1dfea9c9996 | +---------------------------+--------------------------------------+-
comparison-operator- Thegeoperator defines that the alarm will trigger if the CPU usage is greater than (or equal to) 80%. -
granularity- Metrics have an archive policy associated with them; the policy can have various granularities (for example, 5 minutes aggregation for 1 hour + 1 hour aggregation over a month). Thegranularityvalue must match the duration described in the archive policy. -
evaluation-periods- Number ofgranularityperiods that need to pass before the alarm will trigger. For example, setting this value to2will mean that the CPU usage will need to be over 80% for two polling periods before the alarm will trigger. [u'log://']- This value will log events to your Aodh log file.NoteYou can define different actions to run when an alarm is triggered (
alarm_actions), and when it returns to a normal state (ok_actions), such as a webhook URL.
-
To check if your alarm has been triggered, query the alarm’s history:
aodh alarm-history show 1625015c-49b8-4e3f-9427-3c312a8615dd --fit-width
+----------------------------+------------------+---------------------------------------------------------------------------------------------------------------------------------------------------+--------------------------------------+
| timestamp                  | type             | detail                                                                                                                                            | event_id                             |
+----------------------------+------------------+---------------------------------------------------------------------------------------------------------------------------------------------------+--------------------------------------+
| 2017-11-16T05:21:47.850094 | state transition | {"transition_reason": "Transition to ok due to 1 samples inside threshold, most recent: 0.0366665763", "state": "ok"}                             | 3b51f09d-ded1-4807-b6bb-65fdc87669e4 |
+----------------------------+------------------+---------------------------------------------------------------------------------------------------------------------------------------------------+--------------------------------------+
3.10.9. Manage Resource Types
Telemetry resource types that were previously hardcoded can now be managed by the gnocchi client. You can use the gnocchi client to create, view, and delete resource types, and you can use the gnocchi API to update or delete attributes.
1. Create a new resource-type:
$ gnocchi resource-type create testResource01 -a bla:string:True:min_length=123
+----------------+------------------------------------------------------------+
| Field          | Value                                                      |
+----------------+------------------------------------------------------------+
| attributes/bla | max_length=255, min_length=123, required=True, type=string |
| name           | testResource01                                             |
| state          | active                                                     |
+----------------+------------------------------------------------------------+
2. Review the configuration of the resource-type:
$ gnocchi resource-type show testResource01
+----------------+------------------------------------------------------------+
| Field          | Value                                                      |
+----------------+------------------------------------------------------------+
| attributes/bla | max_length=255, min_length=123, required=True, type=string |
| name           | testResource01                                             |
| state          | active                                                     |
+----------------+------------------------------------------------------------+
3. Delete the resource-type:
$ gnocchi resource-type delete testResource01You cannot delete a resource type if a resource is using it.
Chapter 4. Troubleshooting
This chapter contains logging and support information to assist with troubleshooting your Red Hat OpenStack Platform deployment.
4.1. Support
If client commands fail or you run into other issues, contact Red Hat Technical Support with a description of what happened, the full console output, all log files referenced in the console output, and an sosreport from the node that is (or might be) in trouble. For example, if you encounter a problem on the compute level, run sosreport on the Nova node, or if it is a networking issue, run the utility on the Neutron node. For general deployment issues, it is best to run sosreport on the cloud controller.
For information about the sosreport command (sos package), refer to What is a sosreport and how to create one in Red Hat Enterprise Linux 4.6 and later.
Check also the /var/log/messages file for any hints.
4.2. Troubleshoot Identity Client (keystone) Connectivity Problems
When the Identity client (keystone) is unable to contact the Identity service it returns an error:
Unable to communicate with identity service: [Errno 113] No route to host. (HTTP 400)To debug the issue check for these common causes:
- Identity service is down
Identity Service now runs within httpd.service. On the system hosting the Identity service, check the service status:
# systemctl status httpd.serviceIf the service is not active then log in as the root user and start it.
# systemctl start httpd.service- Firewall is not configured properly
-
The firewall might not be configured to allow TCP traffic on ports
5000and35357. If so, see Managing the Overcloud Firewall in the Advanced Overcloud Customization guide for instructions on checking your firewall settings and defining custom rules. - Service Endpoints not defined correctly
On the system hosting the Identity service check that the endpoints are defined correctly.
Obtain the administration token:
# grep admin_token /etc/keystone/keystone.conf
admin_token = 91f0866234a64fc299db8f26f8729488
Determine the correct administration endpoint for the Identity service:
http://IP:35357/VERSIONReplace IP with the IP address or host name of the system hosting the Identity service. Replace VERSION with the API version (
v2.0, orv3) that is in use.Unset any pre-defined Identity service related environment variables:
# unset OS_USERNAME OS_TENANT_NAME OS_PASSWORD OS_AUTH_URLUse the administration token and endpoint to authenticate with the Identity service. Confirm that the Identity service endpoint is correct. For example:
# openstack endpoint list --os-token=91f0556234a64fc299db8f26f8729488 --os-url=https://osp.lab.local:35357/v3/ --os-identity-api-version 3Verify that the listed
publicurl,internalurl, andadminurlfor the Identity service are correct. In particular ensure that the IP addresses and port numbers listed within each endpoint are correct and reachable over the network.If these values are incorrect, add the correct endpoint and remove any incorrect endpoints using the
endpoint deleteaction of theopenstackcommand. For example:# openstack endpoint delete 2d32fa6feecc49aab5de538bdf7aa018 --os-token=91f0866234a64fc299db8f26f8729488 --os-url=https://osp.lab.local:35357/v3/ --os-identity-api-version 3Replace TOKEN and ENDPOINT with the values identified previously. Replace ID with the identity of the endpoint to remove as listed by the
endpoint-listaction.
4.3. Troubleshoot OpenStack Networking Issues
This section discusses the different commands you can use and procedures you can follow to troubleshoot the OpenStack Networking service issues.
- Debugging Networking Device
-
Use the
ip acommand to display all the physical and virtual devices. -
Use the
ovs-vsctl showcommand to display the interfaces and bridges in a virtual switch. -
Use the
ovs-dpctl showcommand to show datapaths on the switch.
-
Use the
- Tracking Networking Packets
Use the
tcpdumpcommand to see where packets are not getting through.# tcpdump -n -i INTERFACE -e -w FILENAMEReplace INTERFACE with the name of the network interface to see where the packets are not getting through. The interface name can be the name of the bridge or host Ethernet device.
The
-eflag ensures that the link-level header is dumped (in which thevlantag will appear).The
-wflag is optional. You can use it only if you want to write the output to a file. If not, the output is written to the standard output (stdout).For more information about
tcpdump, refer to its manual page by runningman tcpdump.
- Debugging Network Namespaces
-
Use the
ip netns listcommand to list all known network namespaces. Use the
ip netns execcommand to show routing tables inside specific namespaces.# ip netns exec NAMESPACE_ID bash # route -nStart the
ip netns execcommand in a bash shell so that subsequent commands can be invoked without theip netns execcommand.
-
Use the
4.4. Troubleshoot Networks and Routes Tab Display Issues in the Dashboard
The Networks and Routers tabs only appear in the dashboard when the environment is configured to use OpenStack Networking. In particular note that by default the PackStack utility currently deploys Nova Networking and as such in environments deployed in this manner the tab will not be visible.
If OpenStack Networking is deployed in the environment but the tabs still do not appear ensure that the service endpoints are defined correctly in the Identity service, that the firewall is allowing access to the endpoints, and that the services are running.
4.5. Troubleshoot Instance Launching Errors in the Dashboard
When using the dashboard to launch instances if the operation fails, a generic ERROR message is displayed. Determining the actual cause of the failure requires the use of the command line tools.
Use the nova list command to locate the unique identifier of the instance. Then use this identifier as an argument to the nova show command. One of the items returned will be the error condition. The most common value is NoValidHost.
This error indicates that no valid host was found with enough available resources to host the instance. To work around this issue, consider choosing a smaller instance size or increasing the overcommit allowances for your environment.
To host a given instance, the compute node must have not only available CPU and RAM resources but also enough disk space for the ephemeral storage associated with the instance.
4.6. Troubleshoot Keystone v3 Dashboard Authentication
django_openstack_auth is a pluggable Django authentication back end, that works with Django’s contrib.auth framework, to authenticate a user against the OpenStack Identity service API. Django_openstack_auth uses the token object to encapsulate user and Keystone related information. The dashboard uses the token object to rebuild the Django user object.
The token object currently stores:
- Keystone token
- User information
- Scope
- Roles
- Service catalog
The dashboard uses Django’s sessions framework for handling user session data. The following is a list of numerous session back ends available, which are controlled through the SESSION_ENGINE setting in your local_settings.py file:
- Local Memory Cache
- Memcached
- Database
- Cached Database
- Cookies
In some cases, particularly when a signed cookie session back end is used and, when having many or all services enabled all at once, the size of cookies can reach its limit and the dashboard can fail to log in. One of the reasons for the growth of cookie size is the service catalog. As more services are registered, the bigger the size of the service catalog would be.
In such scenarios, to improve the session token management, include the following configuration settings for logging in to the dashboard, especially when using Keystone v3 authentication.
In /usr/share/openstack-dashboard/openstack_dashboard/settings.py add the following configuration:
DATABASES =
{
  default:
  {
    ENGINE: django.db.backends.mysql,
    NAME: horizondb,
    USER: User Name,
    PASSWORD: Password,
    HOST: localhost,
   }
}
In the same file, change SESSION_ENGINE to:
SESSION_ENGINE = 'django.contrib.sessions.backends.cached_db'Connect to the database service using the mysql command, replacing USER with the user name by which to connect. The USER must be a root user (or at least as a user with the correct permission: create db).
# mysql -u USER -pCreate the Horizon database.
mysql > create database horizondb;Exit the mysql client.
mysql > exitChange to the openstack_dashboard directory and sync the database using:
# cd /usr/share/openstack-dashboard/openstack_dashboard
$ ./manage.py syncdb
You do not need to create a superuser, so answer n to the question.
Restart Apache http server. For Red Hat Enterprise Linux:
# systemctl restart httpd
4.6.1. OpenStack Dashboard - Red Hat Access Tab
The Red Hat Access tab, which is part of the OpenStack dashboard, allows you to search for and read articles or solutions from the Red Hat Customer Portal, view logs from your instances and diagnose them, and work with your customer support cases.
Figure 4.1. Red Hat Access Tab.
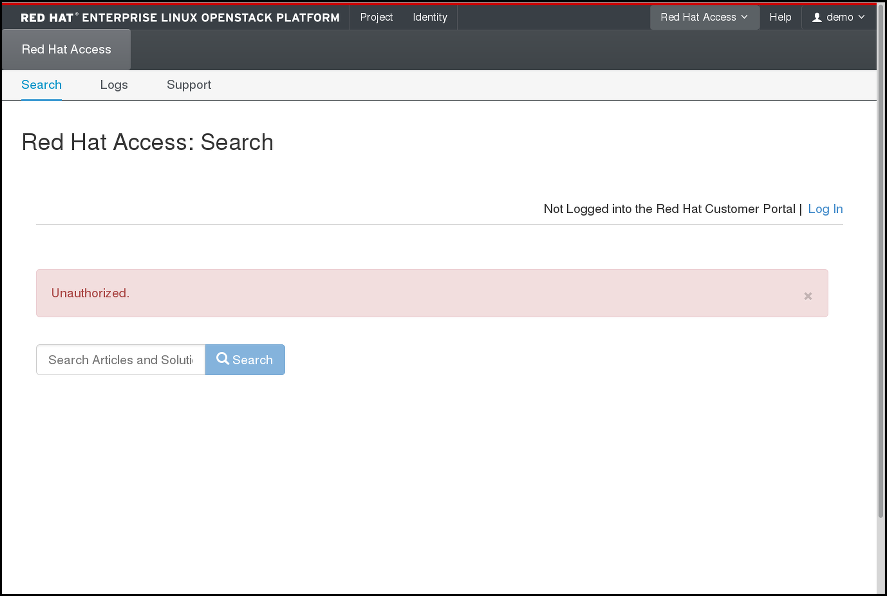
You must be logged in to the Red Hat Customer Portal in the browser in order to be able to use the functions provided by the Red Hat Access tab.
If you are not logged in, you can do so now:
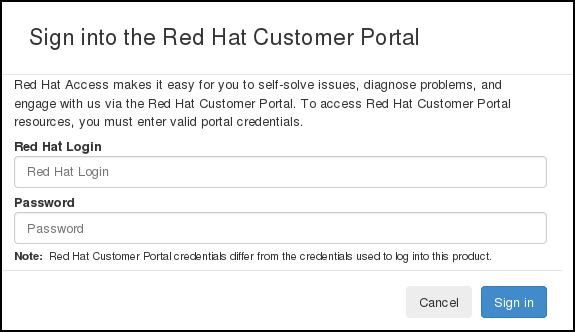
- Click Log In.
- Enter your Red Hat login.
- Enter your Red Hat password.
- Click Sign in.
This is how the form looks:
Figure 4.2. Logging in to the Red Hat Customer Portal.
If you do not log in now, you will be prompted for your Red Hat login and password when you use one of the functions that require authentication.
4.6.1.1. Search
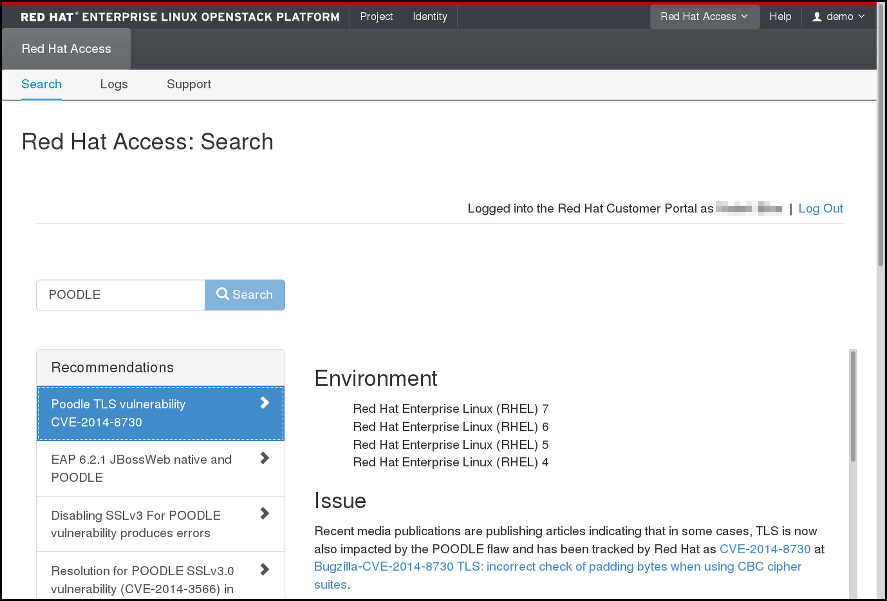
You can search for articles and solutions from Red Hat Customer Portal by entering one or more search keywords. The titles of the relevant articles and solutions will then be displayed. Click on a title to view the given article or solution:
Figure 4.3. Example of Search Results on the Red Hat Access Tab.
4.6.1.2. Logs
Here you can read logs from your OpenStack instances:
Figure 4.4. Instance Logs on the Red Hat Access Tab.
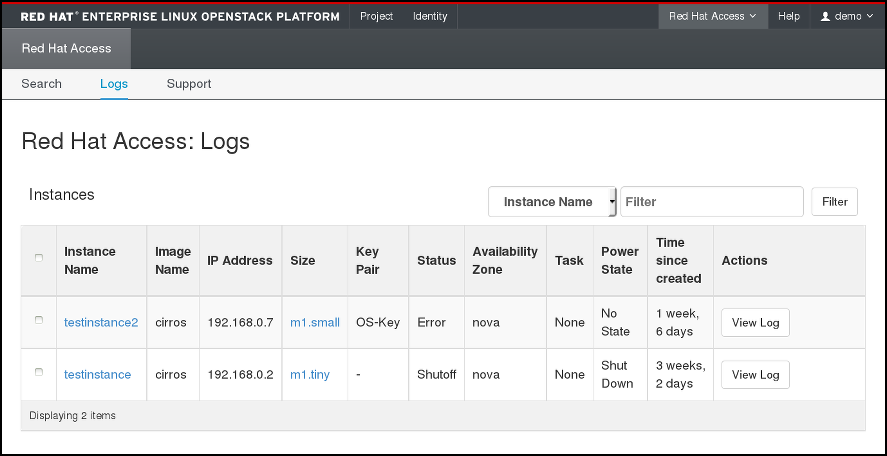
Find the instance of your choice in the table. If you have many instances, you can filter them by name, status, image ID, or flavor ID. Click View Log in the Actions column for the instance to check.
When an instance log is displayed, you can click Red Hat Diagnose to get recommendations regarding its contents:
Figure 4.5. Instance Logs on the Red Hat Access Tab.

If none of the recommendations are useful or a genuine problem has been logged, click Open a New Support Case to report the problem to Red Hat Support.
4.6.1.3. Support
The last option in the Red Hat Access Tab allows you to search for your support cases at the Red Hat Customer Portal:
Figure 4.6. Search for Support Cases.
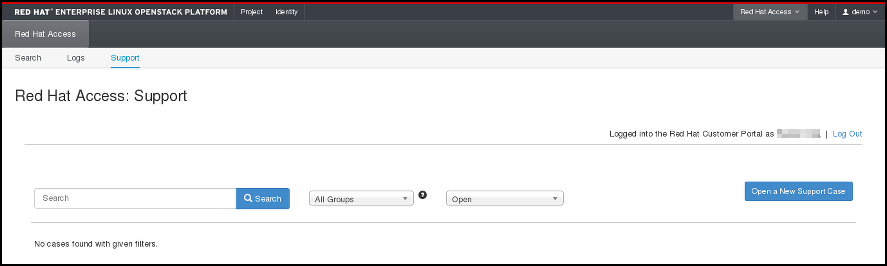
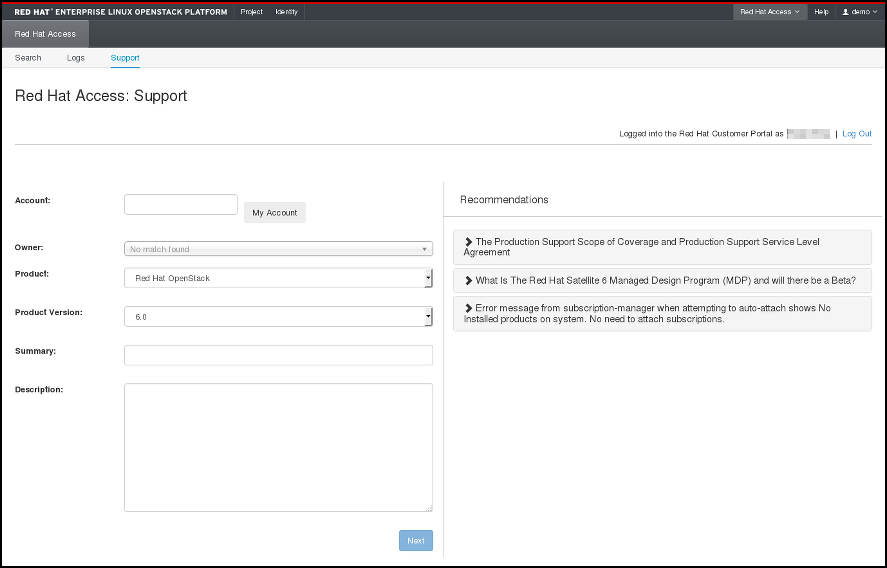
You can also open a new support case by clicking the appropriate button and filling out the form on the following page:
Figure 4.7. Open a New Support Case.