Monitoring Red Hat Satellite
Collecting metrics from Red Hat Satellite 6
Abstract
Chapter 1. Overview
Obtaining metrics from Satellite is useful for troubleshooting a current issue, and capacity planning. This guide describes how to collect live metrics and archive them for a fixed period of time. If you need to raise a support case with Red Hat to resolve a performance issue, the archived data provides valuable insight. Note that Red Hat Support can only access the archived data if you upload it to a Support Case.
You can collect the following metrics from Satellite:
- Basic statistics from Red Hat Enterprise Linux, including system load, memory utilization, and input/output operations;
- Process statistics, including memory and CPU utilization;
- Apache HTTP Server activity statistics;
- PostgreSQL activity statistics;
- Satellite application statistics.
Use Performance Co-Pilot (PCP) to collect and archive Satellite metrics.
Chapter 2. Performance Co-Pilot
Performance Co-Pilot (PCP) is a suite of tools and libraries for acquiring, storing, and analyzing system-level performance measurements. PCP can be used to analyze live and historical metrics. Metrics can be retrieved and presented via the CLI, or a web UI.
2.1. Performance Metric Domain Agents
A Performance Metric Domain Agent (PMDA) is a PCP add-on which enables access to metrics of an application or service. To gather all metrics relevant to Satellite, you must install PMDAs for Apache HTTP Server and PostgreSQL.
Chapter 3. Installing PCP Packages
This procedure describes how to install the PCP packages.
Prerequisites
Ensure you have a minimum of 20 GB space available in the
/var/log/pcpdirectory.The default PCP data retention policy is to retain only that data collected during the past 14 days. Data storage per day is estimated to use usually between 100 MB and 500 MB of disk space, but may use up to several gigabytes.
- Ensure that the base system on which Satellite Server is running is Red Hat Enterprise Linux 7.6. or later. The minimum supported version for the PCP packages is PCP version 4.1.
Procedure
Enable the Red Hat Enterprise Linux
optionalrepository:subscription-manager repos --enable rhel-7-server-optional-rpms
# subscription-manager repos --enable rhel-7-server-optional-rpmsCopy to Clipboard Copied! Toggle word wrap Toggle overflow Install the PCP packages:
satellite-maintain packages install pcp \
  pcp-pmda-apache \
  pcp-pmda-postgresql \
  pcp-system-tools \
  pcp-webjs
# satellite-maintain packages install pcp \
  pcp-pmda-apache \
  pcp-pmda-postgresql \
  pcp-system-tools \
  pcp-webjs
Copy to Clipboard Copied! Toggle word wrap Toggle overflow Enable and start the Performance Metrics Collector daemon, and the Performance Metrics Logger daemon:
systemctl enable pmcd pmlogger
systemctl start pmcd pmlogger
# systemctl enable pmcd pmlogger
# systemctl start pmcd pmlogger
Copy to Clipboard Copied! Toggle word wrap Toggle overflow
3.1. Configuring PCP Data Collection
This procedure describes how to configure PCP to collect metrics about processes, Satellite, Apache HTTP Server, and PostgreSQL.
Procedure
To configure PCP to collect data about Satellite processes, create the
/var/lib/pcp/pmdas/proc/hotproc.conffile and include the following content:Copy to Clipboard Copied! Toggle word wrap Toggle overflow By default, PCP collects basic system metrics. This step enables detailed metrics about the following Satellite processes:
- Java
- PostgreSQL
- MongoDB
- Dynflow
- Passenger
- Pulp
- Qpid
Configure PCP to log the process metrics being collected.
Copy to Clipboard Copied! Toggle word wrap Toggle overflow Install the process monitoring PMDA.
cd /var/lib/pcp/pmdas/proc
./Install
# cd /var/lib/pcp/pmdas/proc
# ./Install
Copy to Clipboard Copied! Toggle word wrap Toggle overflow Configure PCP to collect metrics from Apache HTTP Server.
Enable the Apache HTTP Server extended status module.
Copy to Clipboard Copied! Toggle word wrap Toggle overflow Enable the Apache HTTP Server PMDA.
cd /var/lib/pcp/pmdas/apache
./Install
# cd /var/lib/pcp/pmdas/apache
# ./Install
Copy to Clipboard Copied! Toggle word wrap Toggle overflow Prevent the Satellite installer overwriting the extended status module’s configuration file.
Add the following line to the
/etc/foreman-installer/custom-hiera.yamlconfiguration file.apache::purge_configs: false
apache::purge_configs: falseCopy to Clipboard Copied! Toggle word wrap Toggle overflow
Configure PCP to collect metrics from PostgreSQL.
Change to the
/var/lib/pcp/pmdas/postgresqldirectory.cd /var/lib/pcp/pmdas/postgresql
# cd /var/lib/pcp/pmdas/postgresqlCopy to Clipboard Copied! Toggle word wrap Toggle overflow Run the installer.
./Install
# ./InstallCopy to Clipboard Copied! Toggle word wrap Toggle overflow Configure the PCP database interface to permit access to the PostgreSQL database.
Edit the
/etc/pcpdbi.confconfiguration file, inserting the following lines:$database = "dbi:Pg:dbname=foreman;host=localhost"; $username = "foreman"; $password = "6qXfN9m5nii5iEcbz8nuiJBNsyjjdRHA"; $os_user = "foreman";
$database = "dbi:Pg:dbname=foreman;host=localhost";
$username = "foreman";
$password = "6qXfN9m5nii5iEcbz8nuiJBNsyjjdRHA";
1 $os_user = "foreman";Copy to Clipboard Copied! Toggle word wrap Toggle overflow - 1
- The value for $password is stored in
/etc/foreman/database.ymlconfiguration file.
Change the SELinux
pcp_pmcd_tdomain permission to permit PCP access to the PostgreSQL database.semanage permissive -a pcp_pmcd_t
# semanage permissive -a pcp_pmcd_tCopy to Clipboard Copied! Toggle word wrap Toggle overflow Verify the PostgreSQL PMDA is able to connect to PostgreSQL.
Examine the
/var/log/pcp/pmcd/postgresql.logfile to confirm the connection is established. Without a successful database connection, the PostgreSQL PMDA will remain active, but not be able to provide any metrics.[Tue Aug 14 09:21:06] pmdapostgresql(25056) Info: PostgreSQL connection established
[Tue Aug 14 09:21:06] pmdapostgresql(25056) Info: PostgreSQL connection establishedCopy to Clipboard Copied! Toggle word wrap Toggle overflow If you find errors in
/var/log/pcp/pmcd/postgresql.log, restart the pmcd service.systemctl restart pmcd
# systemctl restart pmcdCopy to Clipboard Copied! Toggle word wrap Toggle overflow
Enable telemetry functionality in Satellite.
To enable collection of metrics from Satellite, you must send metrics via the
statsdprotocol into thepcp-mmvstatsddaemon. The metrics are aggregated and available via the PCP MMV API.Install the Foreman Telemetry and
pcp-mmvstatsdpackages.satellite-maintain packages install foreman-telemetry pcp-mmvstatsd
# satellite-maintain packages install foreman-telemetry pcp-mmvstatsdCopy to Clipboard Copied! Toggle word wrap Toggle overflow Enable and start the
pcp-mmvstatsdservice.systemctl enable pcp-mmvstatsd systemctl start pcp-mmvstatsd
# systemctl enable pcp-mmvstatsd
# systemctl start pcp-mmvstatsd
Copy to Clipboard Copied! Toggle word wrap Toggle overflow Enable the Satellite telemetry functionality.
Add the following lines to
/etc/foreman/settings.yamlconfiguration file:Copy to Clipboard Copied! Toggle word wrap Toggle overflow
Schedule daily storage of metrics in archive files:
cat >/etc/cron.daily/refresh_mmv <<EOF
#!/bin/bash
echo "log mandatory on 1 minute mmv" | /usr/bin/pmlc -P
EOF
chmod +x /etc/cron.daily/refresh_mmv
# cat >/etc/cron.daily/refresh_mmv <<EOF
#!/bin/bash
echo "log mandatory on 1 minute mmv" | /usr/bin/pmlc -P
EOF
# chmod +x /etc/cron.daily/refresh_mmv
Copy to Clipboard Copied! Toggle word wrap Toggle overflow Restart the Apache HTTP Server and PCP to begin data collection:
systemctl restart httpd pmcd pmlogger
# systemctl restart httpd pmcd pmloggerCopy to Clipboard Copied! Toggle word wrap Toggle overflow
3.2. Enabling Access to Metrics via the Web UI
This procedure describes how to access metrics collected by PCP, via the web UI.
Procedure
Enable the Red Hat Enterprise Linux
optionalrepository:subscription-manager repos --enable rhel-7-server-optional-rpms
# subscription-manager repos --enable rhel-7-server-optional-rpmsCopy to Clipboard Copied! Toggle word wrap Toggle overflow Install the PCP web API and applications:
satellite-maintain packages install pcp-webapi pcp-webapp-grafana pcp-webapp-vector
# satellite-maintain packages install pcp-webapi pcp-webapp-grafana pcp-webapp-vectorCopy to Clipboard Copied! Toggle word wrap Toggle overflow Start and enable the PCP web service:
systemctl start pmwebd
systemctl enable pmwebd
# systemctl start pmwebd
# systemctl enable pmwebd
Copy to Clipboard Copied! Toggle word wrap Toggle overflow Open firewall port to allow access to the PCP web service:
firewall-cmd --add-port=44323/tcp
firewall-cmd --permanent --add-port=44323/tcp
# firewall-cmd --add-port=44323/tcp
# firewall-cmd --permanent --add-port=44323/tcp
Copy to Clipboard Copied! Toggle word wrap Toggle overflow
3.3. Verifying PCP Configuration
To verify PCP is configured correctly, and services are active, run the following command:
pcp
# pcpThis outputs a summary of the active PCP configuration.
Example output from the pcp command:
In this example, both the Performance Metrics Collector Daemon (pmcd), and the Performance Metrics Web Daemon (pmwebd) services are running. It also confirms the PMDAs which are collecting metrics. Finally, it lists the currently actively archive file, in which pmlogger is storing metrics.
Chapter 4. PCP Metrics
Metrics are stored in a tree-like structure. For example, all network metrics are stored in a node named network. Each metric may be a single value, or a list of values, known as instances. For example, kernel load has three instances, a 1-minute, 5-minute, and 15-minute average.
For every metric entry, PCP stores both its data and metadata. This includes the metrics description, data type, units, and dimensions. For example, the metadata enables PCP to output multiple metrics with different dimensions.
The value of a counter metric only increases. For example, a count of disk write operations on a specific device only increases. When you query the value of a counter metric, PCP converts this into a rate value by default.
In addition to system metrics such as CPU, memory, kernel, XFS, disk, and network, the following metrics are configured:
| Metric | Description |
|---|---|
| hotproc.* | Basic metrics of key Satellite processes |
| apache.* | Apache HTTP Server metrics |
| postgresql.* | Basic PostgreSQL statistics |
| mmv.fm_rails_* | Satellite metrics |
4.1. Identifying Available Metrics
To list all metrics available via PCP, enter the following command:
pminfo
# pminfoCopy to Clipboard Copied! Toggle word wrap Toggle overflow To list all Satellite metrics and their descriptions, enter the following command:
foreman-rake telemetry:metrics
# foreman-rake telemetry:metricsCopy to Clipboard Copied! Toggle word wrap Toggle overflow To list the archived metrics, enter the following command:
less /var/log/pcp/pmlogger/$(hostname)/pmlogger.log
# less /var/log/pcp/pmlogger/$(hostname)/pmlogger.logCopy to Clipboard Copied! Toggle word wrap Toggle overflow The pmlogger daemon archives data as it is received, according to its configuration. To confirm the active archive file, enter the following command:
pcp | grep logger
# pcp | grep loggerCopy to Clipboard Copied! Toggle word wrap Toggle overflow The output includes the file name of the active archive file, for example:
/var/log/pcp/pmlogger/satellite.example.com/20180814.00.10
/var/log/pcp/pmlogger/satellite.example.com/20180814.00.10Copy to Clipboard Copied! Toggle word wrap Toggle overflow
Chapter 5. Retrieving Metrics
You can retrieve metrics from PCP using the CLI or the web UI interfaces. A number of CLI tools are provided with PCP, which can either output live data, or data from archived sources. The web UI interfaces are provided by the Grafana and Vector web applications. Vector connects directly to the PCP daemon, and can only display live data. Grafana reads from PCP archive files and can display data to up to 1 year old.
5.1. Retrieving Metrics via the CLI
Using the CLI tools provided with PCP, you can retrieve metrics either live, or from an archive file.
5.1.1. Retrieving Live Metrics using CLI
To output metrics on disk partition write instances, enter the following command:
pmval -f 1 disk.partitions.write
# pmval -f 1 disk.partitions.write
In this example, PCP converts the number of writes to disk partitions from a counter value, to a rate value. The -f 1 specifies that the value be abbreviated to one decimal place.
Example output
To monitor system metrics with a two second interval:
pmstat -t 2sec
# pmstat -t 2sec5.1.2. Retrieving Archived Metrics using CLI
You can use the PCP CLI tools to retrieve metrics from an archive file. To do that, add the --archive parameter and specify the archive file.
To list all metrics which were enabled when the archive file was created, enter the following command:
pminfo --archive archive_file
pminfo --archive archive_fileCopy to Clipboard Copied! Toggle word wrap Toggle overflow To confirm the host and time period covered by an archive file, enter the following command:
pmdumplog -l archive_file
# pmdumplog -l archive_fileCopy to Clipboard Copied! Toggle word wrap Toggle overflow
Examples
To list disk writes for each partition, over the time period covered by the archive file:
pmval --archive /var/log/pcp/pmlogger/satellite.example.com/20180816.00.10 \
  -f 1 disk.partitions.write
# pmval --archive /var/log/pcp/pmlogger/satellite.example.com/20180816.00.10 \
  -f 1 disk.partitions.write
Copy to Clipboard Copied! Toggle word wrap Toggle overflow To list disk write operations per partition, with a two second interval, between the time period 14:00 and 14:15:
pmval --archive /var/log/pcp/pmlogger/satellite.example.com/20180816.00.10 \
  -d -t 2sec \
  -f 3 disk.partitions.write \
  -S @14:00 -T @14:15
# pmval --archive /var/log/pcp/pmlogger/satellite.example.com/20180816.00.10 \
  -d -t 2sec \
  -f 3 disk.partitions.write \
  -S @14:00 -T @14:15
Copy to Clipboard Copied! Toggle word wrap Toggle overflow To list average values of all performance metrics, including the time of minimum/maximum value and the actual minimum/maximum value, between the time period 14:00 and 14:30. To output the values in tabular formatting:
Copy to Clipboard Copied! Toggle word wrap Toggle overflow To list system metrics stored in an archive, starting from 14:00. The metrics are displayed in a format similar to the
toptool.pcp --archive /var/log/pcp/pmlogger/satellite.example.com/20180816.00.10 \ -S @14:00 \ atop
# pcp --archive /var/log/pcp/pmlogger/satellite.example.com/20180816.00.10 \
  -S @14:00 \
  atop
Copy to Clipboard Copied! Toggle word wrap Toggle overflow
5.2. Retrieving Metrics in the Web UI
The Vector and Grafana web applications provide a dashboard-style view, with default widgets displaying the values of metrics. You can add and remove metrics to suit your requirements.
You can also select the time span shown for each widget. Only Grafana provides the option of selecting a custom time range from the archived metrics.
For more details on using Grafana, see the Grafana Labs website. For more details on using Vector, see the Vector website.
Procedure
To retrieve metrics in the Performance Co-Pilot web applications UI, complete the following steps:
- Open the following URL: http://satellite.example.com:44323
- In the PCP web UI, select the web application dashboard that you want to access.
Figure 5.1. Example of the Grafana dashboard
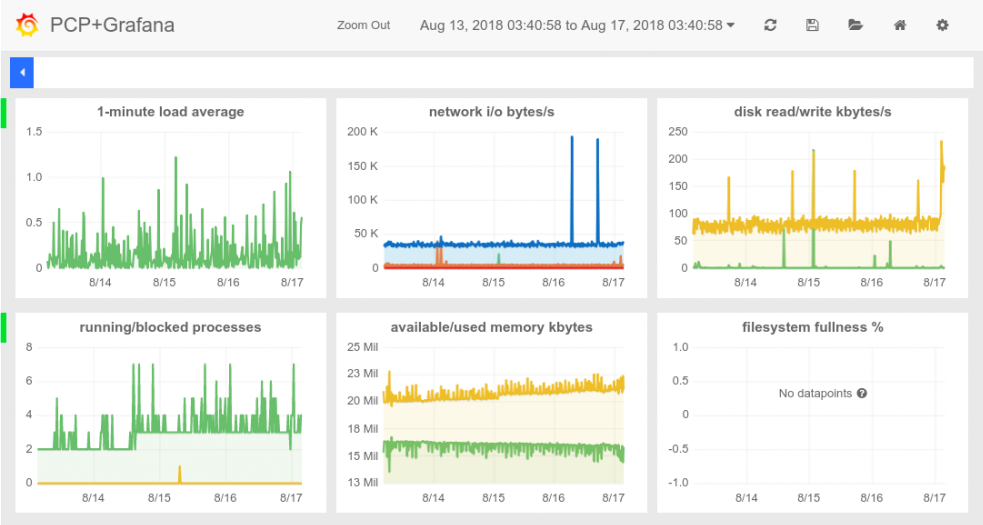
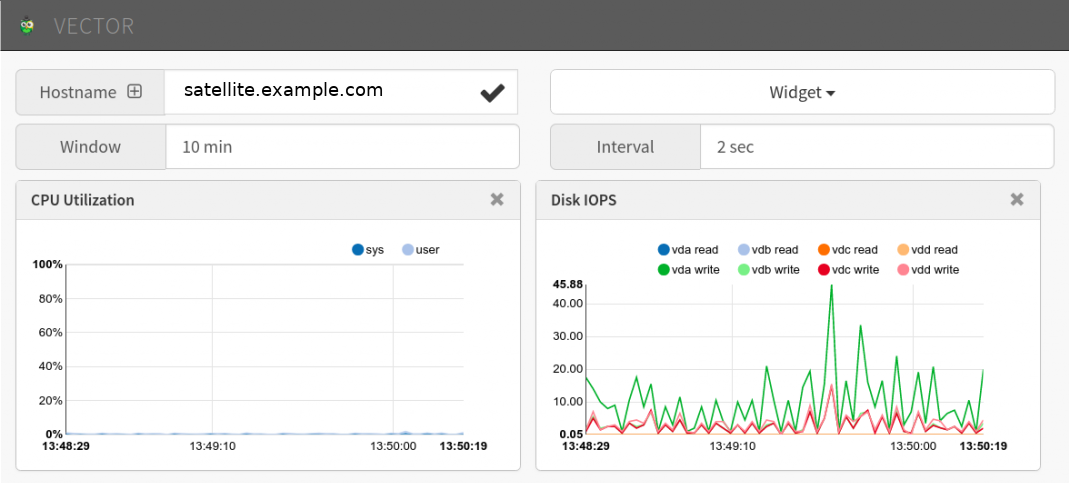
Figure 5.2. Example of the Vector dashboard
Chapter 6. Metrics Data Retention
The storage capacity required by PCP data logging is determined by the following factors:
- the metrics being logged,
- the logging interval,
- and the retention policy.
The default logging (sampling) interval is 60 seconds.
The default retention policy is to keep archives for the last 14 days, compressing archives older than one day. PCP archive logs are stored in the /var/log/pcp/pmlogger/hostname directory.
6.1. Changing Default Logging Interval
This procedure describes how to change the default logging interval.
Procedure
-
Edit the
/etc/pcp/pmlogger/control.d/localconfiguration file. -
Edit the LOCALHOSTNAME line and append
-t XXs, where XX is the desired time interval, measured in seconds. -
Restart the
pmloggerservice.
6.2. Changing Data Retention Policy
This procedure describes how to change the data retention policy.
Procedure
-
Edit the
/etc/cron.d/pcp-pmloggerfile. -
Find the line containing
pmlogger_daily. -
Change the value for parameter
-xto the desired number of days after which data is archived. Add parameter
-k, and add a value for the number of days after which data is deleted.For example, the parameters
-x 4 -k 7specify that data will be compressed after 4 days, and deleted after 7 days.
6.3. Confirming Data Storage Usage
To confirm data storage usage, enter the following command:
less /var/log/pcp/pmlogger/$(hostname)/pmlogger.log
# less /var/log/pcp/pmlogger/$(hostname)/pmlogger.logThis lists all available metrics, grouped by the frequency at which they are logged. For each group it also lists the storage required to store the listed metrics, per day.
Example storage statistics
logged every 60 sec: 61752 bytes or 84.80 Mbytes/day
logged every 60 sec: 61752 bytes or 84.80 Mbytes/day