Accelerate Ansible troubleshooting with intelligent log analysis
Act on suggestions from an AI agent that identifies Ansible errors, routes them to the right experts, and offers guided remediation steps for faster resolution.
This content is authored by Red Hat experts, but has not yet been tested on every supported configuration.
Accelerate Ansible troubleshooting with intelligent log analysis
Act on suggestions from an AI agent that identifies Ansible errors, routes them to the right experts, and offers guided remediation steps for faster resolution.
Table of contents
Detailed description
The Challenge
Organizations running Ansible automation at scale face significant challenges when errors occur. Log analysis is manual, time-consuming, and requires specialized knowledge across multiple domains (AWS, Kubernetes, networking, etc.). When failures happen, teams spend valuable time searching through logs, identifying the right experts, and waiting for solutions.
Current Manual Process
A human analyst is:
- Searches for error logs.
- Talks with the person who is authorized with the credentials to solve the problem:
- Examples:
AWS provisioning failure requires talking with the AWS person who is authorized.
Bug in the playbook source code - talk with the programmer.
- Examples:
- The authenticated person needs to understand how to solve the problem.
- Solve the problem.
A major issue with the current manual process (before our solution) is that resolving more error logs requires increasing human headcount, which is highly costly.
Our solution represents an automation approach that significantly lowers operational costs compared to manual resolution.
Our Solution
An AI-powered log analysis system that automatically:
- Detects and categorizes Ansible errors in real-time
- Routes issues to appropriate experts based on authorization levels
- Provides contextual, step-by-step solutions using AI agents
- Learns from historical resolutions to improve future recommendations
By automating error detection, expert routing, and solution generation, the ops/platform team can resolve issues much faster, reducing mean time to resolution (MTTR). As your automation needs grow, the AI scales effortlessly alongside you, without requiring any additional staff. This allows business leaders to significantly reduce operational costs while continuing to expand their capabilities.
Our Solution Stack
Log Management
- Loki - time-series log database that is used for storing Ansible logs, aggregation and querying.
- Alloy/Promtail - log collection agents for ingestion from the AAP cluster.
- Grafana - alerting on error patterns and dashboard visualization.
AI/ML Platform
- OpenShift AI - model serving, data science pipelines, and notebook environment.
- LLM - powers summarization, classification, and solution generation (served via RHOAI model serving or any OpenAI-compatible endpoint).
Backend Services
- FastAPI - REST API endpoints for alerts, queries, and pipeline orchestration.
- LangGraph - build the agent.
- MCP (Model Context Protocol) - tool integration for Loki queries and Ansible code retrieval.
- PostgreSQL - persistent storage for processed alerts and metadata.
Embeddings & Retrieval
- Sentence Transformers - log clustering by template similarity.
- TEI (Text Embeddings Inference) - high-performance embedding service for RAG.
- FAISS - vector similarity search for knowledge base retrieval.
- MinIO - object storage for RAG index persistence.
Observability
- Phoenix + OpenTelemetry - distributed tracing for LLM calls and pipeline monitoring.
User Interfaces
- UI (Gradio) - expert-facing dashboard for browsing alerts and solutions.
- Annotation Interface (Gradio + DeepEval) - human annotation, evaluation, and workflow improvement.
Architecture diagrams
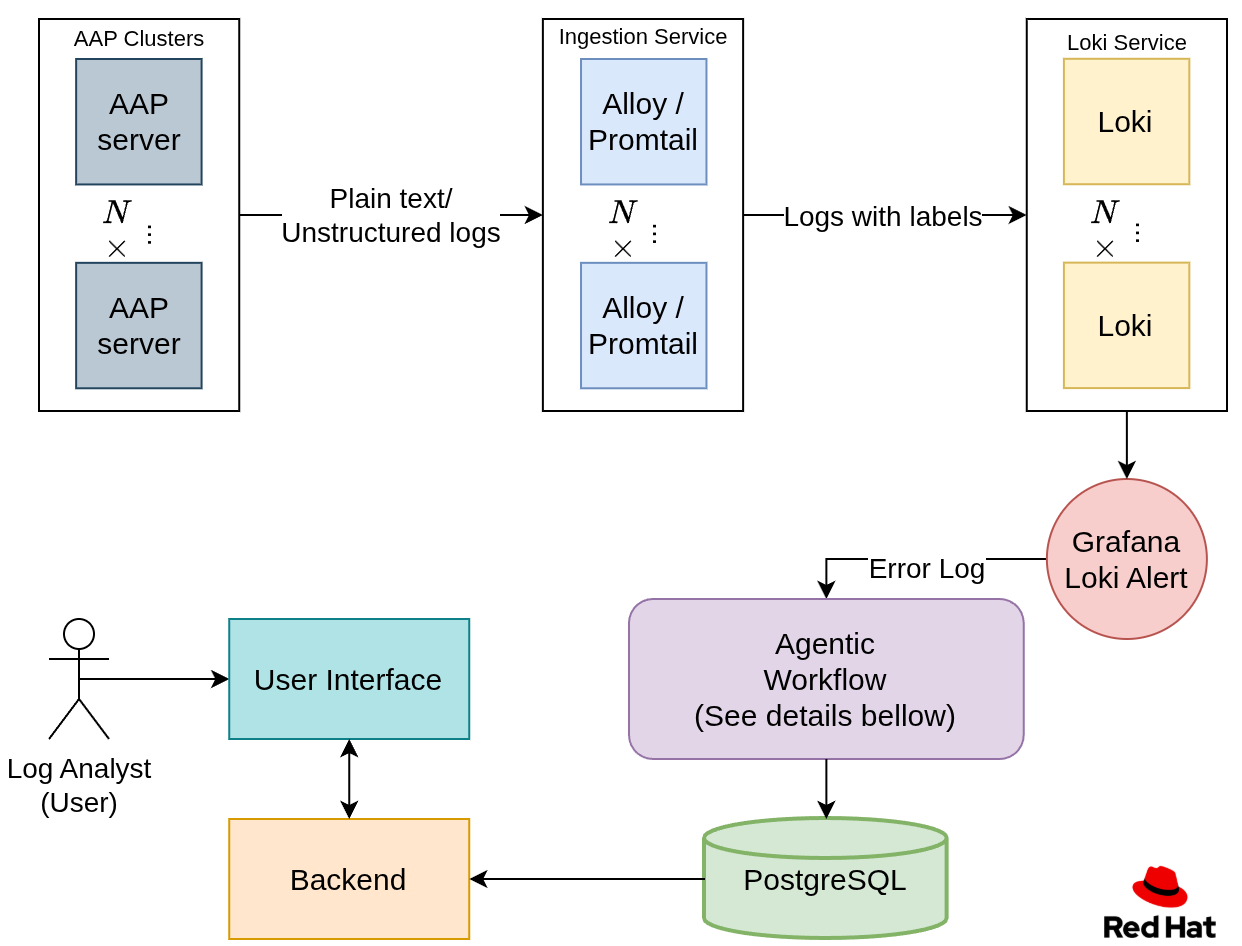
High-Level Solution
- Data is being ingested from the Red Hat Ansible Automation Platform (AAP) clusters, using Alloy or Promtail, into Loki (a time series database designed for logs).
- An error log is alerted using a Grafana alert and sent into the agentic workflow.
- The agentic workflow processes the log and stores the processed data into a PostgreSQL database.
- The log analyst using the UI interacts with the logs and gets suggestions on how to solve the error, depending on their authorization.
Agentic Workflow
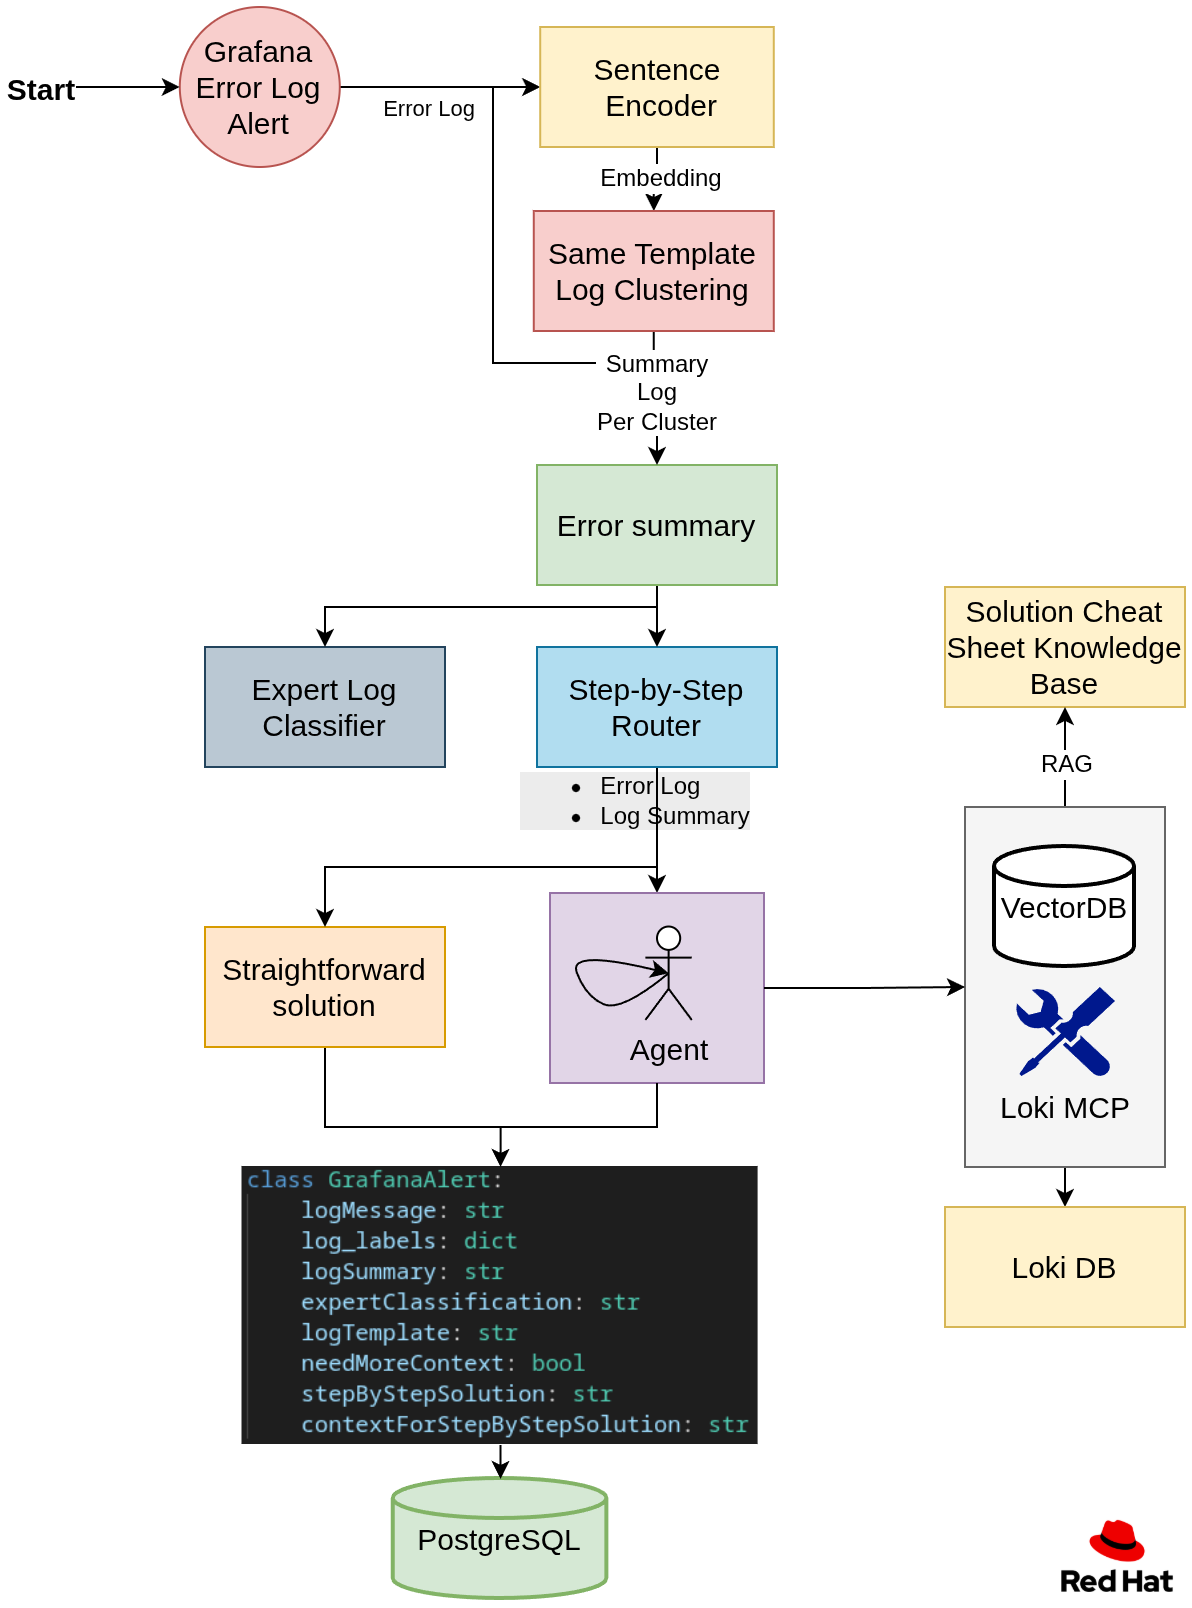
Step 1: Embedding and Clustering
Many logs are generated from the same log template. To group them, we embed a subset of each log, then cluster all the embeddings into groups. Each group represents a log template. For example, let’s look at the following three logs:
1. error: user id 10 already exists.
2. error: user id 15 already exists.
3. error: password of user itayk is wrong.
As we can see here, logs 1 and 2 are from the same template, and we want to group them together.
Then the user will be able to filter by templates.
Step 2: Summary and Expert Classification per Log Template
For each log template, create a summary of the log and classify it by authorization.
For example, an analyst who has AWS authentication will filter by their authorization and will see only relevant error summaries in the UI.
Step 3: Creating a step-by-step solution
We will have a router that will determine if we need more context to solve the problem or if the log error alone is sufficient to generate the step-by-step solution.
If we need more context, we will spin up an agent that will accumulate context as needed by using the following:
Loki MCP, which is able to query the log database for additional log context. This project uses an enhanced fork with additional query capabilities.
RAG for retrieving an error cheat sheet of already solved questions.
Ansible MCP for obtaining code source data to suggest a better solution.
Step 4: Store the data
- Store a payload of the generated values for each log in a PostgreSQL database.
Training and Inference stages
Currently, the only difference between the training and inference stages is the clustering algorithm.
Training
Train the clustering algorithm to cluster the logs by log-template.
Inference
Load the trained clustering model.
Requirements
NOTE: This Quickstart assumes a large language model is already deployed in your environment. Guidance for deploying models is available in the References section.
Minimum hardware requirements
CPU: 3-4 cores
Memory: 10Gi
Storage: 50Gi-200Gi
- 50Gi for using the mock data
- For a large amount of logs, this needs to be increased
- Optional: GPU — required if you plan to deploy your own model on OpenShift AI, for deployment refer to References.
Minimum software requirements
OpenShift Cluster Deployment
- Red Hat OpenShift AI 2.25.0 or later (for model serving and data science workloads)
- Helm 3.0.0 or later
- oc CLI (for OpenShift)
- LLM Model Server — Red Hat OpenShift AI model serving (vLLM) recommended for hosting your LLM with enterprise features or OpenAI credentials.
Local Development Requirements
- Podman and Podman Compose or Docker and Docker Compose
uv 0.9.xpackage manager with Python 3.12+- Make (for running deployment commands)
Required user permissions
Local Development
- Permission to run containers via Docker or Podman
- Access to local ports:
3000,3100,5432,6006,7860,7861,8000,8080,8081
OpenShift Cluster Deployment
- Authenticated to the OpenShift cluster (
oc login) - Permission to create or access a namespace/project
Deploy
The Ansible Log Monitor can be deployed in local or cluster deployments depending on your needs. Choose the deployment method that best fits your requirements:
Quick Start - OpenShift Deployment
For production deployment on OpenShift clusters:
# Install in your current namespace
make cluster/install

# Or specify a different namespace
make cluster/install NAMESPACE=ansible-logs-monitor
During installation, you'll be prompted to configure:
- API token
- LLM endpoint URL — Red Hat OpenShift AI model serving (vLLM) is the recommended option. Alternatively, any OpenAI-compatible endpoint can be used.
- Model name (e.g., the model deployed on your RHOAI model server)
- Temperature (optional — defaults are provided)
📝 Note: You can also use step 2 from the local deployment section before running the install command and skip the prompting part.
Additional commands
# upgrade
make cluster/upgrade

# restart
make cluster/restart
Quick Start - Local Development
For development and testing, you can run all services locally using the provided Makefile:
Deploy Locally
Follow these steps to set up and run the Ansible Log Monitor on your local development environment:
1. Clone and Setup Repository
# Clone the repository
git clone https://github.com/rh-ai-quickstart/ansible-log-analysis.git
cd ansible-log-analysis
2. Configure Environment Variables
# Copy the environment template and configure your settings
cp .env.example .env
Edit .env with your API keys and configuration:
OPENAI_API_ENDPOINT: # LLM endpoint URL - use your Red Hat OpenShift AI (RHOAI) model serving endpoint for enterprise deployments, or any OpenAI-compatible endpoint (some endpoints need /v1 suffix)
OPENAI_API_TOKEN: # Your token to the endpoint (RHOAI service account token or API key)
OPENAI_MODEL: # Model to use (e.g., the model deployed on your RHOAI vLLM server)
LANGSMITH_API_KEY: # Optional, for LangSmith tracing
💡 Tip: For enterprise deployments, we recommend using Red Hat OpenShift AI model serving to host your LLM. RHOAI provides vLLM-based model serving with built-in GPU support, autoscaling, and enterprise security features.
3. Start All Services
In short:
make local/install
make local/train
# Launch all services in the background
make local/install

# Run the complete training pipeline (do it after local/install)
make local/train

# Perform status check to see which services are running
make local/status

# uninstall all services when done
make local/uninstall
Additional Commands
# Restart all services
make local/restart

# View all available local commands
make local/help
Usage
Openshift Cluster Deployment
After the installation is complete, check the routes in OpenShift or by using the command line:
oc get routes -n <namespace>
Local Deployment
For the user interface: http://localhost:7861
Annotation interface and evaluation system: http://localhost:7860
Phoenix: http://localhost:6006
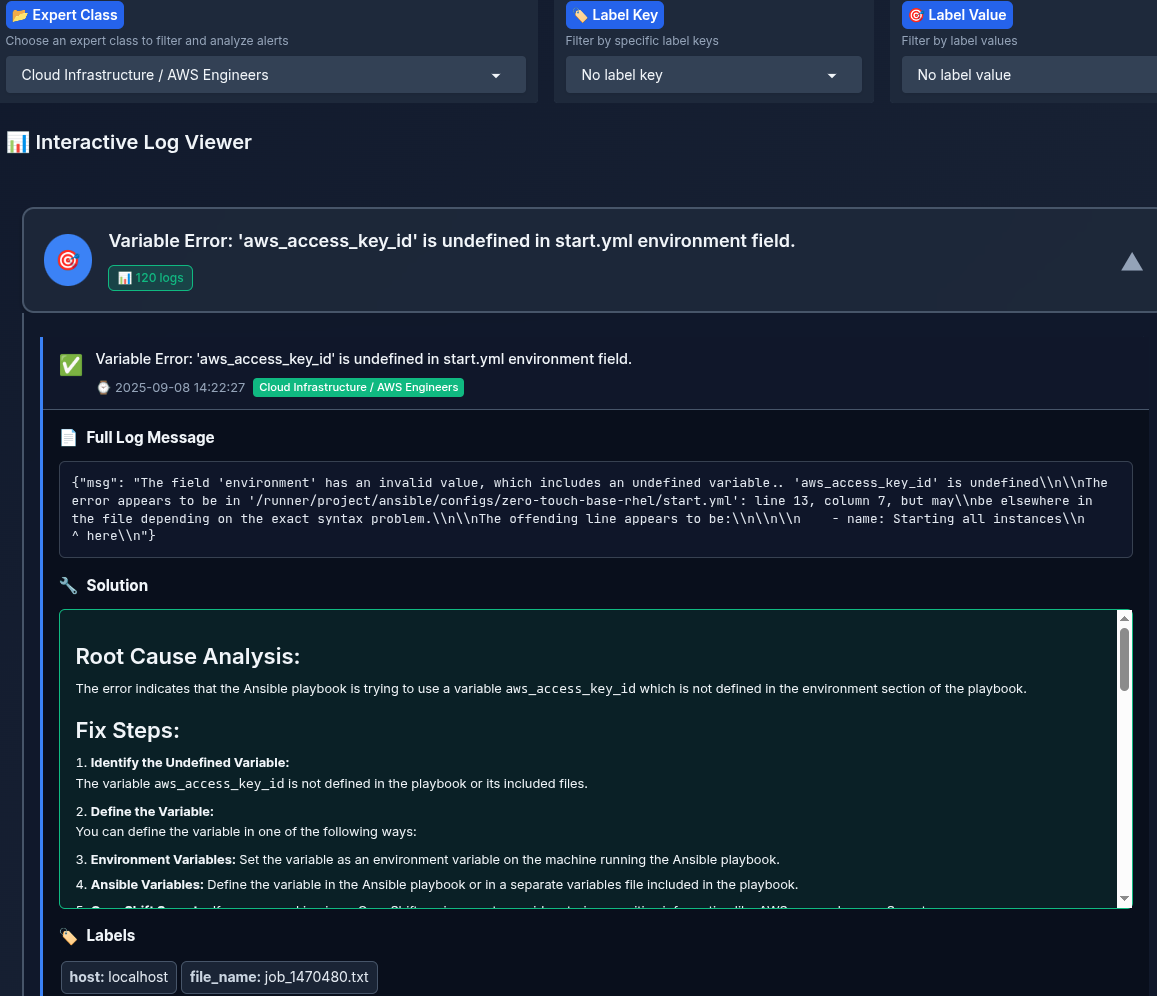
User Interface
- Each expert selects their role, depending on their authorization. Current rules are:
- Kubernetes / OpenShift Cluster Admins
- DevOps / CI/CD Engineers (Ansible + Automation Platform)
- Networking / Security Engineers
- System Administrators / OS Engineers
- Application Developers / GitOps / Platform Engineers
- Identity & Access Management (IAM) Engineers
- Other / Miscellaneous
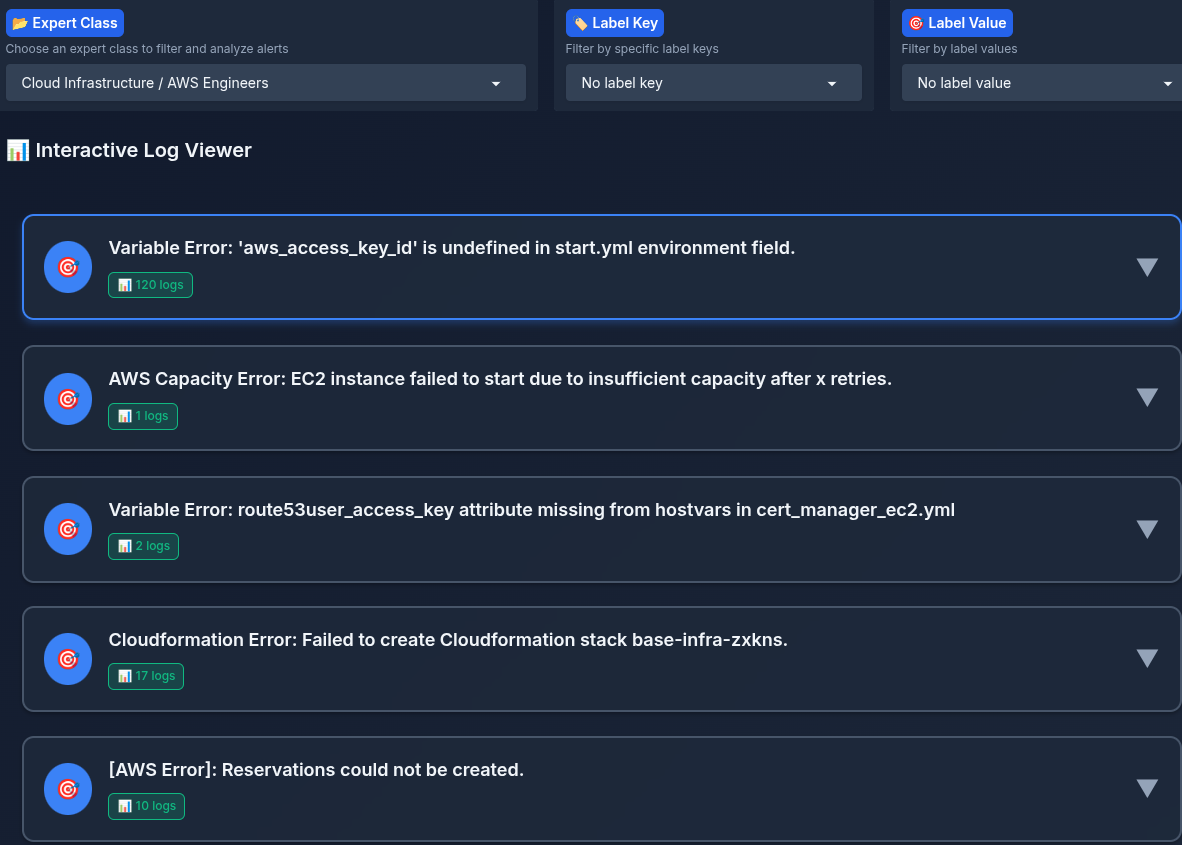
- Each expert can filter by labels (cluster_name, log_file_name, …)
- A summary of each log is listed to the expert, the expert can click on the log summary and view the whole log, and a step-by-step solution, timestamp, and labels
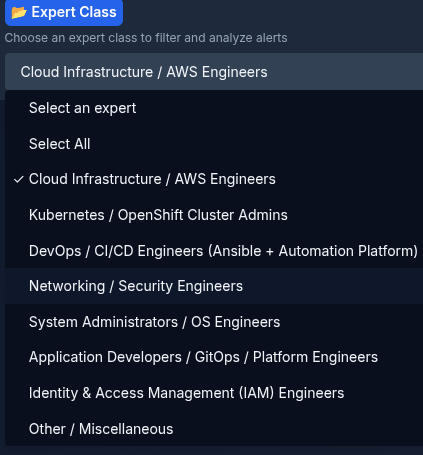
After selecting the authorization class "expert":
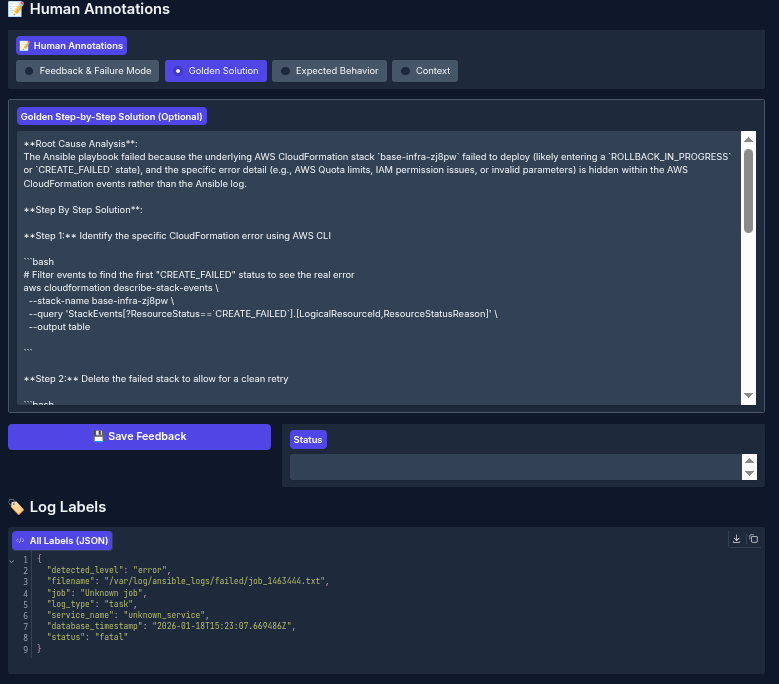
Annotation and Evaluation Interface
To improve our agentic workflow, context PDFs, and other supporting materials, we need to understand the errors. For this purpose, we provide a data annotation interface for labeling Ansible error log pipeline outputs.
Additionally, once annotation is complete, you can evaluate the annotated results against the agent-generated output to determine which cases require improvements to your prompts, data, or code.
Given many logs, you can select from all the log templates that have been detected in your Ansible log errors, as shown in the figure below:
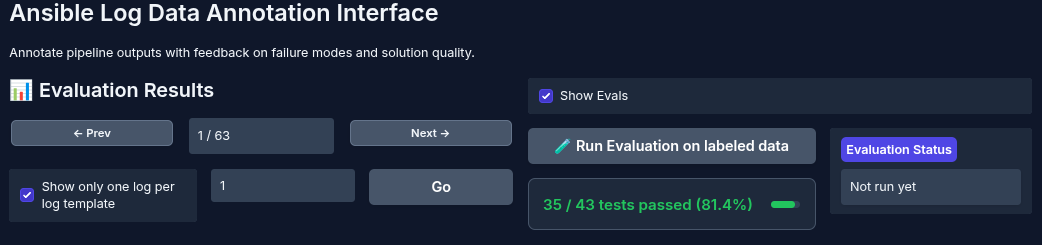
To improve your agent's overall performance, annotate the data using domain experts to identify the errors and write the expected step-by-step solution.
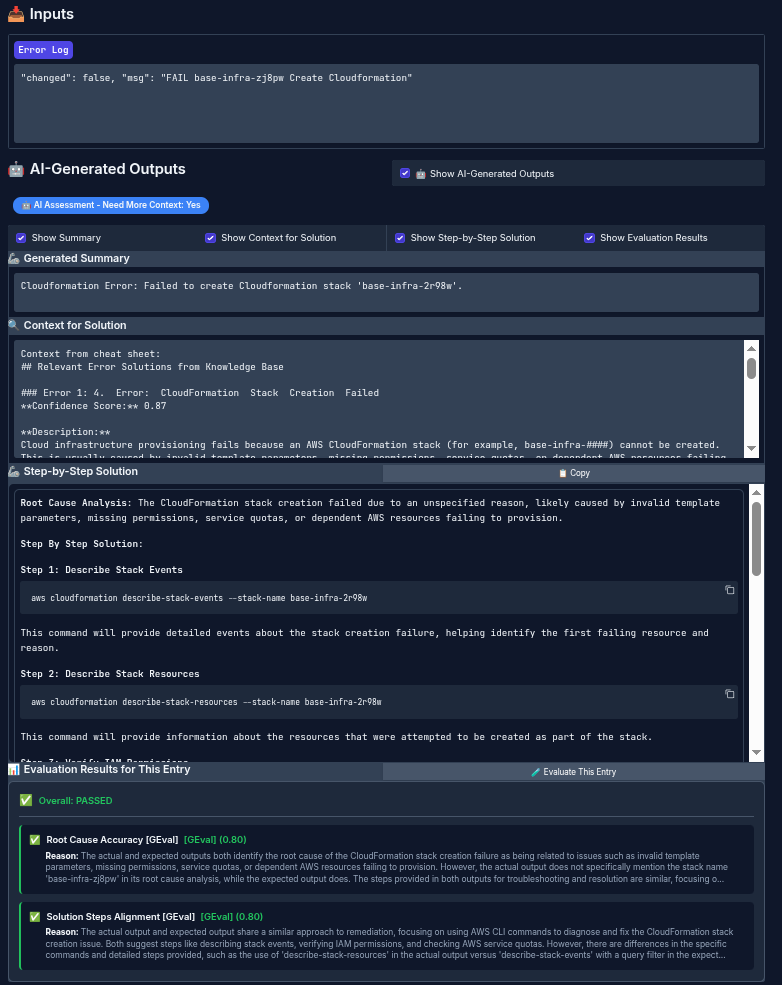
After annotating some data (in this example, we annotated 43 logs), you can run the evaluation and use LLM-as-a-judge to compare the agent output against the golden output labeled by the expert.
Delete
Delete from OpenShift
# Remove from current project
make cluster/uninstall

# Remove from specific namespace
make cluster/uninstall NAMESPACE=ansible-logs-monitor
Stop Local Deployment
# uninstall all services when done
make local/uninstall