Summarize and analyze your observability data
Create an interactive dashboard to analyze AI model performance and OpenShift cluster metrics using Prometheus.
This content is authored by Red Hat experts, but has not yet been tested on every supported configuration.
Summarize and analyze your observability data
Create an interactive dashboard to analyze AI model performance and OpenShift cluster metrics using Prometheus.
Table of Contents
Detailed description
The OpenShift AI Observability Summarizer turns OpenShift + OpenShift AI observability signals into plain-English, actionable insights. Instead of stitching together dashboards and raw metrics, teams can quickly understand performance, cost drivers, and operational risks across AI workloads and the platform that runs them.
The Challenge
AI platform and SRE teams routinely need to answer questions like:
- “Is my model latency increasing? What changed?”
- “Are GPUs saturated or underutilized?”
- “Which namespace/workload is causing resource pressure?”
- “Do logs/traces correlate with the metric spike?”
Today, these answers often require jumping between tools, writing queries, correlating signals across systems, and then producing a shareable narrative for stakeholders.
Our Solution
Provide a metrics-aware AI summarization layer on top of OpenShift observability:
- Curated + dynamically validated metrics catalog (OpenShift + GPU) used for accurate query selection
- Natural-language Chat with Prometheus that generates queries and explains results
- Dashboards for OpenShift fleet metrics, vLLM metrics, and hardware accelerators
- Report generation (HTML/PDF/Markdown) for sharing
- Optional alerting integrations (Slack notifications) when enabled
Features
- Console-native experience: Works where platform teams already operate—inside the OpenShift Console.
- Faster time-to-answer: Turn “what changed?” questions into clear, structured summaries in minutes.
- Fleet + namespace insights: Move from cluster-wide trends to namespace-level signals without context switching.
- GPU & model visibility: Understand accelerator utilization and model-serving performance using the same workflow.
- Explainable outputs: Summaries come with supporting details so engineers can validate conclusions quickly.
- Shareable reporting: Export clean HTML/PDF/Markdown reports for stakeholders and incident reviews.
Current Manual Process
Without this project, teams typically:
- Manually browse dashboards and write queries
- Manually identify the “right” metrics among thousands of candidates
- Copy/paste charts and raw values into a document
- Correlate symptoms across:
- metrics (Prometheus/Thanos)
- GPU telemetry (DCGM exporter)
- traces (Tempo)
- logs (Loki)
- Recreate the same analysis for each incident, model rollout, or performance regression
Our Solution Stack
Data sources
- Prometheus / Thanos: OpenShift and workload metrics
- vLLM: model-serving metrics (when vLLM is used)
- DCGM exporter (optional): GPU metrics (temperature, power, utilization, memory)
Observability add-ons (optional / stack-managed)
- OpenTelemetry Collector: collects traces and enables auto-instrumentation flows
- Tempo: trace storage/query (integrated into OpenShift Console via UI plugin)
- Loki: log aggregation/query (integrated into OpenShift Console via UI plugin)
- MinIO: object storage backend for traces/logs persistence
Application components
- MCP server: metrics analysis, report generation, and AI tool-calling surface
- LLM runtime: local model deployment by default (or connect to an existing model via
LLM_URL) - UI
- OpenShift Console Plugin (default,
DEV_MODE=false) - Standalone React UI (
DEV_MODE=true)
- OpenShift Console Plugin (default,
Architecture diagrams
Simple flow
- Access the AI Observability experience in OpenShift—either embedded in the OpenShift Console or via the standalone UI.
- Choose your analysis context (cluster, namespace, or model view and a time range), or ask a question using the chat interface.
- The platform gathers the relevant observability signals from your environment, covering both the current state and how it has changed over time.
- It synthesizes those signals into actionable insights, highlighting what appears healthy or unhealthy, the most likely contributors, and recommended next checks.
- Share outcomes easily by exporting the findings as a report when needed.
Requirements
Minimum hardware requirements
- CPU: 4 cores (8 recommended)
- Memory: 8 GiB RAM (16 GiB recommended)
- Storage: 20 GiB (50 GiB recommended)
- GPU: optional (recommended for DCGM + model workloads)
Minimum software requirements
- OpenShift: 4.18.33+
- OpenShift AI: 2.16.2+
- CLI tools:
ochelmv3.xyqjq(used by Makefile flows)
Required user permissions
- OpenShift: cluster-admin (or equivalent privileges for installing console plugins, cluster-wide observability components, and required RBAC).
Deploy
Quick Start - OpenShift Deployment
Default (production-style): OpenShift Console Plugin UI
make install NAMESPACE=your-namespace
Want to install with existing LLMs?
- No Hugging Face / no local model download (use an already-running model endpoint):
make install NAMESPACE=your-namespace LLM_URL=http://your-llm-endpoint
For developers - Standalone (development/standalone): React UI route
make install NAMESPACE=your-namespace DEV_MODE=true
Access
- Console Plugin (default): OpenShift Console → left navigation → AI Observability
- React UI (DEV_MODE=true): OpenShift Console → Networking → Routes (route name typically
aiobs-react-ui)
Optional console menus
- Traces menu:
make enable-tracing-ui - Logs menu:
make enable-logging-ui
Quick Start - Local Development
Use the local dev helper to port-forward dependencies and run local components.
uv sync
./scripts/local-dev.sh -n your-namespace
Usage
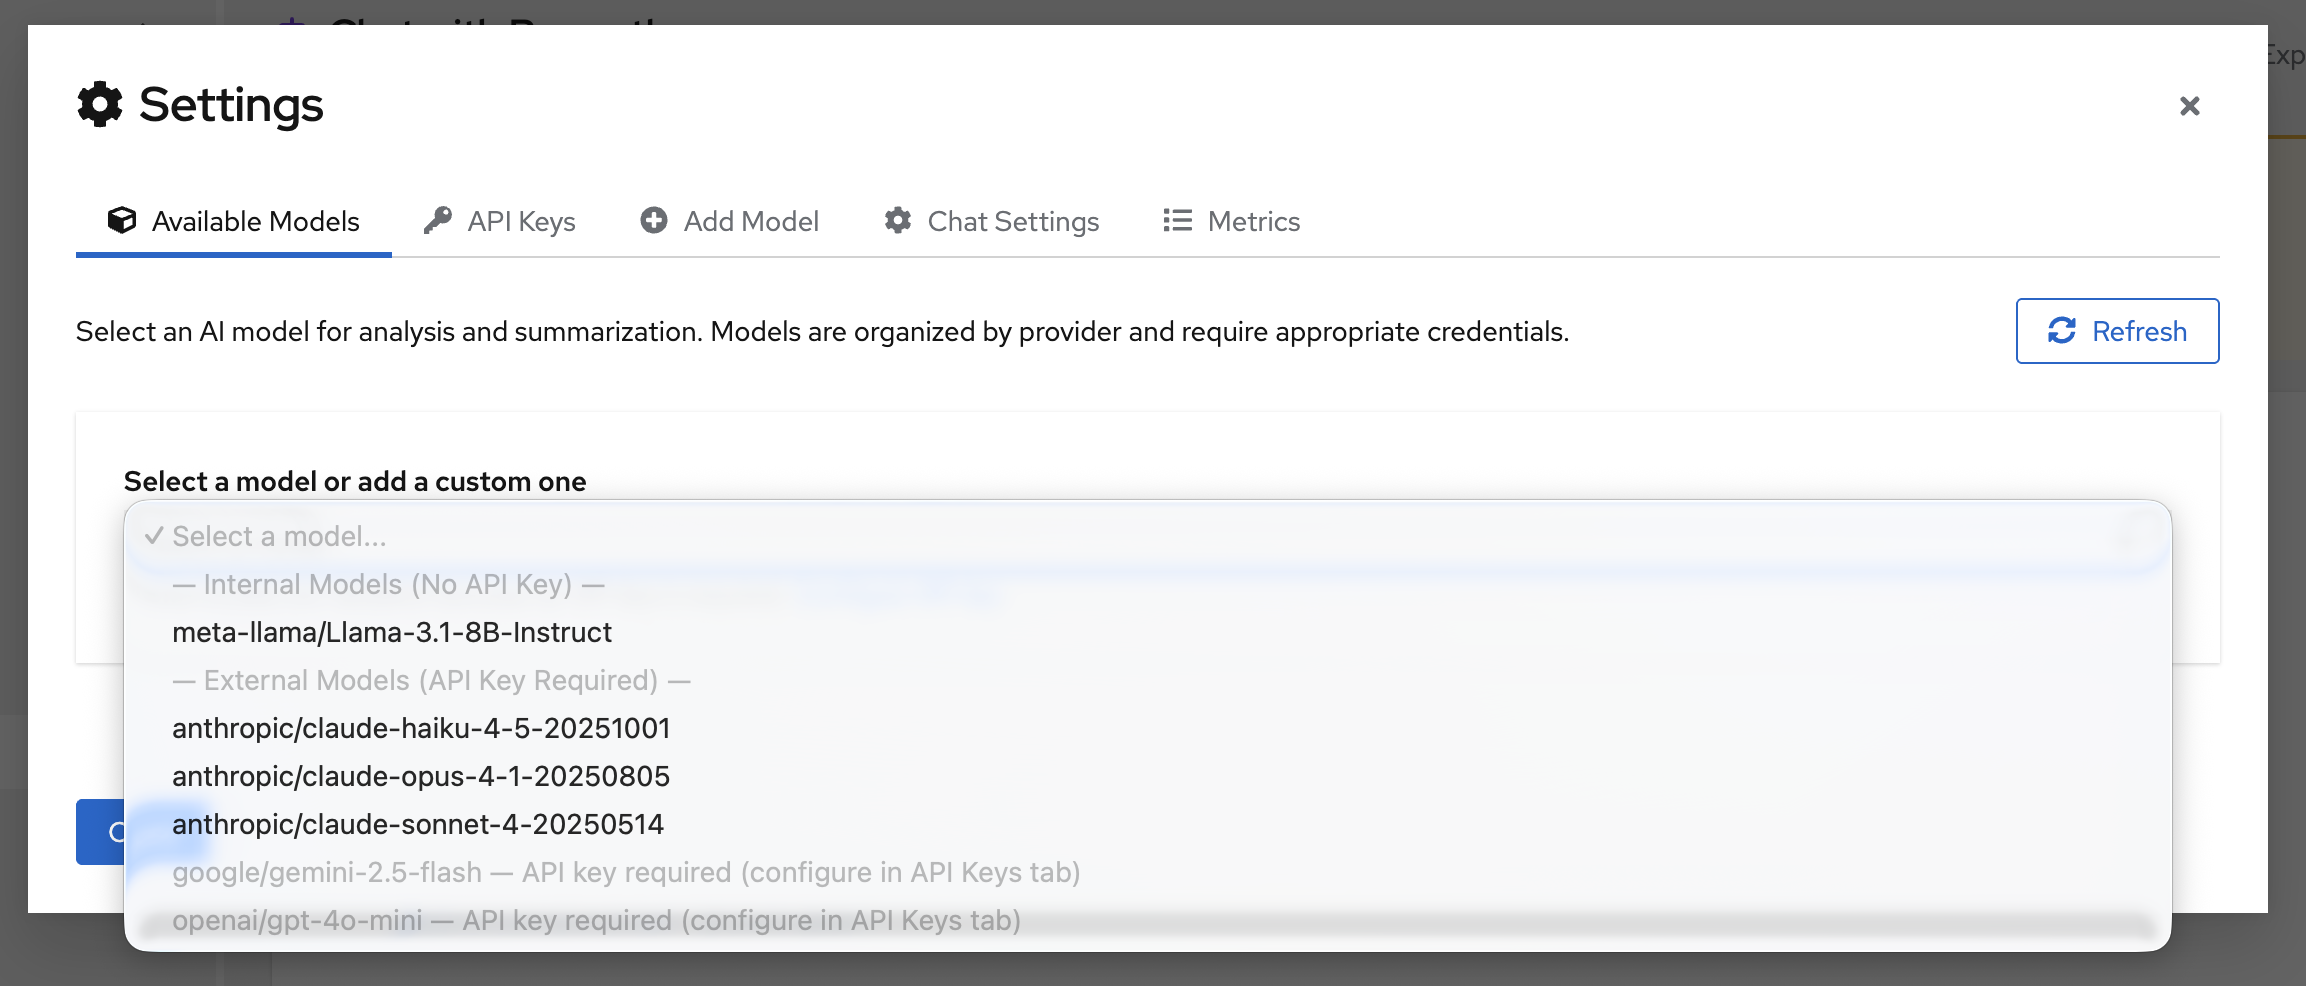
Enable AI Assistance
Navigate to settings and configure a model:
You can either set an API_KEY or add a custom model. Supported providers include OpenAI, Gemini, Anthropic, and Meta.
Once the model configuration is set, select your model from the dropdown:
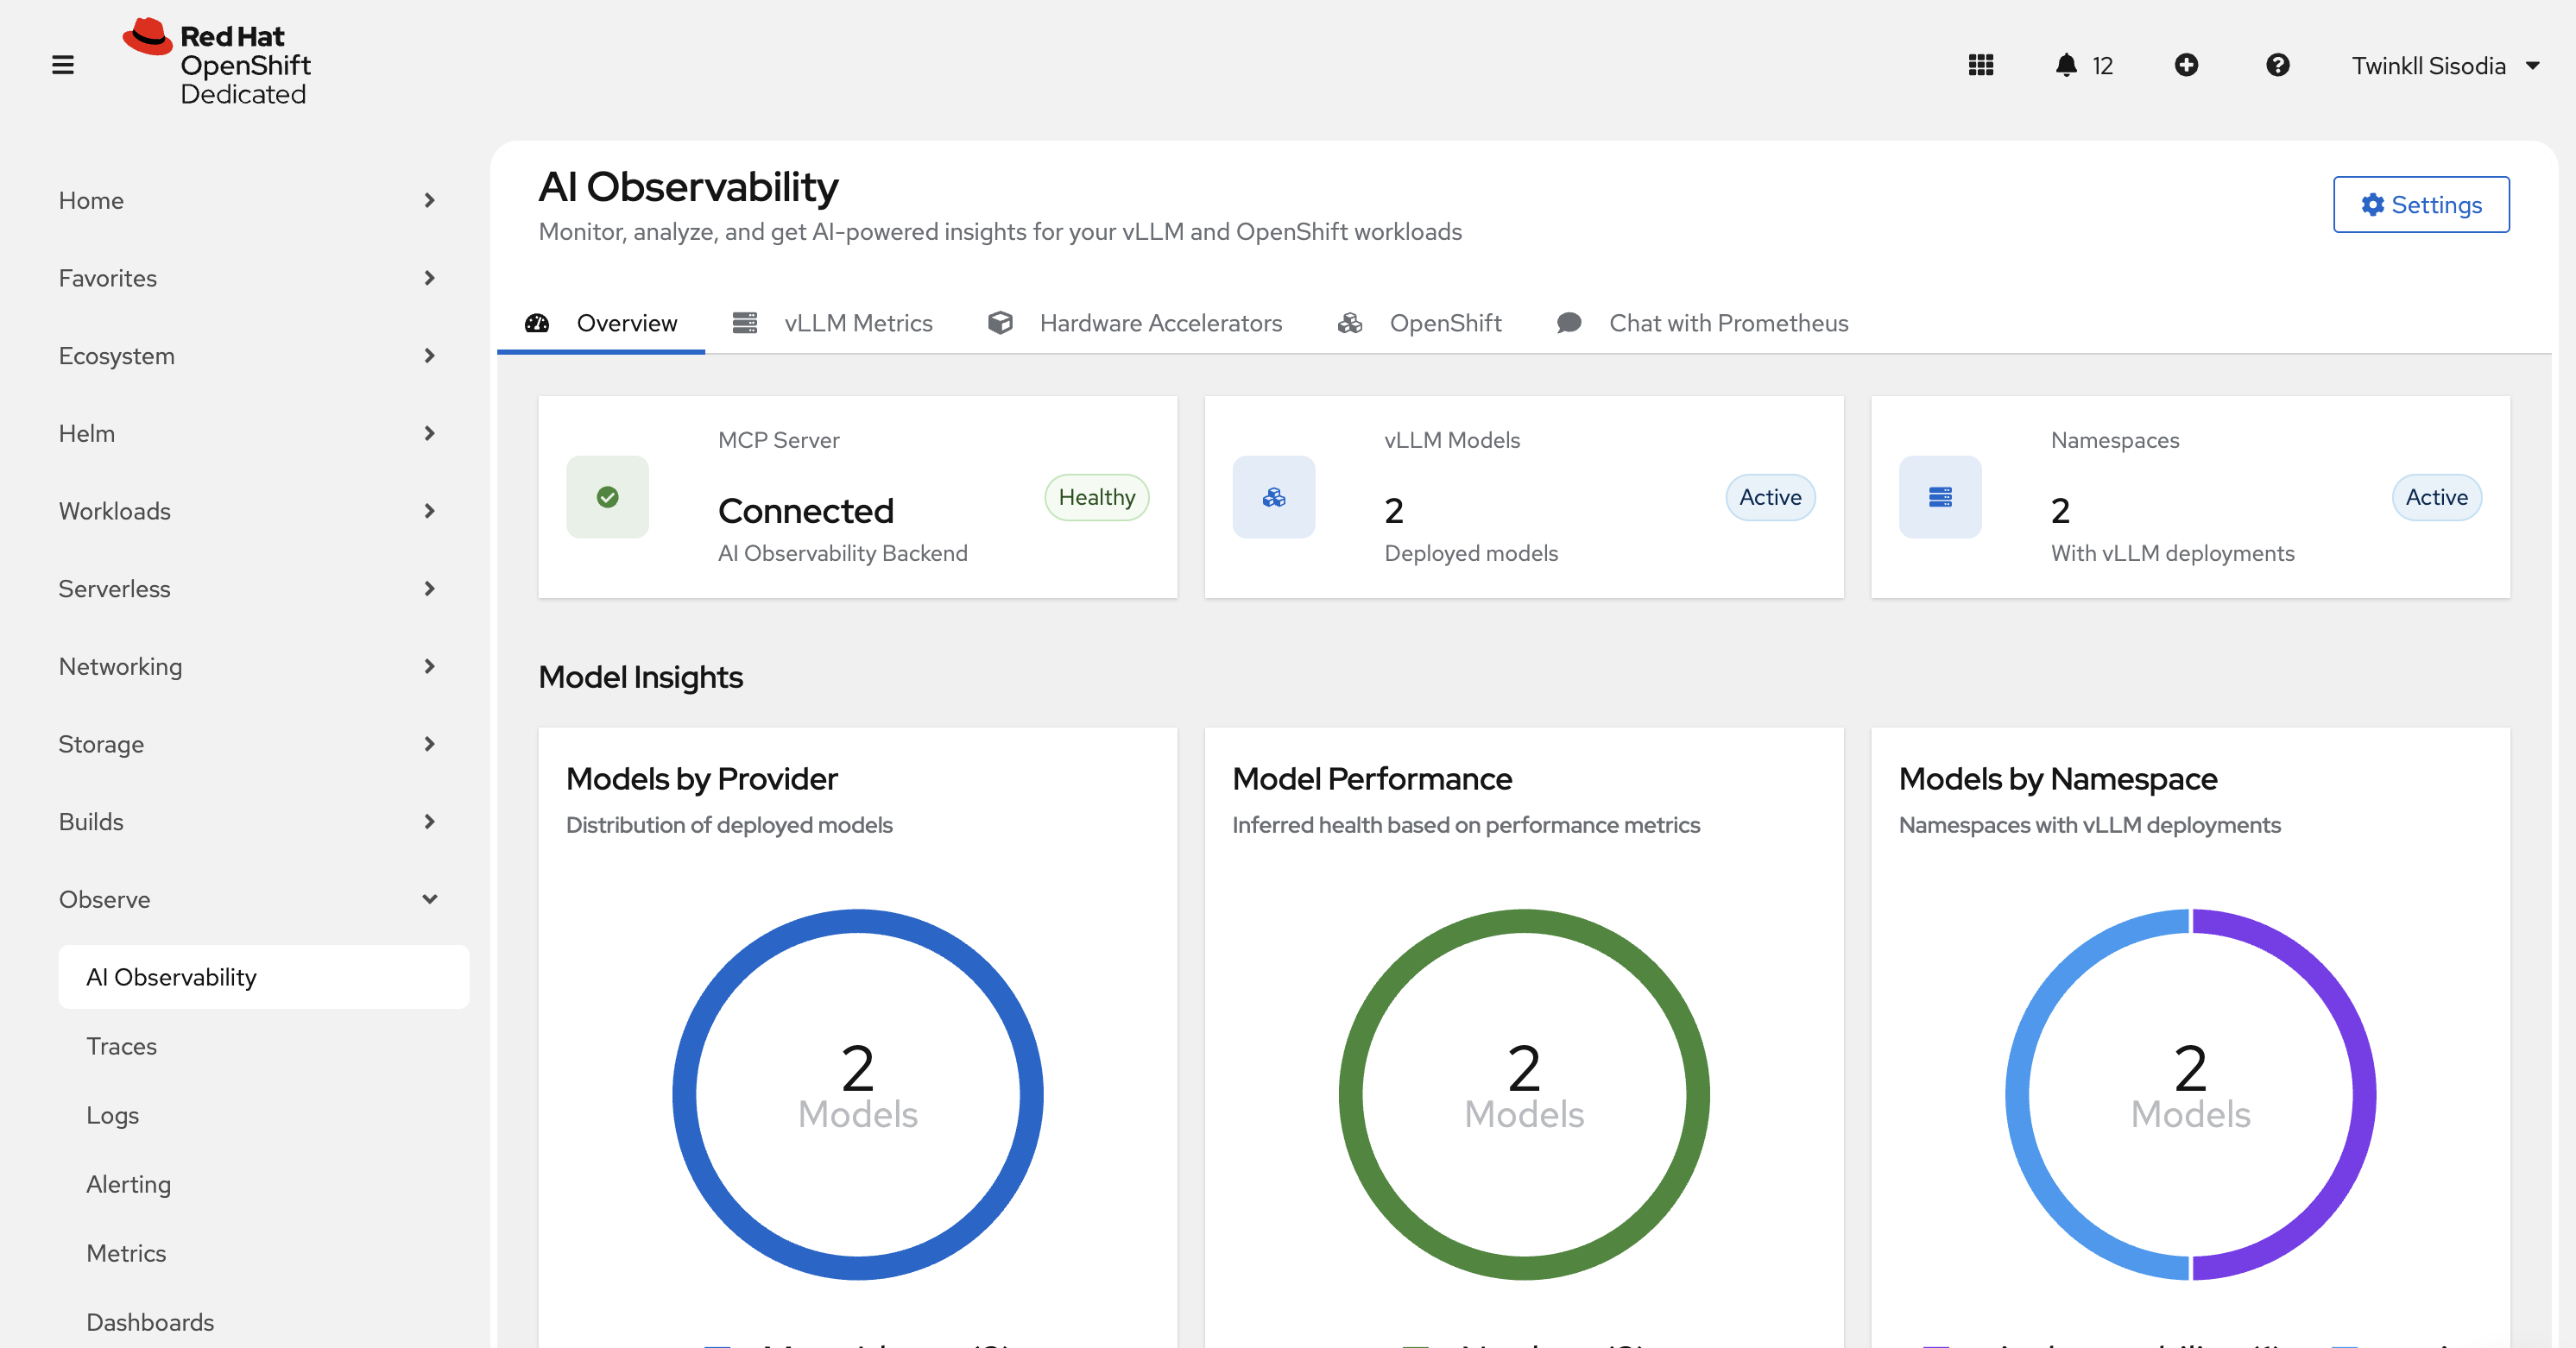
OpenShift Console Plugin (default)
Open the OpenShift Console and navigate to AI Observability from the left navigation.
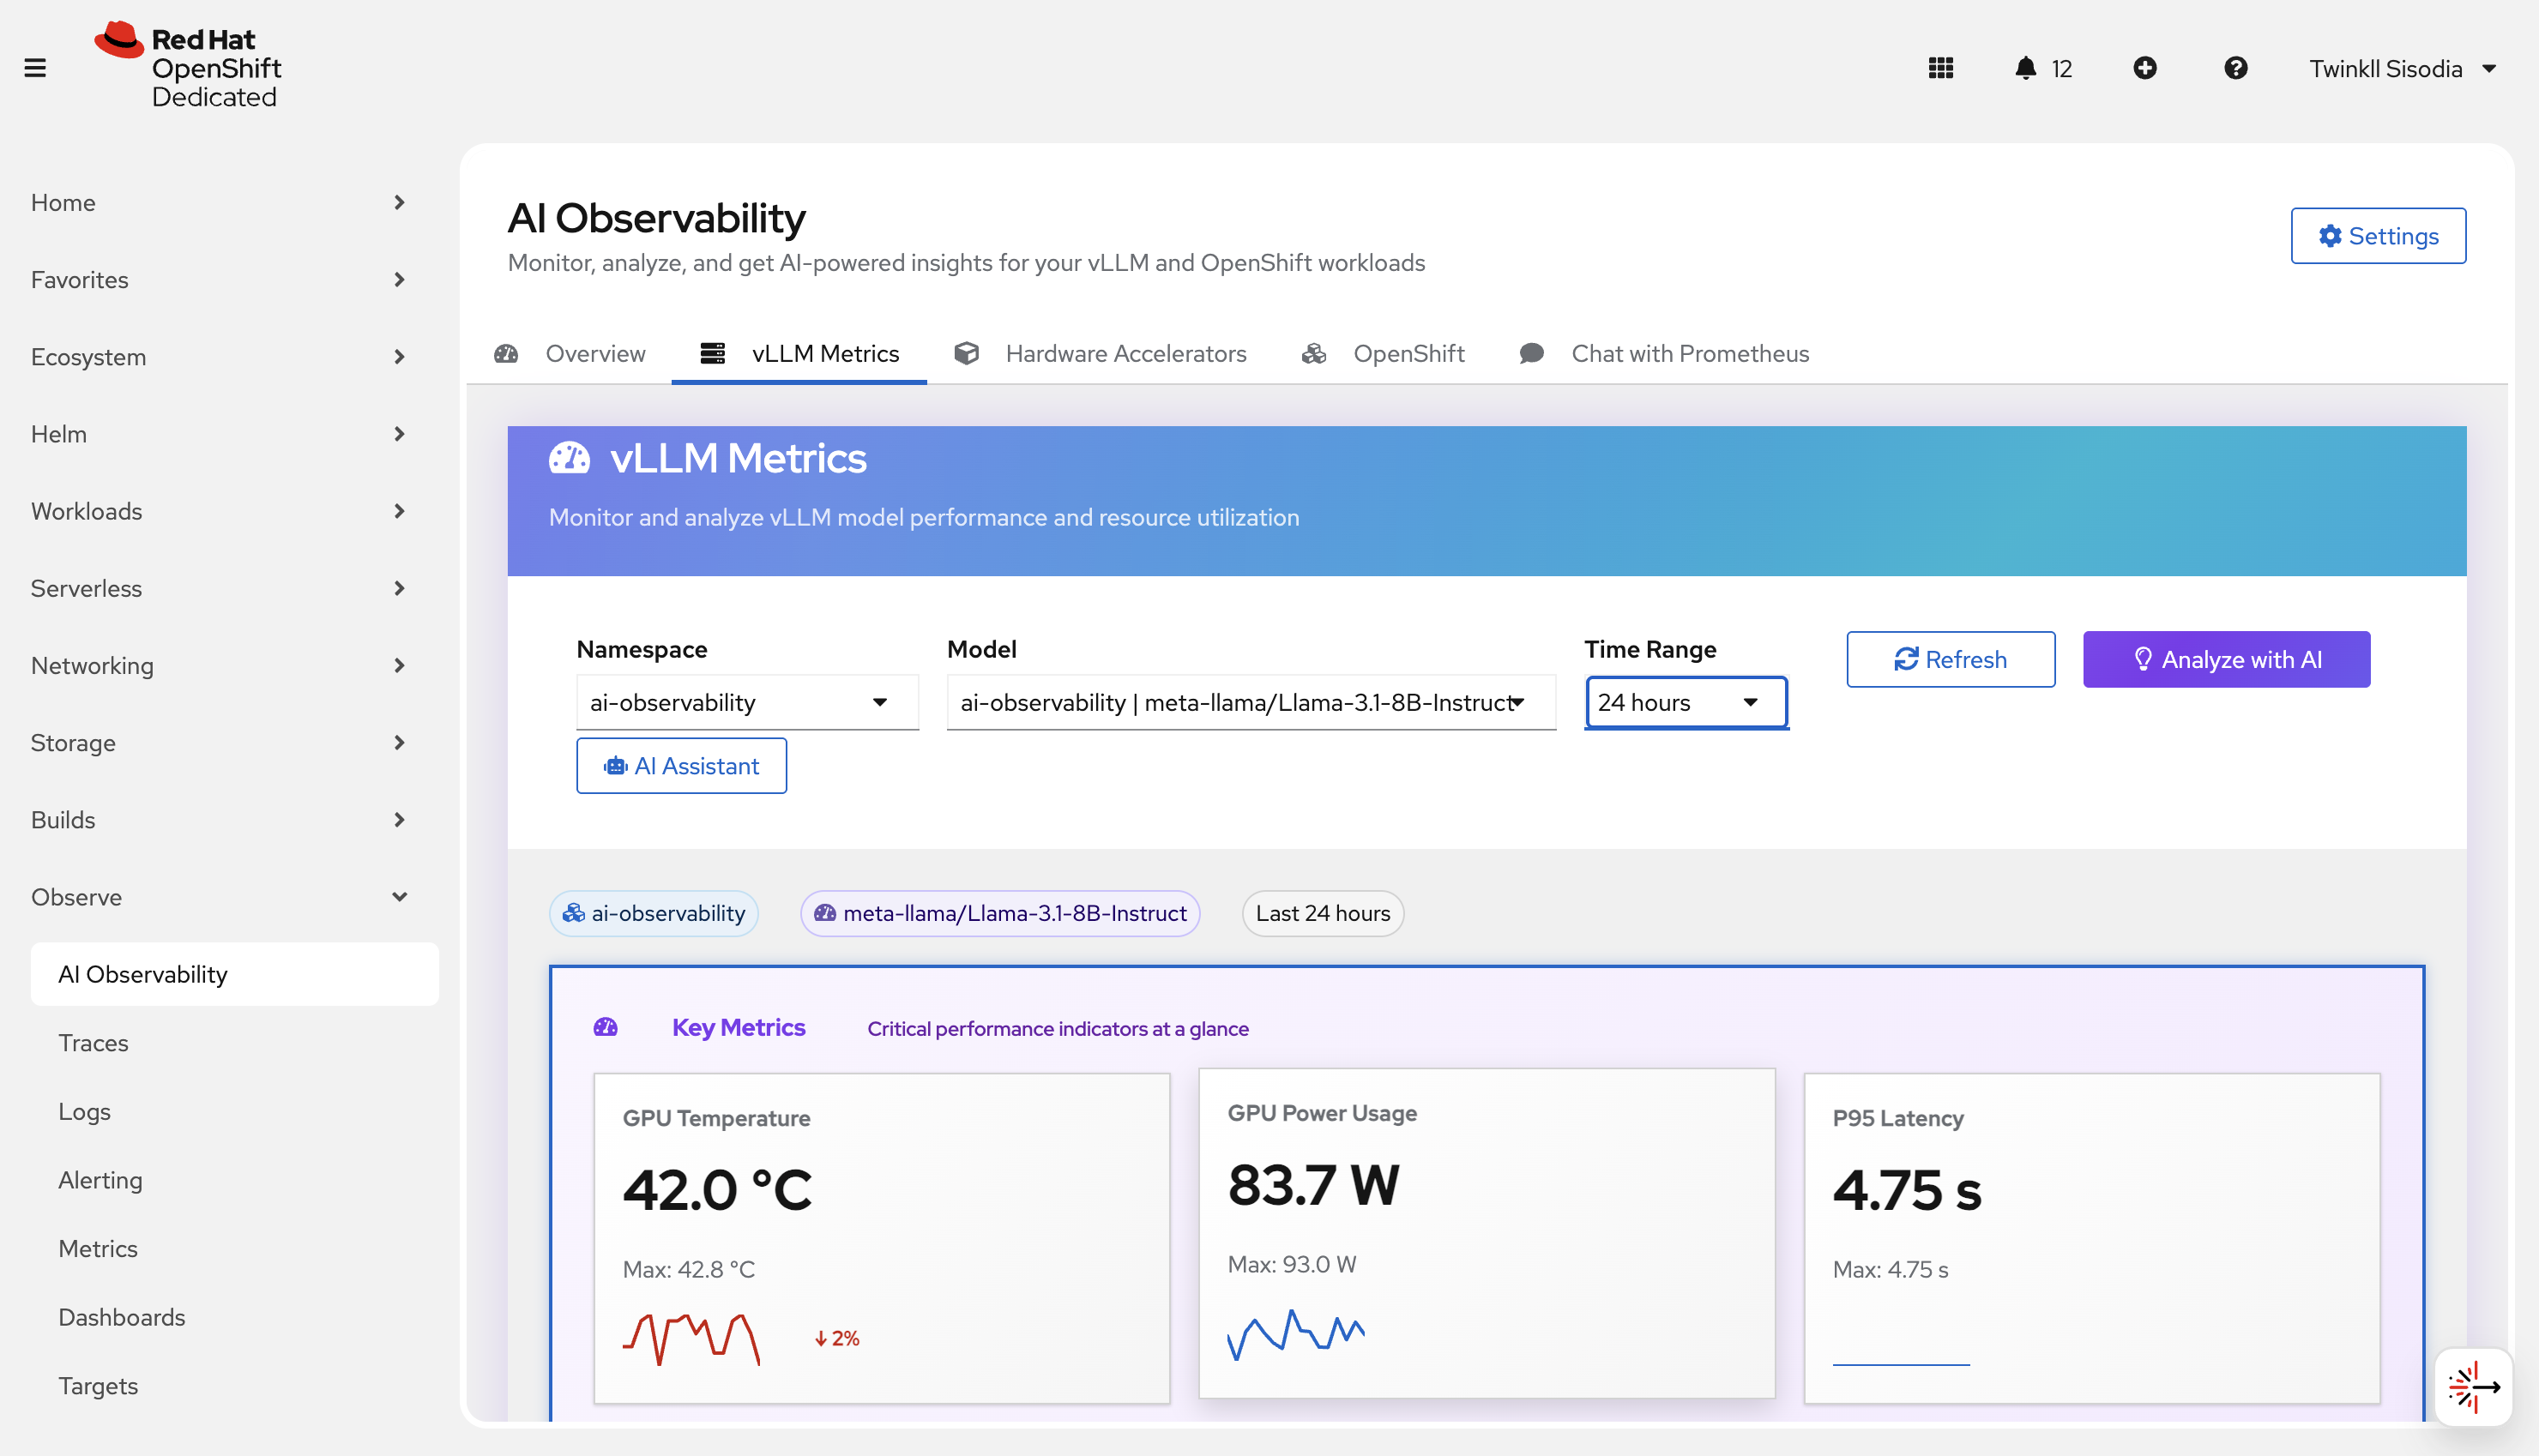
vLLM metrics
Use this page to understand model-serving performance when vLLM metrics are present.
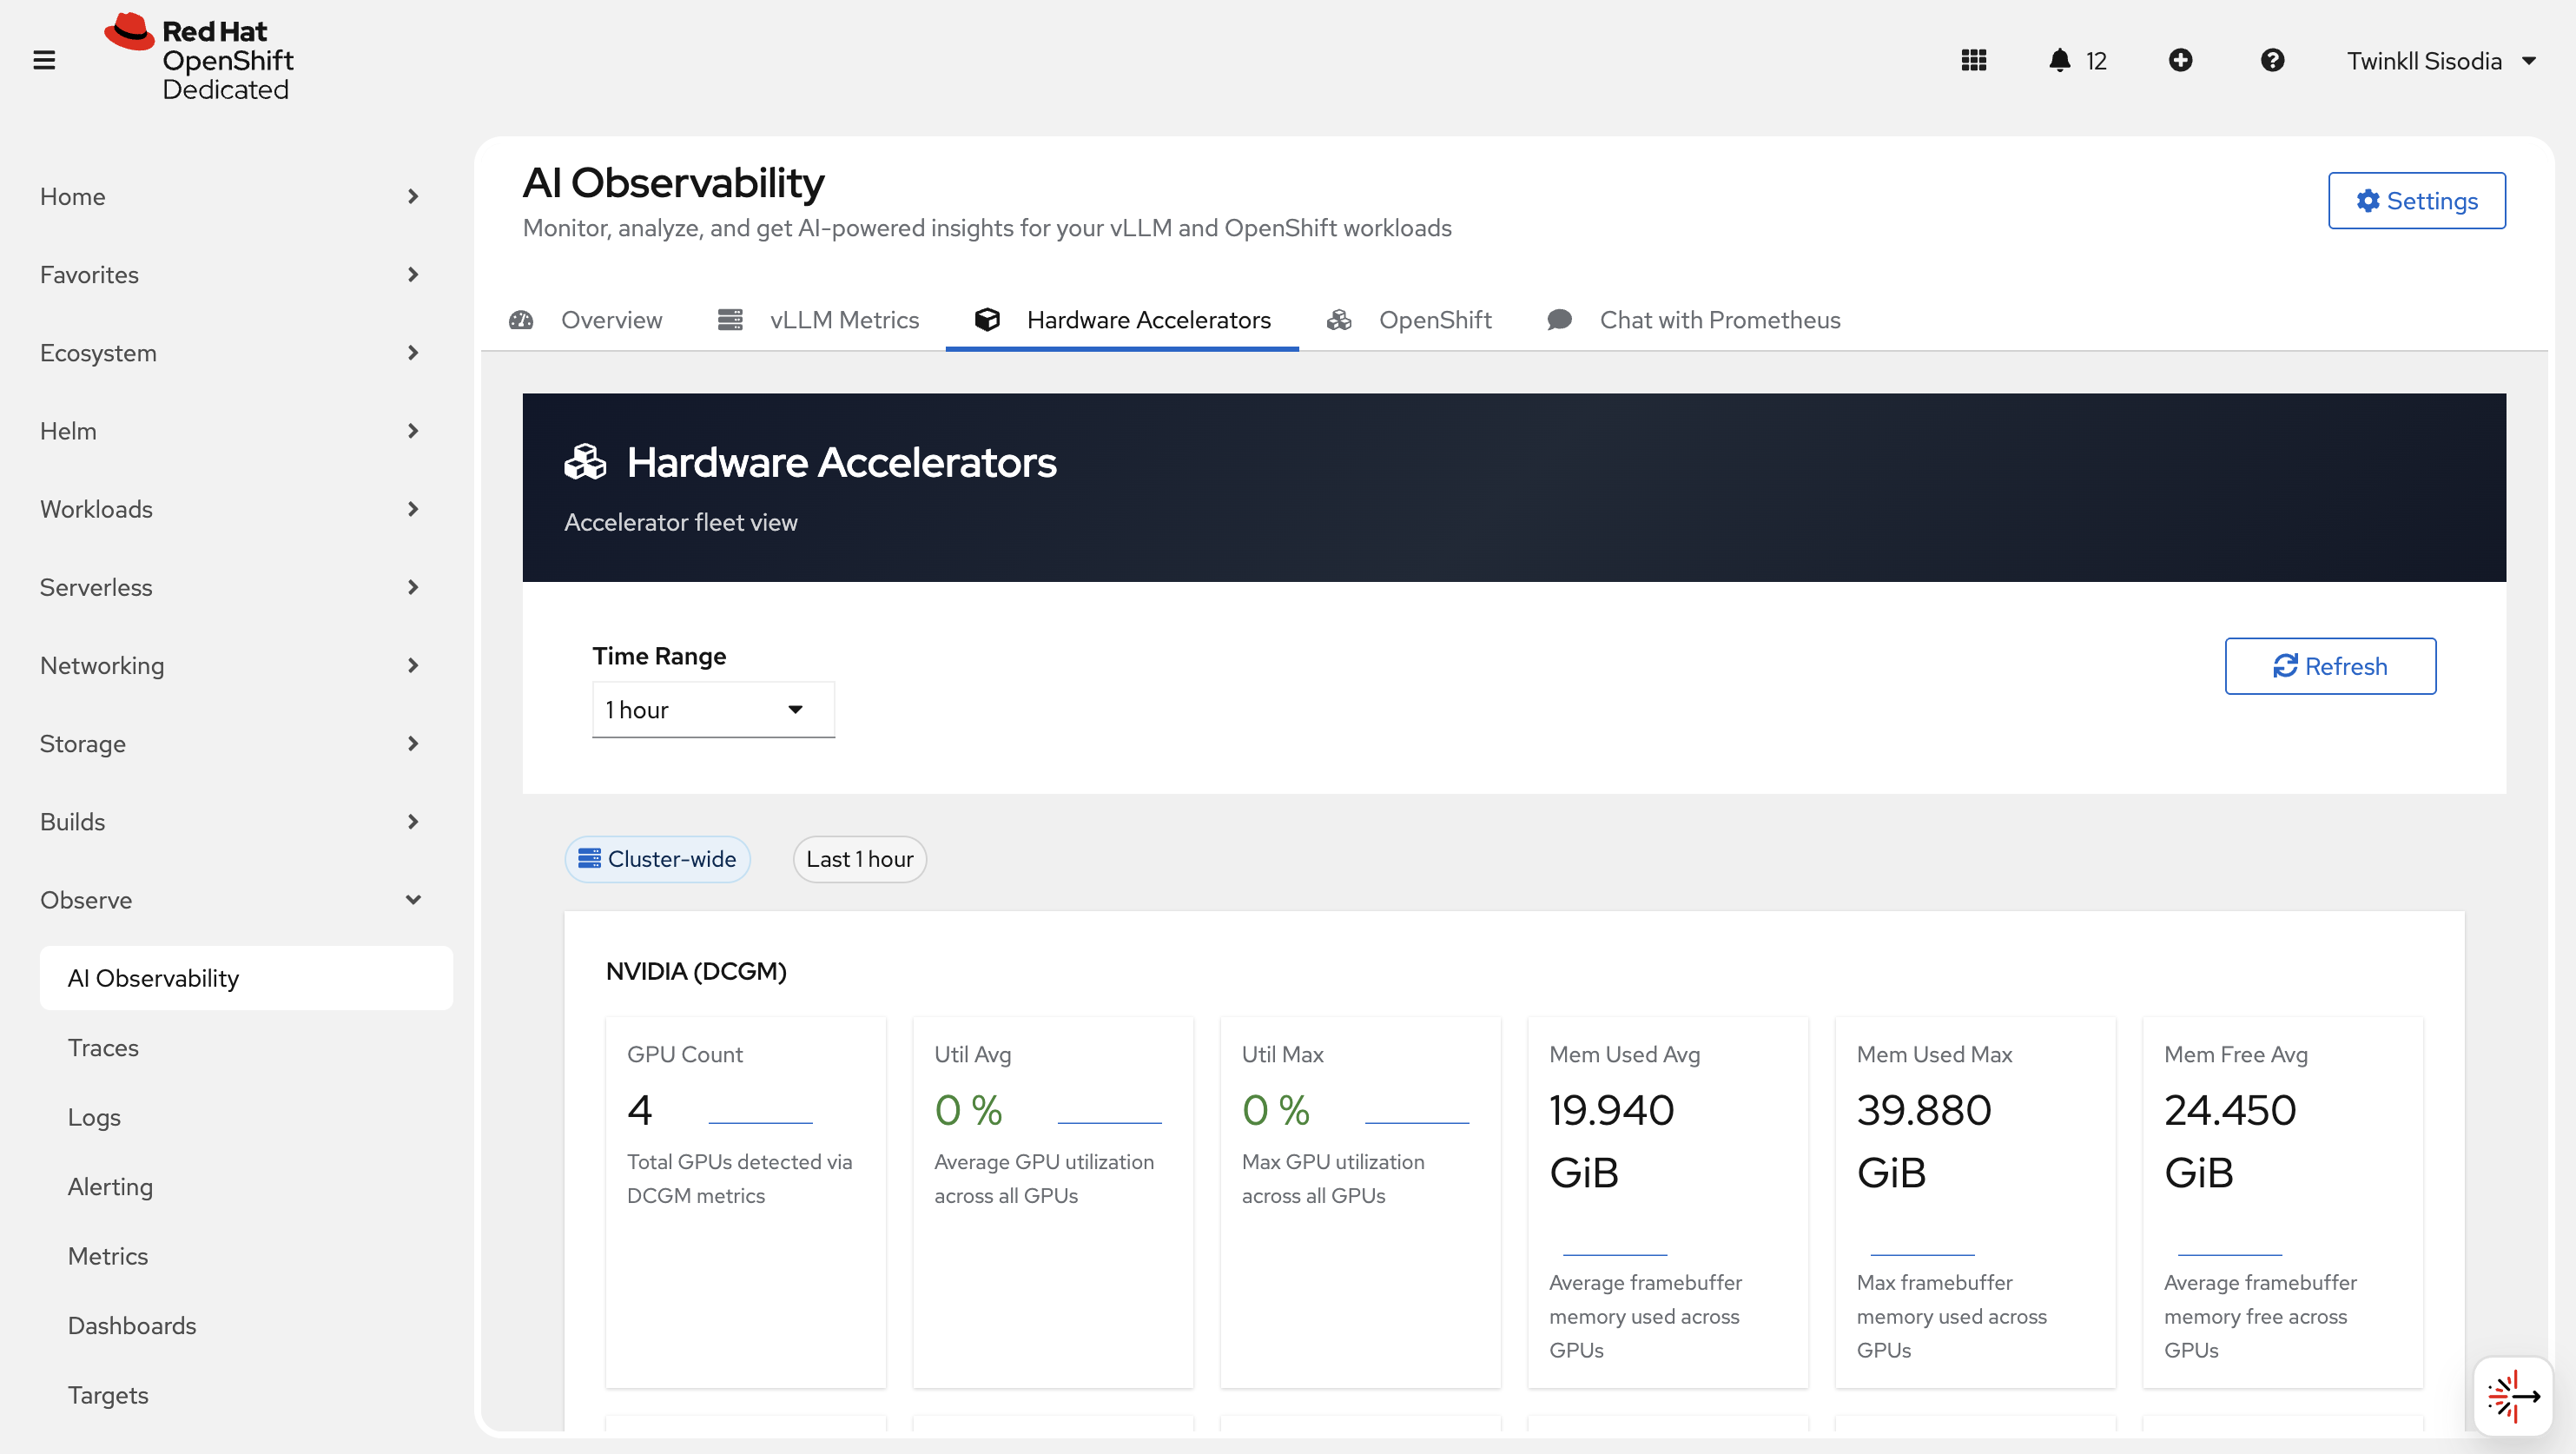
Hardware Accelerator
Use this page to review accelerator-related signals (for example GPU utilization/health when available).
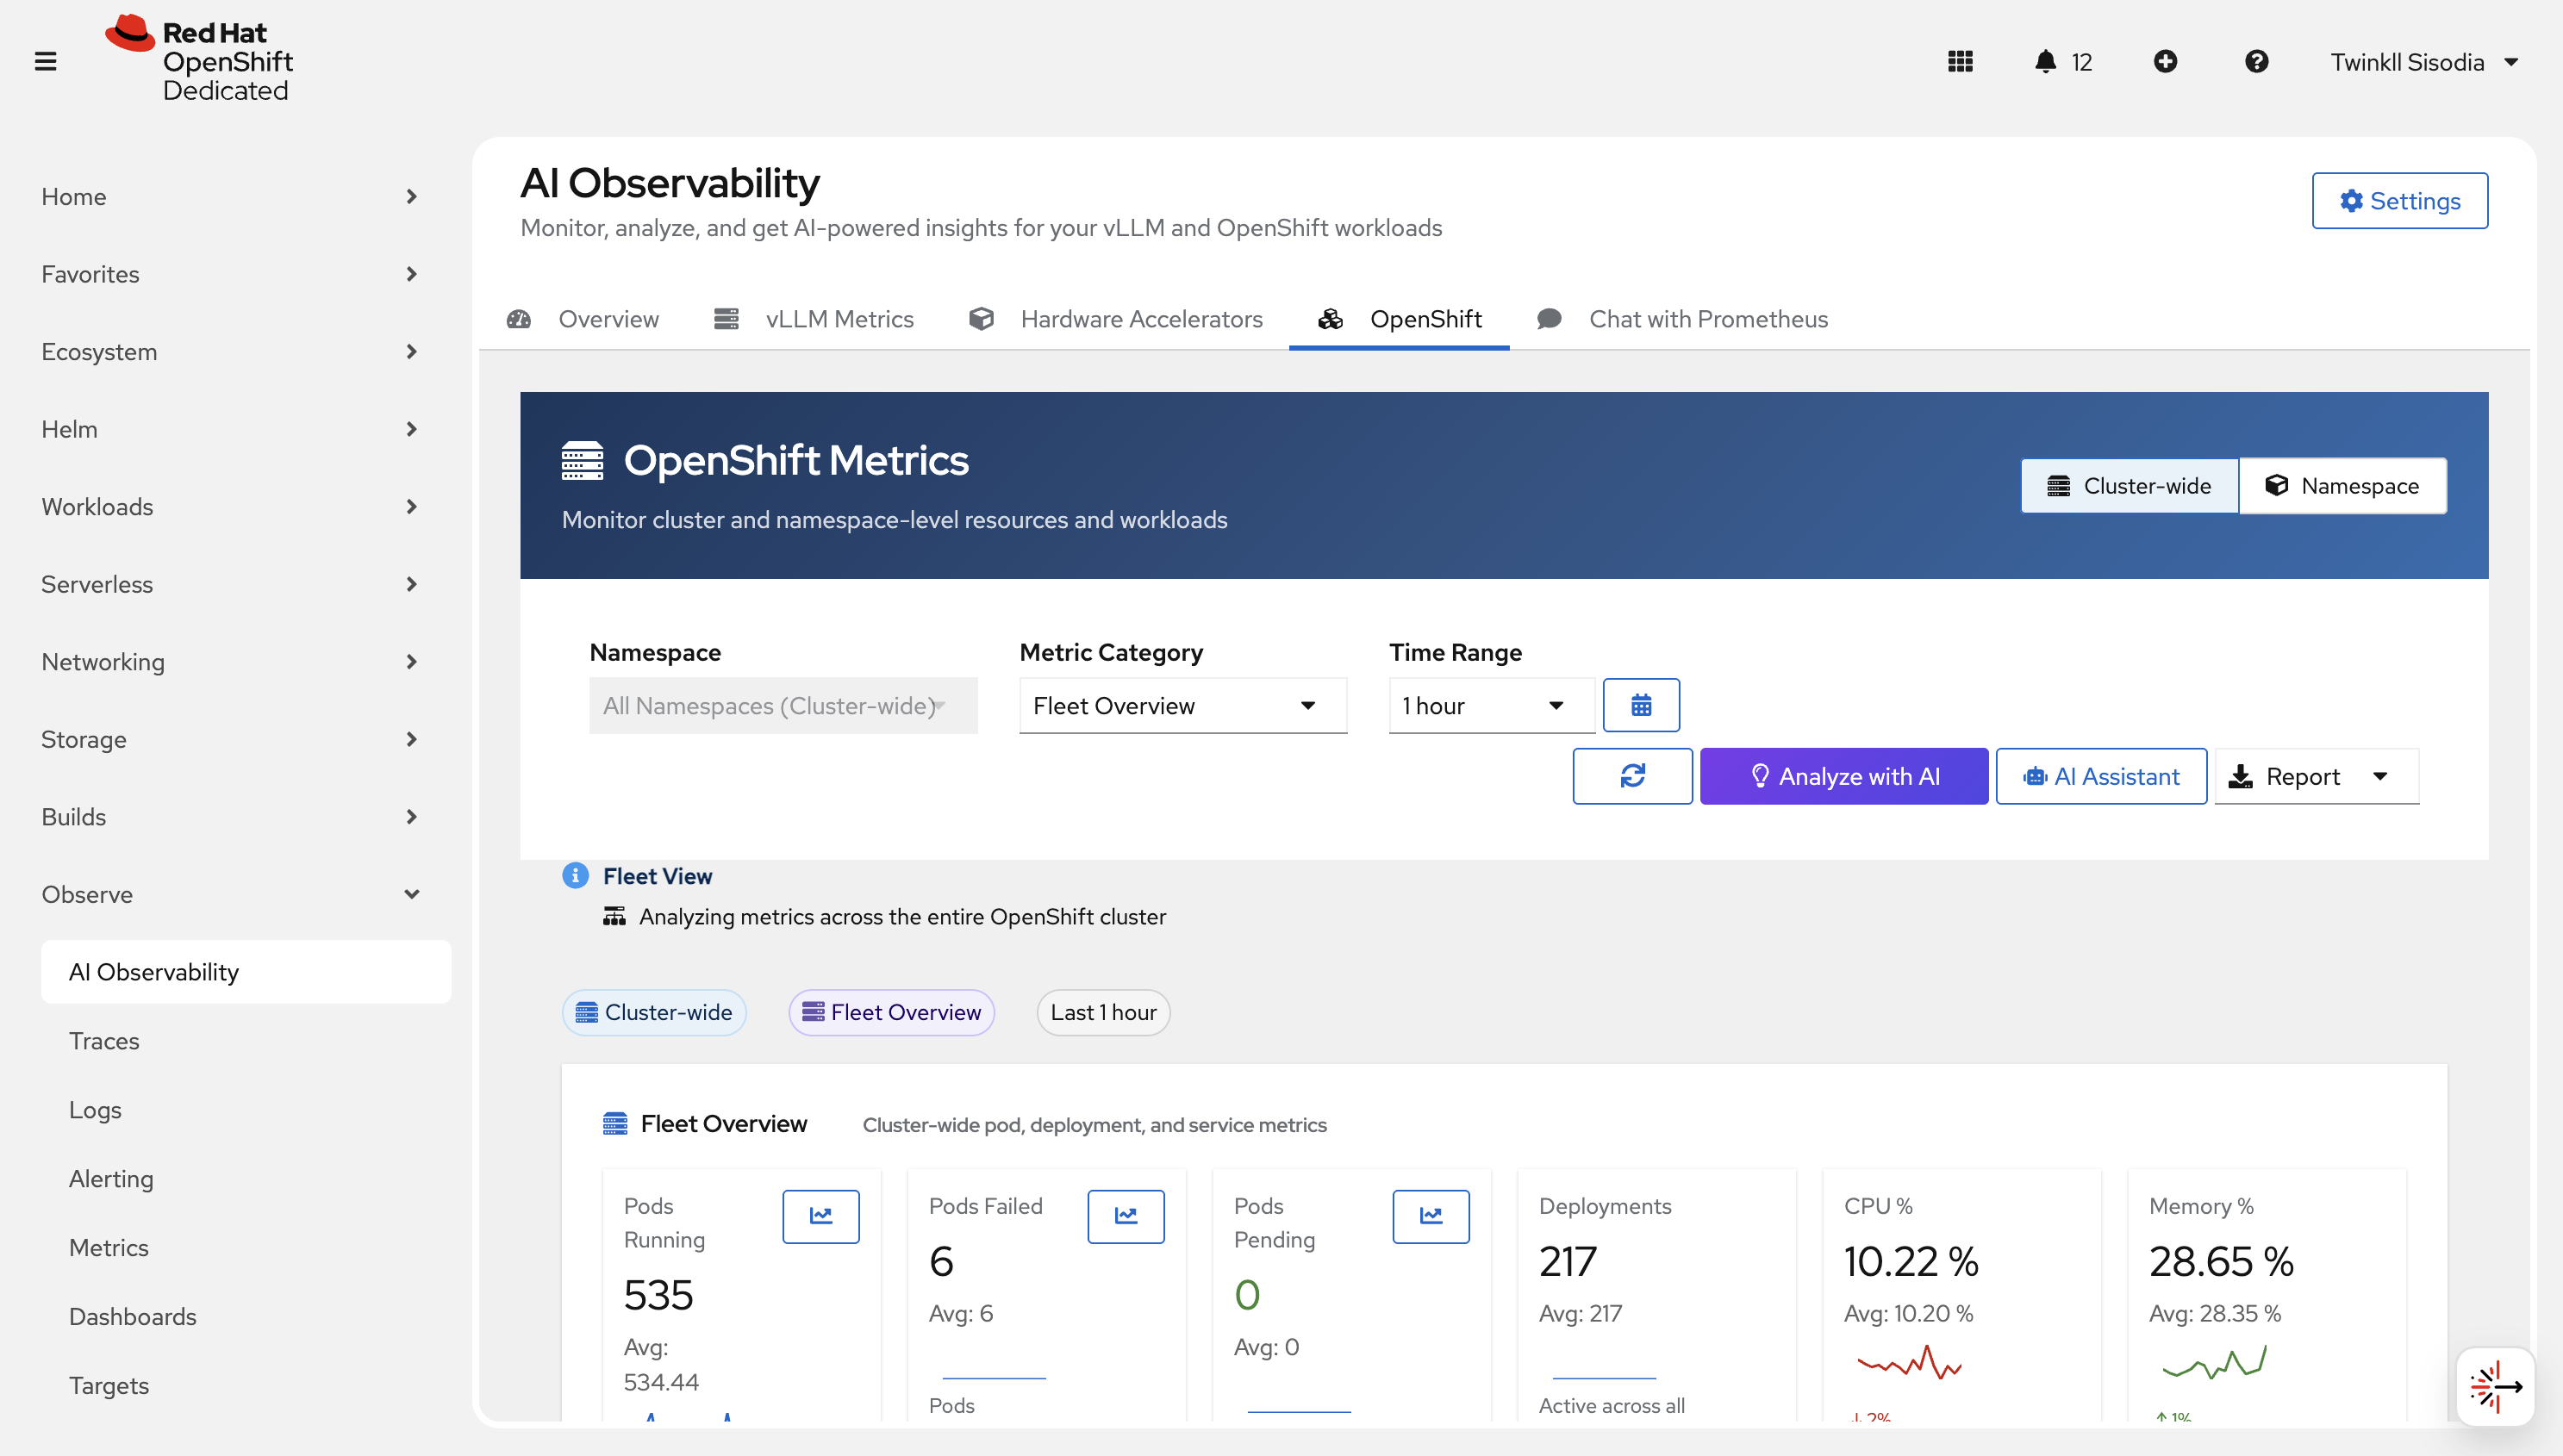
OpenShift metrics
Use this page to analyze cluster-wide and namespace-scoped OpenShift metrics.
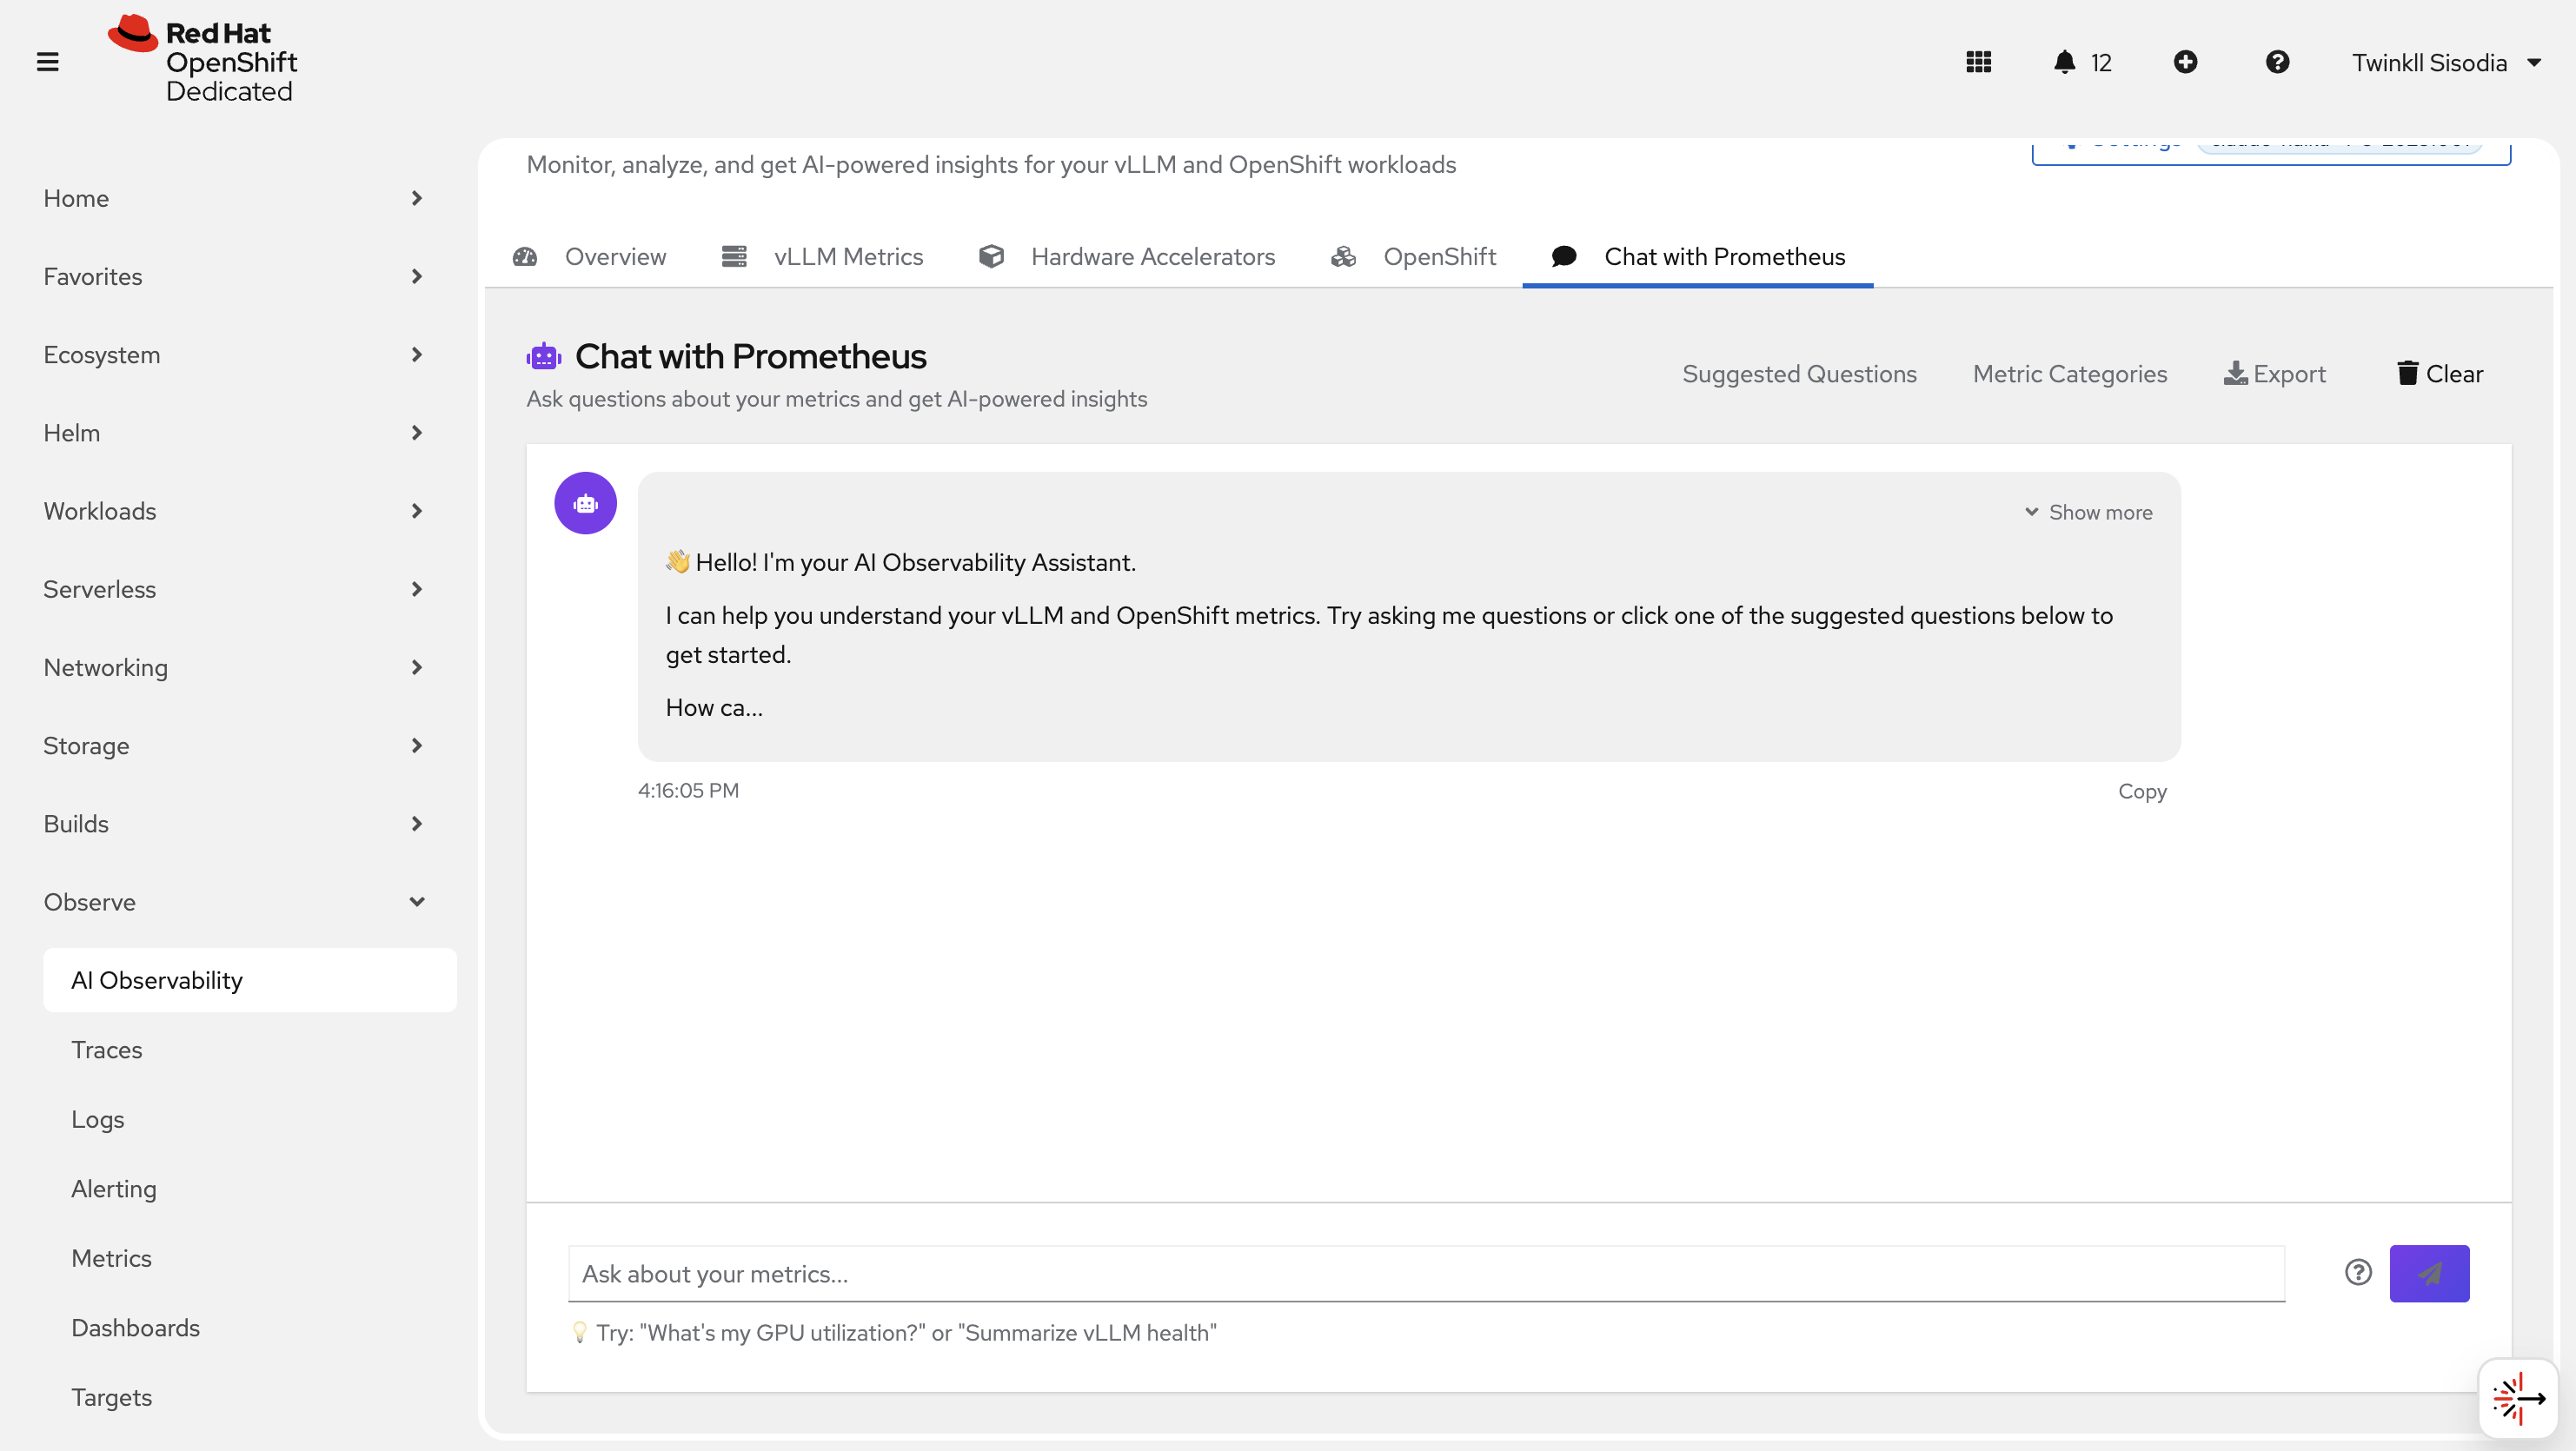
Chat with Prometheus
Ask questions in natural language and get a query + explanation back.
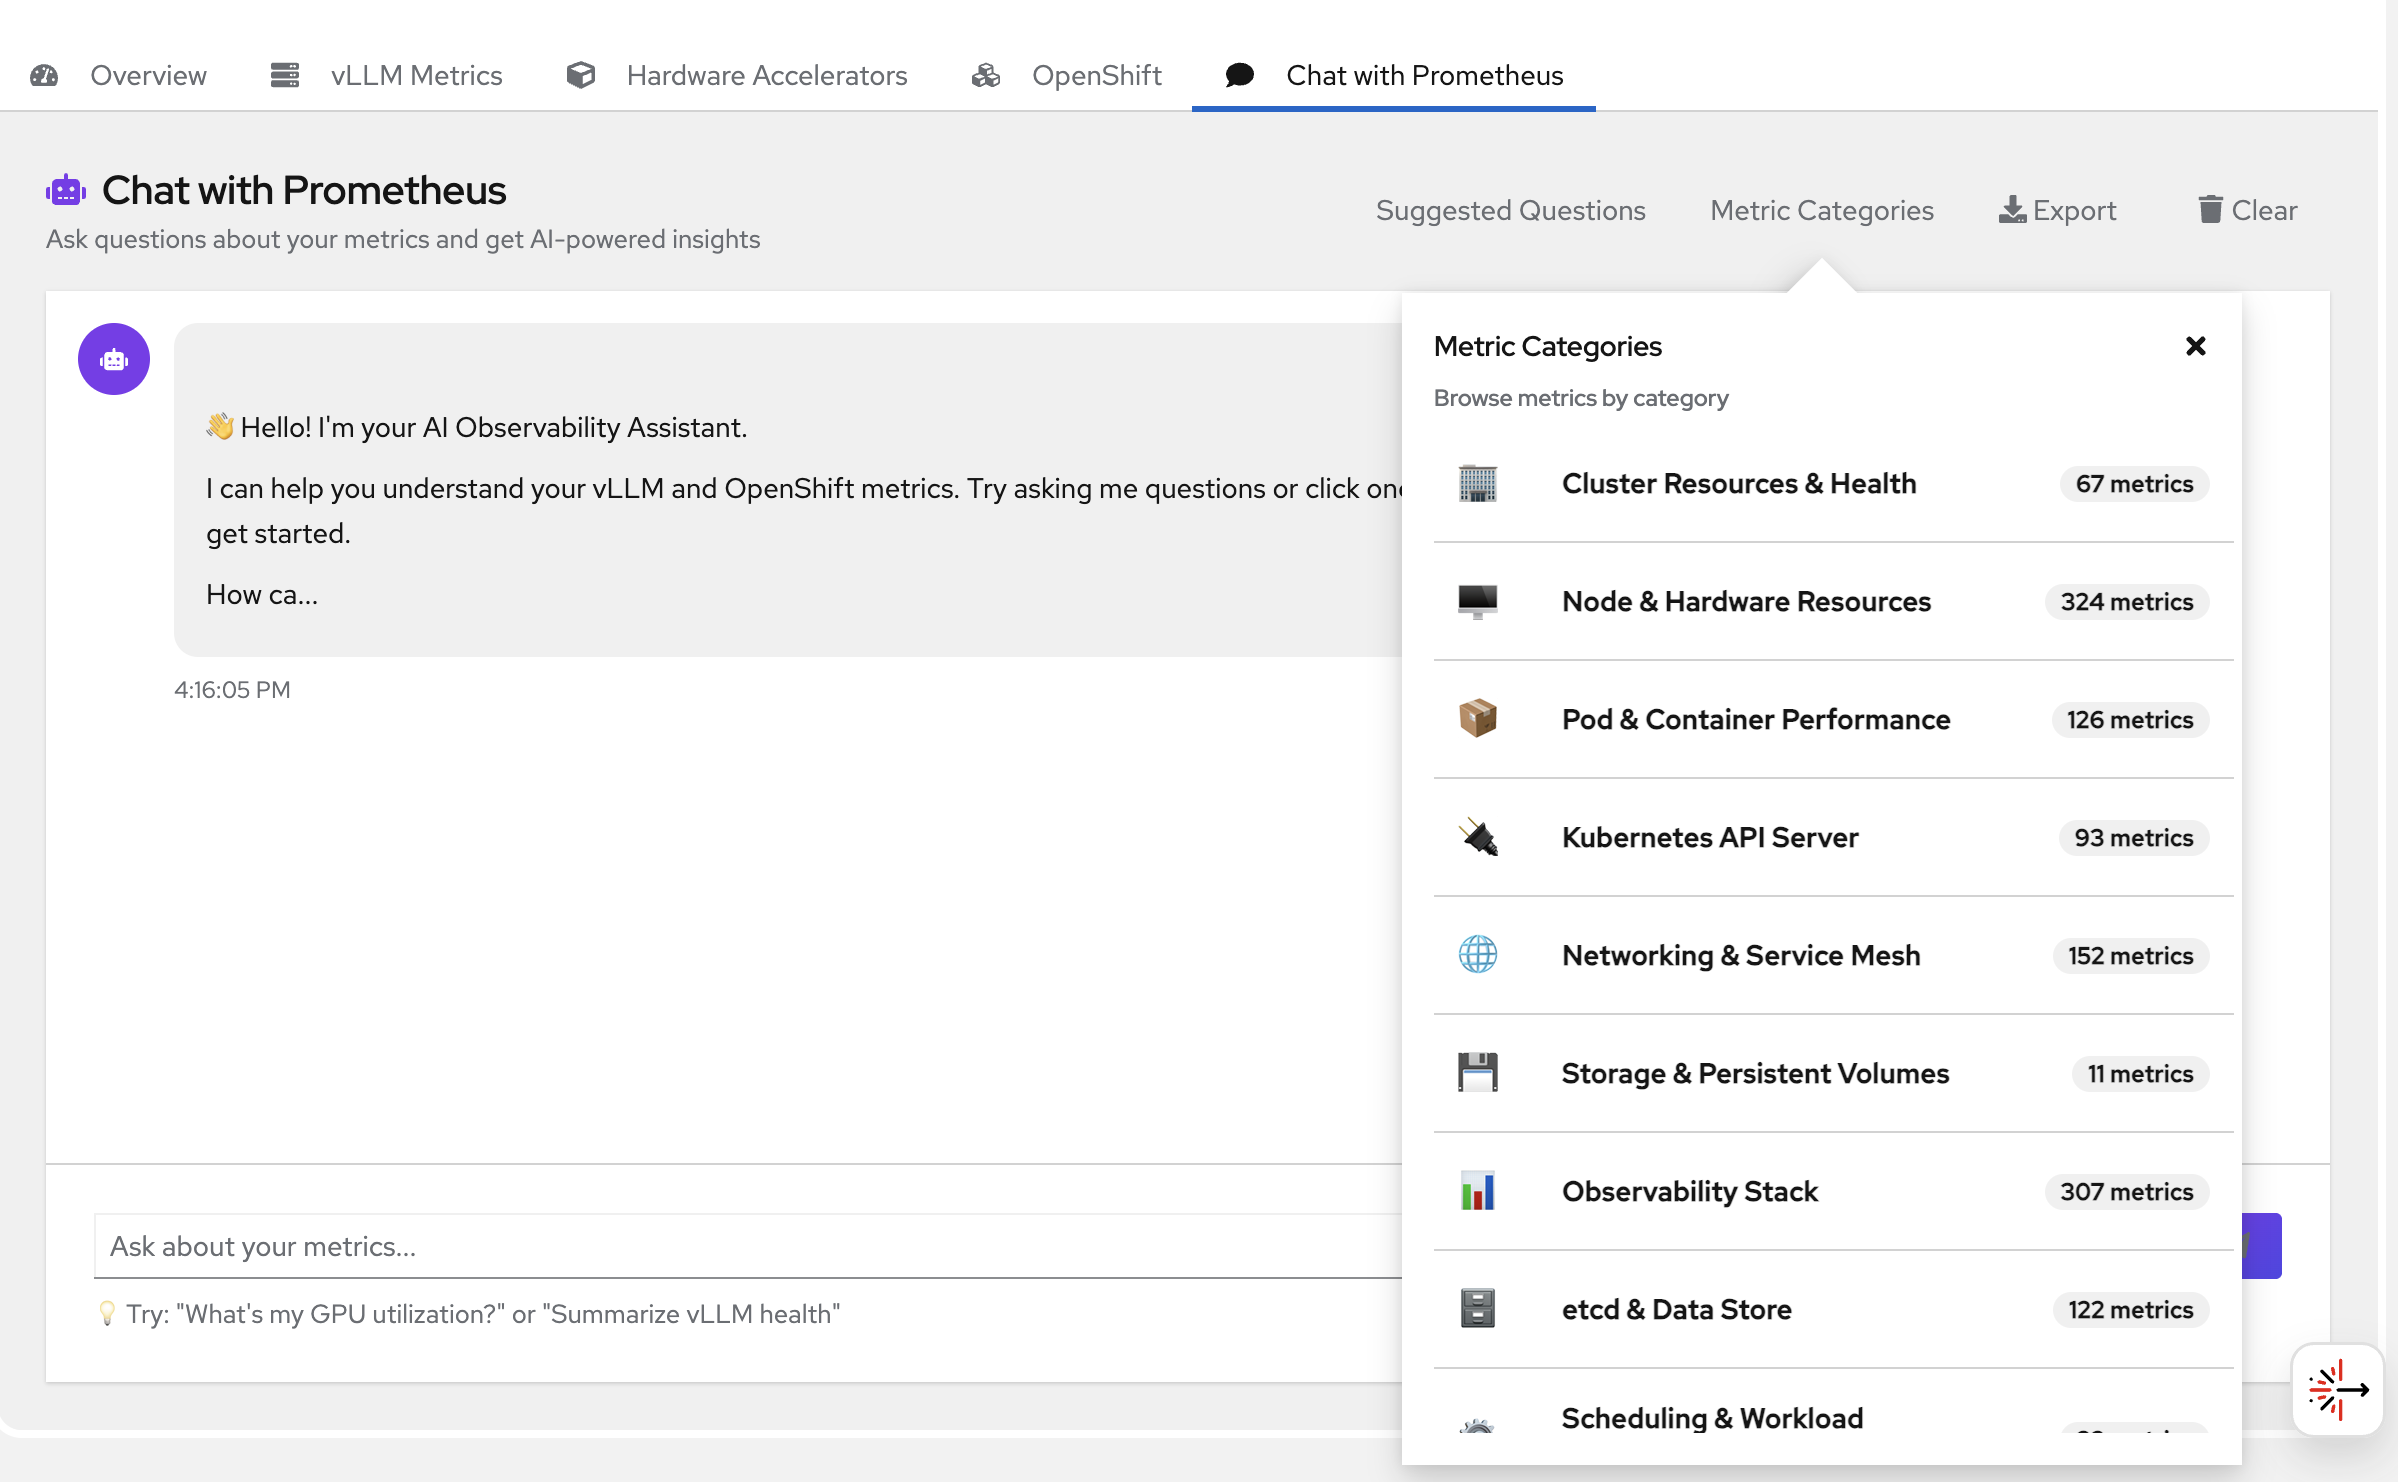
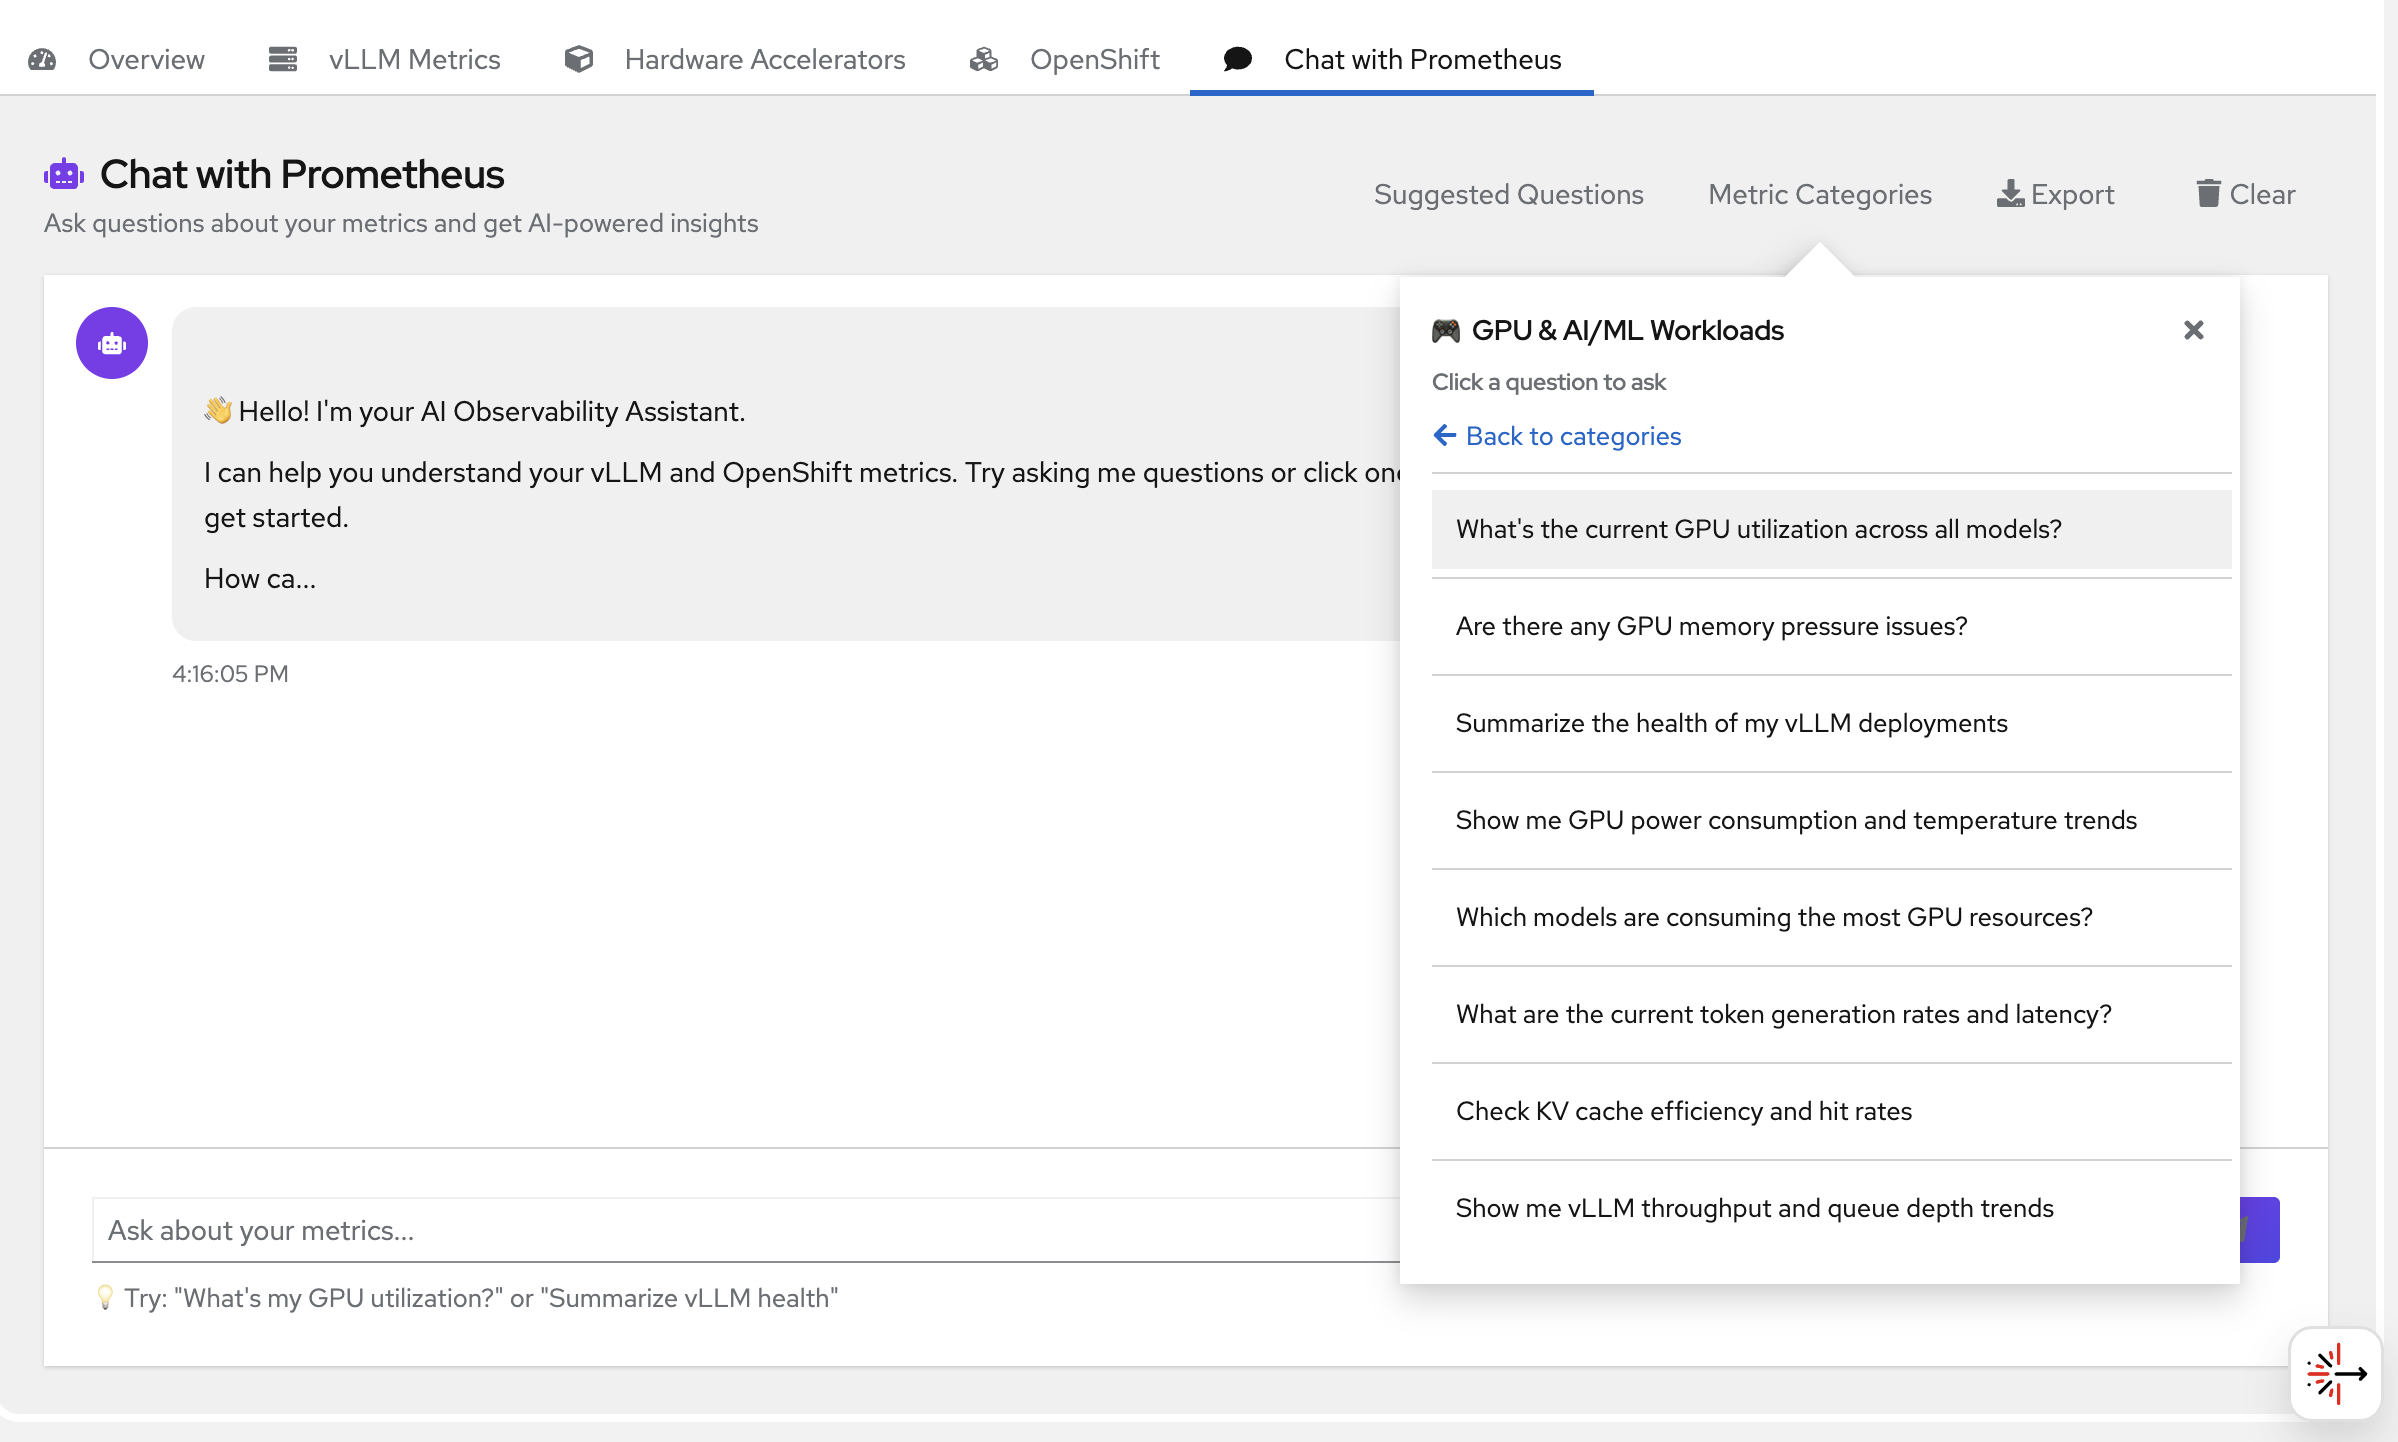
You can also navigate to suggested metrics and choose from the questions there -
Reports
Export reports when needed (HTML/PDF/Markdown).
Observe → Traces / Observe → Logs (optional)
If enabled in your cluster, use:
- Observe → Traces to view traces
- Observe → Logs to query logs
Delete
Uninstall the deployment from the namespace:
make uninstall NAMESPACE=your-namespace
References
- Uses Prometheus and Thanos
- Uses Tempo for traces
- Uses Loki for logs
- Uses vLLM for model serving (when applicable)
- Integrates with OpenTelemetry for distributed tracing and observability