Este contenido no está disponible en el idioma seleccionado.
Observability
Read more to learn how to optimize your managed clusters by enabling and customizing the observability service.
Abstract
Chapter 1. Observing environments introduction
With the observability service enabled, you can use Red Hat Advanced Cluster Management for Kubernetes to gain insight about and optimize your managed clusters. This information can save cost and prevent unnecessary events.
1.1. Observing environments
You can use Red Hat Advanced Cluster Management for Kubernetes to gain insight and optimize your managed clusters. Enable the observability service operator, multicluster-observability-operator, on your hub cluster to monitor the health of your managed clusters. Learn about the architecture for the multicluster observability service in the following sections.
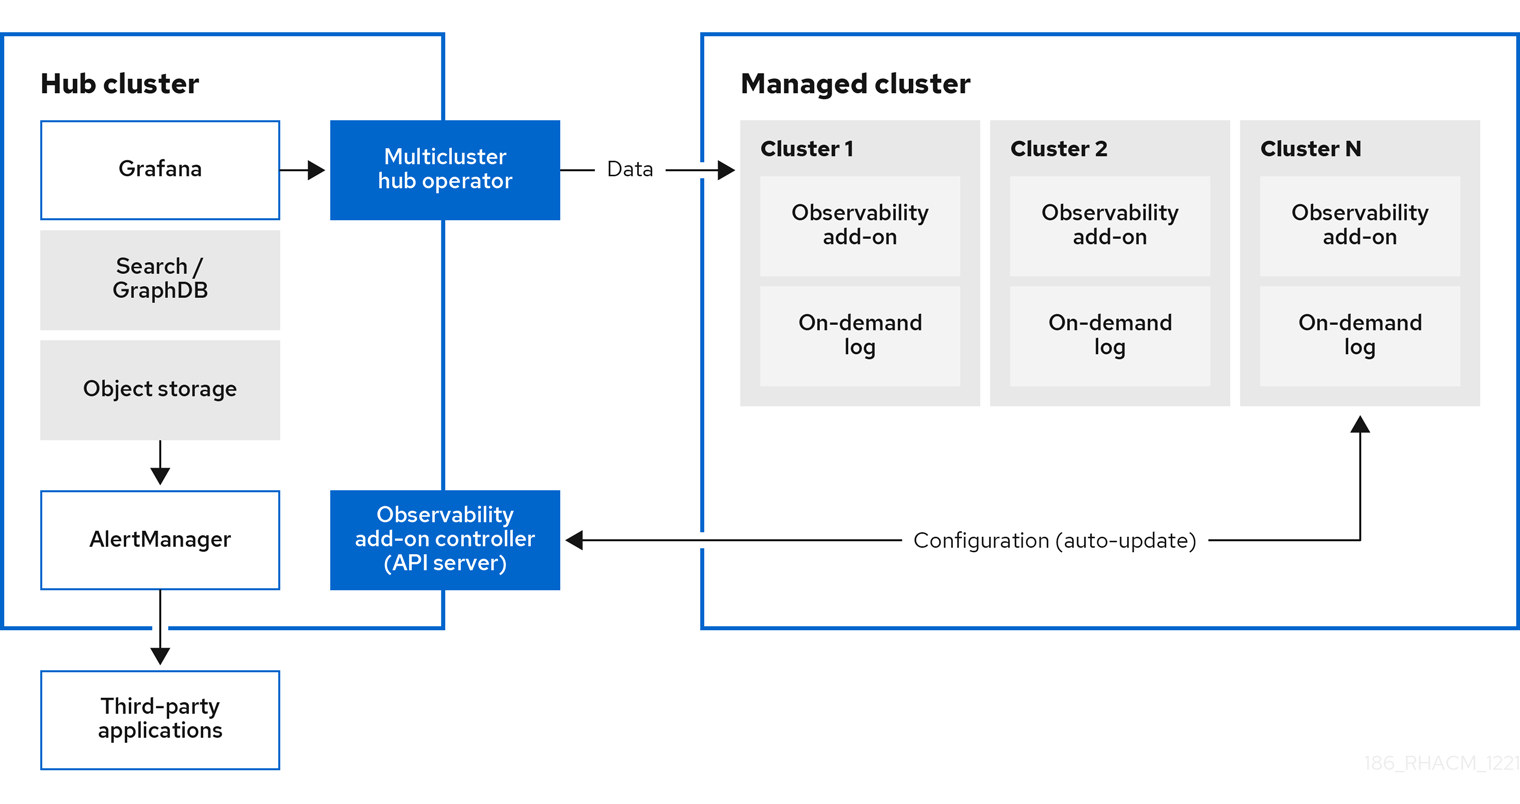
Note: The on-demand log provides access for engineers to get logs for a given pod in real-time. Logs from the hub cluster are not aggregated. These logs can be accessed with the search service and other parts of the console.
1.1.1. Observability service
By default, observability is included with the product installation, but not enabled. Due to the requirement for persistent storage, the observability service is not enabled by default. Red Hat Advanced Cluster Management supports the following S3 compatible, stable object stores:
Amazon S3
Note: The object store interface in Thanos support APIs that are AWS S3 restful API compatible, or other S3 compatible object stores like Minio and Ceph.
- Google Cloud Storage
- Azure storage
Red Hat OpenShift Data Foundation
Important: When you configure your object store, ensure that you meet the encryption requirements necessary when sensitive data is persisted. For a complete list of the supported object stores, see Thanos documentation.
When the service is enabled, the observability-endpoint-operator is automatically deployed to each imported or created cluster. This controller collects the data from Red Hat OpenShift Container Platform Prometheus, then sends it to the Red Hat Advanced Cluster Management hub cluster.
If the hub cluster imports itself as the local-cluster, observability is also enabled on it and metrics are collected from the hub cluster.
The observability service deploys an instance of Prometheus AlertManager, which enables alerts to be forwarded with third-party applications. It also includes an instance of Grafana to enable data visualization with dashboards (static) or data exploration. Red Hat Advanced Cluster Management supports version 8.1.3 of Grafana. You can also design your Grafana dashboard. For more information, see Designing your Grafana dashboard.
You can customize the observability service by creating custom recording rules or alerting rules.
For more information about enabling observability, see Enable observability service.
1.1.2. Metric types
By default, OpenShift Container Platform sends metrics to Red Hat using the Telemetry service. The acm_managed_cluster_info is available with Red Hat Advanced Cluster Management and is included with telemetry, but is not displayed on the Red Hat Advanced Cluster Management Observe environments overview dashboard.
View the following table of metric types that are supported by the framework:
| Metric name | Metric type | Labels/tags | Status |
|---|---|---|---|
|
| Gauge |
| Stable |
|
| Gauge |
| Stable. See Governance metric for more details. |
|
| Gauge |
| Stable. See Managing insight PolicyReports for more details. |
|
| Histogram | None. | Stable. See Governance metric for more details. |
|
| Histogram | None. | Stable. See Governance metric for more details. |
|
| Histogram | None. | Stable. See Governance metric for more details. |
Learn from the OpenShift Container Platform documentation what types of metrics are collected and sent using telemetry. See Information collected by Telemetry for information.
1.1.3. Observability pod capacity requests
Observability components require 2701mCPU and 11972Mi memory to install the observability service. The following table is a list of the pod capacity requests for five managed clusters with observability-addons enabled:
| Deployment or StatefulSet | Container name | CPU (mCPU) | Memory (Mi) | Replicas | Pod total CPU | Pod total memory |
|---|---|---|---|---|---|---|
| observability-alertmanager | alertmanager | 4 | 200 | 3 | 12 | 600 |
| config-reloader | 4 | 25 | 3 | 12 | 75 | |
| alertmanager-proxy | 1 | 20 | 3 | 3 | 60 | |
| observability-grafana | grafana | 4 | 100 | 2 | 8 | 200 |
| grafana-dashboard-loader | 4 | 50 | 2 | 8 | 100 | |
| observability-observatorium-api | observatorium-api | 20 | 128 | 2 | 40 | 256 |
| observability-observatorium-operator | observatorium-operator | 100 | 100 | 1 | 10 | 50 |
| observability-rbac-query-proxy | rbac-query-proxy | 20 | 100 | 2 | 40 | 200 |
| oauth-proxy | 1 | 20 | 2 | 2 | 40 | |
| observability-thanos-compact | thanos-compact | 100 | 512 | 1 | 100 | 512 |
| observability-thanos-query | thanos-query | 300 | 1024 | 2 | 600 | 2048 |
| observability-thanos-query-frontend | thanos-query-frontend | 100 | 256 | 2 | 200 | 512 |
| observability-thanos-query-frontend-memcached | memcached | 45 | 128 | 3 | 135 | 384 |
| exporter | 5 | 50 | 3 | 15 | 150 | |
| observability-thanos-receive-controller | thanos-receive-controller | 4 | 32 | 1 | 4 | 32 |
| observability-thanos-receive-default | thanos-receive | 300 | 512 | 3 | 900 | 1536 |
| observability-thanos-rule | thanos-rule | 50 | 512 | 3 | 150 | 1536 |
| configmap-reloader | 4 | 25 | 3 | 12 | 75 | |
| observability-thanos-store-memcached | memcached | 45 | 128 | 3 | 135 | 384 |
| exporter | 5 | 50 | 3 | 15 | 150 | |
| observability-thanos-store-shard | thanos-store | 100 | 1024 | 3 | 300 | 3072 |
1.1.4. Persistent stores used in the observability service
When you install Red Hat Advanced Cluster Management the following persistent volumes (PV) must be created so that Persistent Volume Claims (PVC) can attach to it automatically. As a reminder, you must define a storage class in the MultiClusterObservability CR when there is no default storage class specified or you want to use a non-default storage class to host the PVs. It is recommended to use Block Storage, similare to what Prometheus uses. Also each replica of alertmanager, thanos-compactor, thanos-ruler, thanos-receive-default and thanos-store-shard must have its own PV. View the following table:
| Persistent volume name | Purpose |
| alertmanager |
Alertmanager stores the |
| thanos-compact | The compactor needs local disk space to store intermediate data for its processing, as well as bucket state cache. The required space depends on the size of the underlying blocks. The compactor must have enough space to download all of the source blocks, then build the compacted blocks on the disk. On-disk data is safe to delete between restarts and should be the first attempt to get crash-looping compactors unstuck. However, it is recommended to give the compactor persistent disks in order to effectively use bucket state cache in between restarts. |
| thanos-rule |
The thanos ruler evaluates Prometheus recording and alerting rules against a chosen query API by issuing queries at a fixed interval. Rule results are written back to the disk in the Prometheus 2.0 storage format. The amount of hours or days of data retained in this stateful set was fixed in the API version |
| thanos-receive-default |
Thanos receiver accepts incoming data (Prometheus remote-write requests) and writes these into a local instance of the Prometheus TSDB. Periodically (every 2 hours), TSDB blocks are uploaded to the object storage for long term storage and compaction. The amount of hours or days of data retained in this stateful set, which acts a local cache was fixed in API Version |
| thanos-store-shard | It acts primarily as an API gateway and therefore does not need significant amounts of local disk space. It joins a Thanos cluster on startup and advertises the data it can access. It keeps a small amount of information about all remote blocks on local disk and keeps it in sync with the bucket. This data is generally safe to delete across restarts at the cost of increased startup times. |
Note: The time series historical data is stored in object stores. Thanos uses object storage as the primary storage for metrics and meta data related to them. For more details about the object storage and downsampling, see Enable observability service
1.1.5. Support
Red Hat Advanced Cluster Management is tested with and fully supported by Red Hat OpenShift Data Foundation (formerly Red Hat OpenShift Container Storage).
Red Hat Advanced Cluster Management supports the function of the multicluster observability operator on user-provided third-party object storage that is S3 API compatible.
Red Hat Advanced Cluster Management use commercial, reasonable efforts to assist in the identification of the root cause.
If a support ticket is raised and the root cause has been determined to be a result of the customer-provided S3 compatible object storage, then the issue must be resolved using the customer support channels.
Red Hat Advanced Cluster Management does not commit to fix support tickets raised by customers, where the root cause identified is the S3 compatible object storage provider.
See Customizing observability to learn how to configure the observability service, view metrics and other data.
1.2. Enable observability service
Monitor the health of your managed clusters with the observability service (multicluster-observability-operator).
Required access: Cluster administrator, the open-cluster-management:cluster-manager-admin role, or S3 administrator.
1.2.1. Prerequisites
- You must install Red Hat Advanced Cluster Management for Kubernetes. See Installing while connected online for more information.
-
You must define a storage class in the
MultiClusterObservabilityCR, if there is no default storage class specified. - Direct network access to the hub cluster is required. Network access to load balancers and proxies are not supported. For more information, see Networking.
You must configure an object store to create a storage solution. Red Hat Advanced Cluster Management supports the following cloud providers with stable object stores:
- Amazon Web Services S3 (AWS S3)
- Red Hat Ceph (S3 compatible API)
- Google Cloud Storage
- Azure storage
- Red Hat OpenShift Data Foundation (formerly known as Red Hat OpenShift Container Storage)
Red Hat OpenShift on IBM (ROKS)
Important: When you configure your object store, ensure that you meet the encryption requirements necessary when sensitive data is persisted. For more information on Thanos supported object stores, see Thanos documentation.
1.2.2. Enabling observability
Enable the observability service by creating a MultiClusterObservability custom resource (CR) instance. Before you enable observability, see Observability pod capacity requests for more information.
Note: When observability is enabled or disabled on OpenShift Container Platform managed clusters that are managed by Red Hat Advanced Cluster Management, the observability endpoint operator updates the cluster-monitoring-config ConfigMap by adding additional alertmanager configuration that restarts the local Prometheus automatically.
Complete the following steps to enable the observability service:
- Log in to your Red Hat Advanced Cluster Management hub cluster.
Create a namespace for the observability service with the following command:
oc create namespace open-cluster-management-observabilityGenerate your pull-secret. If Red Hat Advanced Cluster Management is installed in the
open-cluster-managementnamespace, run the following command:DOCKER_CONFIG_JSON=`oc extract secret/multiclusterhub-operator-pull-secret -n open-cluster-management --to=-`If the
multiclusterhub-operator-pull-secretis not defined in the namespace, copy thepull-secretfrom theopenshift-confignamespace into theopen-cluster-management-observabilitynamespace. Run the following command:DOCKER_CONFIG_JSON=`oc extract secret/pull-secret -n openshift-config --to=-`Then, create the pull-secret in the
open-cluster-management-observabilitynamespace, run the following command:oc create secret generic multiclusterhub-operator-pull-secret \ -n open-cluster-management-observability \ --from-literal=.dockerconfigjson="$DOCKER_CONFIG_JSON" \ --type=kubernetes.io/dockerconfigjsonImportant: If you modify the global pull secret for your cluster by using the OpenShift Container Platform documentation, be sure to also update the global pull secret in the observability namespace. See Updating the global pull secret for more details.
Create a secret for your object storage for your cloud provider. Your secret must contain the credentials to your storage solution. For example, run the following command:
oc create -f thanos-object-storage.yaml -n open-cluster-management-observabilityView the following examples of secrets for the supported object stores:
For Amazon S3 or S3 compatible, your secret might resemble the following file:
apiVersion: v1
kind: Secret
metadata:
  name: thanos-object-storage
  namespace: open-cluster-management-observability
type: Opaque
stringData:
  thanos.yaml: |
    type: s3
    config:
      bucket: YOUR_S3_BUCKET
      endpoint: YOUR_S3_ENDPOINT
      insecure: true
      access_key: YOUR_ACCESS_KEY
      secret_key: YOUR_SECRET_KEY
For more details, see Amazon Simple Storage Service user guide.
For Google, your secret might resemble the following file:
apiVersion: v1
kind: Secret
metadata:
  name: thanos-object-storage
  namespace: open-cluster-management-observability
type: Opaque
stringData:
  thanos.yaml: |
    type: GCS
    config:
      bucket: YOUR_GCS_BUCKET
      service_account: YOUR_SERVICE_ACCOUNT
For more details, see Google Cloud Storage.
For Azure your secret might resemble the following file:
apiVersion: v1
kind: Secret
metadata:
  name: thanos-object-storage
  namespace: open-cluster-management-observability
type: Opaque
stringData:
  thanos.yaml: |
    type: AZURE
    config:
      storage_account: YOUR_STORAGE_ACCT
      storage_account_key: YOUR_STORAGE_KEY
      container: YOUR_CONTAINER
      endpoint: blob.core.windows.net
      max_retries: 0
For more details, see Azure Storage documentation.
Note: If you use Azure as an object storage for a Red Hat OpenShift Container Platform cluster, the storage account associated with the cluster is not supported. You must create a new storage account.
For Red Hat OpenShift Data Foundation, your secret might resemble the following file:
apiVersion: v1
kind: Secret
metadata:
  name: thanos-object-storage
  namespace: open-cluster-management-observability
type: Opaque
stringData:
  thanos.yaml: |
    type: s3
    config:
      bucket: YOUR_RH_DATA_FOUNDATION_BUCKET
      endpoint: YOUR_RH_DATA_FOUNDATION_ENDPOINT
      insecure: false
      access_key: YOUR_RH_DATA_FOUNDATION_ACCESS_KEY
      secret_key: YOUR_RH_DATA_FOUNDATION_SECRET_KEY
For more details, see Red Hat OpenShift Data Foundation. For Red Hat OpenShift on IBM (ROKS), your secret might resemble the following file:
apiVersion: v1
kind: Secret
metadata:
  name: thanos-object-storage
  namespace: open-cluster-management-observability
type: Opaque
stringData:
  thanos.yaml: |
    type: s3
    config:
      bucket: YOUR_ROKS_S3_BUCKET
      endpoint: YOUR_ROKS_S3_ENDPOINT
      insecure: true
      access_key: YOUR_ROKS_ACCESS_KEY
      secret_key: YOUR_ROKS_SECRET_KEY
For more details, follow the IBM Cloud documentation, Cloud Object Storage. Be sure to use the service credentials to connect with the object storage. For more details, follow the IBM Cloud documentation, Cloud Object Store and Service Credentials.
For Amazon S3 or S3 compatible storage, you can also use short term, limited-privilege credentials generated with AWS Security Token Service (AWS STS). Refer to AWS Security Token Service documentation for more details.
Generating access keys using AWS Security Service require the following additional steps:
- Create an IAM policy that limits access to an S3 bucket
- Create an IAM role with a trust policy to generate JWT tokens for OpenShift Container Platform service accounts
- Specify annotations for the observability service accounts that requires access to the S3 bucket. You can find an example of how observability on Red Hat OpenShift Service on AWS (ROSA) cluster can be configured to work with AWS STS tokens in the Set environment step. See Red Hat OpenShift Service on AWS (ROSA) for more details, along with ROSA with STS explained for an in-depth description of the requirements and setup to use STS tokens.
Complete the following steps to generate access keys using the AWS Security Service:
Set up the AWS environment. Run the following commands:
export POLICY_VERSION=$(date +"%m-%d-%y")
export TRUST_POLICY_VERSION=$(date +"%m-%d-%y")
export CLUSTER_NAME=<my-cluster>
export S3_BUCKET=$CLUSTER_NAME-acm-observability
export REGION=us-east-2
export NAMESPACE=open-cluster-management-observability
export SA=tbd
export SCRATCH_DIR=/tmp/scratch
export OIDC_PROVIDER=$(oc get authentication.config.openshift.io cluster -o json | jq -r .spec.serviceAccountIssuer| sed -e "s/^https:\/\///")
export AWS_ACCOUNT_ID=$(aws sts get-caller-identity --query Account --output text)
export AWS_PAGER=""
rm -rf $SCRATCH_DIR
mkdir -p $SCRATCH_DIR
Create an S3 bucket with the following command:
aws s3 mb s3://$S3_BUCKETCreate a
s3-policyJSON file for access to your S3 bucket. Run the following command:{ "Version": "$POLICY_VERSION", "Statement": [ { "Sid": "Statement", "Effect": "Allow", "Action": [ "s3:ListBucket", "s3:GetObject", "s3:DeleteObject", "s3:PutObject", "s3:PutObjectAcl", "s3:CreateBucket", "s3:DeleteBucket" ], "Resource": [ "arn:aws:s3:::$S3_BUCKET/*", "arn:aws:s3:::$S3_BUCKET" ] } ] }Apply the policy with the following command:
S3_POLICY=$(aws iam create-policy --policy-name $CLUSTER_NAME-acm-obs \
--policy-document file://$SCRATCH_DIR/s3-policy.json \
--query 'Policy.Arn' --output text)
echo $S3_POLICY
Create a
TrustPolicyJSON file. Run the following command:{ "Version": "$TRUST_POLICY_VERSION", "Statement": [ { "Effect": "Allow", "Principal": { "Federated": "arn:aws:iam::${AWS_ACCOUNT_ID}:oidc-provider/${OIDC_PROVIDER}" }, "Action": "sts:AssumeRoleWithWebIdentity", "Condition": { "StringEquals": { "${OIDC_PROVIDER}:sub": [ "system:serviceaccount:${NAMESPACE}:observability-thanos-query", "system:serviceaccount:${NAMESPACE}:observability-thanos-store-shard", "system:serviceaccount:${NAMESPACE}:observability-thanos-compact" "system:serviceaccount:${NAMESPACE}:observability-thanos-rule", "system:serviceaccount:${NAMESPACE}:observability-thanos-receive", ] } } } ] }Create a role for AWS Prometheus and CloudWatch with the following command:
S3_ROLE=$(aws iam create-role \
  --role-name "$CLUSTER_NAME-acm-obs-s3" \
  --assume-role-policy-document file://$SCRATCH_DIR/TrustPolicy.json \
  --query "Role.Arn" --output text)
echo $S3_ROLE
Attach the policies to the role. Run the following command:
aws iam attach-role-policy \
  --role-name "$CLUSTER_NAME-acm-obs-s3" \
  --policy-arn $S3_POLICY
Your secret might resemble the following file. The
configsection specifiessignature_version2: falseand does not specifyaccess_keyandsecret_key:apiVersion: v1 kind: Secret metadata: name: thanos-object-storage namespace: open-cluster-management-observability type: Opaque stringData: thanos.yaml: | type: s3 config: bucket: $S3_BUCKET endpoint: s3.$REGION.amazonaws.com signature_version2: false-
Specify service account annotations when you the
MultiClusterObservabilitycustom resource (CR) as described in Creating the MultiClusterObservability CR section. You can retrieve the S3 access key and secret key for your cloud providers with the following commands. You must decode, edit, and encode your
base64string in the secret:YOUR_CLOUD_PROVIDER_ACCESS_KEY=$(oc -n open-cluster-management-observability get secret <object-storage-secret> -o jsonpath="{.data.thanos\.yaml}" | base64 --decode | grep access_key | awk '{print $2}') echo $ACCESS_KEY YOUR_CLOUD_PROVIDER_SECRET_KEY=$(oc -n open-cluster-management-observability get secret <object-storage-secret> -o jsonpath="{.data.thanos\.yaml}" | base64 --decode | grep secret_key | awk '{print $2}') echo $SECRET_KEYYou must decode, edit, and encode your
base64string in the secret.Verify that observability is enabled by checking the pods for the following deployments and stateful sets. You might receive the following information:
observability-thanos-query (deployment)
observability-thanos-compact (statefulset)
observability-thanos-receive-default  (statefulset)
observability-thanos-rule   (statefulset)
observability-thanos-store-shard-x  (statefulsets)
1.2.2.1. Creating the MultiClusterObservability custom resource
Complete the following steps to create the MultiClusterObservability custom resource for your hub cluster:
Create the
MultiClusterObservabilitycustom resource YAML file namedmulticlusterobservability_cr.yaml.View the following default YAML file for observability:
apiVersion: observability.open-cluster-management.io/v1beta2
kind: MultiClusterObservability
metadata:
  name: observability
spec:
  observabilityAddonSpec: {}
  storageConfig:
    metricObjectStorage:
      name: thanos-object-storage
      key: thanos.yaml
You might want to modify the value for the
retentionConfigparameter in theadvancedsection. For more information, see Thanos Downsampling resolution and retention. Depending on the number of managed clusters, you might want to update the amount of storage for stateful sets. If your S3 bucket is configured to use STS tokens, annotate the service accounts to use STS with S3 role. View the following configuration:spec: advanced: compact: eks.amazonaws.com/role-arn=$S3_ROLE store: eks.amazonaws.com/role-arn=$S3_ROLE rule: eks.amazonaws.com/role-arn=$S3_ROLE receive: eks.amazonaws.com/role-arn=$S3_ROLE query: eks.amazonaws.com/role-arn=$S3_ROLESee Observability API for more information.
To deploy on infrastructure machine sets, you must set a label for your set by updating the
nodeSelectorin theMultiClusterObservabilityYAML. Your YAML might resemble the following content:nodeSelector: node-role.kubernetes.io/infra:For more information, see Creating infrastructure machine sets.
Apply the observability YAML to your cluster by running the following command:
oc apply -f multiclusterobservability_cr.yamlAll the pods in
open-cluster-management-observabilitynamespace for Thanos, Grafana and AlertManager are created. All the managed clusters connected to the Red Hat Advanced Cluster Management hub cluster are enabled to send metrics back to the Red Hat Advanced Cluster Management Observability service.Validate that the observability service is enabled and the data is populated by launching the Grafana dashboards. Click the Grafana link that is near the console header, from either the console Overview page or the Clusters page.
Note: If you want to exclude specific managed clusters from collecting the observability data, add the following cluster label to your clusters:
observability: disabled.
The observability service is enabled. After you enable the observability service, the following functions are initiated:
- All the alert managers from the managed clusters are forwarded to the Red Hat Advanced Cluster Management hub cluster.
All the managed clusters that are connected to the Red Hat Advanced Cluster Management hub cluster are enabled to send alerts back to the Red Hat Advanced Cluster Management observability service. You can configure the Red Hat Advanced Cluster Management Alertmanager to take care of deduplicating, grouping, and routing the alerts to the correct receiver integration such as email, PagerDuty, or OpsGenie. You can also handle silencing and inhibition of the alerts.
Note: Alert forwarding to the Red Hat Advanced Cluster Management hub cluster feature is only supported by managed clusters with Red Hat OpenShift Container Platform version 4.8 or later. After you install Red Hat Advanced Cluster Management with observability enabled, alerts from OpenShift Container Platform v4.8 and later are automatically forwarded to the hub cluster. See Forwarding alerts to learn more.
-
Access the OpenShift Container Platform 3.11 Grafana dashboards with the following URL:
https://$ACM_URL/grafana/dashboards. Select the folder named OCP 3.11 to view the OpenShift Container Platform 3.11 dashboards.
1.2.3. Enabling observability from the Red Hat OpenShift Container Platform console
Optionally, you can enable observability from the Red Hat OpenShift Container Platform console, create a project named open-cluster-management-observability. Be sure to create an image pull-secret named, multiclusterhub-operator-pull-secret in the open-cluster-management-observability project.
Create your object storage secret named, thanos-object-storage in the open-cluster-management-observability project. Enter the object storage secret details, then click Create. See step four of the Enabling observability section to view an example of a secret.
Create the MultiClusterObservability CR instance. When you receive the following message, the obseravbility service is enabled successfully from OpenShift Container Platform: Observability components are deployed and running.
1.2.3.1. Using the external metric query
Observability provides an external API for metrics to be queried through the OpenShift route, rbac-query-proxy. View the following tasks to use rbac-query-proxy route:
You can get the details of the route with the following command:
oc get route rbac-query-proxy -n open-cluster-management-observability-
To access the
rbac-query-proxyroute, you must have an OpenShift OAuth access token. The token should be associated with a user or service account, which has permission to get namespaces. For more information, see Managing user-owned OAuth access tokens. Get the default CA certificate and store the content of the key
tls.crtin a local file. Run the following command:oc -n openshift-ingress get secret router-certs-default -o jsonpath="{.data.tls\.crt}" | base64 -d > ca.crtRun the following command to query metrics:
curl --cacert ./ca.crt -H "Authorization: Bearer {TOKEN}" https://{PROXY_ROUTE_URL}/api/v1/query?query={QUERY_EXPRESSION}Note: The
QUERY_EXPRESSIONis the standard Prometheus query expression. For example, query the metricscluster_infrastructure_providerby replacing the URL in the previously mentioned command, with the following URL:https://{PROXY_ROUTE_URL}/api/v1/query?query=cluster_infrastructure_provider. For more details, see Querying prometheus.You can also replace certificates for the
rbac-query-proxyroute. See OpenSSL commands for generating a certificate to create certificates. When you customize thecsr.cnf, update theDNS.1to the hostname for therbac-query-proxyroute.Run the following command to create
proxy-byo-caandproxy-byo-certsecrets using the generated certificates:oc -n open-cluster-management-observability create secret tls proxy-byo-ca --cert ./ca.crt --key ./ca.key oc -n open-cluster-management-observability create secret tls proxy-byo-cert --cert ./ingress.crt --key ./ingress.key
1.2.3.2. Dynamic metrics for single-node OpenShift clusters
Dynamic metrics collection supports automatic metric collection based on certain conditions. By default, a SNO cluster does not collect pod and container resource metrics. Once a SNO cluster reaches a specific level of resource consumption, the defined granular metrics are collected dynamically. When the cluster resource consumption is consistently less than the threshold for a period of time, granular metric collection stops.
The metrics are collected dynamically based on the conditions on the managed cluster specified by a collection rule. Because these metrics are collected dynamically, the following Red Hat Advanced Cluster Management Grafana dashboards do not display any data. When a collection rule is activated and the corresponding metrics are collected, the following panels display data for the duration of the time that the collection rule is initiated:
- Kubernetes/Compute Resources/Namespace (Pods)
- Kubernetes/Compute Resources/Namespace (Workloads)
- Kubernetes/Compute Resources/Nodes (Pods)
- Kubernetes/Compute Resources/Pod
- Kubernetes/Compute Resources/Workload
A collection rule includes the following conditions:
- A set of metrics to collect dynamically.
- Conditions written as a PromQL expression.
-
A time interval for the collection, which must be set to
true. - A match expression to select clusters where the collect rule must be evaluated.
By default, collection rules are evaluated continuously on managed clusters every 30 seconds, or at a specific time interval. The lowest value between the collection interval and time interval takes precedence. Once the collection rule condition persists for the duration specified by the for attribute, the collection rule starts and the metrics specified by the rule are automatically collected on the managed cluster. Metrics collection stops automatically after the collection rule condition no longer exists on the managed cluster, at least 15 minutes after it starts.
The collection rules are grouped together as a parameter section named collect_rules, where it can be enabled or disabled as a group. Red Hat Advanced Cluster Management installation includes the collection rule group, SNOResourceUsage with two default collection rules: HighCPUUsage and HighMemoryUsage. The HighCPUUsage collection rule begins when the node CPU usage exceeds 70%. The HighMemoryUsage collection rule begins if the overall memory utilization of the SNO cluster exceeds 70% of the available node memory. Currently, the previously mentioned thresholds are fixed and cannot be changed. When a collection rule begins for more than the interval specified by the for attribute, the system automatically starts collecting the metrics that are specified in the dynamic_metrics section.
View the list of dynamic metrics that from the collect_rules section, in the following YAML file:
collect_rules:
  - group: SNOResourceUsage
    annotations:
      description: >
        By default, a SNO cluster does not collect pod and container resource metrics. Once a SNO cluster
        reaches a level of resource consumption, these granular metrics are collected dynamically.
        When the cluster resource consumption is consistently less than the threshold for a period of time,
        collection of the granular metrics stops.
    selector:
      matchExpressions:
        - key: clusterType
          operator: In
          values: ["SNO"]
    rules:
    - collect: SNOHighCPUUsage
      annotations:
        description: >
          Collects the dynamic metrics specified if the cluster cpu usage is constantly more than 70% for 2 minutes
      expr: (1 - avg(rate(node_cpu_seconds_total{mode=\"idle\"}[5m]))) * 100 > 70
      for: 2m
      dynamic_metrics:
        names:
          - container_cpu_cfs_periods_total
          - container_cpu_cfs_throttled_periods_total
          - kube_pod_container_resource_limits
          - kube_pod_container_resource_requests
          - namespace_workload_pod:kube_pod_owner:relabel
          - node_namespace_pod_container:container_cpu_usage_seconds_total:sum_irate
          - node_namespace_pod_container:container_cpu_usage_seconds_total:sum_rate
    - collect: SNOHighMemoryUsage
      annotations:
        description: >
          Collects the dynamic metrics specified if the cluster memory usage is constantly more than 70% for 2 minutes
      expr: (1 - sum(:node_memory_MemAvailable_bytes:sum) / sum(kube_node_status_allocatable{resource=\"memory\"})) * 100 > 70
      for: 2m
      dynamic_metrics:
        names:
          - kube_pod_container_resource_limits
          - kube_pod_container_resource_requests
          - namespace_workload_pod:kube_pod_owner:relabel
        matches:
          - __name__="container_memory_cache",container!=""
          - __name__="container_memory_rss",container!=""
          - __name__="container_memory_swap",container!=""
          - __name__="container_memory_working_set_bytes",container!=""
A collect_rules.group can be disabled in the custom-allowlist as shown in the following example. When a collect_rules.group is disabled, metrics collection reverts to the previous behavior. These metrics are collected at regularly, specified intervals:
collect_rules:
  - group: -SNOResourceUsage
The data is only displayed in Grafana when the rule is initiated.
1.2.4. Disabling observability
To disable the observability service, uninstall the observability resource. From the OpenShift Container Platform console navigation, select Operators > Installed Operators > Advanced Cluster Manager for Kubernetes. Remove the MultiClusterObservability custom resource.
To learn more about customizing the observability service, see Customizing observability.
1.3. Search in the console
For Red Hat Advanced Cluster Management for Kubernetes, search provides visibility into your Kubernetes resources across all of your clusters. Search indexes the Kubernetes resources and the relationships to other resources. You can create a searchcustomization custom resource to define the storage settings for search persistence if you want to change the storage class and storage size.
1.3.1. Search components
The search architecture is composed of the following components:
-
Collector: Watches the Kubernetes resources and creates an index. The
search-collectorcomputes relationships for resources within the managed cluster. -
Aggregator: Receives data from the collector and writes to a database. The
search-aggregatorwatches resources in the hub cluster, computes multicluster relationships, and tracks the activity from connected collectors. - Search API: Provides access to the data in the search index and enforces role-based access control.
Search is enabled by default. Search is also enabled when you provision or manually import a managed cluster. If you want to disable search on your managed cluster, see Modifying the klusterlet add-ons settings of your cluster for more information.
1.3.2. Search customization
When you install Red Hat Advanced Cluster Management, the product is configured to persist the data in-memory to a file system. The StatefulSet search-redisgraph deploys the Redisgraph pod, which mounts the persistent volume named persist. If your cluster has a defined default storage class, the search component creates a Persistent Volume Claim (PVC) of 10Gi on the default storage class. If a default storage class does not exist in your cluster, search saves the index in an empty directory (emptyDir).
You can customize the storage settings for search by creating the searchcustomization custom resource. Search customization is namespace-scoped and located where search is installed in the hub cluster. View the following example of the search customization custom resource:
apiVersion: search.open-cluster-management.io/v1alpha1
kind: SearchCustomization
metadata:
  name: searchcustomization
  namespace: open-cluster-management
  labels:
    cluster.open-cluster-management.io/backup: ""
spec:
  persistence: true
  storageClass: gp2
  storageSize: 12Gi
Run the following command to view search customization custom resource definition:
oc get crd searchcustomizations.search.open-cluster-management.io -o yaml
You can disable persistence by updating the persistence flag to false in the customization custom resource, which turns off saving search index to the file system. A status for persistence can be retrieved from the search operator (searchoperator) custom resource. Run the following command to view search operator custom resource: oc get searchoperator searchoperator -o yaml.
1.3.2.1. Options to increase the redisgraph memory
Redisgraph is an in-memory database that needs linear growth of memory as the number of objects are cached. A Red Hat Advanced Cluster Management cluster with many managed clusters, or with a large number of Kubernetes objects require limit memory updates for the redisgraph pod (search-redisgraph-0).
By default, the redisgraph pod (search-redisgraph-0) is deployed with a memory limit of 4Gi. If you are managing larger clusters, you might need to increase this limit by editing the redisgraph_resource.limit_memory for the searchoperator in the hub cluster namespace. For example, you can update the limit to 8Gi with the following command:
oc patch searchoperator searchoperator --type='merge' -p '{"spec":{"redisgraph_resource":{"limit_memory":"8Gi"}}}'
After the change is made, the search-redisgraph pod automatically restarts with the updated configuration.
1.3.2.2. Updating saved search limit
By default, there is a limit of ten saved searches for each user. Only a user with the administrator role can update the limit by adding the following key value to the console-config ConfigMap, key:value: SAVED_SEARCH_LIMIT: x.
1.3.3. Querying in the console
You can type any text value in the Search box and results include anything with that value from any property, such as a name or namespace. Users are unable to search for values that contain an empty space.
For more specific search results, include the property selector in your search. You can combine related values for the property, for a more precise scope of your search. For example, search for cluster:dev red to receive results that match the string "red" in the dev cluster.
View the following steps to make queries with search:
- Click Search in the navigation menu.
Type a word in the Search box, then Search finds your resources that contain that value.
- As you search for resources, you receive other resources that are related to your original search result, which help you visualize how the resources interact with other resources in the system.
- Search returns and lists each cluster with the resource that you search. For resources in the hub cluster, the cluster name is displayed as local-cluster.
-
Your search results are grouped by
kind, and each resourcekindis grouped in a table. - Your search options depend on your cluster objects. You can refine your results with specific labels. Search is case-sensitive when you query labels. See the following examples: name, namespace, status, and other resource fields. Auto-complete provides suggestions to refine your search. See the following example:
-
Search for a single field, such as
kind:podto find all pod resources. Search for multiple fields, such as
kind:pod namespace:defaultto find the pods in the default namespace.Notes:
-
You can also search with conditions by using characters, such as
>, >=, <, <=, !=. When you search for more than one property selector with multiple values, the search returns either of the values that were queried. View the following examples:
-
When you search for
kind:pod name:a, any pod namedais returned. -
When you search for
kind:pod name:a,b, any pod namedaorbare returned. -
Search for
kind:pod status:!Runningto find all pod resources where the status is notRunning. -
Search for
kind:pod restarts:>1to find all pods that restarted at least twice.
-
When you search for
-
You can also search with conditions by using characters, such as
By default, there is a limit of 2500 images in the search drop-down menu. To increase the image limit, you can edit the
search-apideployment by adding thedefaultImageQueryLimitenvironment variable. You can use search to find the deployment. View the following example:name: defaultImageQueryLimit value: x1 - 1
xrepresents the number of images that you want to be displayed from the search drop-down menu.Alternatively, you can patch the deployment by using the following command:
oc patch deployment search-api -n open-cluster-management -p '{"spec": {"template": {"spec": {"containers": [{"name": "search-api","env": [{"name": "defaultImageQueryLimit","value": "X"}]}]}}}}'
- If you want to save your search, click the Save search icon.
1.3.3.1. Querying ArgoCD applications
When you search for an ArgoCD application, you are directed to the Applications page. Complete the following steps to access the ArgoCD application from the Search page:
- Log in to your Red Hat Advanced Cluster Management hub cluster.
- From the console header, select the Search icon.
-
Filter your query with the following values:
kind:applicationandapigroup:argoproj.io - Select an application to view. The Application page displays an overview of information for the application.
1.3.4. Updating klusterlet-addon-search deployments on managed clusters
To collect the Kubernetes objects from the managed clusters, the klusterlet-addon-search pod is run on all the managed clusters where search is enabled. This deployment is run in the open-cluster-management-agent-addon namespace. A managed cluster with a high number of resources might require more memory for the klusterlet-addon-search deployment to function.
Resource requirements for the klusterlet-addon-search pod in a managed cluster can be specified in the ManagedClusterAddon custom resource in your Red Hat Advanced Cluster Management hub cluster. There is a namespace for each managed cluster with the managed cluster name. Edit the ManagedClusterAddon custom resource from the namespace matching the managed cluster name. Run the following command to update the resource requirement in xyz managed cluster:
oc edit managedclusteraddon search-collector -n xyzAppend the resource requirements as annotations. View the following example:
apiVersion: addon.open-cluster-management.io/v1alpha1
kind: ManagedClusterAddOn
metadata:
  annotations: addon.open-cluster-management.io/search_memory_limit: 2048Mi
  addon.open-cluster-management.io/search_memory_request: 512Mi
The annotation overrides the resource requirements on the managed clusters and automatically restarts the pod with new resource requirements.
Learn more about the Red Hat Advanced Cluster Management for Kubernetes console, see Web console.
1.4. Customizing observability
Review the following sections to learn more about customizing, managing, and viewing data that is collected by the observability service.
Collect logs about new information that is created for observability resources with the must-gather command. For more information, see the Must-gather section in the Troubleshooting documentation.
- Creating custom rules
- Configuring AlertManager
- Adding custom metrics
- Removing default metrics
- Adding advanced configuration
- Updating the multiclusterobservability CR replicas from the console
- Forwarding alerts
- Silencing alerts
- Suppressing alerts
- Customizing route certification
- Customizing certificates for accessing the object store
- Disabling observability
1.4.1. Creating custom rules
Create custom rules for the observability installation by adding Prometheus recording rules and alerting rules to the observability resource. For more information, see Prometheus configuration.
- Recording rules provide you the ability to precalculate, or computate expensive expressions as needed. The results are saved as a new set of time series.
- Alerting rules provide you the ability to specify the alert conditions based on how an alert should be sent to an external service.
Define custom rules with Prometheus to create alert conditions, and send notifications to an external messaging service. Note: When you update your custom rules, observability-thanos-rule pods are restarted automatically.
Create a ConfigMap named thanos-ruler-custom-rules in the open-cluster-management-observability namespace. The key must be named, custom_rules.yaml, as shown in the following example. You can create multiple rules in the configuration.
By default, the out-of-the-box alert rules are defined in the
thanos-ruler-default-rulesConfigMap in theopen-cluster-management-observabilitynamespace.For example, you can create a custom alert rule that notifies you when your CPU usage passes your defined value. Your YAML might resemble the following content:
data:
  custom_rules.yaml: |
    groups:
      - name: cluster-health
        rules:
        - alert: ClusterCPUHealth-jb
          annotations:
            summary: Notify when CPU utilization on a cluster is greater than the defined utilization limit
            description: "The cluster has a high CPU usage: {{ $value }} core for {{ $labels.cluster }} {{ $labels.clusterID }}."
          expr: |
            max(cluster:cpu_usage_cores:sum) by (clusterID, cluster, prometheus) > 0
          for: 5s
          labels:
            cluster: "{{ $labels.cluster }}"
            prometheus: "{{ $labels.prometheus }}"
            severity: critical
You can also create a custom recording rule within the
thanos-ruler-custom-rulesConfigMap.For example, you can create a recording rule that provides you the ability to get the sum of the container memory cache of a pod. Your YAML might resemble the following content:
data: custom_rules.yaml: | groups: - name: container-memory recording_rules: - record: pod:container_memory_cache:sum expr: sum(container_memory_cache{pod!=""}) BY (pod, container)Note: If this is the first new custom rule, it is created immediately. For changes to the ConfigMap, the configuration is automatically reloaded. The configuration is reloaded due to the
config-reloadwithin theobservability-thanos-rulersidecar.
To verify that the alert rules are functioning appropriately, launch the Grafana dashboard, navigate to the Explore page, and query ALERTS. The alert is only available in Grafana if the alert is initiated.
1.4.2. Configuring AlertManager
Integrate external messaging tools such as email, Slack, and PagerDuty to receive notifications from AlertManager. You must override the alertmanager-config secret in the open-cluster-management-observability namespace to add integrations, and configure routes for AlertManager. Complete the following steps to update the custom receiver rules:
Extract the data from the
alertmanager-configsecret. Run the following command:oc -n open-cluster-management-observability get secret alertmanager-config --template='{{ index .data "alertmanager.yaml" }}' |base64 -d > alertmanager.yamlEdit and save the
alertmanager.yamlfile configuration by running the following command:oc -n open-cluster-management-observability create secret generic alertmanager-config --from-file=alertmanager.yaml --dry-run -o=yaml | oc -n open-cluster-management-observability replace secret --filename=-Your updated secret might resemble the following content:
global
  smtp_smarthost: 'localhost:25'
  smtp_from: 'alertmanager@example.org'
  smtp_auth_username: 'alertmanager'
  smtp_auth_password: 'password'
templates:
- '/etc/alertmanager/template/*.tmpl'
route:
  group_by: ['alertname', 'cluster', 'service']
  group_wait: 30s
  group_interval: 5m
  repeat_interval: 3h
  receiver: team-X-mails
  routes:
  - match_re:
      service: ^(foo1|foo2|baz)$
    receiver: team-X-mails
Your changes are applied immediately after it is modified. For an example of AlertManager, see prometheus/alertmanager.
1.4.3. Adding custom metrics
Add metrics to the metrics_list.yaml file, to be collected from managed clusters.
Before you add a custom metric, verify that mco observability is enabled with the following command: oc get mco observability -o yaml. Check for the following message in the status.conditions.message reads: Observability components are deployed and running.
Create a file named observability-metrics-custom-allowlist.yaml and add the name of the custom metric to the metrics_list.yaml parameter. Your YAML for the ConfigMap might resemble the following content:
kind: ConfigMap
apiVersion: v1
metadata:
  name: observability-metrics-custom-allowlist
data:
  metrics_list.yaml: |
    names:
      - node_memory_MemTotal_bytes
    rules:
    - record: apiserver_request_duration_seconds:histogram_quantile_90
      expr: histogram_quantile(0.90,sum(rate(apiserver_request_duration_seconds_bucket{job=\"apiserver\",
verb!=\"WATCH\"}[5m])) by (verb,le))-
In the
namessection, add the name of the custom metrics that is to be collected from the managed cluster. -
In the
rulessection, enter only one value for theexprandrecordparameter pair to define the query expression. The metrics are collected as the name that is defined in therecordparameter from your managed cluster. The metric value returned are the results after you run the query expression. -
The
namesandrulessections are optional. You can use either one or both of the sections.
Create the observability-metrics-custom-allowlist ConfigMap in the open-cluster-management-observability namespace with the following command: oc apply -n open-cluster-management-observability -f observability-metrics-custom-allowlist.yaml.
Verify that data from your custom metric is being collected by querying the metric from the Explore page, from the Grafana dashboard. You can also use the custom metrics in your own dashboard. For more information about viewing the dashboard, see Designing your Grafana dashboard.
1.4.4. Removing default metrics
If you want data to not be collected in your managed cluster for a specific metric, remove the metric from the observability-metrics-custom-allowlist.yaml file. When you remove a metric, the metric data is not collected in your managed clusters. As mentioned previously, first verify that mco observability is enabled.
Add the name of the default metric to the metrics_list.yaml parameter with a hyphen - at the start of the metric name. For example, -cluster_infrastructure_provider.
Create the observability-metrics-custom-allowlist ConfigMap in the open-cluster-management-observability namespace with the following command: oc apply -n open-cluster-management-observability -f observability-metrics-custom-allowlist.yaml.
Verify that the specific metric is not being collected from your managed clusters. When you query the metric from the Grafana dashboard, the metric is not displayed.
1.4.5. Exporting metrics to external endpoints
You can customize observability to export the metrics to external endpoints, which support Prometheus Remote Write protocol in real time. For more information, see Prometheus Remote Write protocol.
1.4.5.1. Creating the Kubernetes secret for an external endpoint
You must create a Kubernetes secret with the access information of the external endpoint in the open-cluster-management-observability namespace. View the following example secret:
apiVersion: v1
kind: Secret
metadata:
  name: victoriametrics
  namespace: open-cluster-management-observability
type: Opaque
stringData:
  ep.yaml: |
    url: http://victoriametrics:8428/api/v1/write
    http_client_config:
      basic_auth:
        username: test
        password: test
The ep.yaml is the key of the content and is used in the multiclusterobservability CR in next step. Currently, observability supports exporting metrics to endpoints without any security checks, with basic authentication or with tls enablement. View the following tables for a full list of supported parameters:
| Name | Description | Schema |
|---|---|---|
|
url | URL for the external endpoint. | string |
|
http_client_config | Advanced configuration for the HTTP client. |
HttpClientConfig
| Name | Description | Schema |
|---|---|---|
|
basic_auth | HTTP client configuration for basic authentication. | |
|
tls_config | HTTP client configuration for TLS. |
BasicAuth
| Name | Description | Schema |
|---|---|---|
|
username | User name for basic authorization. | string |
|
password | Password for basic authorization. | string |
TLSConfig
| Name | Description | Schema |
|
secret_name | Name of the secret that contains certificates. | string |
|
ca_file_key | Key of the CA certificate in the secret (only optional if insecure_skip_verify is set to true). | string |
|
cert_file_key | Key of the client certificate in the secret. | string |
|
key_file_key | Key of the client key in the secret. | string |
|
insecure_skip_verify | Parameter to skip the verification for target certificate. | bool |
1.4.5.2. Updating the multiclusterobservability CR
After you create the Kubernetes secret, you must update the multiclusterobservability CR to add writeStorage in the spec.storageConfig parameter. View the following example:
spec:
  storageConfig:
    writeStorage:
    - key: ep.yaml
      name: victoriametrics
The value for writeStorage is a list. You can add an item to the list when you want to export metrics to one external endpoint. If you add more than one item to the list, then the metrics are exported to multiple external endpoints. Each item contains two attributes: name and key. Name is the name of the Kubernetes secret that contains endpoint access information, and key is the key of the content in the secret. View the following description table for the
1.4.5.3. Viewing the status of metric export
After the metrics export is enabled, you can view the status of metrics export by checking the acm_remote_write_requests_total metric. From the OpenShift console of your hub cluster, navigate to the Metrics page by clicking Metrics in the Observe section.
Then query the acm_remote_write_requests_total metric. The value of that metric is the total number of requests with a specific response for one external endpoint, on one observatorium API instance. The name label is the name for the external endpoint. The code label is the return code of the HTTP request for the metrics export.
1.4.6. Adding advanced configuration
Add the advanced configuration section to update the retention for each observability component, according to your needs.
Edit the MultiClusterObservability CR and add the advanced section with the following command: oc edit mco observability -o yaml. Your YAML file might resemble the following contents:
spec:
  advanced:
    retentionConfig:
      blockDuration: 2h
      deleteDelay: 48h
      retentionInLocal: 24h
      retentionResolutionRaw: 30d
      retentionResolution5m: 180d
      retentionResolution1h: 0d
    receive:
      resources:
        limits:
          memory: 4096Gi
      replicas: 3
For descriptions of all the parameters that can added into the advanced configuration, see the Observability API.
1.4.7. Updating the multiclusterobservability CR replicas from the console
If your workload increases, increase the number of replicas of your observability pods. Navigate to the Red Hat OpenShift Container Platform console from your hub cluster. Locate the multiclusterobservability custom resource (CR), and update the replicas parameter value for the component where you want to change the replicas. Your updated YAML might resemble the following content:
spec:
   advanced:
      receive:
         replicas: 6
For more information about the parameters within the mco observability CR, see the Observability API.
1.4.8. Forwarding alerts
After you enable observability, alerts from your OpenShift Container Platform managed clusters are automatically sent to the hub cluster. You can use the alertmanager-config YAML file to configure alerts with an external notification system.
View the following example of the alertmanager-config YAML file:
global:
  slack_api_url: '<slack_webhook_url>'

route:
  receiver: 'slack-notifications'
  group_by: [alertname, datacenter, app]

receivers:
- name: 'slack-notifications'
  slack_configs:
  - channel: '#alerts'
    text: 'https://internal.myorg.net/wiki/alerts/{{ .GroupLabels.app }}/{{ .GroupLabels.alertname }}'
If you want to configure a proxy for alert forwarding, add the following global entry to the alertmanager-config YAML file:
global:
  slack_api_url: '<slack_webhook_url>'
  http_config:
    proxy_url: http://****
To learn more, see the Prometheus Alertmanager documentation.
1.4.8.1. Disabling forward alerts for managed clusters
Disable alert forwarding for managed clusters. Add the following annotation to the MultiClusterObservability custom resource:
metadata:
      annotations:
        mco-disable-alerting: "true"
When you set the annotation, the alert forwarding configuration on the managed clusters is reverted. Any changes made to the ocp-monitoring-config ConfigMap in the openshift-monitoring namespace are reverted. Setting the annotation ensures that the ocp-monitoring-config ConfigMap is no longer managed or updated by the observability operator endpoint. After you update the configuration, the Prometheus instance on your managed cluster restarts.
Important: Metrics on your managed cluster are lost if you have a Prometheus instance with a persistent volume for metrics, and the Prometheus instance restarts. However, metrics from the hub cluster are not affected.
When the changes are reverted, a ConfigMap named cluster-monitoring-reverted is createde in the open-cluster-management-addon-observability namespace. Any new, manually added alert forward configurations are not reverted from the ConfigMap.
Verify that the hub cluster alert manager is no longer propagating managed cluster alerts to third-party messaging tools. See the previous section, Configuring AlertManager.
1.4.9. Silencing alerts
Add alerts that you do not want to receive. You can silence alerts by the alert name, match label, or time duration. After you add the alert that you want to silence, an ID is created. Your ID for your silenced alert might resemble the following string, d839aca9-ed46-40be-84c4-dca8773671da.
Continue reading for ways to silence alerts:
To silence a Red Hat Advanced Cluster Management alert, you must have access to the
alertmanager-mainpod in theopen-cluster-management-observabilitynamespace. For example, enter the following command in the pod terminal to silenceSampleAlert:amtool silence add --alertmanager.url="http://localhost:9093" --author="user" --comment="Silencing sample alert" alertname="SampleAlert"Silence an alert by using multiple match labels. The following command uses
match-label-1andmatch-label-2:amtool silence add --alertmanager.url="http://localhost:9093" --author="user" --comment="Silencing sample alert" <match-label-1>=<match-value-1> <match-label-2>=<match-value-2>If you want to silence an alert for a specific period of time, use the
--durationflag. Run the following command to silence theSampleAlertfor an hour:amtool silence add --alertmanager.url="http://localhost:9093" --author="user" --comment="Silencing sample alert" --duration="1h" alertname="SampleAlert"You can also specify a start or end time for the silenced alert. Enter the following command to silence the
SampleAlertat a specific start time:amtool silence add --alertmanager.url="http://localhost:9093" --author="user" --comment="Silencing sample alert" --start="2023-04-14T15:04:05-07:00" alertname="SampleAlert"To view all silenced alerts that are created, run the following command:
amtool silence --alertmanager.url="http://localhost:9093"If you no longer want an alert to be silenced, end the silencing of the alert by running the following command:
amtool silence expire --alertmanager.url="http://localhost:9093" "d839aca9-ed46-40be-84c4-dca8773671da"To end the silencing of all alerts, run the following command:
amtool silence expire --alertmanager.url="http://localhost:9093" $(amtool silence query --alertmanager.url="http://localhost:9093" -q)
1.4.10. Suppressing alerts
Suppress Red Hat Advanced Cluster Management alerts across your clusters globally that are less severe. Suppress alerts by defining an inhibition rule in the alertmanager-config in the open-cluster-management-observability namespace.
An inhibition rule mutes an alert when there is a set of parameter matches that match another set of existing matchers. In order for the rule to take effect, both the target and source alerts must have the same label values for the label names in the equal list. Your inhibit_rules might resemble the following:
global:
  resolve_timeout: 1h
inhibit_rules:
  - equal:
      - namespace
    source_match:
      severity: critical
    target_match_re:
severity: warning|info- 1
- The
inhibit_rulesparameter section is defined to look for alerts in the same namespace. When acriticalalert is initiated within a namespace and if there are any other alerts that contain the severity levelwarningorinfoin that namespace, only thecriticalalerts are routed to the AlertManager receiver. The following alerts might be displayed when there are matches:ALERTS{alertname="foo", namespace="ns-1", severity="critical"} ALERTS{alertname="foo", namespace="ns-1", severity="warning"} - 2
- If the value of the
source_matchandtarget_match_reparameters do not match, the alert is routed to the receiver:ALERTS{alertname="foo", namespace="ns-1", severity="critical"} ALERTS{alertname="foo", namespace="ns-2", severity="warning"}To view suppressed alerts in Red Hat Advanced Cluster Management, enter the following command:
amtool alert --alertmanager.url="http://localhost:9093" --inhibited
1.4.11. Customizing route certification
If you want to customize the OpenShift Container Platform route certification, you must add the routes in the alt_names section. To ensure your OpenShift Container Platform routes are accessible, add the following information: alertmanager.apps.<domainname>, observatorium-api.apps.<domainname>, rbac-query-proxy.apps.<domainname>.
Note: Users are responsible for certificate rotations and updates.
1.4.11.1. Customizing certificates for accessing the object store
You can customize certificates for accessing the object store. Edit the http_config section by adding the certificate in the object store secret. View the following example:
 thanos.yaml: |
    type: s3
    config:
      bucket: "thanos"
      endpoint: "minio:9000"
      insecure: false
      access_key: "minio"
      secret_key: "minio123"
      http_config:
        tls_config:
          ca_file: /etc/minio/certs/ca.crt
          insecure_skip_verify: false
You must provide a secret in the open-cluster-management-observability namespace. The secret must contain the ca.crt that you defined in the previous secret example. If you want to enable Mutual TLS, you need to provide public.crt, and private.key in the previous secret. View the following example:
 thanos.yaml: |
    type: s3
    config:
      ...
      http_config:
        tls_config:
          ca_file: /etc/minio/certs/ca.crt
          cert_file: /etc/minio/certs/public.crt
          key_file: /etc/minio/certs/private.key
          insecure_skip_verify: false
You can also configure the secret name, the TLSSecretName parameter in the MultiClusterObservability CR. View the following example where the secret name is tls-certs-secret:
metricObjectStorage:
      key: thanos.yaml
      name: thanos-object-storage
      tlsSecretName: tls-certs-secret
This secret can be mounted into all components that need to access the object store, and it includes the following components: receiver, store, ruler, compact.
1.4.12. Viewing and exploring data
View the data from your managed clusters by accessing Grafana from the hub cluster. You can query specific alerts and add filters for the query.
For example, to cluster_infrastructure_provider from a single node cluster, use the following query expression: cluster_infrastructure_provider{clusterType="SNO"}
Note: Do not set the ObservabilitySpec.resources.CPU.limits parameter if observability is enabled on single node managed clusters. When you set the CPU limits, it causes the observability pod to be counted against the capacity for your managed cluster. See Management Workload Partitioning for more information.
1.4.12.1. Viewing the etcd table
View the etcd table from the hub cluster dashboard in Grafana to learn the stability of the etcd as a data store.
Select the Grafana link from your hub cluster to view the etcd table data, which is collected from your hub cluster. The Leader election changes across managed clusters are displayed.
1.4.12.2. Viewing the cluster fleet service-level overview for the Kubernetes API server dashboard
View the cluster fleet Kubernetes API service-level overview from the hub cluster dashboard in Grafana.
After you navigate to the Grafana dashboard, access the managed dashboard menu by selecting Kubernetes > Service-Level Overview > API Server. The Fleet Overview and Top Cluster details are displayed.
View the total number of clusters that are exceeding or meeting the targeted service-level objective (SLO) value for the past seven or 30-day period, offending and non-offending clusters, and API Server Request Duration.
1.4.12.3. Viewing the cluster service-level overview for the Kubernetes API server dashboard
View the Kubernetes API service-level overview table from the hub cluster dashboard in Grafana.
After you navigate to the Grafana dashboard, access the managed dashboard menu by selecting Kubernetes > Service-Level Overview > API Server. The Fleet Overview and Top Cluster details are displayed.
View the error budget for the past seven or 30-day period, the remaining downtime, and trend.
1.4.13. Disabling observability
You can disable observability, which stops data collection on the Red Hat Advanced Cluster Management hub cluster.
1.4.13.1. Disabling observability on all clusters
Disable observability by removing observability components on all managed clusters.
Update the multicluster-observability-operator resource by setting enableMetrics to false. Your updated resource might resemble the following change:
spec:
  imagePullPolicy: Always
  imagePullSecret: multiclusterhub-operator-pull-secret
  observabilityAddonSpec: # The ObservabilityAddonSpec defines the global settings for all managed clusters which have observability add-on enabled
    enableMetrics: false #indicates the observability addon push metrics to hub server
1.4.13.2. Disabling observability on a single cluster
Disable observability by removing observability components on specific managed clusters. Add the observability: disabled label to the managedclusters.cluster.open-cluster-management.io custom resource.
From the Red Hat Advanced Cluster Management console Clusters page, add the observability=disabled label to the specified cluster.
Note: When a managed cluster with the observability component is detached, the metrics-collector deployments are removed.
For more information about monitoring data from the console with the observability service, see Observing environments introduction.
1.5. Designing your Grafana dashboard
You can design your Grafana dashboard by creating a grafana-dev instance.
1.5.1. Setting up the Grafana developer instance
First, clone the stolostron/multicluster-observability-operator/ repository, so that you are able to run the scripts that are in the tools folder. Be sure to use the most current grafana-dev instance.
Complete the following steps to set up the Grafana developer instance:
Run the
setup-grafana-dev.shto setup your Grafana instance. When you run the script the following resources are created:secret/grafana-dev-config,deployment.apps/grafana-dev,service/grafana-dev,ingress.extensions/grafana-dev,persistentvolumeclaim/grafana-dev:./setup-grafana-dev.sh --deploy secret/grafana-dev-config created deployment.apps/grafana-dev created service/grafana-dev created serviceaccount/grafana-dev created clusterrolebinding.rbac.authorization.k8s.io/open-cluster-management:grafana-crb-dev created route.route.openshift.io/grafana-dev created persistentvolumeclaim/grafana-dev created oauthclient.oauth.openshift.io/grafana-proxy-client-dev created deployment.apps/grafana-dev patched service/grafana-dev patched route.route.openshift.io/grafana-dev patched oauthclient.oauth.openshift.io/grafana-proxy-client-dev patched clusterrolebinding.rbac.authorization.k8s.io/open-cluster-management:grafana-crb-dev patchedSwitch the user role to Grafana administrator with the
switch-to-grafana-admin.shscript.-
Select the Grafana URL,
https://grafana-dev-open-cluster-management-observability.{OPENSHIFT_INGRESS_DOMAIN}, and log in. Then run the following command to add the switched user as Grafana administrator. For example, after you log in using
kubeadmin, run following command:./switch-to-grafana-admin.sh kube:admin User <kube:admin> switched to be grafana admin
-
Select the Grafana URL,
The Grafana developer instance is set up.
1.5.2. Design your Grafana dashboard
After you set up the Grafana instance, you can design the dashboard. Complete the following steps to refresh the Grafana console and design your dashboard:
- From the Grafana console, create a dashboard by selecting the Create icon from the navigation panel. Select Dashboard, and then click Add new panel.
- From the New Dashboard/Edit Panel view, navigate to the Query tab.
-
Configure your query by selecting
Observatoriumfrom the data source selector and enter a PromQL query. - From the Grafana dashboard header, click the Save icon that is in the dashboard header.
- Add a descriptive name and click Save.
1.5.2.1. Design your Grafana dashboard with a ConfigMap
Design your Grafana dashboard with a ConfigMap. You can use the generate-dashboard-configmap-yaml.sh script to generate the dashboard ConfigMap, and to save the ConfigMap locally:
./generate-dashboard-configmap-yaml.sh "Your Dashboard Name"
Save dashboard <your-dashboard-name> to ./your-dashboard-name.yaml
If you do not have permissions to run the previously mentioned script, complete the following steps:
- Select a dashboard and click the Dashboard settings icon.
- Click the JSON Model icon from the navigation panel.
-
Copy the dashboard JSON data and paste it in the
datasection. Modify the
nameand replace$your-dashboard-name. Enter a universally unique identifier (UUID) in theuidfield indata.$your-dashboard-name.json.$$your_dashboard_json. You can use a program such as uuidegen to create a UUID. Your ConfigMap might resemble the following file:kind: ConfigMap apiVersion: v1 metadata: name: $your-dashboard-name namespace: open-cluster-management-observability labels: grafana-custom-dashboard: "true" data: $your-dashboard-name.json: |- $your_dashboard_jsonNotes:
If your dashboard is created within the
grafana-devinstance, you can take the name of the dashboard and pass it as an argument in the script. For example, a dashboard named Demo Dashboard is created in thegrafana-devinstance. From the CLI, you can run the following script:./generate-dashboard-configmap-yaml.sh "Demo Dashboard"After running the script, you might receive the following message:
Save dashboard <demo-dashboard> to ./demo-dashboard.yamlIf your dashboard is not in the General folder, you can specify the folder name in the
annotationssection of this ConfigMap:annotations: observability.open-cluster-management.io/dashboard-folder: CustomAfter you complete your updates for the ConfigMap, you can install it to import the dashboard to the Grafana instance.
Verify that the YAML file is created by applying the YAML from the CLI or OpenShift Container Platform console. A ConfigMap within the open-cluster-management-observability namespace is created. Run the following command from the CLI:
oc apply -f demo-dashboard.yaml
From the OpenShift Container Platform console, create the ConfigMap using the demo-dashboard.yaml file. The dashboard is located in the Custom folder.
1.5.3. Uninstalling the Grafana developer instance
When you uninstall the instance, the related resources are also deleted. Run the following command:
./setup-grafana-dev.sh --clean
secret "grafana-dev-config" deleted
deployment.apps "grafana-dev" deleted
serviceaccount "grafana-dev" deleted
route.route.openshift.io "grafana-dev" deleted
persistentvolumeclaim "grafana-dev" deleted
oauthclient.oauth.openshift.io "grafana-proxy-client-dev" deleted
clusterrolebinding.rbac.authorization.k8s.io "open-cluster-management:grafana-crb-dev" deleted
1.6. Observability with Red Hat Insights
Red Hat Insights is integrated with Red Hat Advanced Cluster Management observability, and is enabled to help identify existing or potential problems in your clusters. Red Hat Insights helps you to identify, prioritize, and resolve stability, performance, network, and security risks. Red Hat OpenShift Container Platform offers cluster health monitoring through OpenShift Cluster Manager. OpenShift Cluster Manager collects anonymized, aggregated information about the health, usage, and size of the clusters. For more information, see Red Hat Insights product documentation.
When you create or import an OpenShift cluster, anonymized data from your managed cluster is automatically sent to Red Hat. This information is used to create insights, which provide cluster health information. Red Hat Advanced Cluster Management administrator can use this health information to create alerts based on severity.
Required access: Cluster administrator
1.6.1. Prerequisites
- Ensure that Red Hat Insights is enabled. For more information, see Modifying the global cluster pull secret to disable remote health reporting.
- Install OpenShift Container Platform version 4.0 or later.
- Hub cluster user, who is registered to OpenShift Cluster Manager, must be able to manage all the Red Hat Advanced Cluster Management managed clusters in OpenShift Cluster Manager.
1.6.2. Red Hat Insights from the Red Hat Advanced Cluster Management console
Continue reading to view functionality descriptions of the integration:
- When you select a cluster from the Clusters page, you can select the Number of identified issues from the Status card. The Status card displays information about Nodes, Applications, Policy violations, and Identified issues. The Identified issues card represents the information from Red Hat insights. The Identified issues status displays the number of issues by severity. The triage levels used for the issues are the following severity categories: Critical, Major, Low, and Warning.
- After you click the number, the Potential issue side panel is displayed. A summary and chart of the total issues are displayed in the panel. You can also use the search feature to search for recommended remediations. The remediation option displays the Description of the vulnerability, Category that vulnerability is associated with, and the Total risk.
- From the Description section, you can select the link to the vulnerability. View steps to resolve your vulnerability by selecting the How to remediate tab. You can also view why the vulnerability occurred by clicking the Reason tab.
See Managing insight PolicyReports for more information.
1.7. Managing insight PolicyReports
Red Hat Advanced Cluster Management for Kubernetes PolicyReports are violations that are generated by the insights-client. The PolicyReports are used to define and configure alerts that are sent to incident management systems. When there is a violation, alerts from a PolicyReport are sent to incident management system.
View the following sections to learn how to manage and view insight PolicyReports:
1.7.1. Searching for insight policy reports
You can search for a specific insight PolicyReport that has a violation, across your managed clusters.
After you log into your Red Hat Advanced Cluster Management hub cluster, click the Search icon in the console header to navigate to the Search page. Enter the following query: kind:policyreport.
Note: The PolicyReport name matches the name of the cluster.
You can also further specify your query by the insight policy violation and categories. When you select a PolicyReport name, you are redirected to the Details page of the associated cluster. The Insights sidebar is automatically displayed.
If the search service is disabled and you want to search for an insight, run the following command from your hub cluster:
oc get policyreport --all-namespaces1.7.2. Viewing identified issues from the console
You can view the identified issues on a specific cluster.
After you log into your Red Hat Advanced Cluster Management cluster, select Overview from the navigation menu. Select a severity to view the PolicyReports that are associated with that severity. Details of the cluster issues and the severities are displayed from the Cluster issues summary card.
Alternatively, you can select Clusters from the navigation menu. Select a managed cluster from the table to view more details. From the Status card, view the number of identified issues.
Select the number of potential issues to view the severity chart and recommended remediations for the issues. Click the link to the vulnerability to view steps on How to remediate and the Reason for the vulnerability.
Note: After the issue is resolved, the Red Hat Insights are received by Red Hat Advanced Cluster Management every 30 minutes and Red Hat Insights is updated every two hours.
Be sure to verify which component sent the alert message from the PolicyReport. Navigate to the Governance page and select a specific policyreport. Select the Status tab and click the View details link to view the PolicyReport YAML file.
Locate the source parameter, which informs you of the component that sent the violation. The value options are grc and insights.
Learn how to create custom alert rules for the PolicyReports, see Configuring AlertManager for more information.