Ce contenu n'est pas disponible dans la langue sélectionnée.
Dashboard Guide
Monitoring Ceph Cluster with Ceph Dashboard
Abstract
Chapter 1. Ceph dashboard overview
As a storage administrator, the Red Hat Ceph Storage Dashboard provides management and monitoring capabilities, allowing you to administer and configure the cluster, as well as visualize information and performance statistics related to it. The dashboard uses a web server hosted by the ceph-mgr daemon.
The dashboard is accessible from a web browser and includes many useful management and monitoring features, for example, to configure manager modules and monitor the state of OSDs.
1.1. Prerequisites
- System administrator level experience.
1.2. Dashboard components
The functionality of the dashboard is provided by multiple components.
- The Ansible automation application for deployment.
-
The embedded dashboard
ceph-mgrmodule. -
The embedded Prometheus
ceph-mgrmodule. - The Prometheus time-series database.
- The Prometheus node-exporter daemon, running on each node of the storage cluster.
- The Grafana platform to provide monitoring user interface and alerting.
Additional Resources
- For more information, see the Ansible website
- For more information, see the Prometheus website.
- For more information, see the Grafana website.
1.3. Dashboard features
The Ceph dashboard provides multiple features.
Management features
- View cluster hierarchy: You can view the CRUSH map, for example, to determine which node a specific OSD ID is running on. This is helpful if there is an issue with an OSD.
- Configure manager modules: You can view and change parameters for ceph manager modules.
- View and filter logs: You can view event and audit cluster logs and filter them based on priority, keyword, date, or time range.
- Toggle dashboard components: You can enable and disable dashboard components so only the features you need are available.
- Manage OSD settings: You can set cluster-wide OSD flags using the dashboard.
- Viewing Alerts: The alerts page allows you to see details of current alerts.
- Quality of Service for images: You can set performance limits on images, for example limiting IOPS or read BPS burst rates.
Monitoring features
- Username and password protection: You can access the dashboard only by providing a configurable user name and password.
SSL and TLS support: All HTTP communication between the web browser and the dashboard is secured via SSL. A self-signed certificate can be created with a built-in command, but it is also possible to import custom certificates signed and issued by a Certificate Authority (CA). From Red Hat Ceph Storage 4.2,
dashboard_protocolis set tohttpsand Ansible generates the dashboard and grafana certificate. To plot data points and graphs, update the TLS handshake manually as:- Alert manager API host - http://grafana_node:9093
- Prometheus API host - http://grafana_node:9092
- Grafana API Host - https://grafana_node:3000
- Overall cluster health: Displays the overall cluster status, storage utilization (For example, number of objects, raw capacity, usage per pool), a list of pools and their status and usage statistics.
- Hosts: Provides a list of all hosts associated with the cluster along with the running services and the installed Ceph version.
- Performance counters: Displays detailed statistics for each running service.
- Monitors: Lists all Monitors, their quorum status and open sessions.
- Configuration Reference: Lists all available configuration options, their description and default values.
- Cluster logs: Display and filter the cluster’s event and audit logs.
- View storage cluster capacity: You can view raw storage capacity of the Red Hat Ceph Storage cluster in the Capacity panels of the Ceph dashboard.
- Pools: Lists and manages all Ceph pools and their details. For example: applications, placement groups, replication size, EC profile, CRUSH ruleset, etc.
- OSDs: Lists and manages all OSDs, their status and usage statistics as well as detailed information like attributes (OSD map), metadata, performance counters and usage histograms for read/write operations.
- iSCSI: Lists all hosts that run the tcmu-runner service, displays all images and their performance characteristics, such as read and write operations or traffic.
Images: Lists all RBD images and their properties such as size, objects, and features. Create, copy, modify and delete RBD images. Create, delete, and rollback snapshots of selected images, protect or unprotect these snapshots against modification. Copy or clone snapshots, flatten cloned images.
NoteThe performance graph for I/O changes in the Overall Performance tab for a specific image shows values only after specifying the pool that includes that image by setting the
rbd_stats_poolparameter in Cluster > Manager modules > Prometheus.- Mirroring: Lists all active sync daemons and their status, pools and RBD images including their synchronization state.
- Filesystems: Lists all active Ceph file system (CephFS) clients and associated pools, including their usage statistics.
- Object Gateway (RGW): Lists all active object gateways and their performance counters. Displays and manages (adds, edits, deletes) object gateway users and their details, for example quotas, as well as the users’ buckets and their details, for example, owner or quotas.
Additional Resources
- See Toggling dashboard components on or off in the Red Hat Ceph Storage Dashboard Guide for more information.
1.3.1. Toggling dashboard features on or off
You can customize the Red Hat Ceph Storage dashboard components by enabling or disabling features on demand. All features are enabled by default. When disabling a feature, the web-interface elements become hidden and the associated REST API end-points reject any further requests for that feature. Enabling and disabling dashboard features can be done from the command-line interface or the web interface.
Available features:
Ceph Block Devices:
-
Image management,
rbd -
Mirroring,
mirroring -
iSCSI gateway,
iscsi
-
Image management,
-
Ceph Filesystem,
cephfs -
Ceph Object Gateway,
rgw
By default, the Ceph Manager is collocated with the Ceph Monitor.
You can disable multiple features at once.
Once a feature is disabled, it can take up to 20 seconds to reflect the change in the web interface.
Prerequisites
- Installation and configuration of the Red Hat Ceph Storage dashboard software.
- User access to the Ceph Manager node or the dashboard web interface.
Procedure
To toggle the dashboard features from the dashboard web interface:
- From the navigation bar on the dashboard page, navigate to Cluster, then Manager Modules, then click on Dashboard. This opens the Edit Manager module page.
From the Edit Manager module page, you can enable or disable the dashboard features by checking or unchecking the selection box next to the feature name.

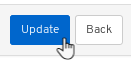
Once the selections have been made, click on the Update button at the bottom of the page.
To toggle the dashboard features from the command-line interface:
- Log in to the Ceph Manager node.
List the feature status:
[user@mon ~]$ ceph dashboard feature statusDisable a feature:
[user@mon ~]$ ceph dashboard feature disable iscsiThis example disables the Ceph iSCSI gateway feature.
Enable a feature:
[user@mon ~]$ ceph dashboard feature enable cephfsThis example enables the Ceph Filesystem feature.
1.4. Dashboard architecture
The Dashboard architecture depends on the Ceph manager dashboard plugin and other components. See the diagram below to understand how they work together.

Chapter 2. Ceph Dashboard installation and access
As a system administrator, you can install dashboard and access it for the first time.
Red Hat Ceph Storage is installed graphically using the Cockpit web interface, or on the command line using the Ansible playbooks provided by the ceph-ansible RPM. Cockpit uses the same Ansible playbooks to install Ceph. Those playbooks install dashboard by default. Therefore, whether you directly use the Ansible playbooks, or use Cockpit to install Ceph, dashboard will be installed.
Change the default dashboard password. By default, the password for dashboard is p@ssw0rd, which is insecure. You can change the default password before installing Ceph by updating dashboard_admin_password in the all.yml Ansible playbook before using the playbooks to install Ceph, or after install using the same playbook, or dashboard itself. For more information, see the Install Guide, Changing the dashboard password using the dashboard, or Changing the dashboard password using Ansible.
2.1. Installing dashboard using Cockpit
Dashboard is installed by default when using the Cockpit web interface to install Red Hat Ceph Storage. You must set a host with the Metrics role for Grafana to be installed on.
Prerequisites
- Consult the Installation Guide for full prerequisites. This procedure only highlights the steps relevant to the dashboard install.
Procedure
On the Hosts page, add a host and set the Metrics role.
- Click Add.
- Complete the remaining Cockpit Ceph Installer prompts.
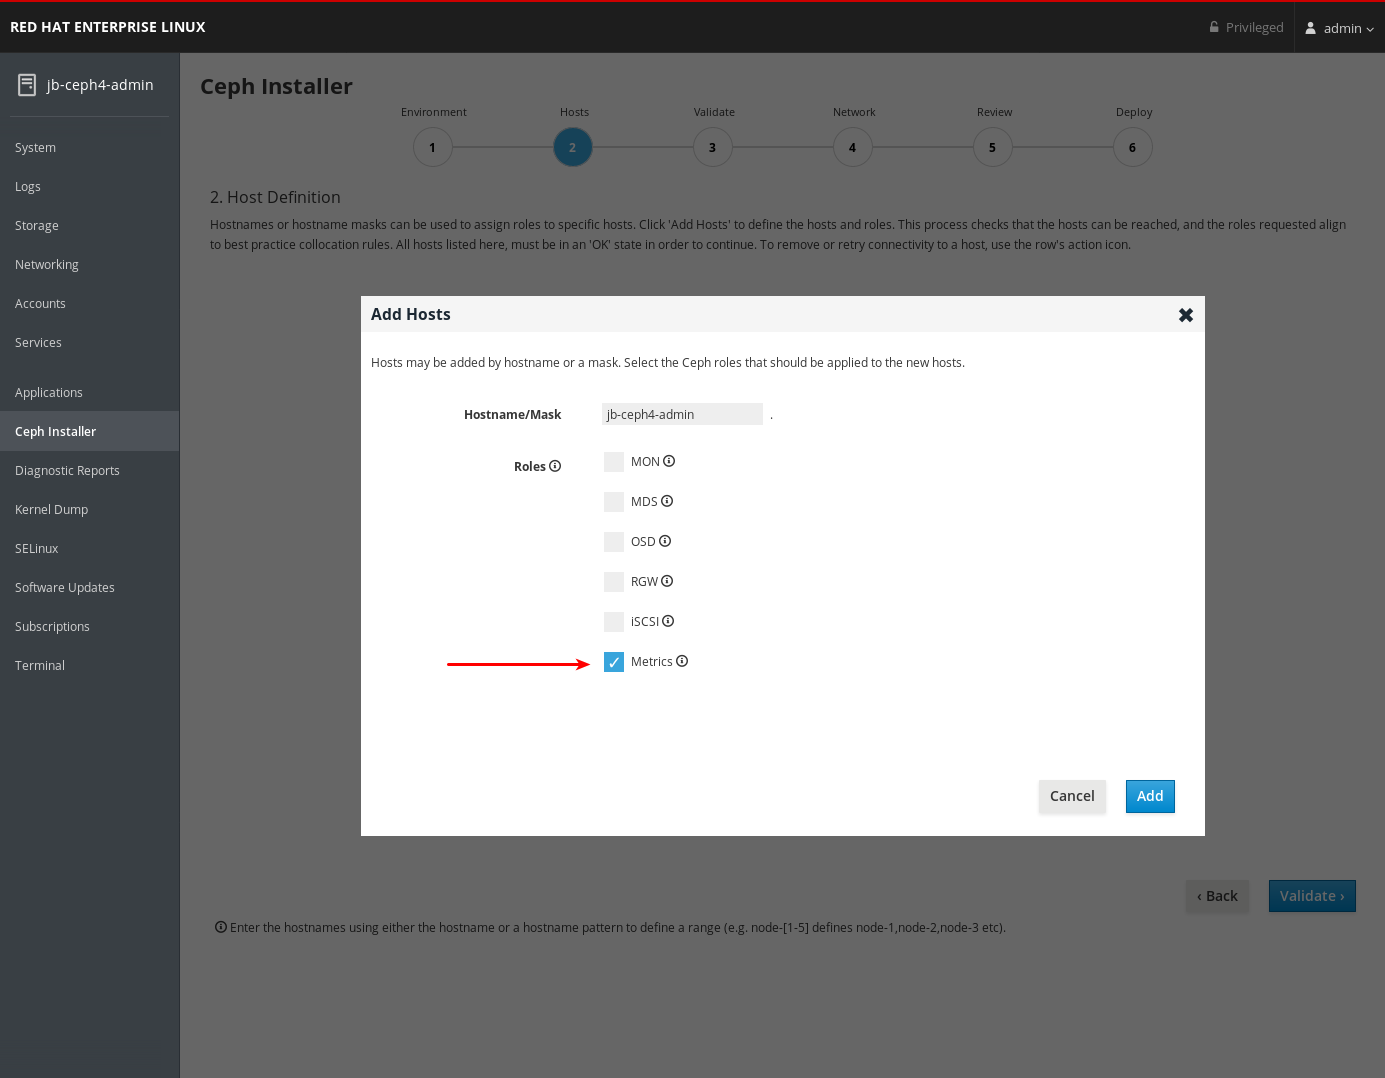
After the deploy process finishes, click the Complete button at the bottom right corner of the page. This opens a window which displays the output of the command
ceph status, as well as dashboard access information.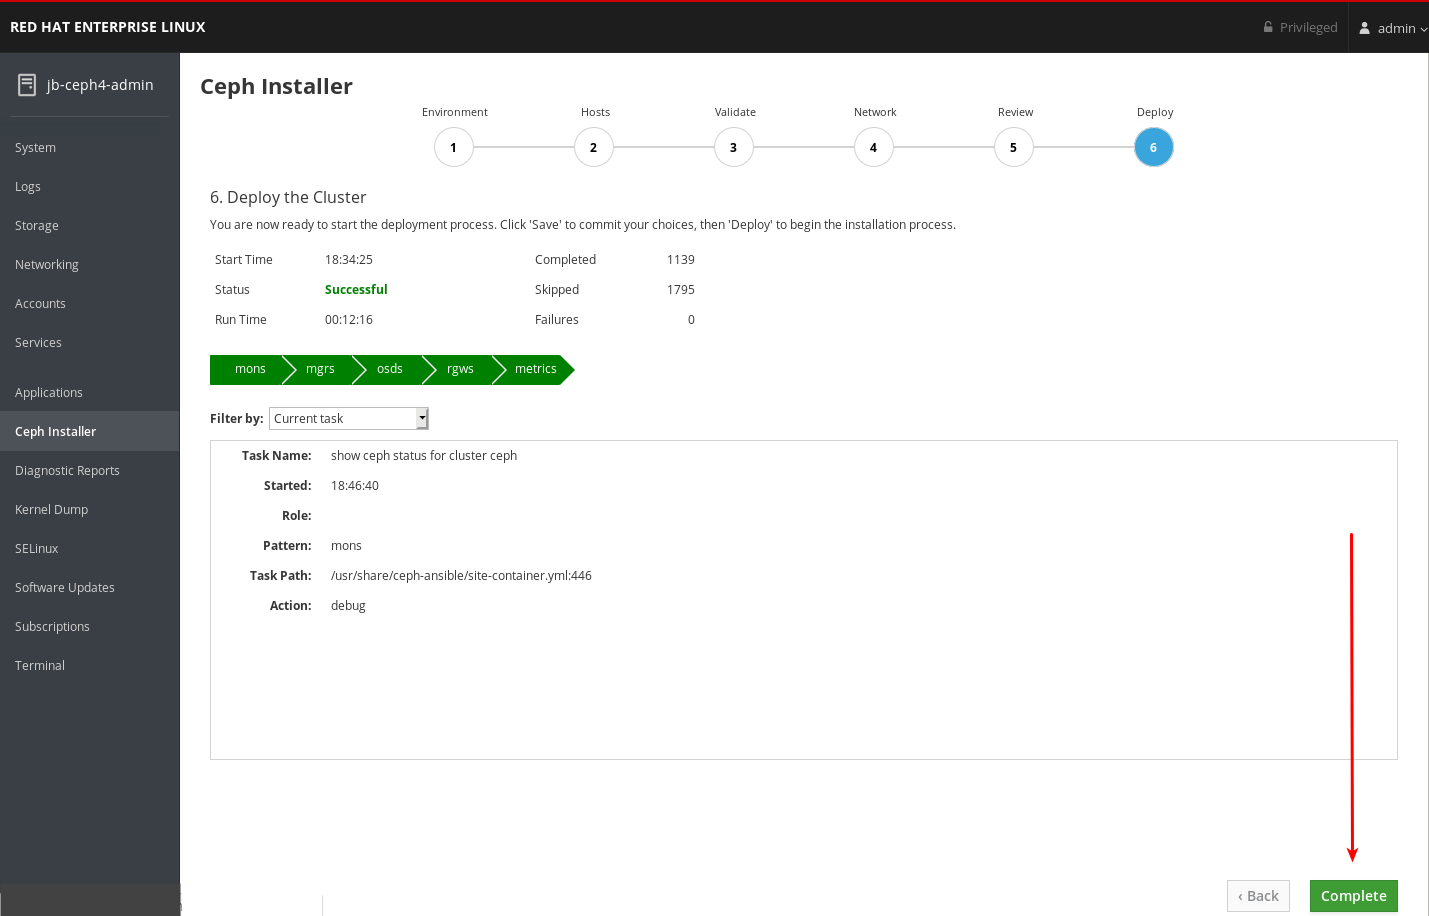
At the bottom of the Ceph Cluster Status window, the dashboard access information is displayed, including the URL, user name, and password. Take note of this information.
- For more information, see Installing Red Hat Ceph Storage using the Cockpit Web User Interface in the Installation Guide.
2.2. Installing dashboard using Ansible
Dashboard is installed by default when installing Red Hat Ceph Storage using the Ansible playbooks provided by the ceph-ansible RPM.
Prerequisites
- Consult the Installation Guide for full prerequisites. This procedure only highlights the steps relevant to the dashboard install.
Procedure
Ensure a
[grafana-server]group with a node defined under it exists in the Ansible inventory file. Grafana and Prometheus are installed on this node.[root@jb-ceph4-admin ~]# grep grafana-server -A 1 /etc/ansible/hosts [grafana-server] jb-ceph4-monIn the
all.ymlAnsible playbook, ensuredashboard_enabled:has not been set toFalse. There should be a comment indicating the default setting ofTrue.[root@jb-ceph4-admin ~]# grep "dashboard_enabled" /usr/share/ceph-ansible/group_vars/all.yml #dashboard_enabled: True- Complete the rest of the steps necessary to install Ceph as outlined in the Installation Guide.
After running
ansible-playbook site.ymlfor bare metal installs, oransible-playbook site-docker.ymlfor container installs, Ansible will print the dashboard access information. Find the dashboard URL, username, and password towards the end of the playbook output:2019-12-13 15:31:17,871 p=11421 u=admin | TASK [ceph-dashboard : print dashboard URL] ************************************************************ 2019-12-13 15:31:17,871 p=11421 u=admin | task path: /usr/share/ceph-ansible/roles/ceph-dashboard/tasks/main.yml:5 2019-12-13 15:31:17,871 p=11421 u=admin | Friday 13 December 2019 15:31:17 -0500 (0:00:02.189) 0:04:25.380 ******* 2019-12-13 15:31:17,934 p=11421 u=admin | ok: [jb-ceph4-mon] => msg: The dashboard has been deployed! You can access your dashboard web UI at http://jb-ceph4-mon:8443/ as an 'admin' user with 'p@ssw0rd' password.Take note of the output
You can access your dashboard web UI at http://jb-ceph4-mon:8443/ as an 'admin' user with 'p@ssw0rd' password.
The Ansible playbook does the following:
-
Enables the Prometheus module in
ceph-mgr. -
Enables the dashboard module in
ceph-mgrand opens TCP port 8443. Deploys the Prometheus
node_exporterdaemon to each node in the storage cluster.- Opens TCP port 9100.
-
Starts the
node_exporterdaemon.
Deploys Grafana and Prometheus containers under Docker/systemd on the node under
[grafana-server]in the Ansible inventory file.- Configures Prometheus to gather data from the ceph-mgr nodes and the node-exporters running on each Ceph host
- Opens TCP port 3000.
- Creates the dashboard, theme, and user accounts in Grafana.
- Displays the Ceph Dashboard login page URL.
- For more information, see Installing a Red Hat Ceph Storage cluster in the Red Hat Ceph Storage Installation Guide.
- To remove the dashboard, see Purging the Ceph Dashboard using Ansible in the Red Hat Ceph Storage Installation Guide.
2.3. Network port requirements
The Ceph dashboard components use certain TCP network ports which must be accessible. By default, the network ports are automatically opened in firewalld during installation of Red Hat Ceph Storage.
| Port | Use | Originating Node | Destination Node |
|---|---|---|---|
| 8443 | The dashboard web interface |
IP addresses that need access to Ceph Dashboard UI and the node under | The Ceph Manager nodes. |
| 3000 | Grafana |
IP addresses that need access to Grafana Dashboard UI and all Ceph Manager hosts and |
The node under |
| 9090 | Default Prometheus server for basic Prometheus graphs |
IP addresses that need access to Prometheus UI and all Ceph Manager hosts and |
The node under |
| 9092 | Prometheus server for basic Prometheus graphs |
IP addresses that need access to Prometheus UI and all Ceph Manager hosts and |
The node under |
| 9093 | Prometheus Alertmanager |
IP addresses that need access to Alertmanager Web UI and all Ceph Manager hosts and |
All Ceph Manager nodes and the node under |
| 9094 | Prometheus Alertmanager for configuring a highly available cluster made from multiple instances |
All Ceph Manager nodes and the node under |
Prometheus Alertmanager High Availability (peer daemon sync), so both |
| 9100 |
The Prometheus |
Hosts running Prometheus that need to view Node Exporter metrics Web UI and all Ceph Manager nodes and |
All storage cluster nodes, including MONs, OSDS, |
| 9283 | Ceph Manager Prometheus exporter module |
Hosts running Prometheus that need access to Ceph Exporter metrics Web UI and | All Ceph Manager nodes. |
| 9287 | Ceph iSCSI gateway data |
All Ceph Manager hosts and | All Ceph iSCSI gateway nodes. |
2.4. Configuring dashboard ports
The Red Hat Ceph Storage Dashboard, by default, binds to a TCP/IP address and TCP port.
By default, the ceph-mgr daemon hosting the dashboard binds to TCP port 8443 or 8080 when SSL is disabled. If no specific address is configured, the web app binds to ::, which corresponds to all the available IP4 and IP6 addresses.
You can change the IP address and the port using the configuration key facility on a cluster-wide level.
Prerequisites
- A Red Hat Ceph Storage cluster.
- Installation of the Red Hat Ceph Storage Dashboard.
- Root-level access to all the nodes.
Procedure
Get the URL for accessing the dashboard:
Example
[root@admin ~]# ceph mgr servicesGet the current IP and port configuration of the
ceph-mgrdaemon:Example
[root@admin ~]# netstat -ntlpSet the IP address and the port:
Syntax
ceph config set mgr mgr/dashboard/server_addr IP_ADDRESS
ceph config set mgr mgr/dashboard/server_port PORT
ceph config set mgr mgr/dashboard/ssl_server_port PORT
Example
[root@mon ~]# ceph config set mgr mgr/dashboard/server_addr 192.168.0.120
[root@mon ~]# ceph config set mgr mgr/dashboard/server_port 8443
[root@mon ~]# ceph config set mgr mgr/dashboard/ssl_server_port 8443
Optional: Since the
ceph-mgrhosts its own instance of the dashboard, you can configure them separately. Change the IP address and port for a specific manager instance:Syntax
ceph config set mgr mgr/dashboard/NAME/server_addr IP_ADDRESS ceph config set mgr mgr/dashboard/NAME/server_port PORT ceph config set mgr mgr/dashboard/NAME/ssl_server_port PORTReplace: NAME with the ID of the
ceph-mgrinstance hosting the dashboard.Example
[root@mon ~]# ceph config set mgr mgr/dashboard/mgrs-0/server_addr 192.168.0.120
[root@mon ~]# ceph config set mgr mgr/dashboard/mgrs-0/server_port 8443
[root@mon ~]# ceph config set mgr mgr/dashboard/mgrs-0/ssl_server_port 8443
2.5. Accessing dashboard
Accessing the dashboard allows you to administer and monitor your Red Hat Ceph Storage cluster.
Prerequisites
- Successful installation of Red Hat Ceph Storage Dashboard.
- NTP is synchronizing clocks properly.
A time lag can occur between the dashboard node, cluster nodes, and a browser, when the nodes are not properly synced. Ensure all nodes and the system where the browser runs have time synced by NTP. By default, when Red Hat Ceph Storage is deployed, Ansible configures NTP on all nodes. To verify, for Red Hat Enterprise Linux 7, see Configuring NTP Using ntpd, for Red Hat Enterprise Linux 8, see Using the Chrony suite to configure NTP. If you run your browser on another operating system, consult the vendor of that operating system for NTP configuration information.
When using OpenStack Platform (OSP) with Red Hat Ceph Storage, to enable OSP Safe Mode, use one of the following methods. With Ansible, edit the group_vars/all.yml Ansible playbook, set dashboard_admin_user_ro: true and re-run ansible-playbook against site.yml, or site-container.yml, for bare-metal, or container deployments, respectively. To enable OSP Safe Mode using the ceph command, run ceph dashboard ac-user-set-roles admin read-only. To ensure the changes persist if you run the ceph-ansible Ansible playbook, edit group_vars/all.yml and set dashboard_admin_user_ro: true.
Procedure
Enter the following URL in a web browser:
http://HOST_NAME:PORTReplace:
- HOST_NAME with the host name of the dashboard node.
PORT with port
8443For example:
http://dashboard:8443
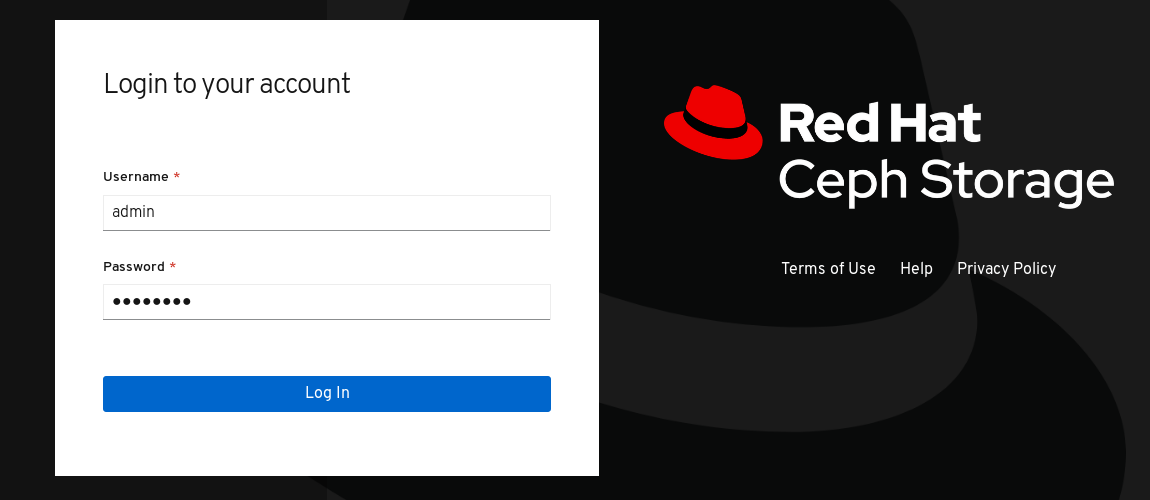
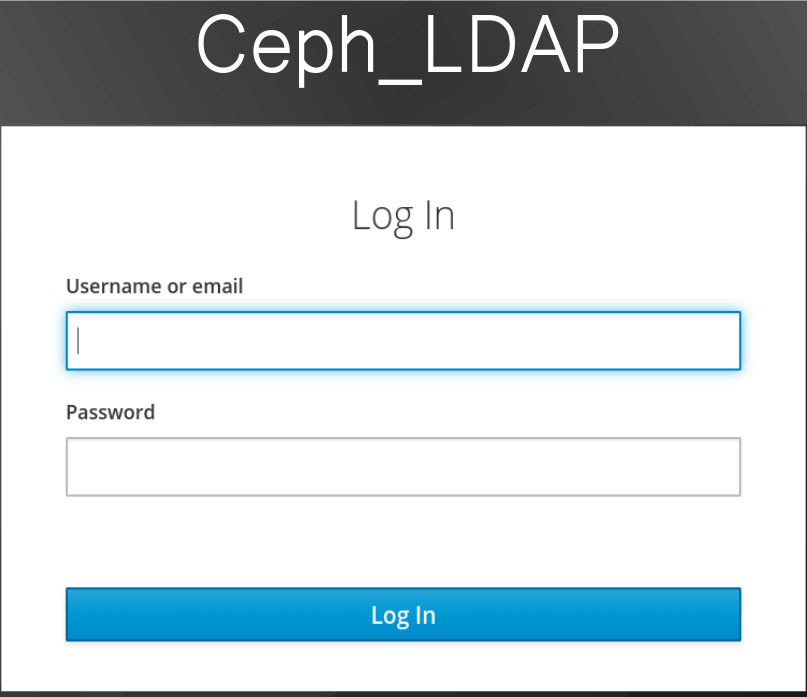
On the login page, enter the username
adminand the default passwordp@ssw0rdif you did not change the password during installation.Figure 2.1. Ceph Dashboard Login Page
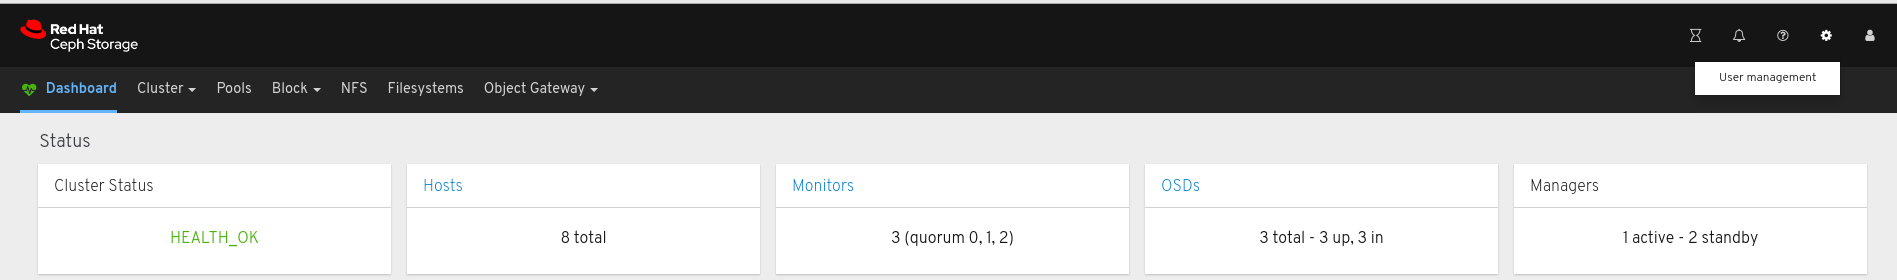
After logging in, the dashboard default landing page is displayed, which provides a high-level overview of status, performance, and capacity metrics of the Red Hat Ceph Storage cluster.
Figure 2.2. Ceph Dashboard Default Landing Page

Additional Resources
- For more information, see Changing the dashboard password using the dashboard in the Dashboard guide.
- For more information, see Changing the dashboard password using Ansible in the Dashboard guide.
2.6. Changing the dashboard password using Ansible
By default, the password for accessing dashboard is set to p@ssw0rd.
For security reasons, change the password after installation.
You can change the dashboard password using Ansible.
Prerequisites
- A running Red Hat Ceph Storage cluster.
- Access to the Ansible administration node.
Procedure
-
Open the Ansible playbook file
/usr/share/ceph-ansible/group_vars/all.ymlfor editing. Uncomment and update the password on this line:
#dashboard_admin_password: p@ssw0rdto:
dashboard_admin_password: NEW_PASSWORDReplace NEW_PASSWORD with your preferred password.
Rerun the Ansible playbook file which deploys or updates the Ceph cluster.
For bare metal installs, use the
site.ymlplaybook:[admin@admin ceph-ansible]$ ansible-playbook -v site.ymlFor container installs, use the
site-docker.ymlplaybook:[admin@admin ceph-ansible]$ ansible-playbook -v site-docker.yml
- Log in using the new password.
Additional Resources
- For more information, see Changing the dashboard password using the dashboard in the Dashboard guide.
2.7. Changing the dashboard password using the dashboard
By default, the password for accessing dashboard is set to p@ssw0rd.
For security reasons, change the password after installation.
To change the password using the dashboard, also change the dashboard password setting in Ansible to ensure the password does not revert to the default password if Ansible is used to reconfigure the Red Hat Ceph Storage cluster.
Prerequisites
- A running Red Hat Ceph Storage cluster.
Procedure
Update the password in the
group_vars/all.ymlfile to prevent the password from being reset top@ssw0rdwhen Ansible is used to reconfigure the Ceph cluster.-
Open the Ansible playbook file
/usr/share/ceph-ansible/group_vars/all.ymlfor editing. Uncomment and update the password on this line:
#dashboard_admin_password: p@ssw0rdto:
dashboard_admin_password: NEW_PASSWORDReplace NEW_PASSWORD with your preferred password.
-
Open the Ansible playbook file
Change the password in the dashboard web user-interface.
Log in to the dashboard:
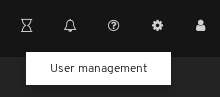
http://HOST_NAME:8443At the top right hand side toolbar, click the dashboard settings icon and then click User management.
Locate the
adminuser in the Username table and click on admin.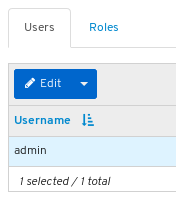
- Above the table title Username, click on the Edit button.
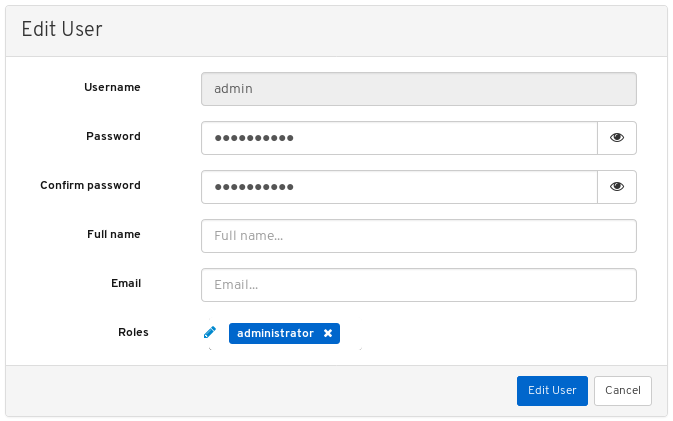
Enter the new password and confirm it by reentering it and click Edit User.
You will be logged out and taken to the log in screen. A notification will appear confirming the password change.
- Log back in using the new password.
Additional Resources
- For more information, see Changing the dashboard password using Ansible in the Dashboard guide.
2.8. Changing the Grafana password using Ansible
By default, the password for Grafana, used by dashboard, is set to admin. Use this procedure to change the password.
For security reasons, change the password from the default.
Prerequisites
- A running Red Hat Ceph Storage cluster.
- Root access to all nodes in the cluster.
Procedure
Optional: If you do not know which node the Grafana container is running on, find the node listed under
[grafana-server]in the Ansible hosts file, usually located at/etc/ansible/hosts:Example
[grafana-server]
grafana
On the node where the Grafana container is running, change the password:
Syntax
podman exec CONTAINER_ID grafana-cli admin reset-admin-password --homepath "/usr/share/grafana" NEW_PASSWORDChange CONTAINER_ID to the ID of the Grafana container. Change NEW_PASSWORD to the desired Grafana password.
Example
[root@grafana ~]# podman exec 3f28b0309aee grafana-cli admin reset-admin-password --homepath "/usr/share/grafana" NewSecurePassword
t=2020-10-29T17:45:58+0000 lvl=info msg="Connecting to DB" logger=sqlstore dbtype=sqlite3
t=2020-10-29T17:45:58+0000 lvl=info msg="Starting DB migration" logger=migrator

Admin password changed successfully ✔
On the Ansible administration node, use
ansible-vaultto encrypt the Grafana password, and then add the encrypted password togroup_vars/all.yml.Change to the
/usr/share/ceph-ansible/directory:[admin@admin ~]$ cd /usr/share/ceph-ansible/Run
ansible-vaultand create a new vault password:Example
[admin@admin ceph-ansible]$ ansible-vault encrypt_string --stdin-name 'grafana_admin_password_vault'
New Vault password:
Re-enter the password to confirm it:
Example
[admin@admin ceph-ansible]$ ansible-vault encrypt_string --stdin-name 'grafana_admin_password_vault'
New Vault password:
Confirm New Vault password:
Enter the Grafana password, press enter, and then enter CTRL+D to complete the entry:
Syntax
ansible-vault encrypt_string --stdin-name 'grafana_admin_password_vault'
New Vault password:
Confirm New Vault password:
Reading plaintext input from stdin. (ctrl-d to end input)
NEW_PASSWORD
Replace NEW_PASSWORD with the Grafana password that was set earlier.
Example
[admin@admin ceph-ansible]$ ansible-vault encrypt_string --stdin-name 'grafana_admin_password_vault'
New Vault password:
Confirm New Vault password:
Reading plaintext input from stdin. (ctrl-d to end input)
NewSecurePassword
Take note of the output that begins with
grafana_admin_password_vault: !vault |and ends with a few lines of numbers, as it will be used in the next step:Example
[admin@admin ceph-ansible]$ ansible-vault encrypt_string --stdin-name 'grafana_admin_password_vault'
New Vault password:
Confirm New Vault password:
Reading plaintext input from stdin. (ctrl-d to end input)
NewSecurePassword
grafana_admin_password_vault: !vault |
          $ANSIBLE_VAULT;1.1;AES256
          38383639646166656130326666633262643836343930373836376331326437353032376165306234
          3161386334616632653530383231316631636462363761660a373338373334663434363865356633
          66383963323033303662333765383938353630623433346565363534636434643634336430643438
          6134306662646365370a343135316633303830653565633736303466636261326361333766613462
          39353365343137323163343937636464663534383234326531666139376561663532
Encryption successful
Open for editing
group_vars/all.ymland paste the output from above into the file:Example
grafana_admin_password_vault: !vault |
          $ANSIBLE_VAULT;1.1;AES256
          38383639646166656130326666633262643836343930373836376331326437353032376165306234
          3161386334616632653530383231316631636462363761660a373338373334663434363865356633
          66383963323033303662333765383938353630623433346565363534636434643634336430643438
          6134306662646365370a343135316633303830653565633736303466636261326361333766613462
          39353365343137323163343937636464663534383234326531666139376561663532
Add a line below the encrypted password with the following:
Example
grafana_admin_password: "{{ grafana_admin_password_vault }}"NoteUsing two variables as seen above is required due to a bug in Ansible that breaks the string type when assigning the vault value directly to the Ansible variable.
- Save and close the file.
Re-run
ansible-playbook.For container based deployments:
Example
[admin@node1 ceph-ansible]$ ansible-playbook --ask-vault-pass -v site-container.yml -i hostsNote that
-i hostsis only necessary if you are not using the default Ansible hosts file location of/etc/ansible/hosts.For bare-metal, RPM based deployments:
Example
[admin@node1 ceph-ansible]$ ansible-playbook --ask-vault-pass -v site.yml -i hostsNote that
-i hostsis only necessary if you are not using the default Ansible hosts file location of/etc/ansible/hosts.
2.9. Syncing users using Red Hat Single Sign-On for the dashboard
Administrators can provide access to users on Red Hat Ceph Storage Dashboard using Red Hat Single Sign-on (SSO) with Lightweight Directory Access Protocol (LDAP) integration.
Prerequisites
- A running Red Hat Ceph Storage cluster.
- Dashboard is installed.
- Admin level access to the dashboard.
- Users are added to the dashboard.
- Root-level access on all the nodes.
- Red hat Single Sign-On installed from a ZIP file. See the Installing Red Hat Single Sign-On from a zip file for additional information.
Procedure
- Download the Red Hat Single Sign-On 7.4.0 Server on the system where Red Hat Ceph Storage is installed.
Unzip the folder:
[root@cephuser]# unzip rhsso-7.4.0.zipNavigate to the
standalone/configurationdirectory and open thestandalone.xmlfor editing:[root@cephuser]# cd standalone/configuration [root@cephuser configuration]# vi standalone.xml-
Replace three instances of
localhostand two instances of127.0.0.1with the IP address of the machine where Red Hat Single Sign-On is installed. Optional: For Red Hat Enterprise Linux 8, users might get Certificate Authority (CA) issues. Import the custom certificates from CA and move them into the keystore with exact java version.
Example
[root@cephuser]# keytool -import -noprompt -trustcacerts -alias ca -file ../ca.cer -keystore /etc/java/java-1.8.0-openjdk/java-1.8.0-openjdk-1.8.0.272.b10-3.el8_3.x86_64/lib/security/cacertTo start the server from the
bindirectory ofrh-sso-7.4folder, run thestandaloneboot script:[root@cephuser bin]# ./standalone.shCreate the admin account in http:_IP_ADDRESS_:8080/auth with a username and password:
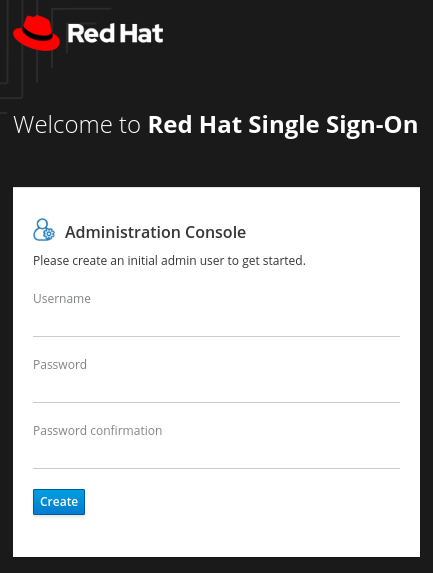 Note
NoteThe admin account has to be created only the first time you log into the console.
Log into the admin console with the credentials created:
To create a realm, click the Master drop-down. In this realm, administrators provide access to users and applications.

In the Add Realm window, enter a name for the realm and set the parameter Enabled to ON and click Create:
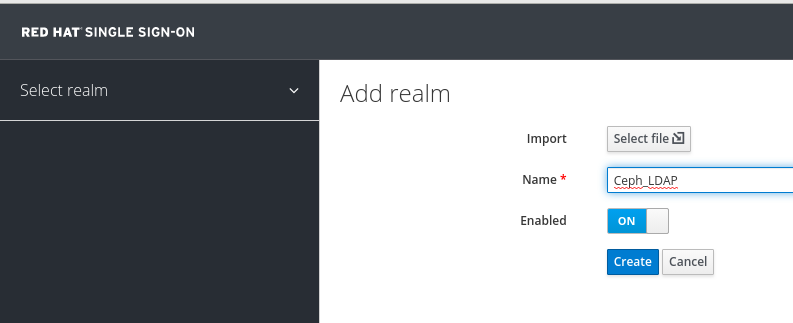 Note
NoteThe realm name is case-sensitive.
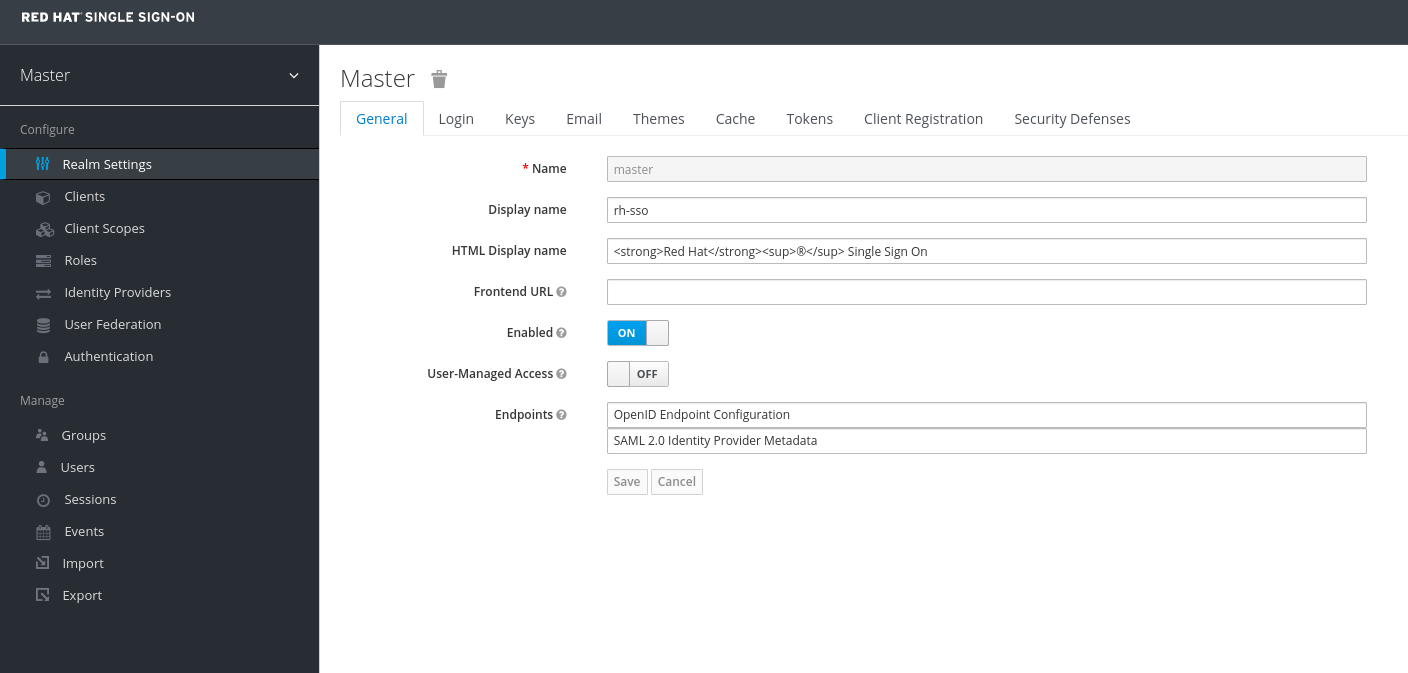
In the Realm Settings tab, set the following parameters and click Save:
- Enabled - ON
- User-Managed Access - ON
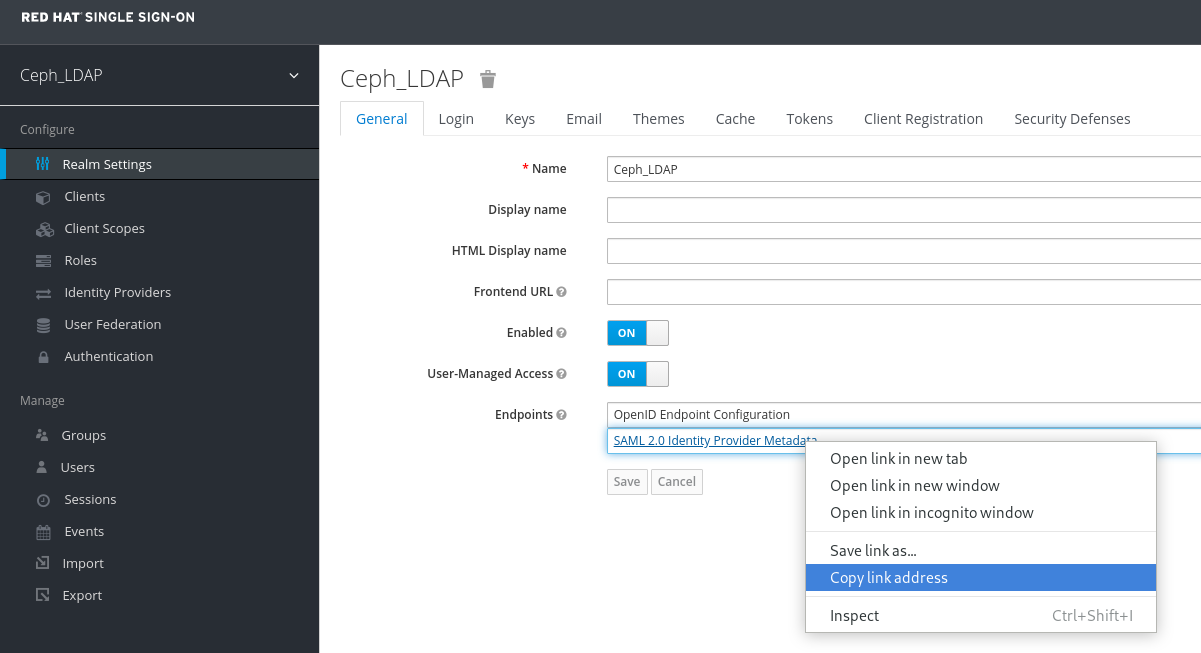
Copy the link address of SAML 2.0 Identity Provider Metadata
In the Clients tab, click Create:
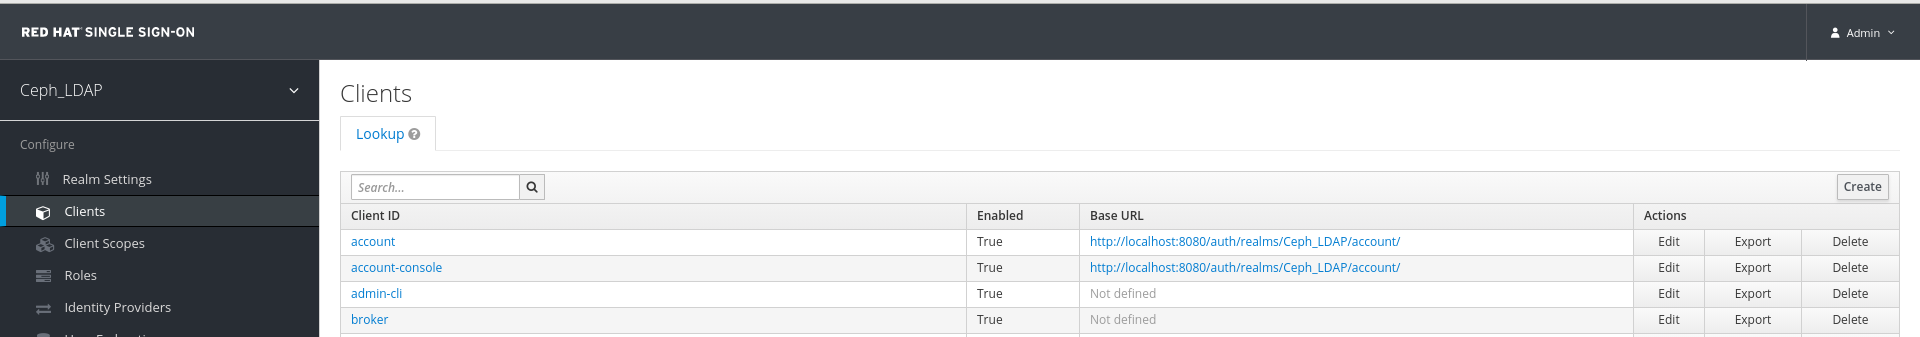
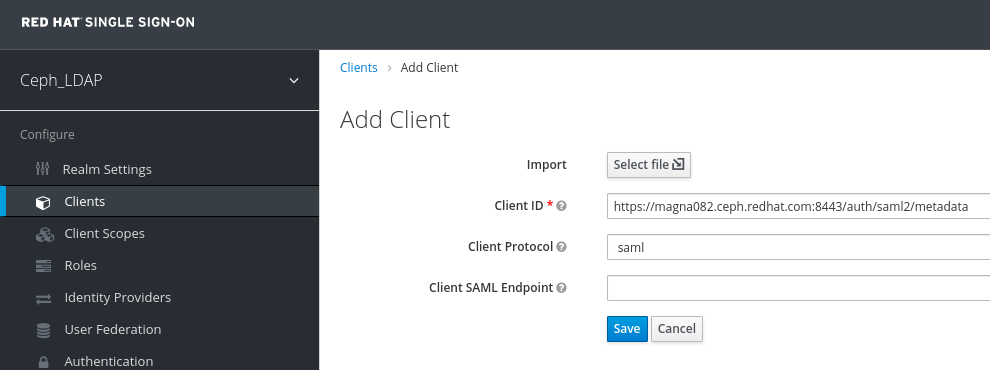
In the Add Client window, set the following parameters and click Save:
Client ID - BASE_URL:8443/auth/saml2/metadata
Example
https://magna082.ceph.redhat.com:8443/auth/saml2/metadata
Client Protocol - saml
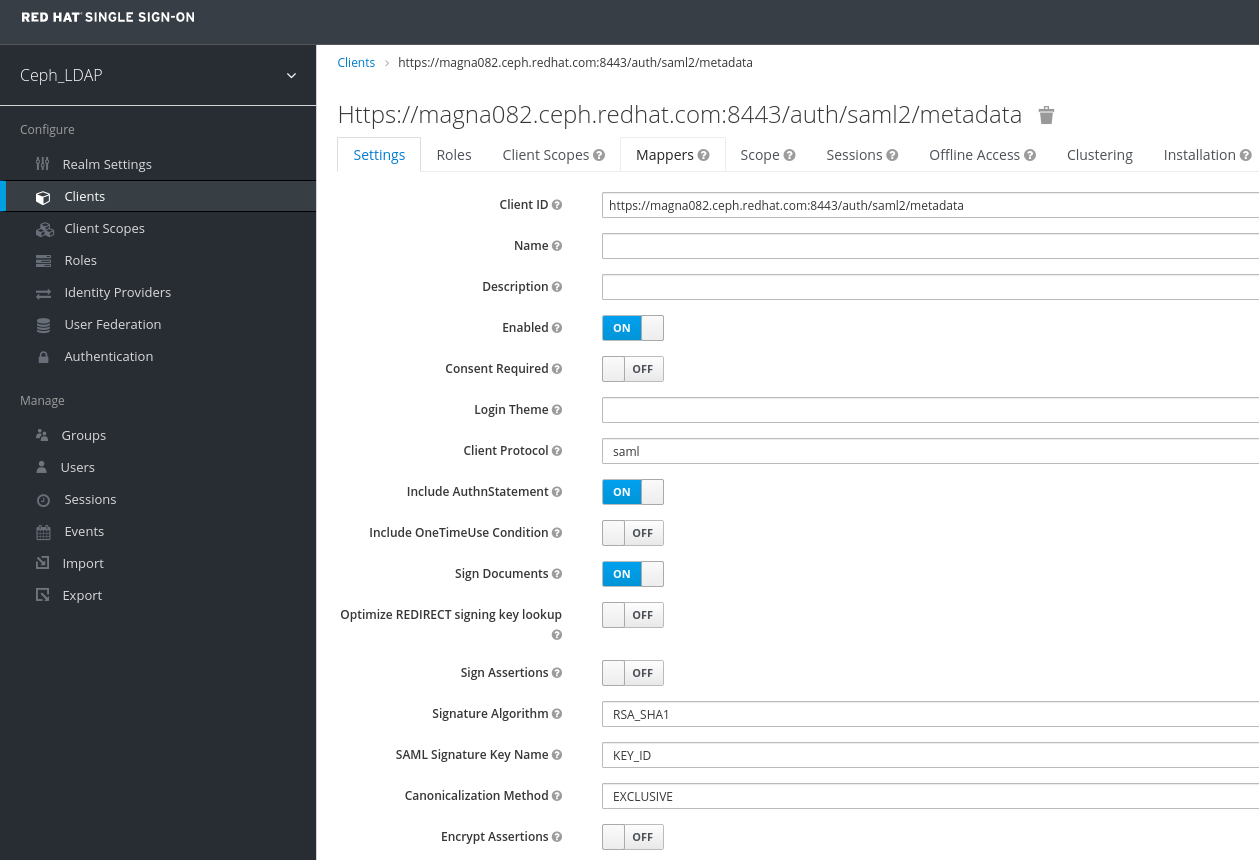
In the Clients window, under Settings tab, set the following parameters and click Save:
Client ID - BASE_URL:8443/auth/saml2/metadata
Example
https://magna082.ceph.redhat.com:8443/auth/saml2/metadata
- Enabled - ON
- Client Protocol - saml
- Include AuthnStatement - ON
- Sign Documents - ON
- Signature Algorithm - RSA_SHA1
- SAML Signature Key Name - KEY_ID
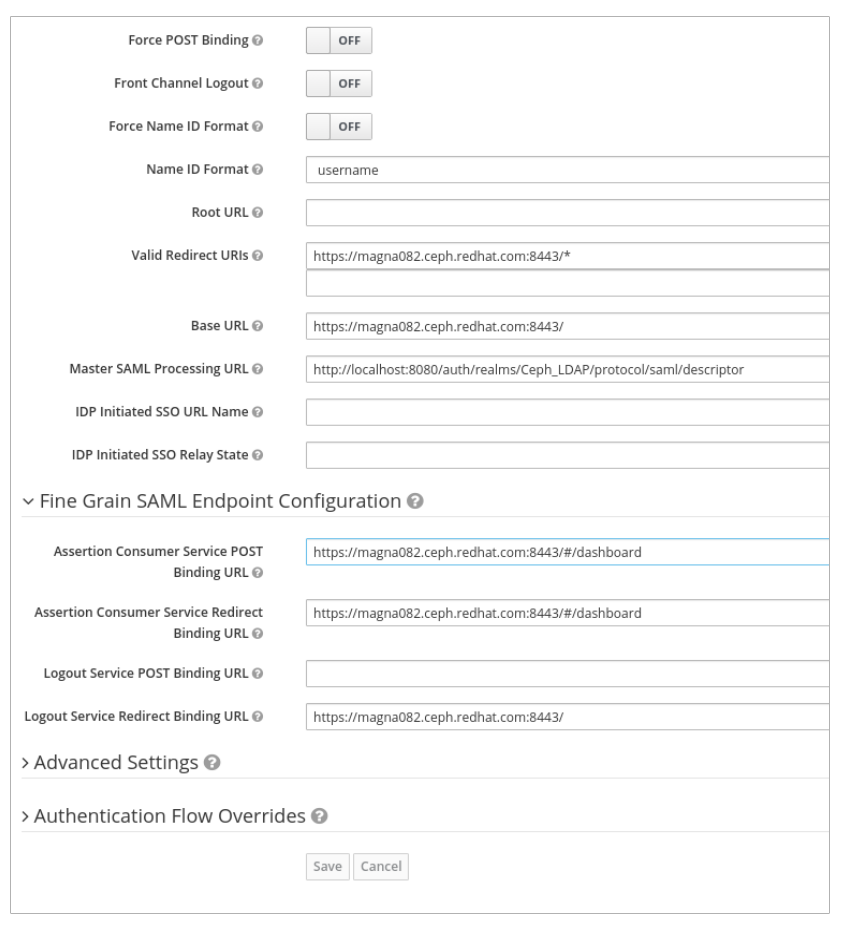
Valid Redirect URLs - BASE_URL:8443/*
Example
https://magna082.ceph.redhat.com:8443/*
Base URL - BASE_URL:8443
Example
https://magna082.ceph.redhat.com:8443/
Master SAML Processing URL - http://localhost:8080/auth/realms/REALM_NAME/protocol/saml/descriptor
Example
http://localhost:8080/auth/realms/Ceph_LDAP/protocol/saml/descriptor
NotePaste the link of SAML 2.0 Identity Provider Metadata from Realm Settings tab.
Under Fine Grain SAML Endpoint Configuration, set the parameters:
Assertion Consumer Service POST Binding URL - BASE_URL:8443/#/dashboard
Example
https://magna082.ceph.redhat.com:8443/#/dashboard
Assertion Consumer Service Redirect Binding URL - BASE_URL:8443/#/dashboard
Example
https://magna082.ceph.redhat.com:8443/#/dashboard
Logout Service Redirect Binding URL - BASE_URL:8443/
Example
https://magna082.ceph.redhat.com:8443/
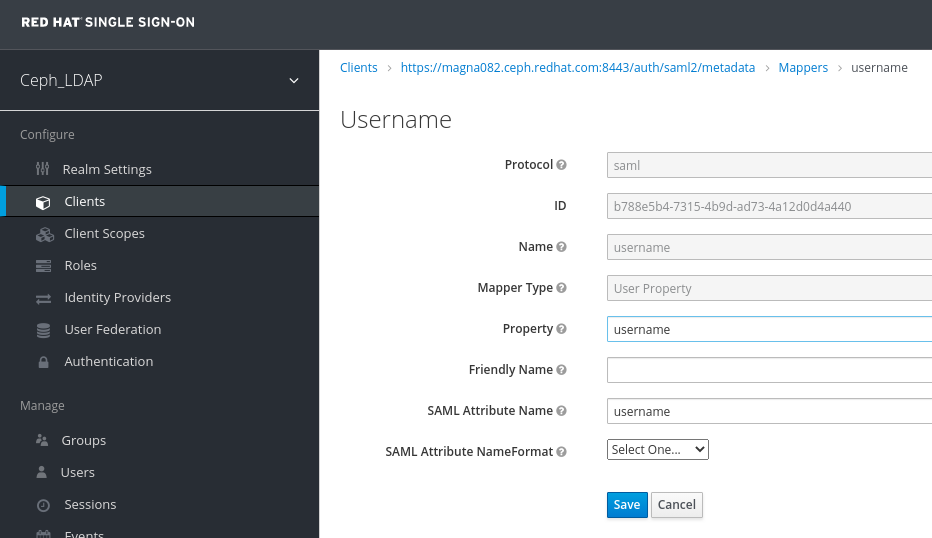
In the Clients window, Mappers tab, set the following parameters and click Save:
- Protocol - saml
- Name - username
- Mapper Property - User Property
- Property - username
SAML Attribute name - username
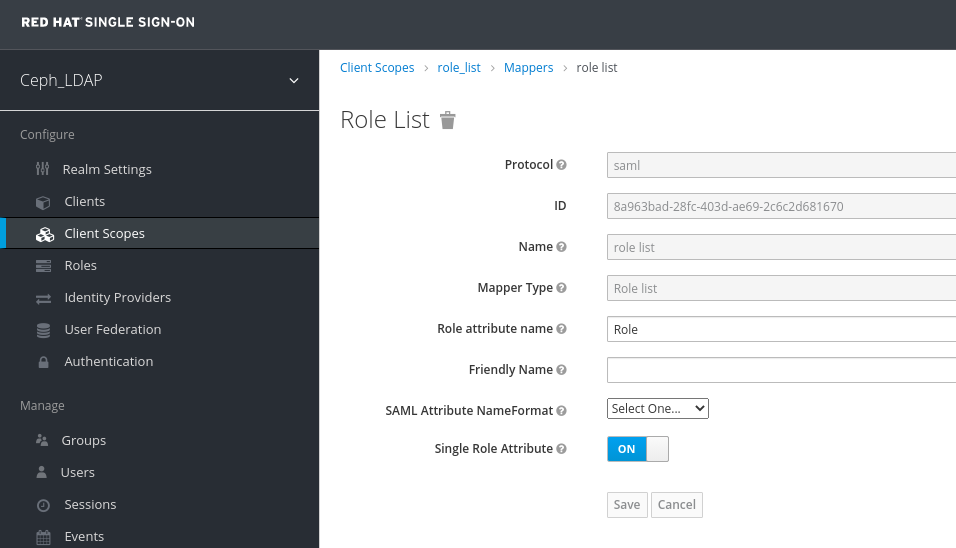
In the Clients Scope tab, select role_list:
In Mappers tab, select role list, set the Single Role Attribute to ON.
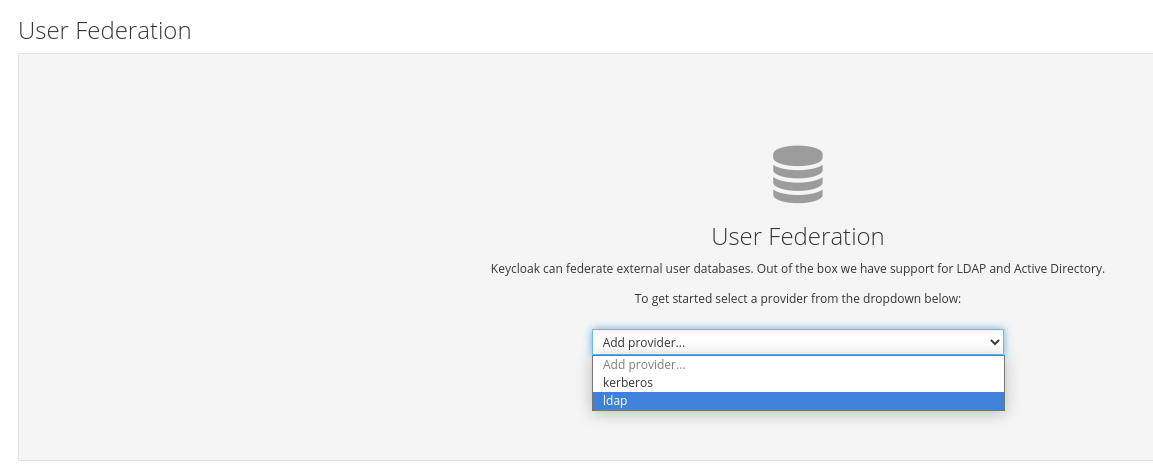
Select User_Federation tab:
In User Federation window, select ldap from the drop-down:
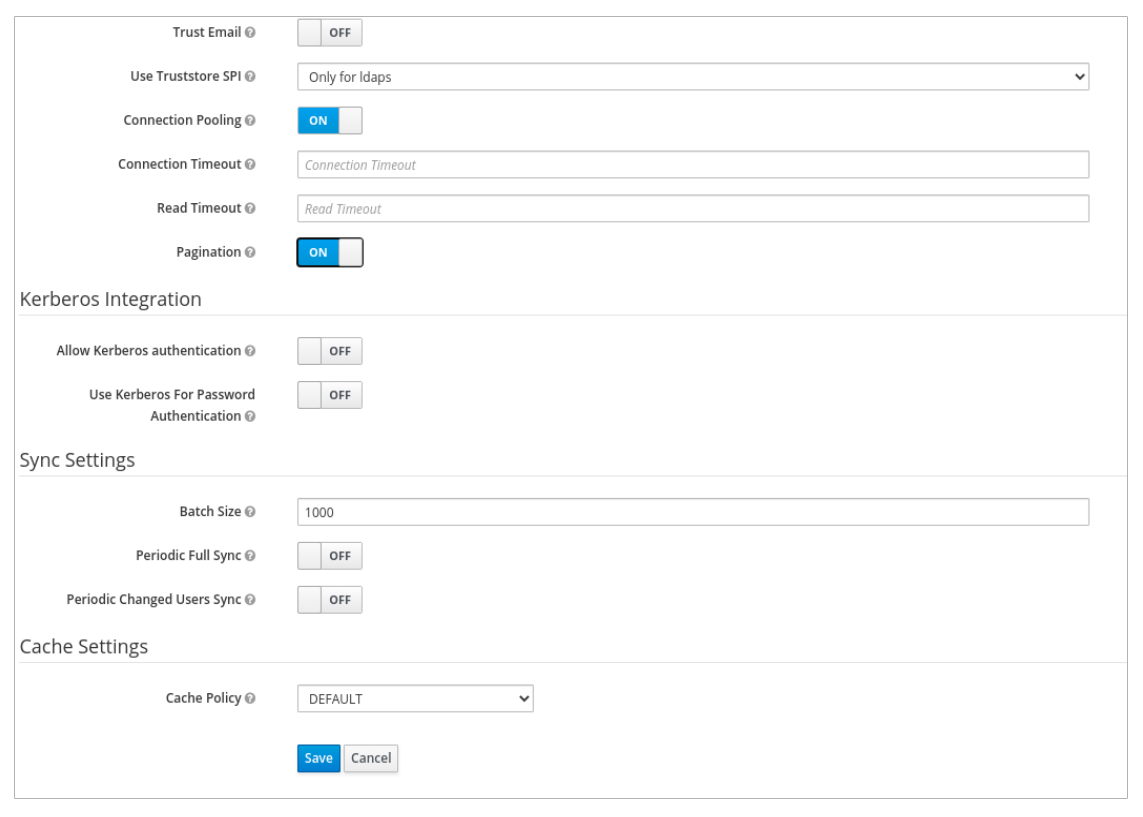
In User_Federation window, Settings tab, set the following parameters and click Save:
- Console Display Name - rh-ldap
- Import Users - ON
- Edit_Mode - READ_ONLY
- Username LDAP attribute - username
- RDN LDAP attribute - username
- UUID LDAP attribute - nsuniqueid
- User Object Classes - inetOrgPerson, organizationalPerson, rhatPerson
Connection URL - ldap:://myldap.example.com
Example
ldap://ldap.corp.redhat.com
Click Test Connection.
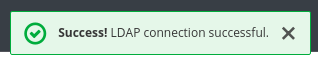
You will get a notification that the LDAP connection is successful.
Users DN - ou=users, dc=example, dc=com
Example
ou=users,dc=redhat,dc=com
Bind Type - simple
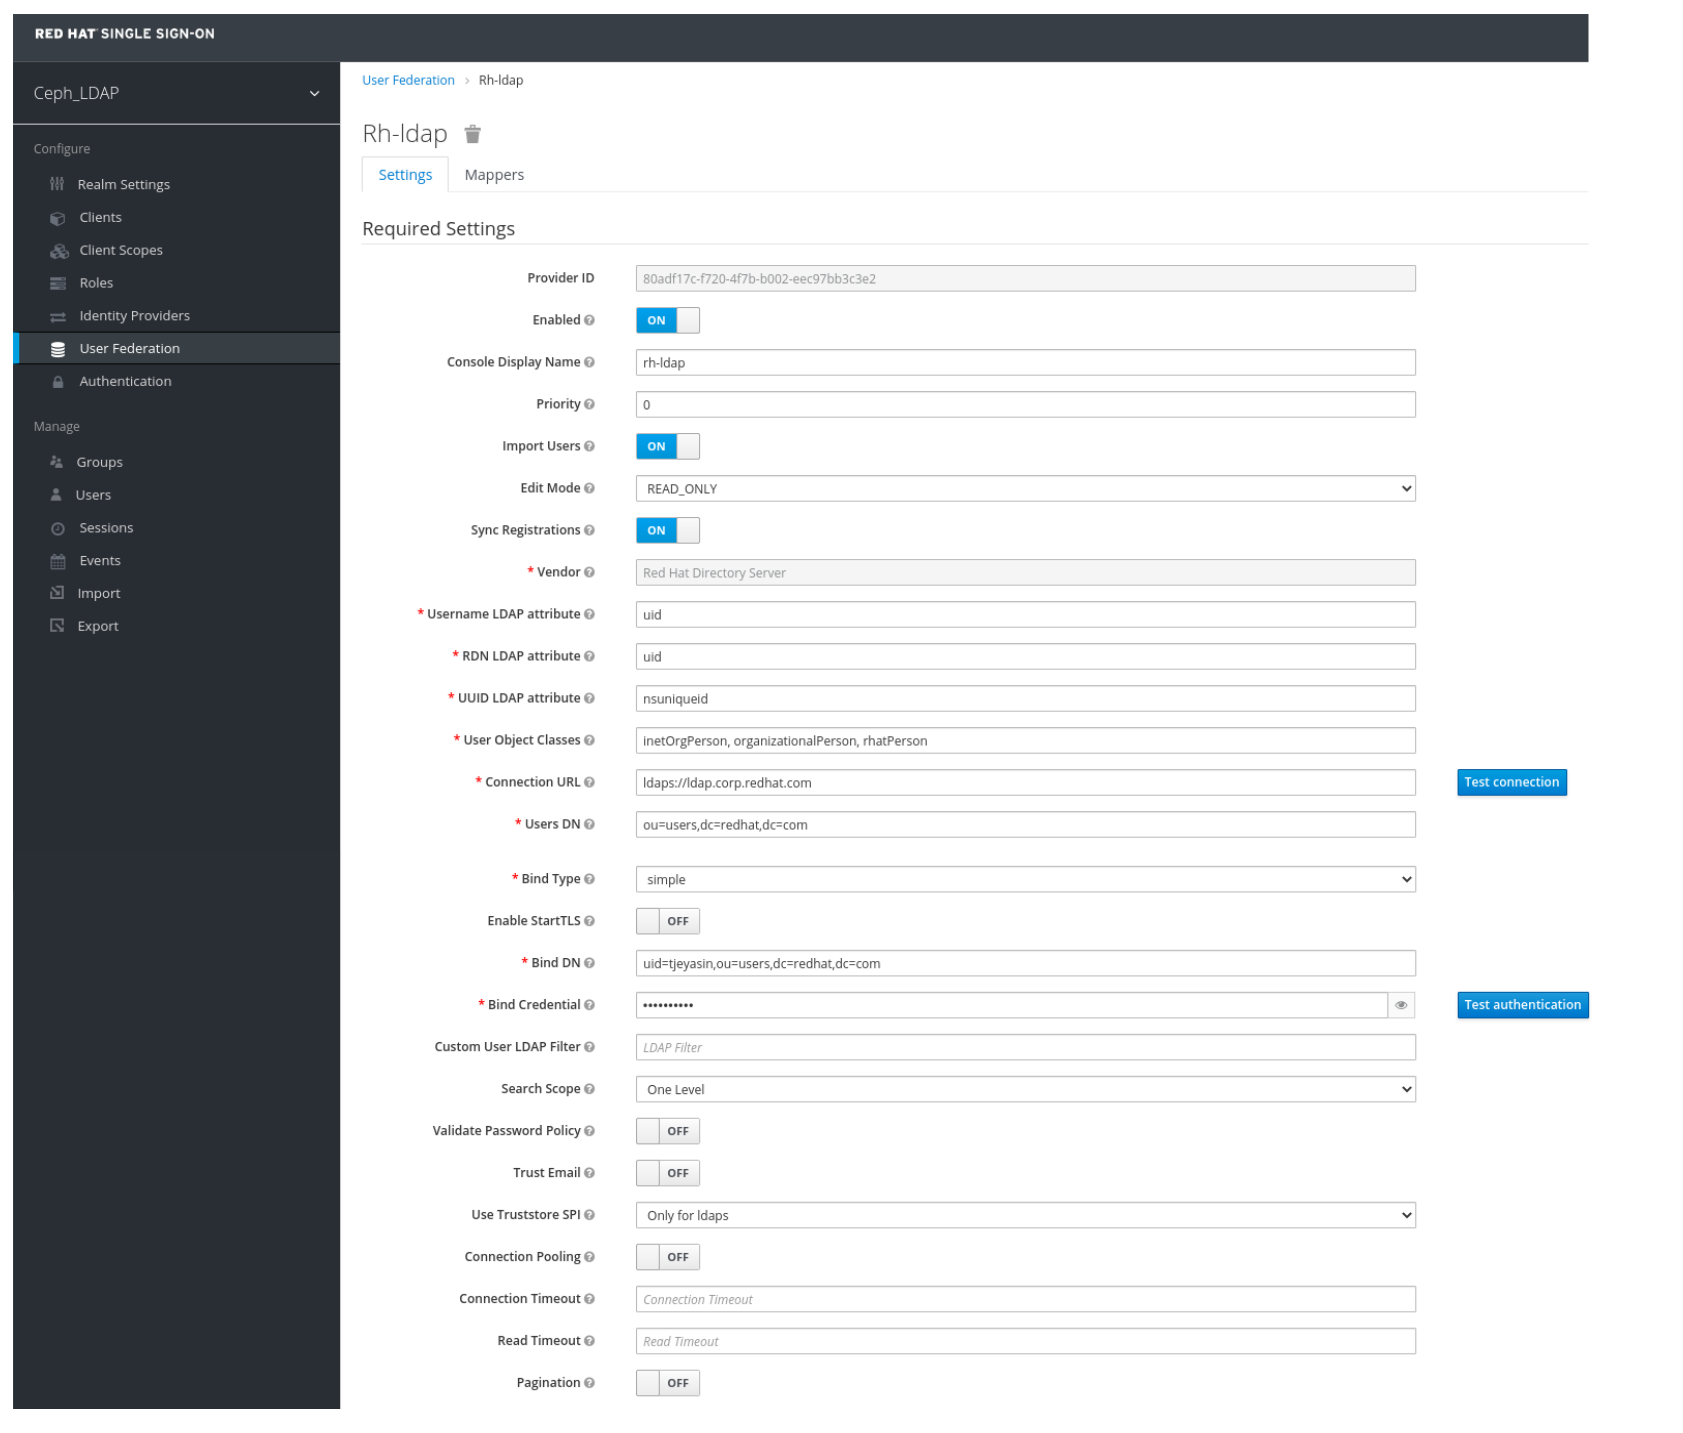
Click Test authentication.
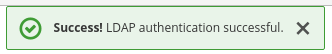
You will get a notification that the LDAP authentication is successful.
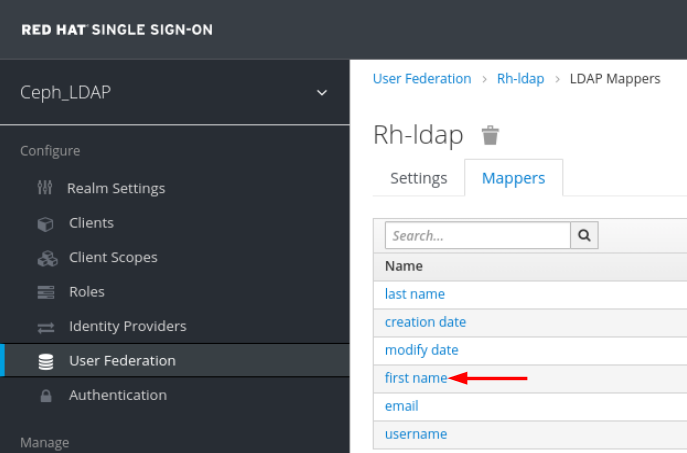
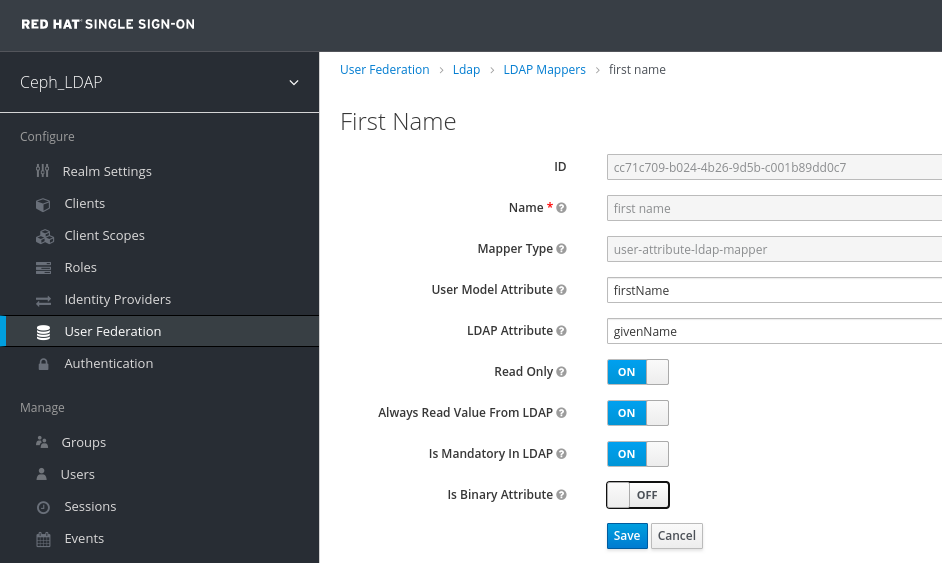
In Mappers tab, select first name row and edit the following parameter and Click Save:
LDAP Attribute - givenName
In User_Federation tab, Settings tab, Click Synchronize all users:
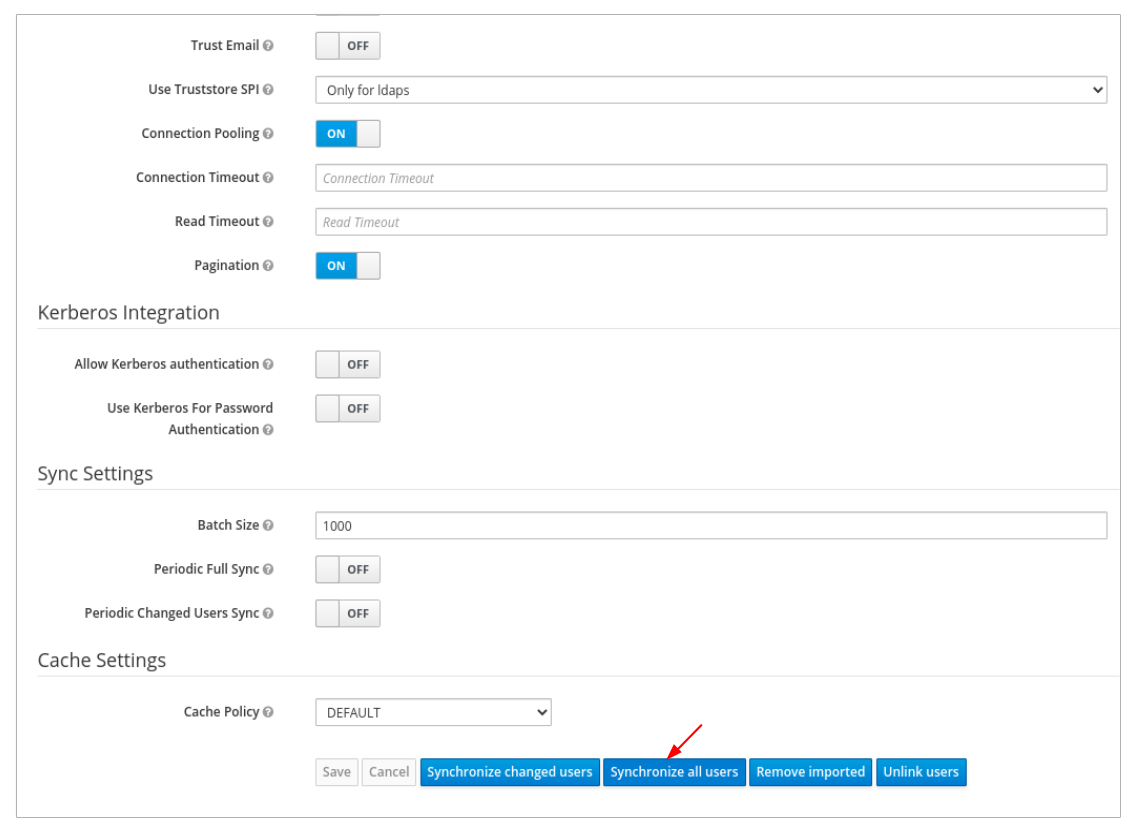
You will get a notification that the sync of users are updated successfully.

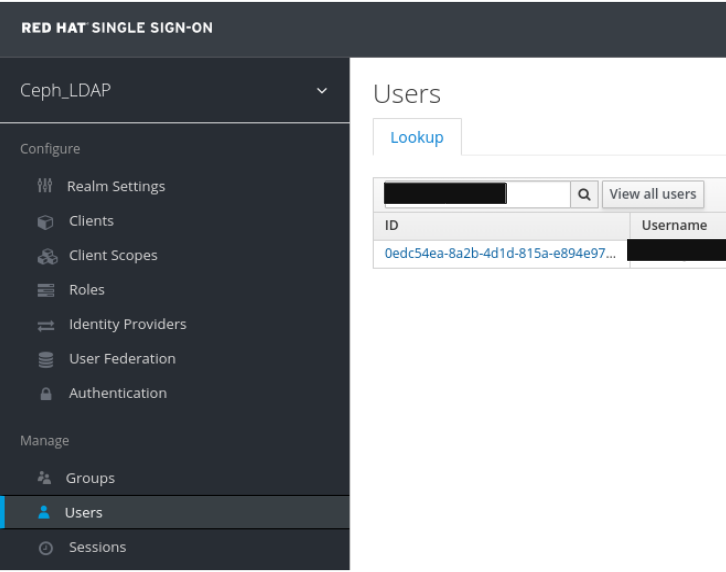
In the Users tab, search for the user added to the dashboard and click the Search icon:
To view the user , click it’s row. You should see the federation link as the name provided for the User Federation.
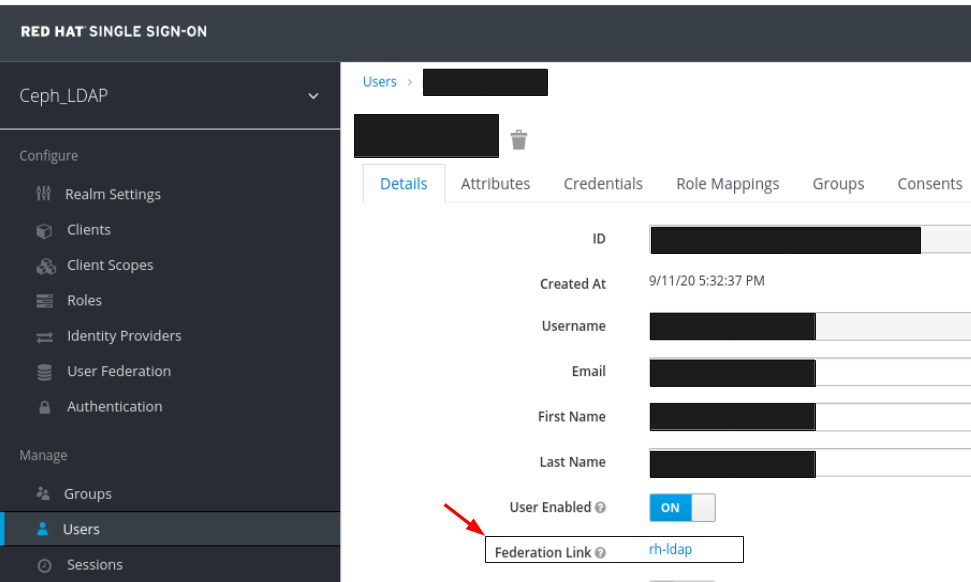 Important
Do not add users manually. If added manually, delete the user by clicking Delete.
Users added to the realm and the dashboard can access the Ceph dashboard with their mail address and password.
Example
https://magna082.ceph.redhat.com:8443
Additional Resources
- For adding users to the dashboard, see the Creating users on dashboard section in the Red Hat Ceph Storage Dashboard Guide for more information.
- For adding roles for users on the dashboard, see the Creating roles on dashboard section in the Red Hat Ceph Storage Dashboard Guide for more information.
2.10. Enabling Single Sign-On for the Ceph Dashboard
The Ceph Dashboard supports external authentication of users with the Security Assertion Markup Language (SAML) protocol. Before using single sign-On (SSO) with the Ceph dashboard, create the dashboard user accounts and assign the desired roles. The Ceph Dashboard performs authorization of the users and the authentication process is performed by an existing Identity Provider (IdP). Red Hat uses Keycloak to test the dashboard SSO feature.
Prerequisites
- A running Red Hat Ceph Storage cluster.
- Installation of the Ceph Dashboard software.
- Launch the Dashboard.
- Root-level access to the Ceph Manager nodes.
Installation of the following library packages on the Ceph Manager nodes:
-
python3-saml -
python3-defusedxml -
python3-isodate -
python3-xmlsec
-
Procedure
To configure SSO on Ceph Dashboard, run the following command:
Bare-metal deployments:
Syntax
ceph dashboard sso setup saml2 CEPH_DASHBOARD_BASE_URL IDP_METADATA IDP_USERNAME_ATTRIBUTE IDP_ENTITY_ID SP_X_509_CERT SP_PRIVATE_KEYExample
[root@mon ~]# ceph dashboard sso setup saml2 http://dashboard_hostname.ceph.redhat.com:8443 idp-metadata.xml username http://10.70.59.125:8080/auth/realms/realm_name /home/certificate.txt /home/private-key.txtContainer deployments:
Syntax
podman exec CEPH_MGR_NODE ceph dashboard sso setup saml2 CEPH_DASHBOARD_BASE_URL IDP_METADATA IDP_USERNAME_ATTRIBUTE IDP_ENTITY_ID SP_X_509_CERT SP_PRIVATE_KEYExample
[root@mon ~]# podman exec ceph-mgr-hostname ceph dashboard sso setup saml2 http://dashboard_hostname.ceph.redhat.com:8443 idp-metadata.xml username http://10.70.59.125:8080/auth/realms/realm_name /home/certificate.txt /home/private-key.txt
Replace
-
CEPH_MGR_NODE with Ceph
mgrnode. For example,ceph-mgr-hostname - CEPH_DASHBOARD_BASE_URL with the base URL where Ceph Dashboard is accessible.
- IDP_METADATA with the URL to remote or local path or content of the IdP metadata XML. The supported URL types are http, https, and file.
- Optional: IDP_USERNAME_ATTRIBUTE with the attribute used to get the username from the authentication response. Defaults to uid.
- Optional: IDP_ENTITY_ID with the IdP entity ID when more than one entity ID exists on the IdP metadata.
- Optional: SP_X_509_CERT with the file path of the certificate used by Ceph Dashboard for signing and encryption.
- Optional: SP_PRIVATE_KEY with the file path of the private key used by Ceph Dashboard for signing and encryption.
Verify the current SAML 2.0 configuration:
Bare-metal deployments:
Syntax
ceph dashboard sso show saml2Container deployments:
Syntax
podman exec CEPH_MGR_NODE ceph dashboard sso show saml2
To enable SSO, run the following command:
Bare-metal deployments:
Syntax
ceph dashboard sso enable saml2
SSO is "enabled" with "SAML2" protocol.
Container deployments:
Syntax
podman exec CEPH_MGR_NODE ceph dashboard sso enable saml2
SSO is "enabled" with "SAML2" protocol.
Open your dashboard URL. For example:
http://dashboard_hostname.ceph.redhat.com:8443- On the SSO page, enter the login credentials. SSO redirects to the dashboard web interface.
Additional Resources
- To disable single sign-on, see Disabling Single Sign-on for the Ceph Dashboard in the Red Hat Ceph StorageDashboard Guide.
2.11. Disabling Single Sign-On for the Ceph Dashboard
You can disable single sign on for Ceph Dashboard.
Prerequisites
- A running Red Hat Ceph Storage cluster.
- Installation of the Ceph Dashboard software.
- Launch the Dashboard.
- Root-level access to the Ceph Manager nodes.
- Single sign-on enabled for Ceph Dashboard
Installation of the following library packages on the Ceph Manager nodes:
-
python3-saml -
python3-defusedxml -
python3-isodate -
python3-xmlsec
-
Procedure
To view status of SSO, run the following command:
Bare-metal deployments:
Syntax
ceph dashboard sso status
SSO is "enabled" with "SAML2" protocol.
Container deployments:
Syntax
podman exec CEPH_MGR_NODE ceph dashboard sso status
SSO is "enabled" with "SAML2" protocol.
Replace
-
CEPH_MGR_NODE with Ceph
mgrnode. For example,ceph-mgr-hostname
-
CEPH_MGR_NODE with Ceph
To disable SSO, run the following command:
Bare-metal deployments:
Syntax
ceph dashboard sso disable
SSO is "disabled".
Container deployments:
Syntax
podman exec CEPH_MGR_NODE ceph dashboard sso disable
SSO is "disabled".
Replace
-
CEPH_MGR_NODE with Ceph
mgrnode. For example,ceph-mgr-hostname
-
CEPH_MGR_NODE with Ceph
Additional Resources
- To enable single sign-on, see Enabling Single Sign-on for the Ceph Dashboard in the Red Hat Ceph StorageDashboard Guide.
Chapter 3. Managing roles on dashboard
As a storage administrator, you can create, view, edit, and delete roles on the dashboard. You can give permissions to the roles and you can assign specific roles for users.
3.1. Creating roles on dashboard
The dashboard allows you to create roles on the dashboard which can be assigned to the users.
Prerequisites
- A running Red Hat Ceph Storage cluster.
- Dashboard is installed.
- Admin level of access to the Dashboard.
Procedure
- Log in to the Dashboard.
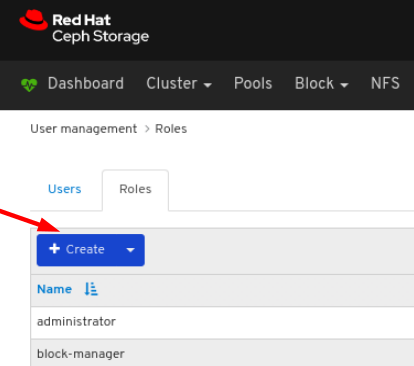
On the upper right side of the Dashboard, click the gear icon and select User management:
On Roles tab, click the Create button:
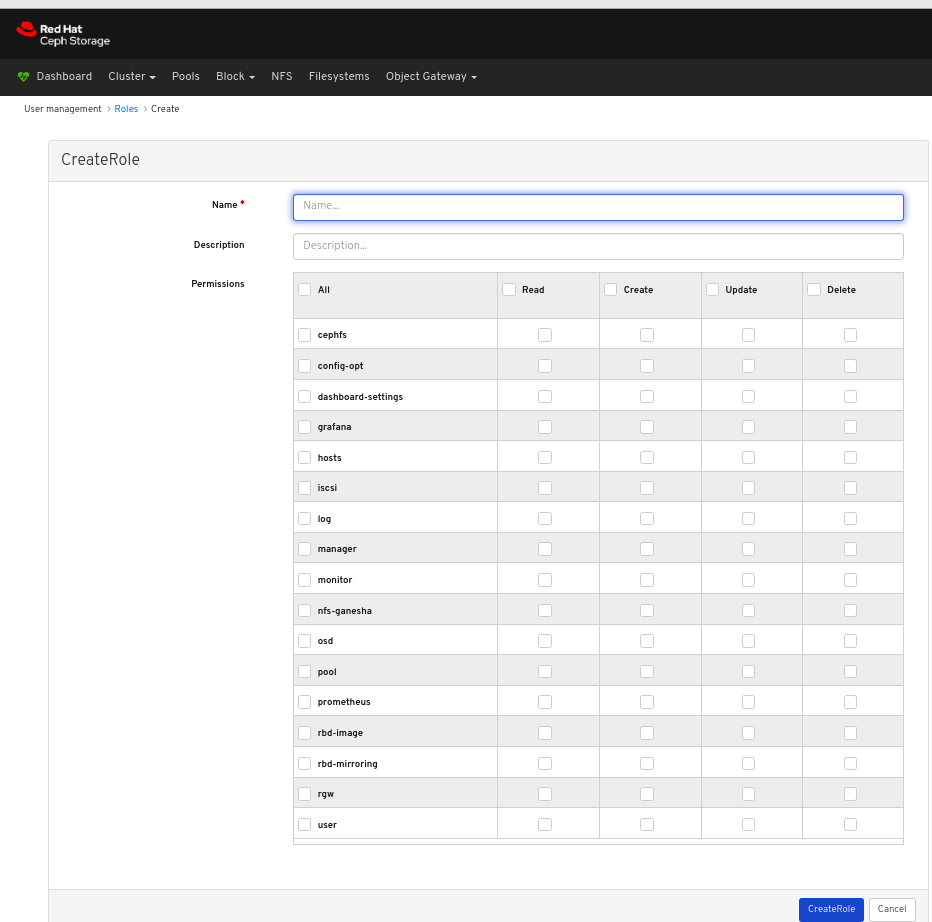
In the CreateRole window, set the Name and select the Permissions for this role, and then click the CreateRole button:
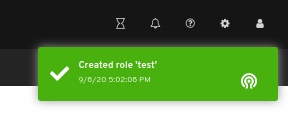
A notification towards the top right corner of the page indicates the role was created successfully.
3.2. Viewing roles on dashboard
The dashboard allows you to view the details of the roles on the dashboard.
Prerequisites
- A running Red Hat Ceph Storage cluster.
- Dashboard is installed.
- Admin level of access to the dashboard.
- Roles are created on the dashboard.
Procedure
- Log in to the Dashboard.
On the upper right side of the Dashboard, click the gear icon and select User management:
To view the details of the role, click the row:
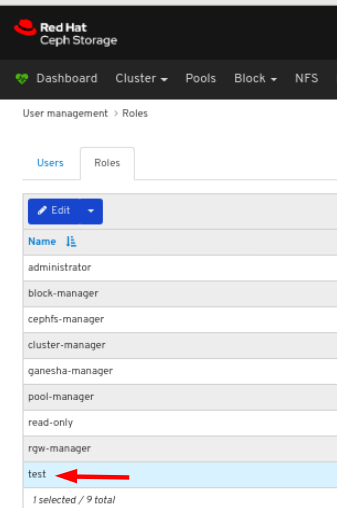
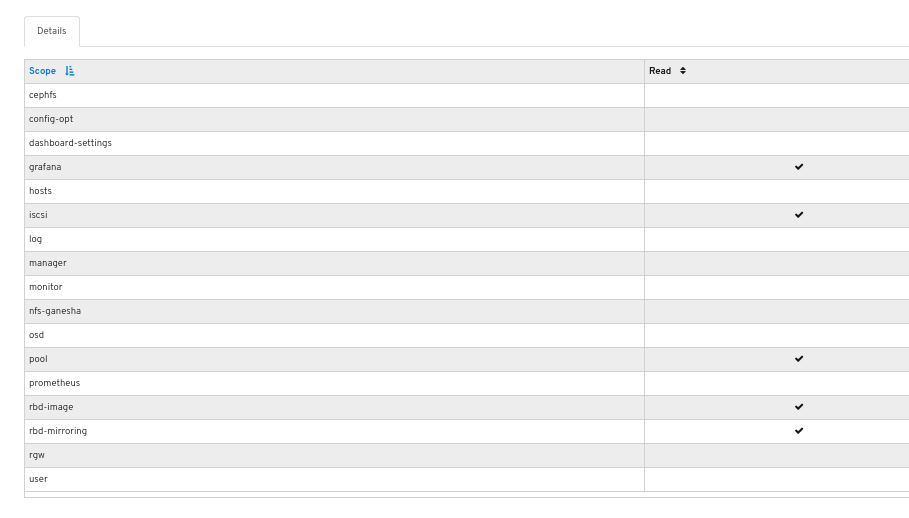
You can see the details of the permissions provided for the roles.
Additional Resources
- See the Creating roles on the dashboard section in the Red Hat Ceph Storage Dashboard Guide for more details.
3.3. Editing roles on dashboard
The dashboard allows you to edit roles on the dashboard.
Prerequisites
- A running Red Hat Ceph Storage cluster.
- Dashboard is installed.
- Admin level of access to the Dashboard.
- A role is created on the dashboard.
Procedure
- Log in to the Dashboard.
On the upper right side of the Dashboard, click the gear icon and select User management:
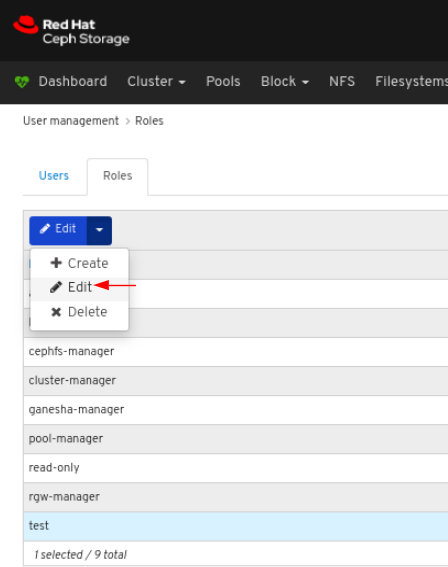
To edit the role, click the row:
On the Roles tab, select Edit from the Edit dropdown menu:
In the EditRole window, edit parameters including, and then click the EditRole button:
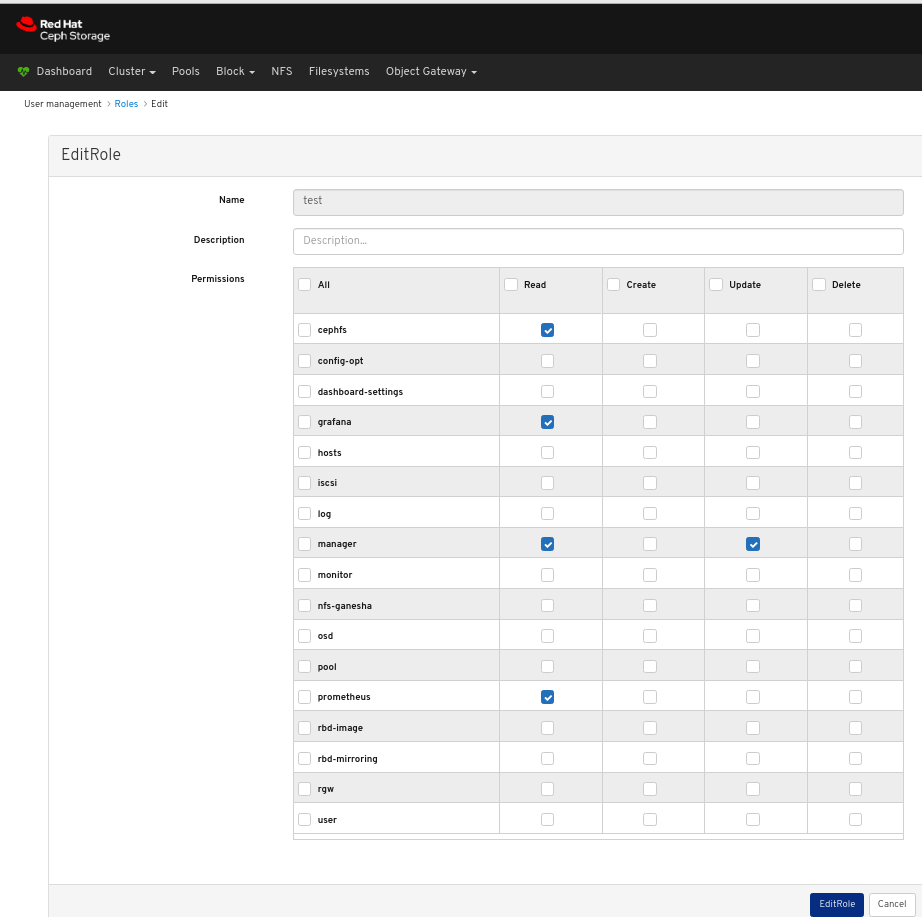
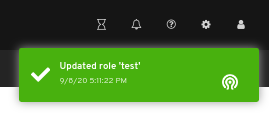
A notification towards the top right corner of the page indicates the role was updated successfully.
Additional Resources
- See the Creating roles on the dashboard section in the Red Hat Ceph Storage Dashboard Guide for more details.
3.4. Deleting roles on dashboard
The dashboard allows you to delete roles on the dashboard.
You can only delete the roles that you have created.
Prerequisites
- A running Red Hat Ceph Storage cluster.
- Dashboard is installed.
- Admin level of access to the Dashboard.
- A role is created on the dashboard.
Procedure
- Log in to the Dashboard.
On the upper right side of the Dashboard, click the gear icon and select User management:
To delete the role, click the row:
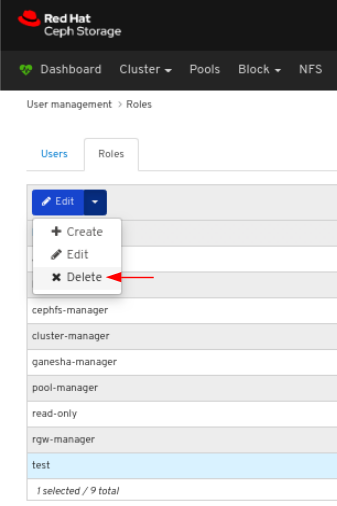
On Roles tab, select Delete from the Edit dropdown menu:
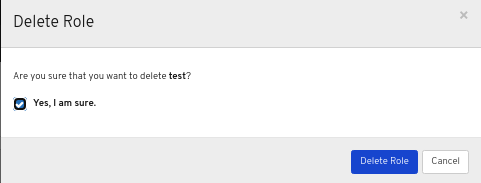
In the Delete Role dialog window, Click the Yes, I am sure box and then Click Delete Role to save the settings:
Additional Resources
- See the Creating roles on the dashboard section in the Red Hat Ceph Storage Dashboard Guide for more details.
Chapter 4. Managing users on dashboard
As a storage administrator, you can create, edit, and delete users on the dashboard.
4.1. Creating users on dashboard
The dashboard allows you to create users on the dashboard.
Prerequisites
- A running Red Hat Ceph Storage cluster.
- Dashboard is installed.
- Admin level of access to the Dashboard.
The Red Hat Ceph Storage Dashboard does not support any email verification when changing a users password. This behavior is intentional, because the Dashboard supports Single Sign-On (SSO) and this feature can be delegated to the SSO provider.
Procedure
- Log in to the Dashboard.
On the upper right side of the Dashboard, click the gear icon and select User management:
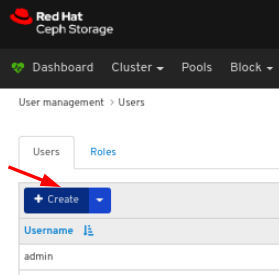
On Users tab, click the Create button:
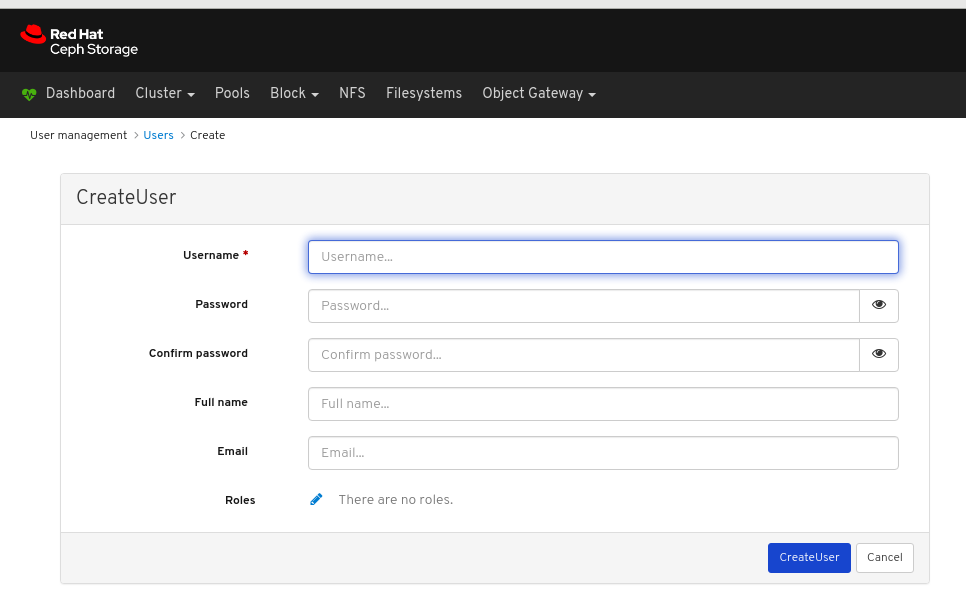
In the CreateUser window, set the Username and other parameters including the roles, and then click the _CreateUser_button:
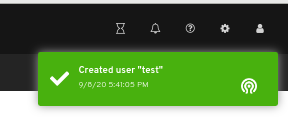
A notification towards the top right corner of the page indicates the user was created successfully.
Additional Resources
- See the Creating roles on dashboard section in the Red Hat Ceph Storage Dashboard Guide for more details.
4.2. Editing users on dashboard
The dashboard allows you to edit users on the dashboard.
Prerequisites
- A running Red Hat Ceph Storage cluster.
- Dashboard is installed.
- Admin level of access to the Dashboard.
- User created on the dashboard.
Procedure
- Log in to the Dashboard.
On the upper right side of the Dashboard, click the gear icon and select User management:
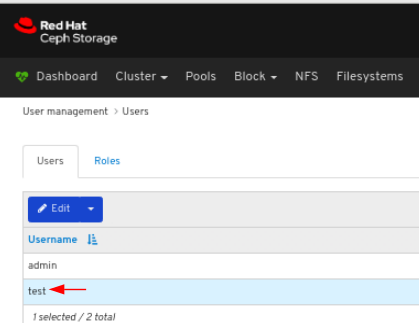
To edit the user, click the row:
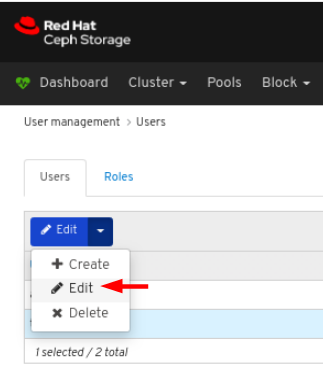
On Users tab, select Edit from the Edit dropdown menu:
In the EditUser window, edit parameters including, and then click the EditUser button:
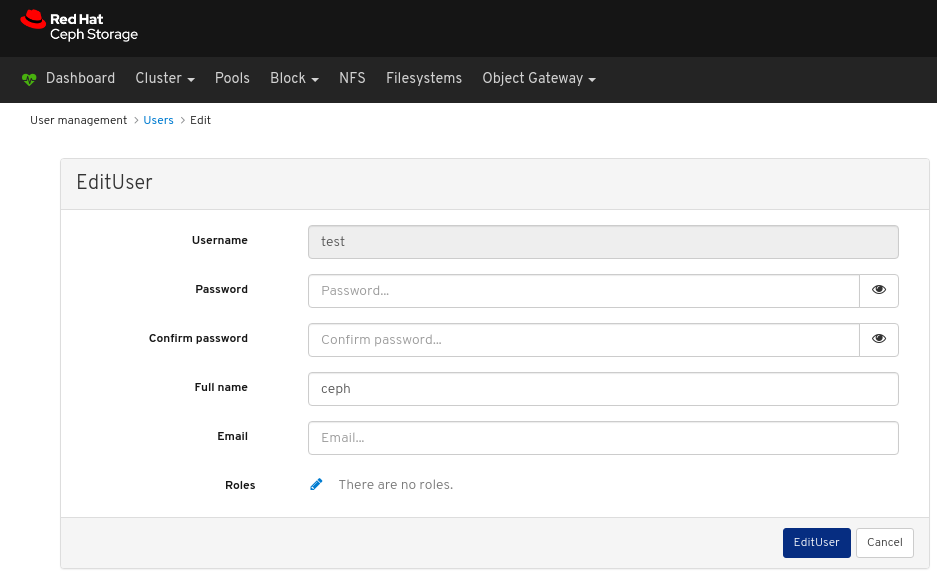
A notification towards the top right corner of the page indicates the user was updated successfully.

Additional Resources
- See the Creating users on the dashboard section in the Red Hat Ceph Storage Dashboard Guide for more details.
4.3. Deleting users on dashboard
The dashboard allows you to delete users on the dashboard.
Prerequisites
- A running Red Hat Ceph Storage cluster.
- Dashboard is installed.
- Admin level of access to the Dashboard.
- User created on the dashboard.
Procedure
- Log in to the Dashboard.
On the upper right side of the Dashboard, click the gear icon and select User management:
To delete the user, click the row:
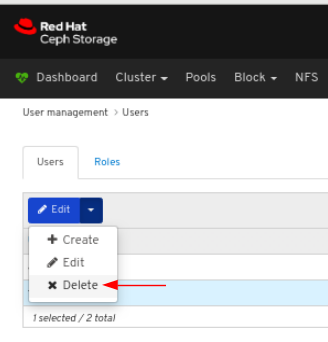
On Users tab, select Delete from the Edit dropdown menu:
In the Delete User dialog window, Click the Yes, I am sure box and then Click Delete user to save the settings:

Additional Resources
- See the Creating users on the dashboard section in the Red Hat Ceph Storage Dashboard Guide for more details.
Chapter 5. Monitoring the cluster
The monitoring functions of the dashboard provide different web pages which update regularly to indicate various aspects of the storage cluster. You can monitor the overall state of the cluster using the landing page, or you can monitor specific functions of the cluster, like the state of block device images.
Additional Resources
- For more information, see Accessing the landing page in the Dashboard guide.
- For more information, see Understanding the landing page in the Dashboard guide.
- For more information, see Monitoring specific functions in the Dashboard guide.
5.1. Accessing the landing page
After you log in to the dashboard, the landing page loads.
Prerequisites
- A running Red Hat Ceph Storage cluster.
- Dashboard is installed.
Procedure
Log in to the Dashboard:
After you log in to the dashboard, the landing page loads:
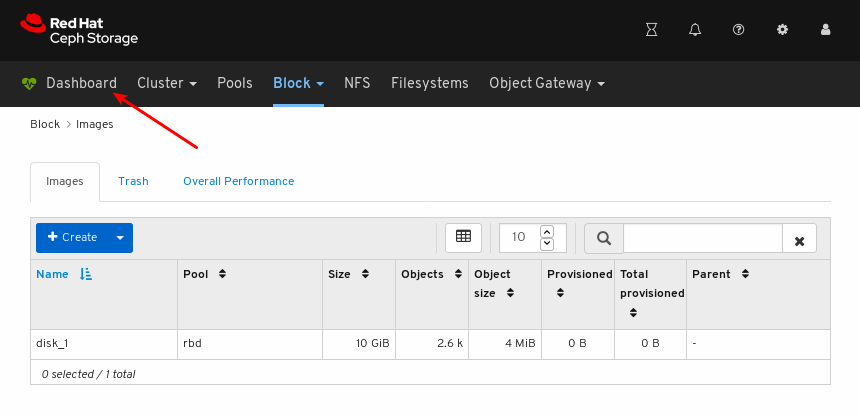
To return to the landing page after viewing other dashboard pages, click Dashboard towards the top left corner of the page:
Additional Resources
- For more information, see Understanding the landing page in the Dashboard guide.
- For more information, see Monitoring specific functions in the Dashboard guide.
5.2. Understanding the landing page
The landing page displays an overview of the entire Ceph cluster using individual panels. Each panel displays specific information about the state of the cluster.
Categories
The landing page orgnanizes panels into the following three categories:
- Status
- Capacity
- Performance
Status panels
The status panels display the health of the cluster and host and daemon states.
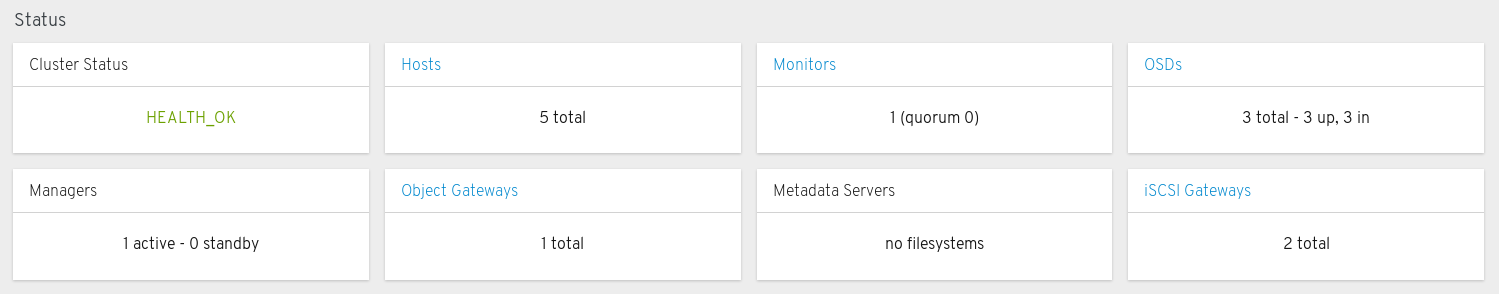
Cluster Status: Displays the current health status of the Ceph cluster.
Hosts: Displays the total number of hosts in the Ceph storage cluster.
Monitors: Displays the number of Ceph Monitors and the quorum status.
OSDs: Displays the total number of OSDs in the Ceph Storage cluster and the number that are up, and in.
Managers: Displays the number and status of the Manager Daemons.
Object Gateways: Displays the number of Object Gateways in the Ceph storage cluster.
Metadata Servers: Displays the number and status of metadata servers for Ceph Filesystems.
iSCSI Gateways: Displays the number of iSCSI Gateways in the Ceph storage cluster.
Capacity panels
The capacity panels display storage usage metrics.
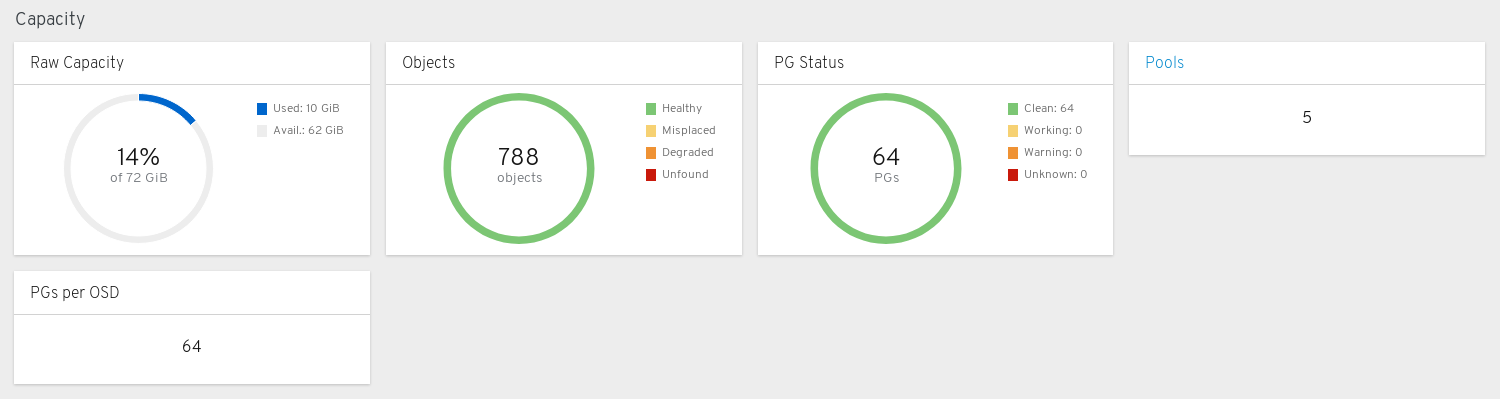
Raw Capacity: Displays the utilization and availability of the raw storage capacity of the cluster.
Objects: Displays the total number of Objects in the pools and a graph dividing objects into states of Healthy, Misplaced, Degraded, or Unfound.
PG Status: Displays the total number of Placement Groups and a graph dividing PGs into states of Clean, Working, Warning, or Unknown. To simplify display of PG states Working and Warning actually each encompass multiple states.
The Working state includes PGs with any of these states:
- activating
- backfill_wait
- backfilling
- creating
- deep
- degraded
- forced_backfill
- forced_recovery
- peering
- peered
- recovering
- recovery_wait
- repair
- scrubbing
- snaptrim
- snaptrim_wait
The Warning state includes PGs with any of these states:
- backfill_toofull
- backfill_unfound
- down
- incomplete
- inconsistent
- recovery_toofull
- recovery_unfound
- remapped
- snaptrim_error
- stale
- undersized
Pools: Displays the number of storage pools in the Ceph cluster.
PGs per OSD: Displays the number of Placement Groups per OSD.
Performance panels
The performance panels display information related to data transfer speeds.
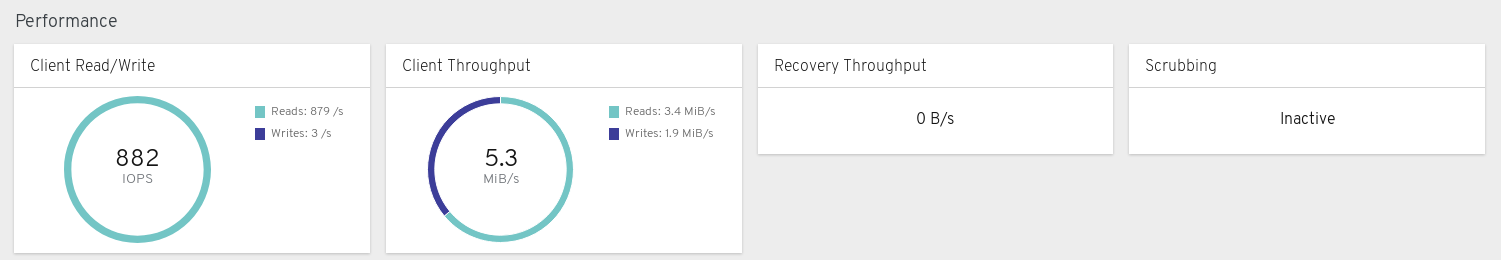
Client Read/Write: Displays total input/output opreations per second, reads per second, and writes per second.
Client Throughput: Displays total client throughput, read throughput, and write throughput.
Recovery Throughput: Displays the Client recovery rate.
Scrubbing: Displays whether Ceph is scrubbing data to verify its integrity.
Additional Resources
- For more information, see Accessing the landing page in the Dashboard guide.
- For more information, see Monitoring specific functions in the Dashboard guide.
Chapter 6. Monitoring specific functions
As a storage administrator, you can use Red Hat Ceph Storage Dashboard to monitor specific aspects of the cluster based on type of host, services, data access method, and more.
6.1. Monitoring monitors
The Red Hat Ceph Storage Dashboard allows you to view various details about Monitor nodes.
Prerequisites
- A running Red Hat Ceph Storage cluster.
- Dashboard is installed.
Procedure
- Log in to the Dashboard.
- On the navigation bar, click Cluster and then click Monitors.
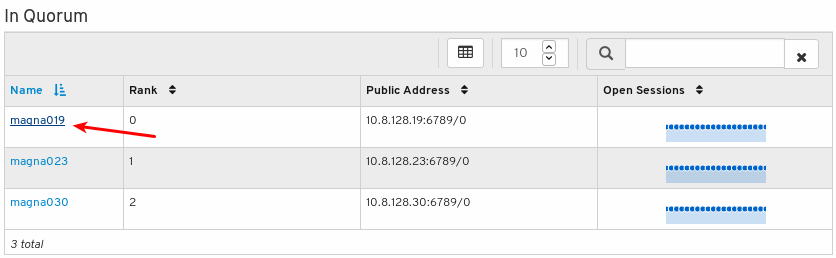
The Monitors overview page displays information about the overall monitor status as well as tables of in Quorum and Not in quorum Monitor nodes:
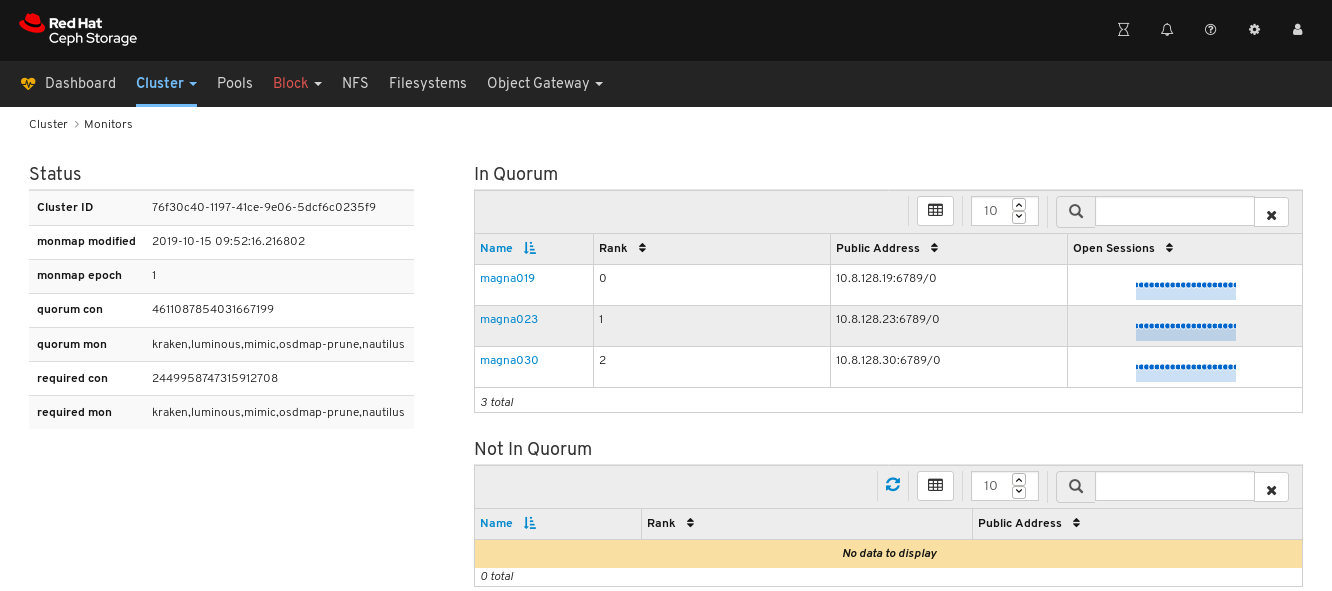
To see the number of open sessions, hover the cursor over the blue dotted trail:

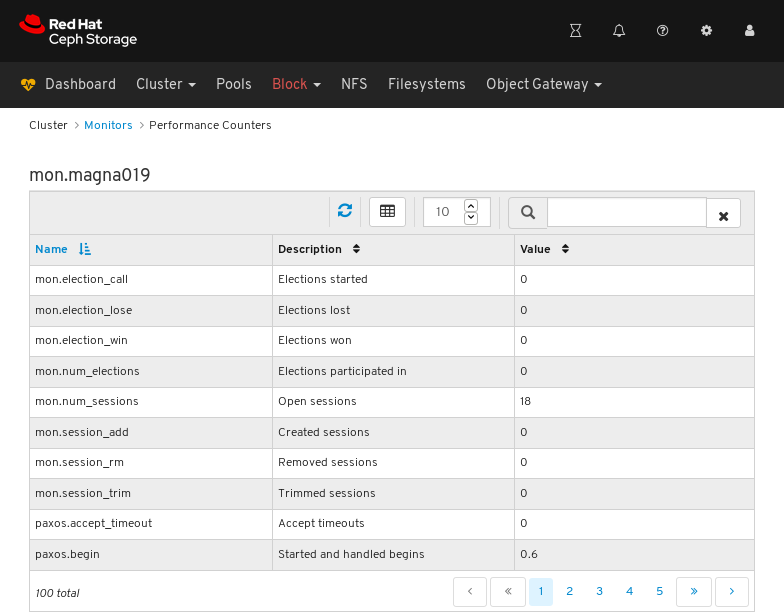
To see performance counters for any monitor, click its host name:
View the performance counters:
Additional Resources
- For more information about Monitors, see Ceph monitors in the Operations guide.
- For more information about performance counters, see Performance counters in the Administration Guide
6.2. Monitoring Hosts
The Red Hat Ceph Storage Dashboard allows you to view various details about hosts.
Prerequisites
- A running Red Hat Ceph Storage cluster.
- Dashboard is installed.
Procedure
- Log in to the Dashboard.
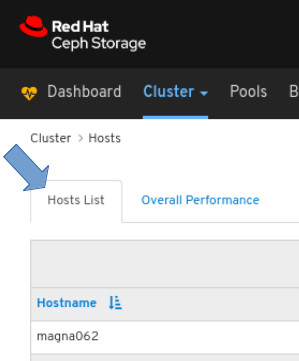
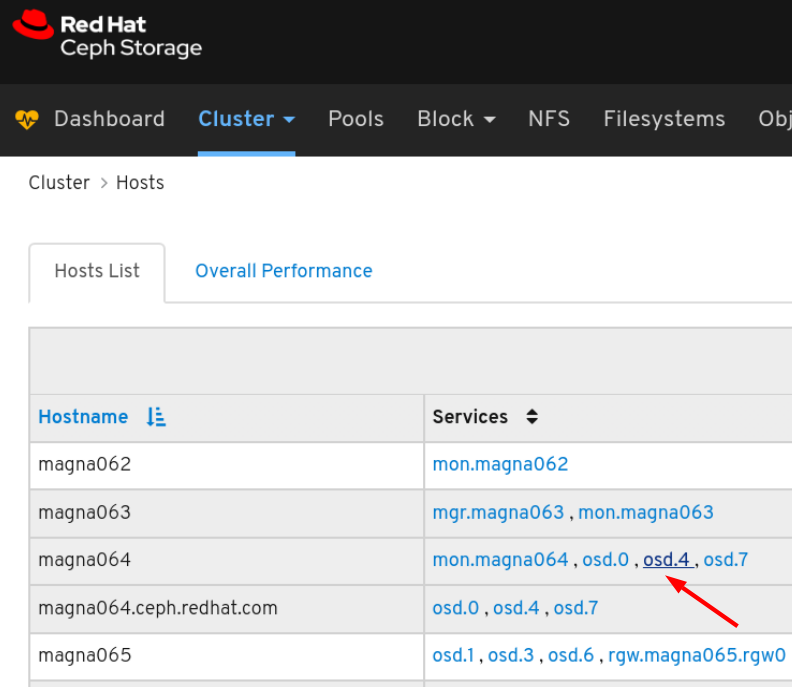
- On the navigation bar, click Cluster and then click Hosts.
To view the list of hosts, click the Hosts List tab:
To view the Performance Details of a host, in the Host tab, click its row and select the time range from the Grafana Time Picker drop-down menu:
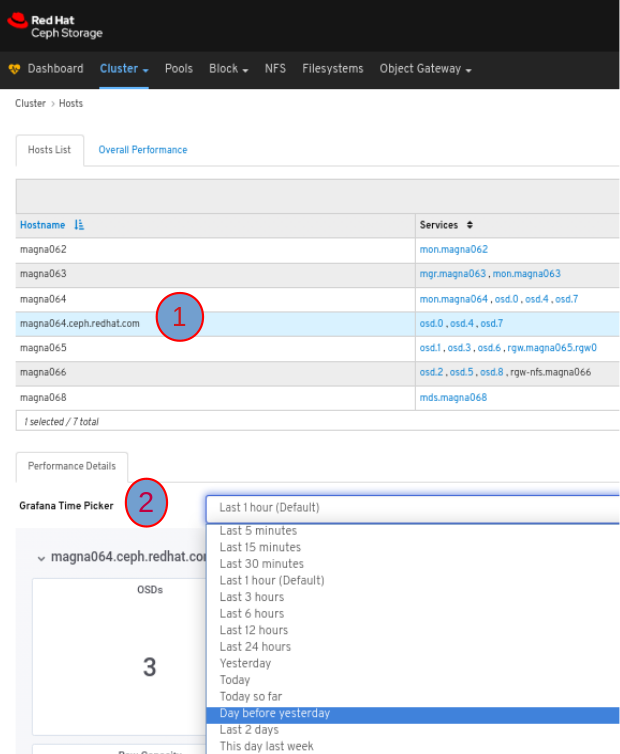
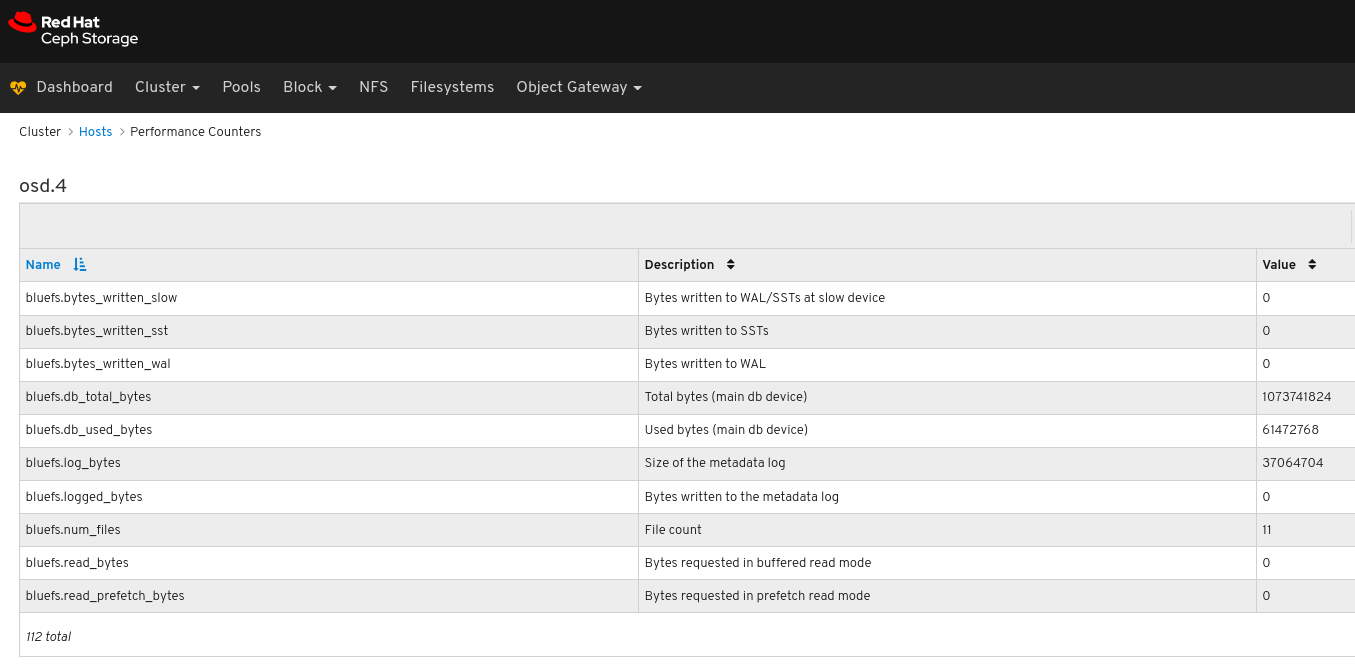
To view the performance counters for a specific service on a host, click the service:
View the performance counters:
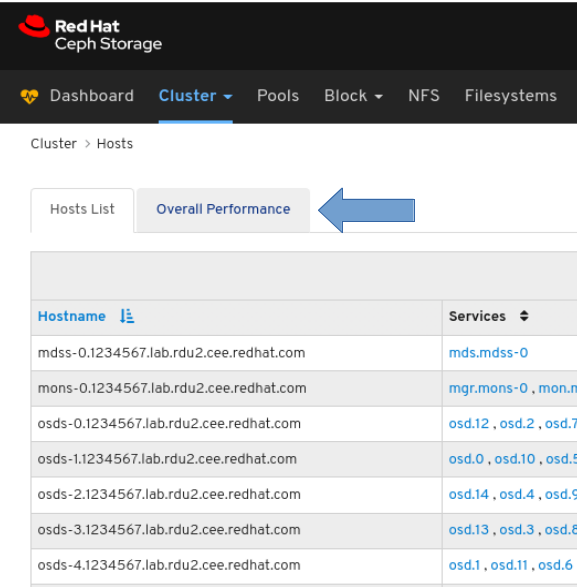
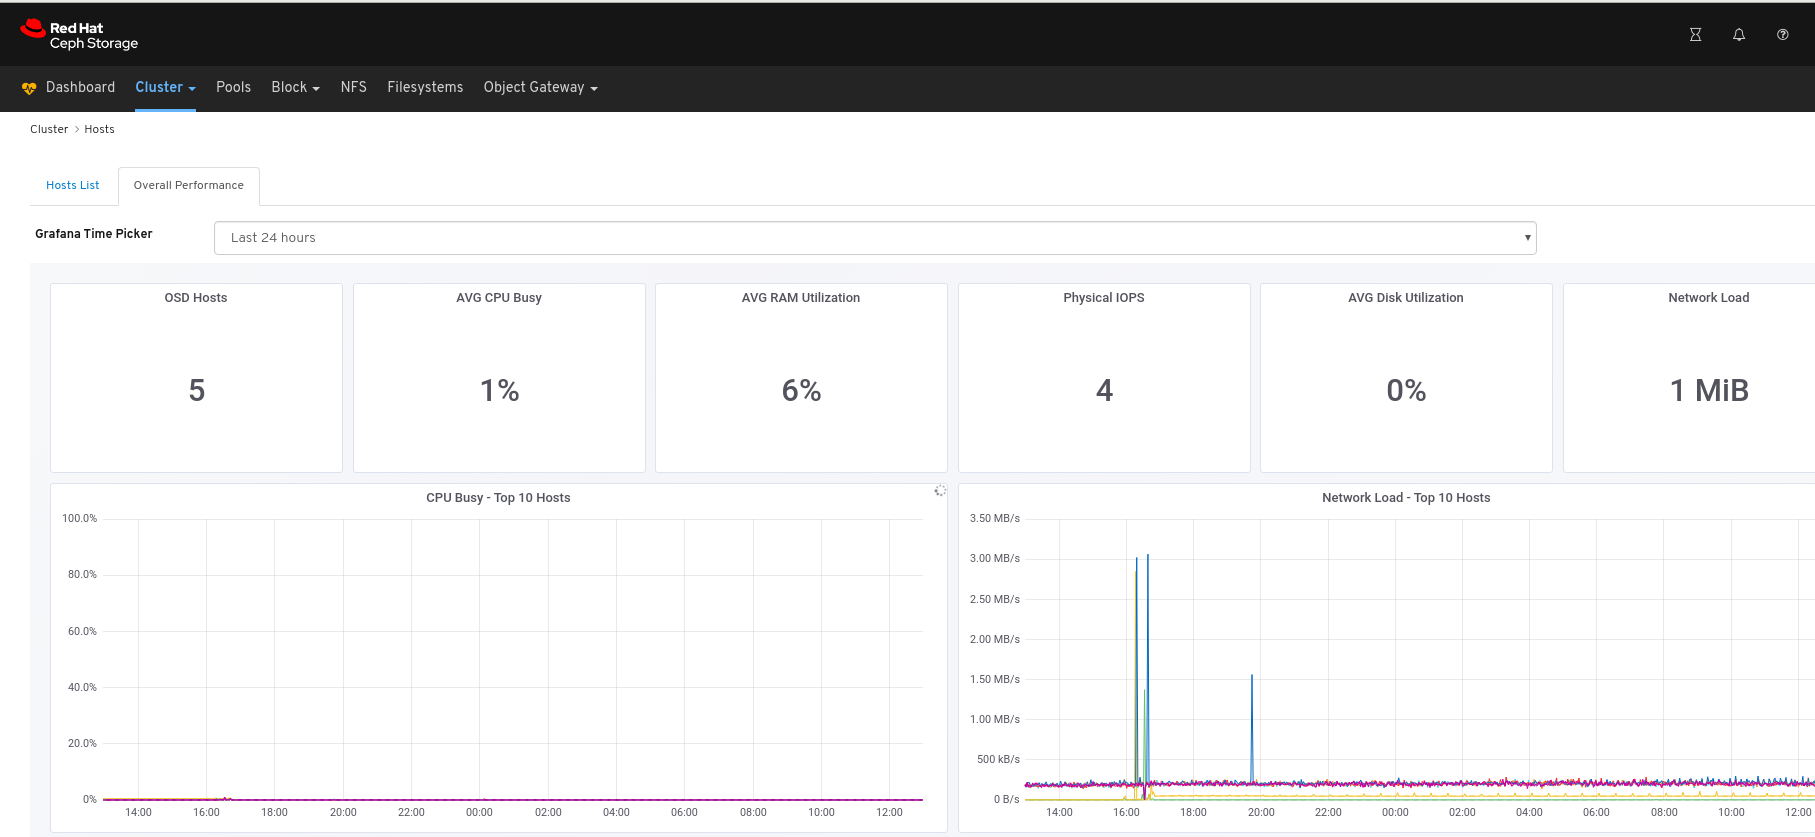
To view performance data for all the hosts:
Click the Overall Performance tab towards the top left of the page:
Select the time range from the Grafana Time Picker drop-down:
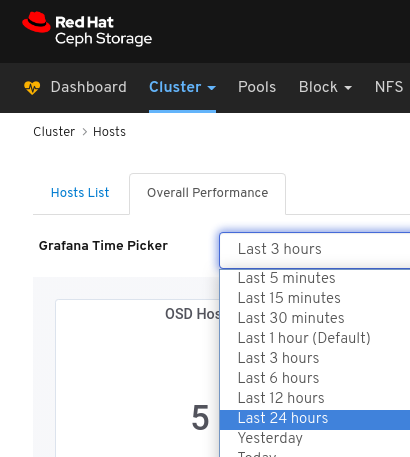
View the Overall Performance page:
Additional Resources
- See the Performance counters in the Red Hat Ceph Storage Administration Guide for more details.
6.3. Monitoring OSDs
The Red Hat Ceph Storage Dashboard allows you to view various details about OSDs.
Prerequisites
- A running Red Hat Ceph Storage cluster.
- Dashboard is installed.
Procedure
- Log in to the Dashboard.
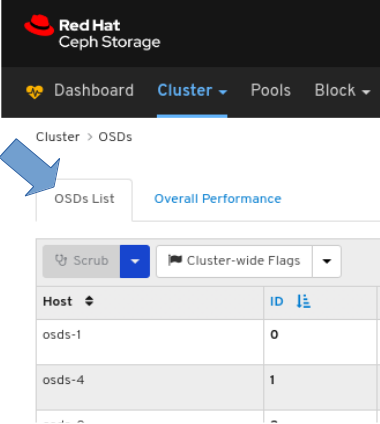
- On the navigation bar, click Cluster and then click OSDs.
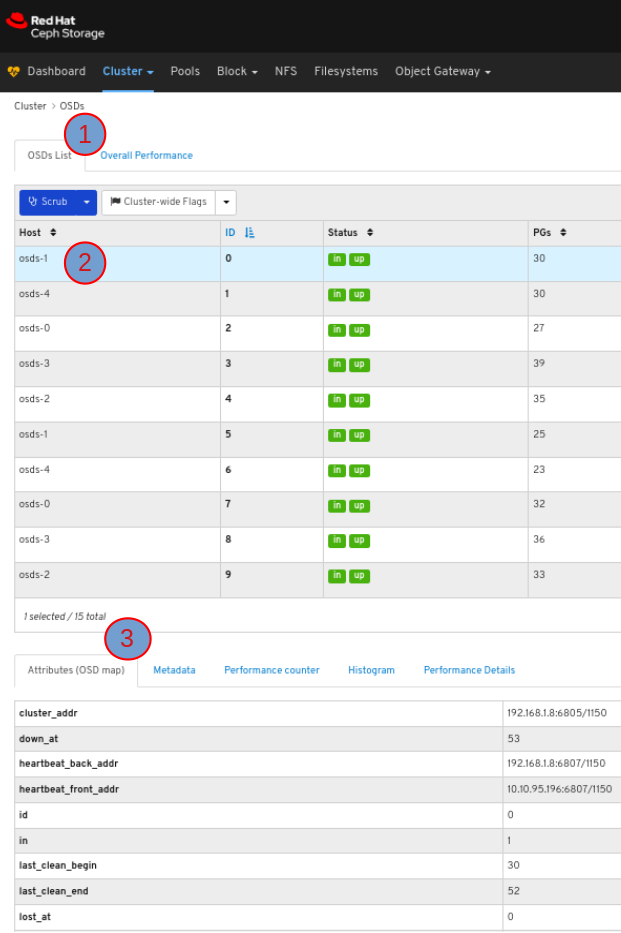
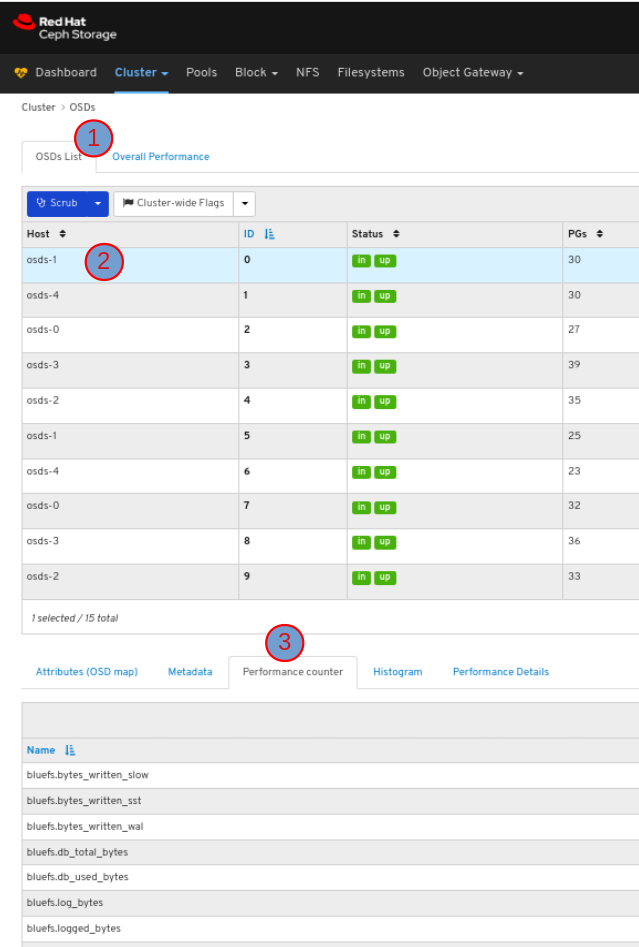
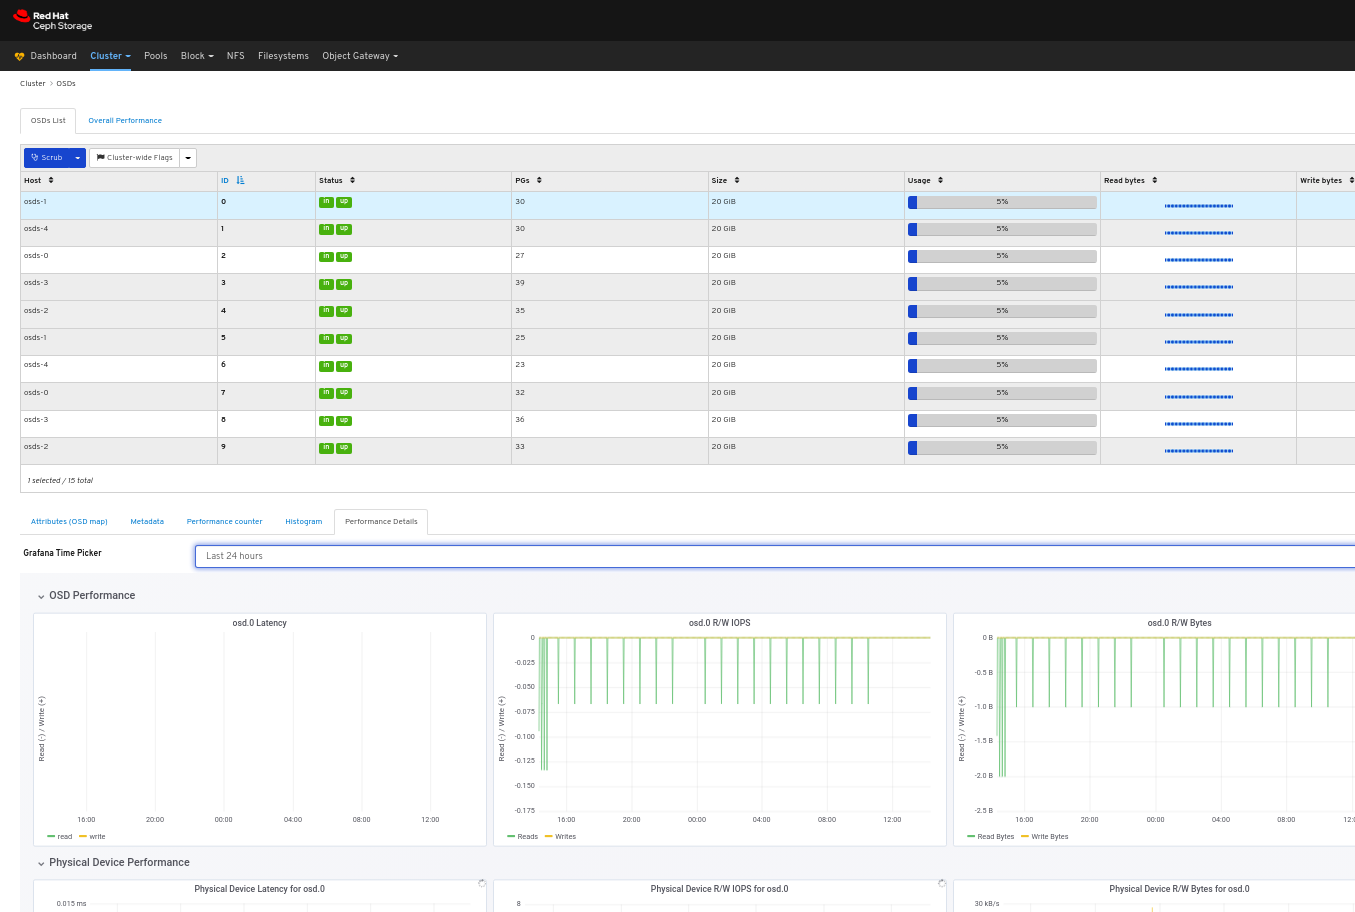
To view the list of OSDs, click the OSDs List tab:
To view the attributes of an OSD, on the OSDS List tab, click its row:
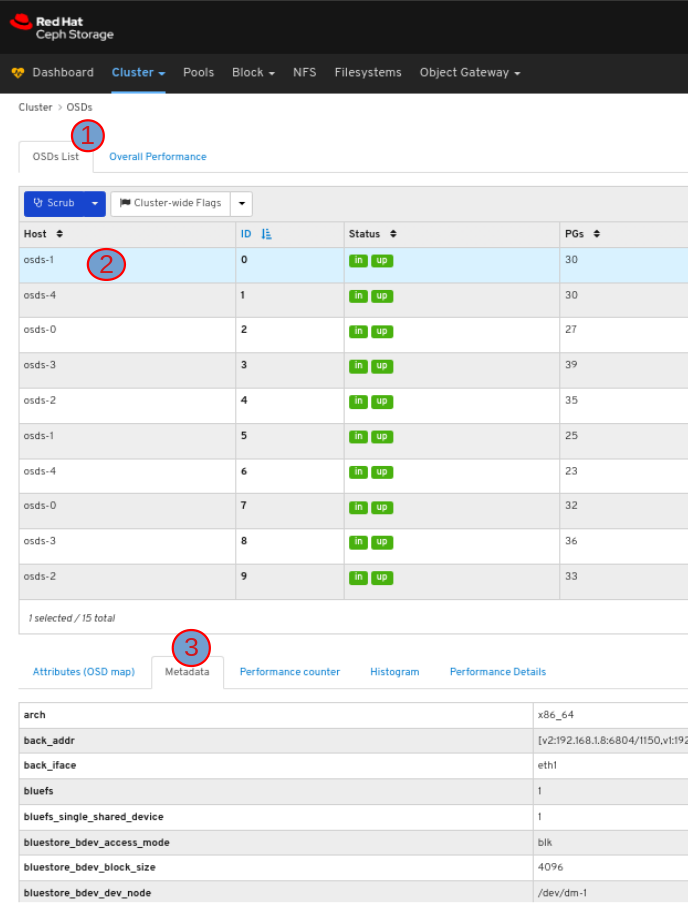
To view the metadata of the OSD, in the OSDs tab, click its row and click the Metadata tab:
To view the performance counter of the OSD, in the OSDs tab, click its row and click the Performance counter tab:
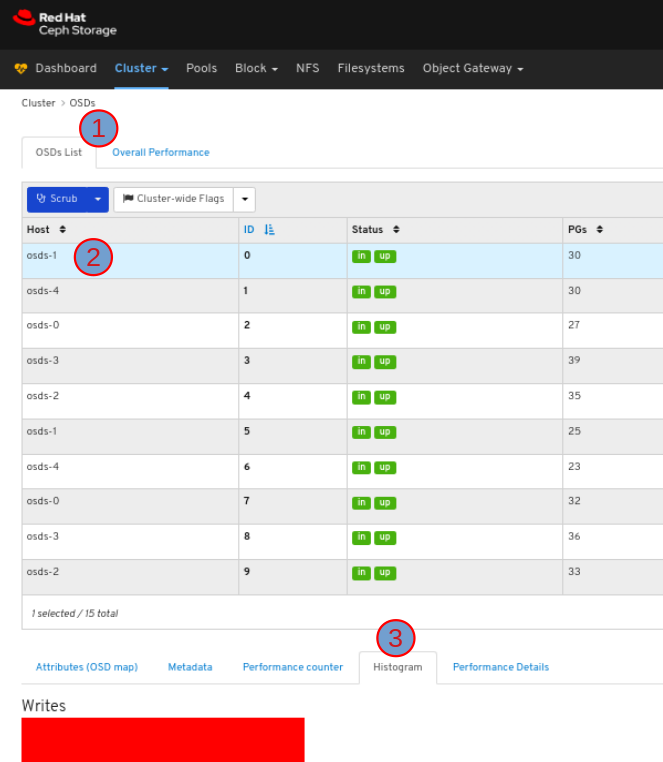
To view the histogram of the OSD, in the OSDs tab, click its row and click the Histogram tab:
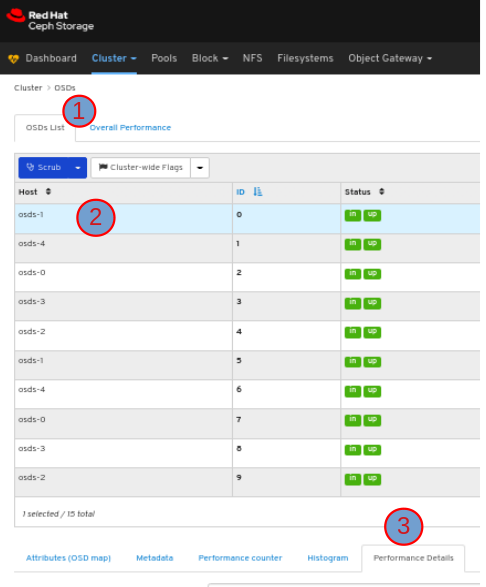
To view the performance details of the OSD:
In the OSDs tab, click its row, click the Performance Details tab:
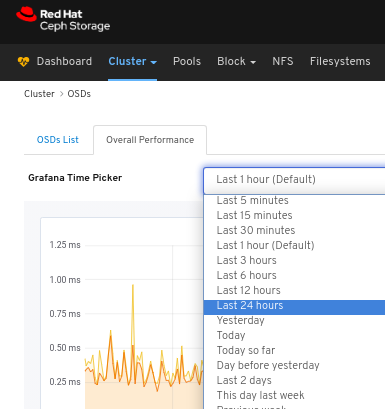
Select the time range from the Grafana Time Picker drop-down menu:
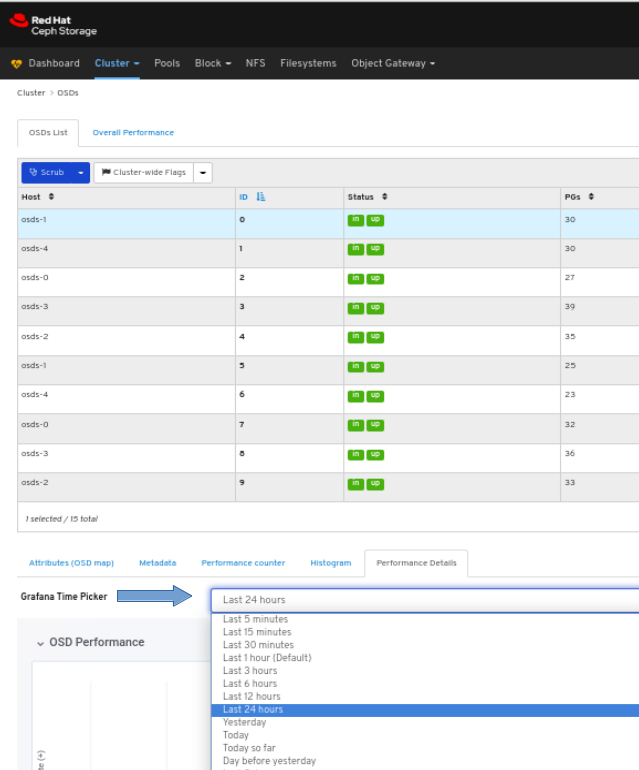
View the performance details of the OSD:
To view the overall performance of all the OSDs:
Click the Overall Performance tab towards the top left of the page:
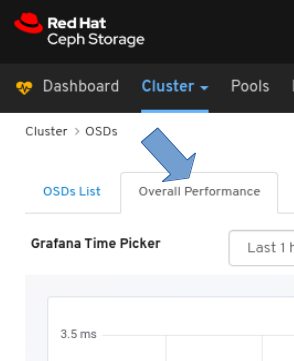
Select the time range from the Grafana Time Picker drop-down:
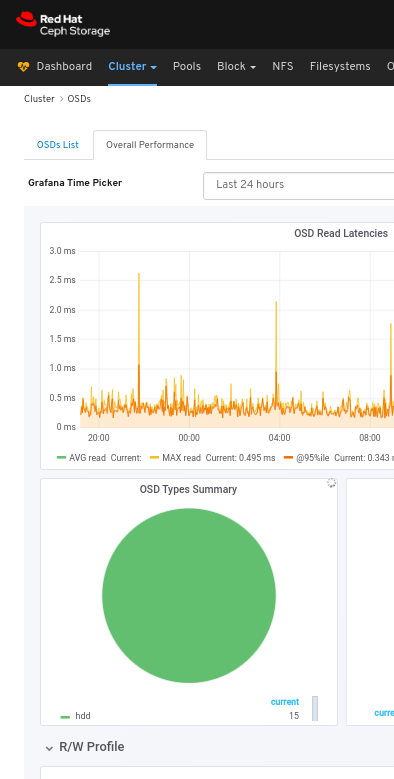
View the Overall Performance page:
Additional Resources
- See the Performance counters in the Red Hat Ceph Storage Administration Guide for more details.
6.4. Monitoring pools
The Red Hat Ceph Storage Dashboard allows you to view various details about pools in the cluster.
Prerequisites
- A running Red Hat Ceph Storage cluster.
- Dashboard is installed.
Procedure
- Log in to the Dashboard.
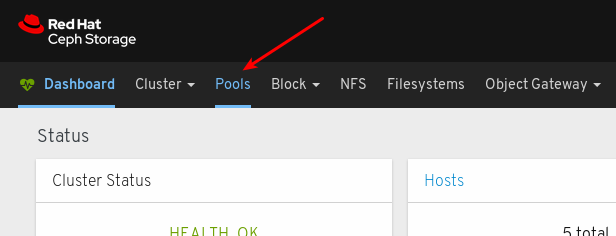
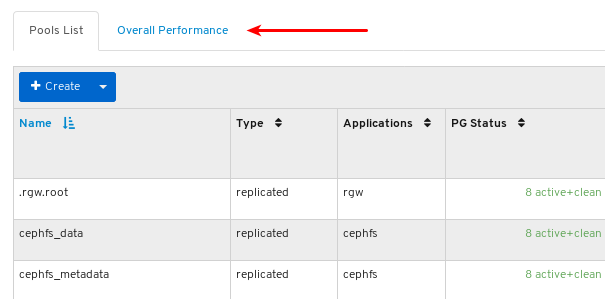
On the navigation bar, click Pools:
View the pools list:
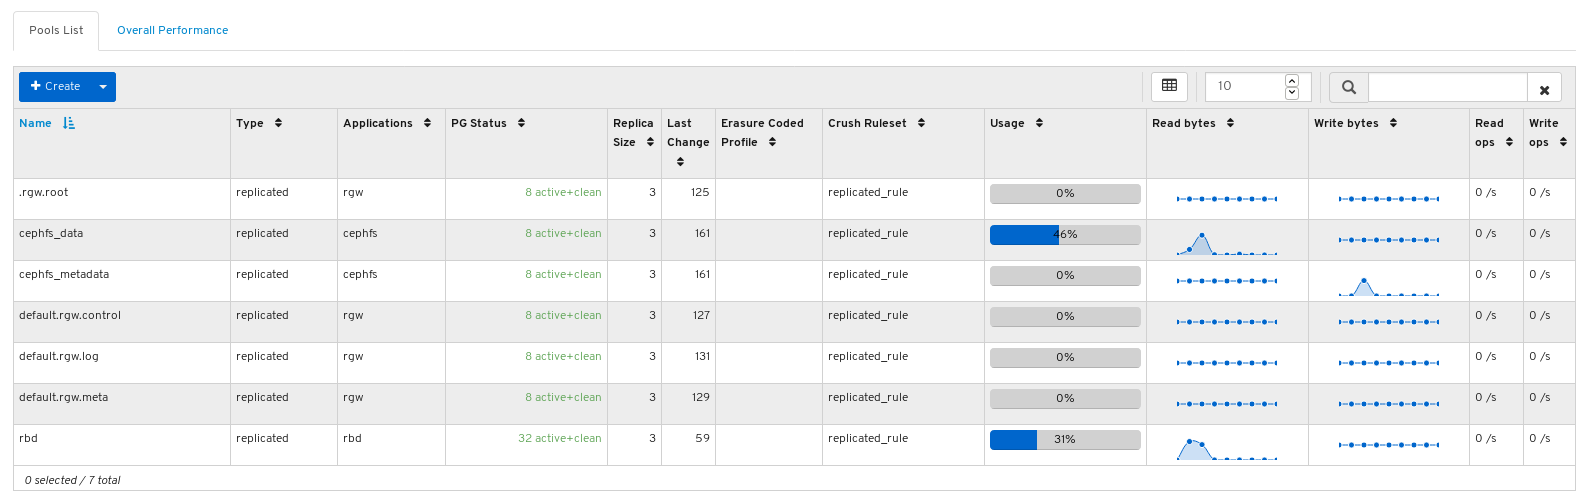
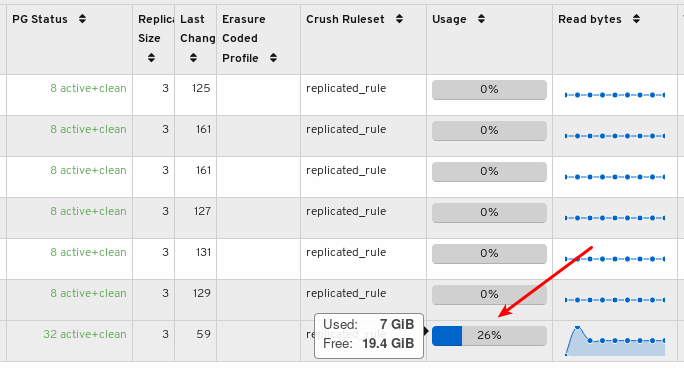
Mouse over a usage bar graph to view the actual used and free space:
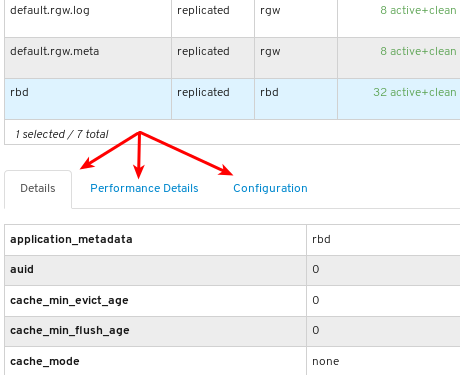
To view more information about a pool, select it by clicking on its row:

View the details of the pool. To view performance details and configuration data for the pool, click on the associated tabs.
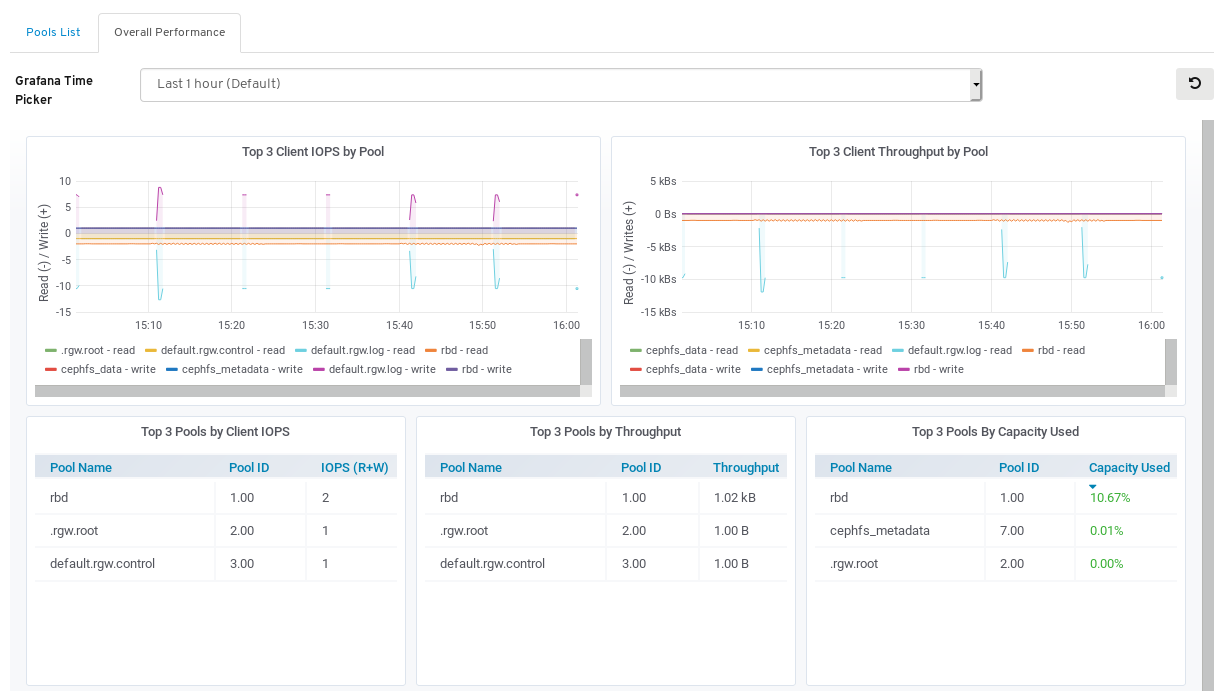
To view performance data for all the pools, click the Overall Performance tab towards the top left of the page:
View the Overall Performance page:
Additional Resources
- For more information about pools, see Pools in the Architecture guide.
6.5. Monitoring Ceph File Systems
As a storage administrator, you can use the Red Hat Ceph Storage Dashboard to monitor Ceph File Systems (CephFS) and related components.
Prerequisites
- A running Red Hat Ceph Storage cluster.
- Dashboard is installed
- Ceph File System is installed.
Procedure
- Log in to the dashboard.
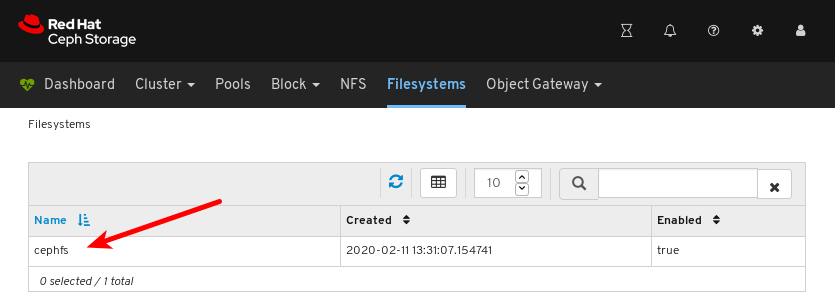
On the navigation bar, click Filesystems.
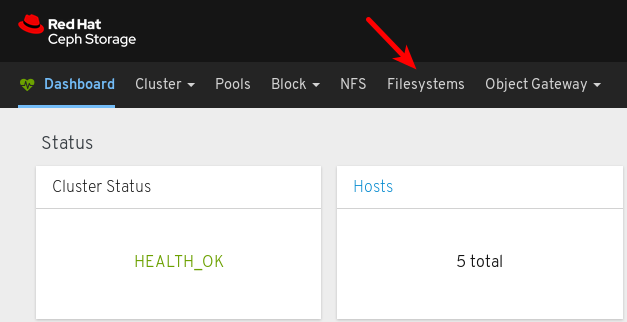
In the example below, you can see the cephfs file system.
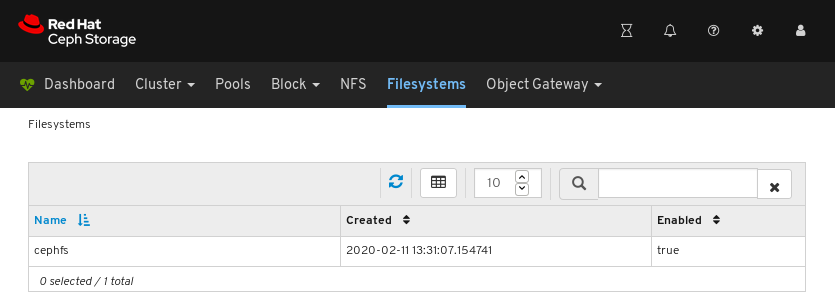
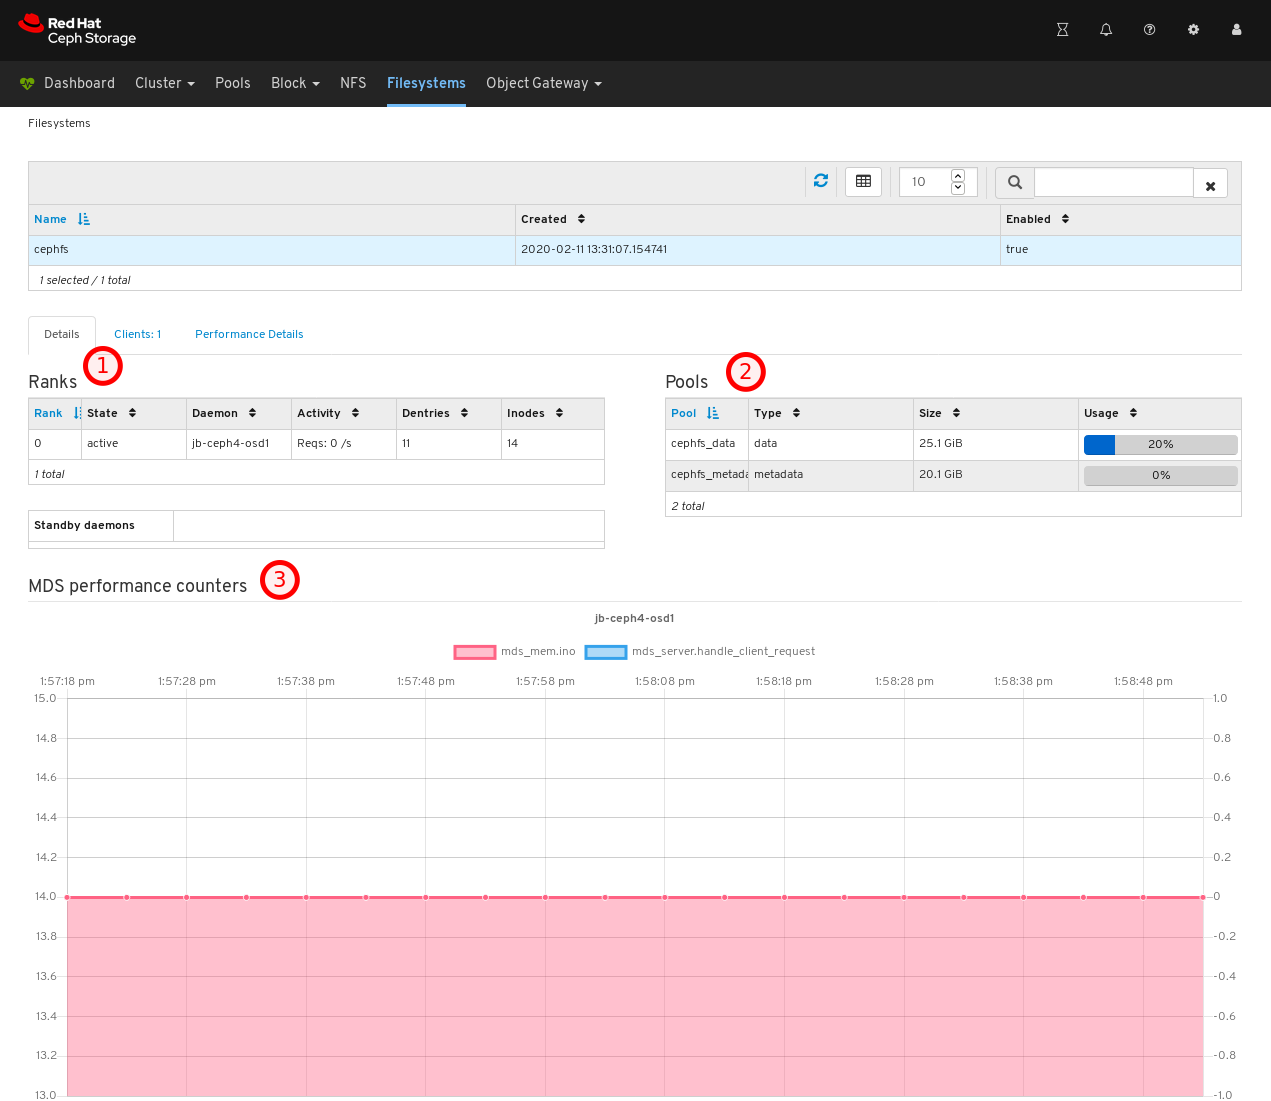
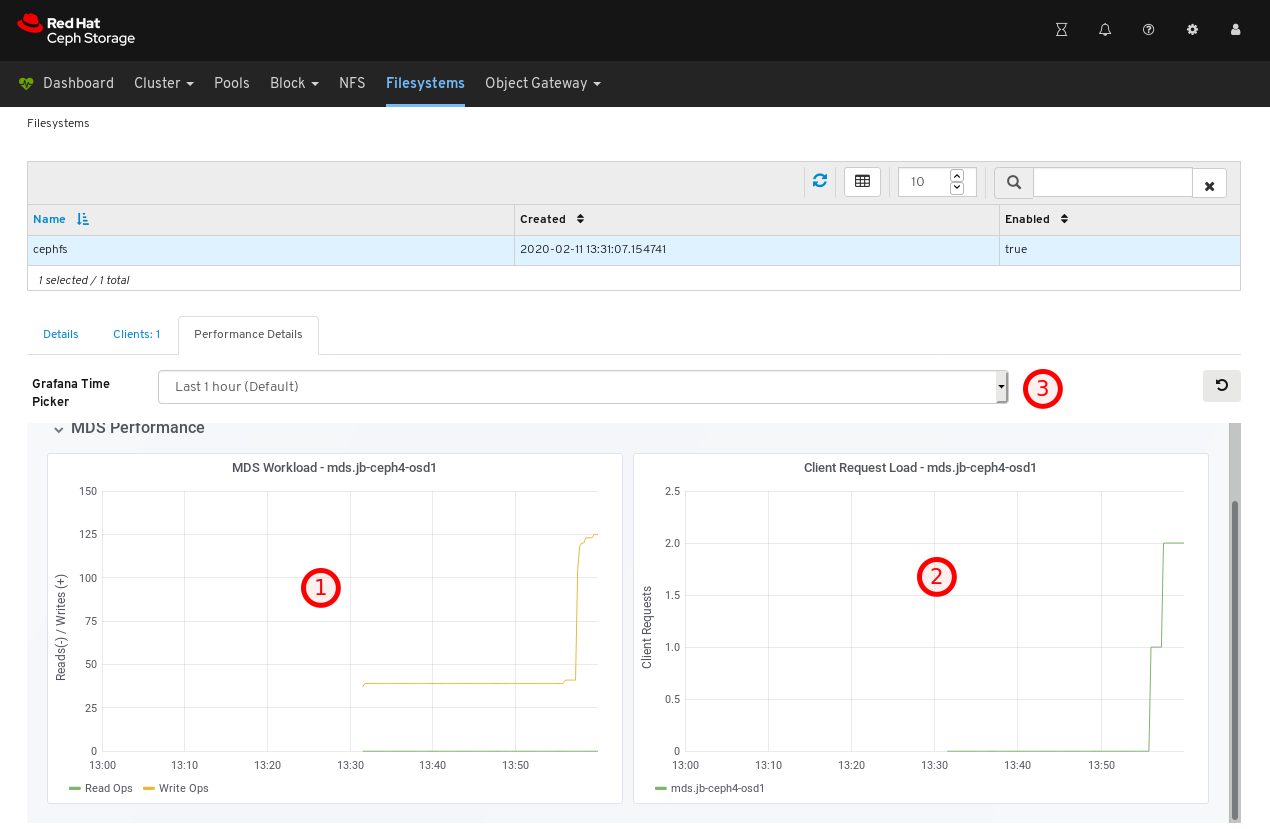
To view details for the file system, click the row for cephfs.
On the Details tab, you can see metadata servers and their rank plus any standby daemons, at 1, pools and their usage, at 2, and performance counters at 3.
To view the list of clients which have mounted the file system, click the Clients tab.
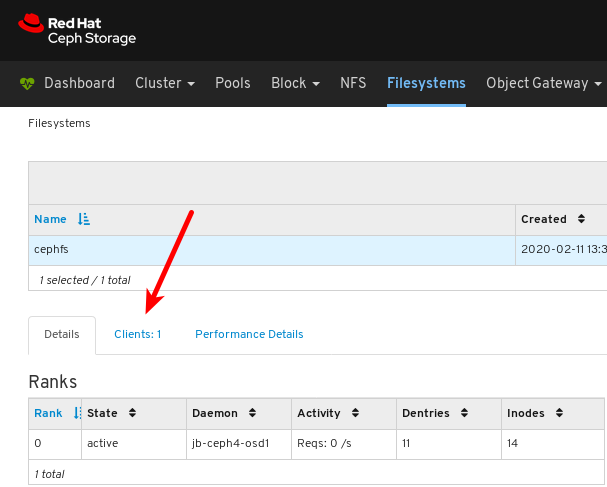
In the example below, you can see the
jb-ceph4-clienthost has the cephfs file system opened.
To view the performance of the file system, click the Performance Details tab.
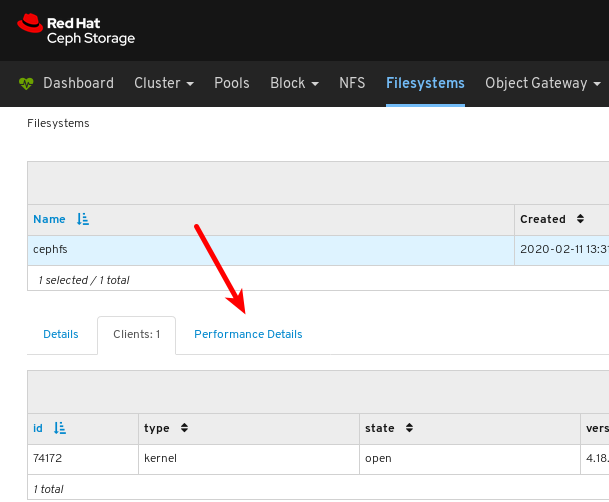
In the example below, you can see the read and write operations, at 1, client requests, at 2, and you can change the time range at 3.
Additional Resources
- For more information, see Installing Metadata servers in the Installation Guide.
- For more information, see the File System Guide.
6.6. Monitoring overall performance of images
The Red Hat Ceph Storage Dashboard allows you to monitor the overall performance of the images in Blocks.
Prerequisites
- A running Red Hat Ceph Storage cluster.
- Dashboard is installed.
- Rados Block Device (RBD) pool is created.
- Image is created.
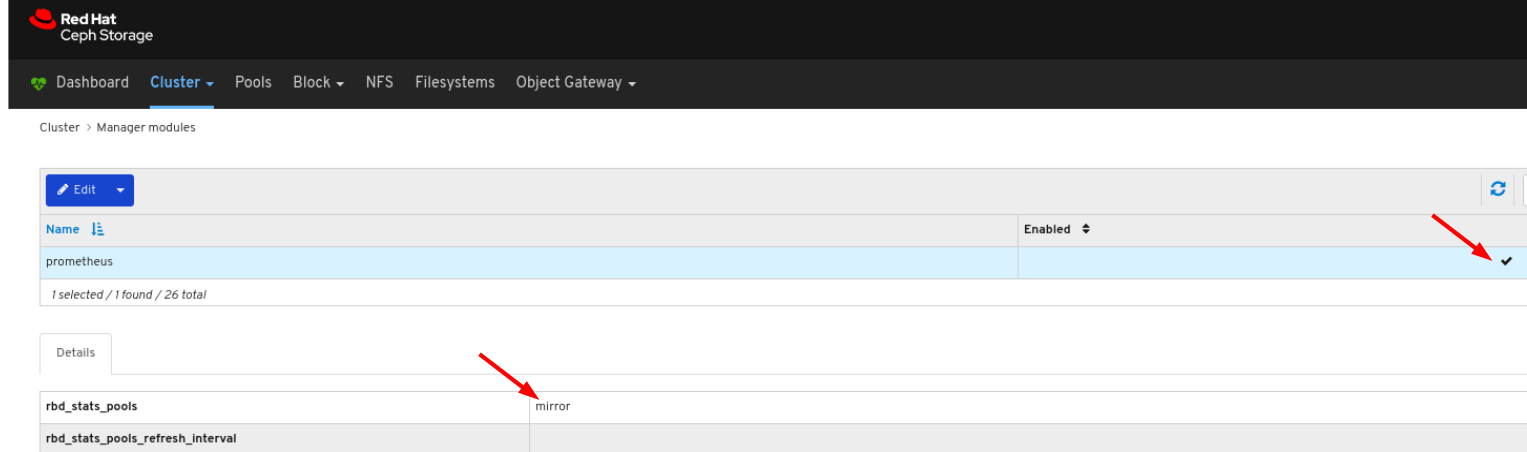
Manager module Prometheus exporter is enabled for the pool.
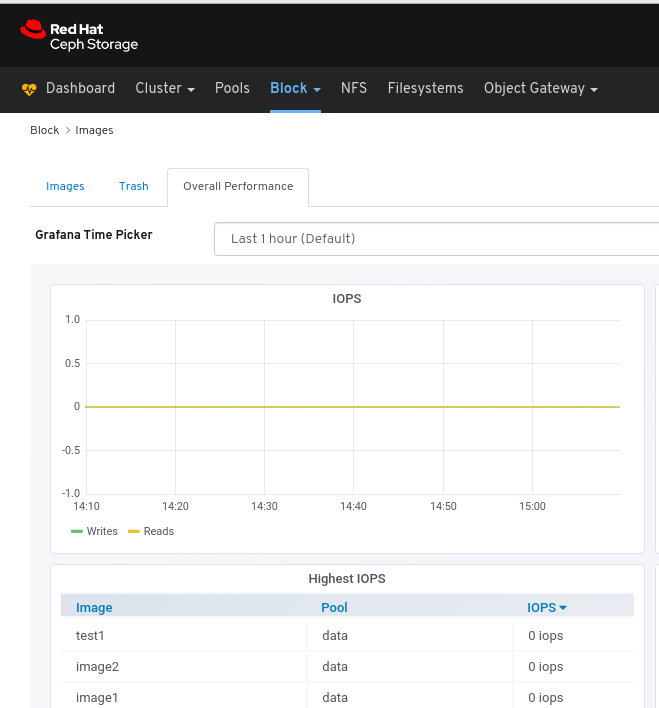
Figure 6.1. Example
Procedure
- Log in to the Dashboard.
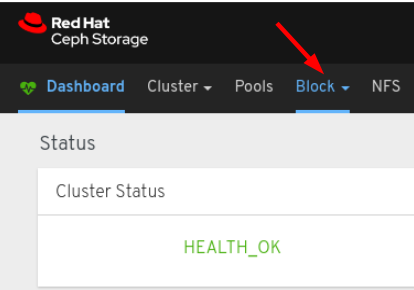
On the navigation bar, click Block:
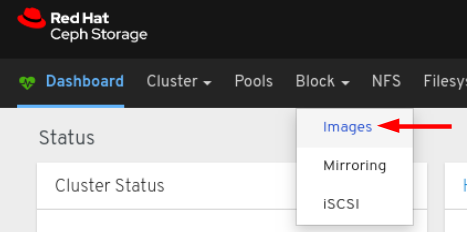
Select Images from the drop-down:
Select the Overall Performance tab:
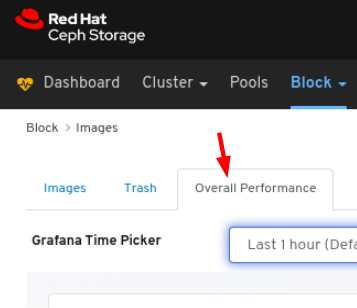
Select the time range from the Grafana Time Picker drop-down:
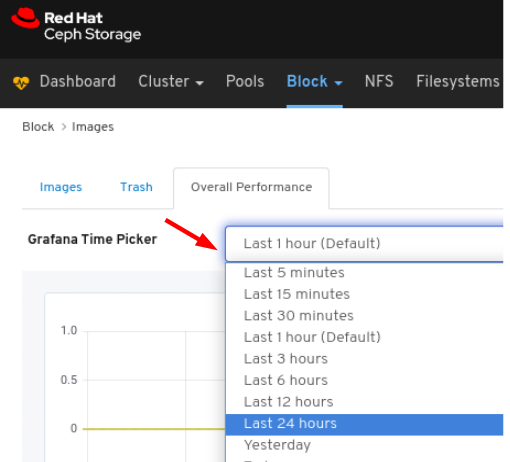
View the Overall Performance page:
Chapter 7. Managing the Cluster
7.1. Managing the Cluster
The management functions of the dashboard allow you to view and modify configuration settings, and manage cluster resources.
7.2. Viewing the CRUSH map
The CRUSH map contains a list of OSDs and related information. Together, the CRUSH map and CRUSH algorithm determine how and where data is stored. The Red Hat Ceph Storage dashboard allows you to view different aspects of the CRUSH map, including OSD hosts, OSD daemons, ID numbers, device class, and more.
The CRUSH map allows you to determine which node a specific OSD ID is running on. This is helpful if there is an issue with an OSD.
Prerequisites
- A running Red Hat Ceph Storage cluster.
- Dashboard is installed.
Procedure
- Log in to the Dashboard.
- On the navigation bar, click Cluster.
Click CRUSH map.
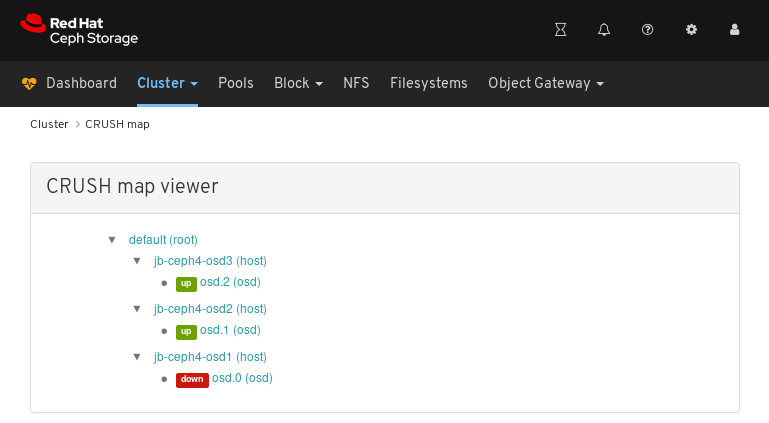
In the above example, you can see the default CRUSH map, three nodes, and OSDs running on two of the three nodes.
Click on the CRUSH map name, nodes, or OSDs, to view details about each object.
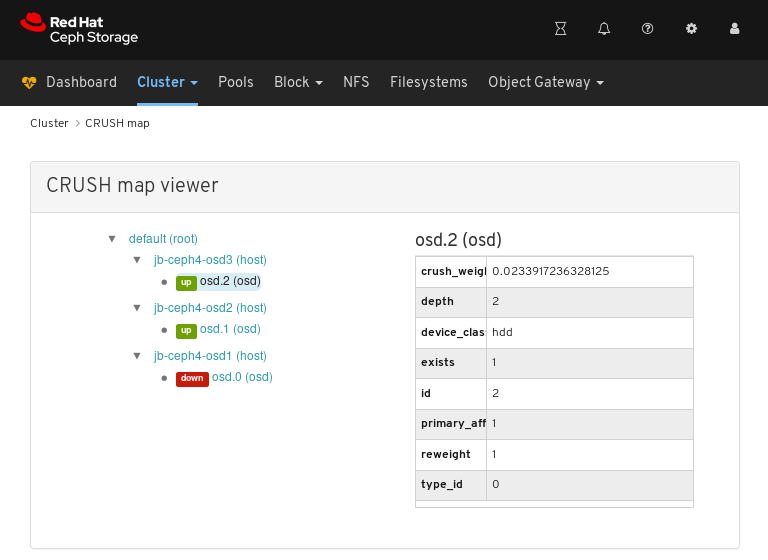
In the above example, you can see the values of variables related to an OSD running on the
jb-rhel-osd3node. In particular, note theidis2.
Additional Resources
- For more information about the CRUSH map, see CRUSH administration in the Storage strategies guide.
7.3. Configuring manager modules
The Red Hat Ceph Storage dashboard allows you to view and configure manager module parameters.
Prerequisites
- A running Red Hat Ceph Storage cluster.
- Dashboard is installed.
Procedure
- Log in to the Dashboard.
- On the navigation bar, click Cluster.
Click Manager modules:
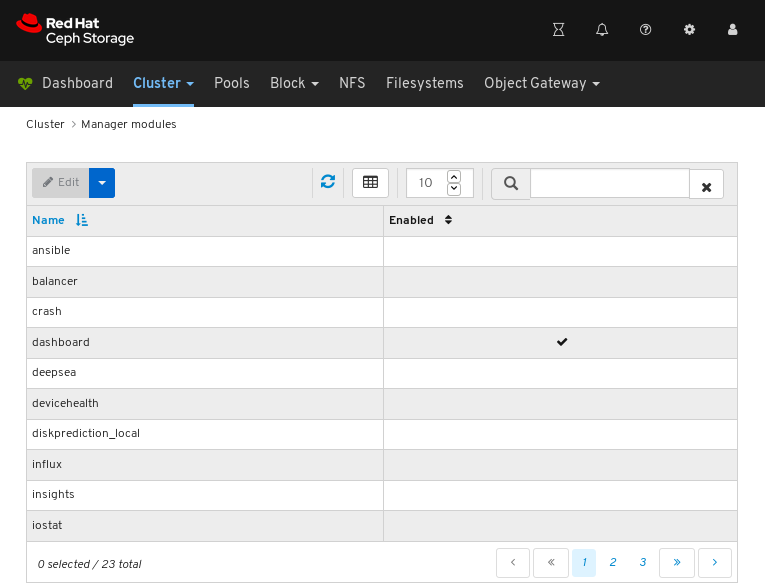
The above screenshot shows the first of three pages of manager modules.
Click on a row for a module you want to configure:

Not all modules have configurable parameters. If a module is not configurable, the Edit button is disabled.
Towards the upper left of the page, click the Edit button to load the page with the configurable parameters.
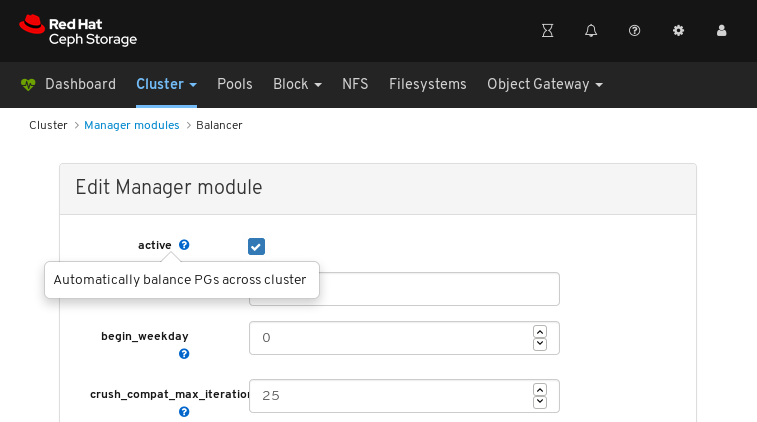
The above screenshot shows parameters that you can change for the balancer module. To display a description of a parameter, click the question mark button.
To change a parameter, modify the state of the parameter and click the Update button at the bottom of the page:
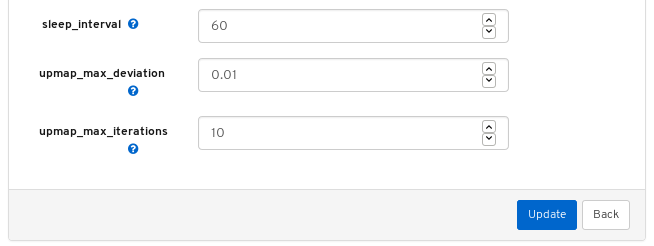
A notification confirming the change appears in the upper-right corner of the page:

Additional Resources
- See Using the Ceph Manager balancer module in the Red Hat Ceph Storage Operations Guide.
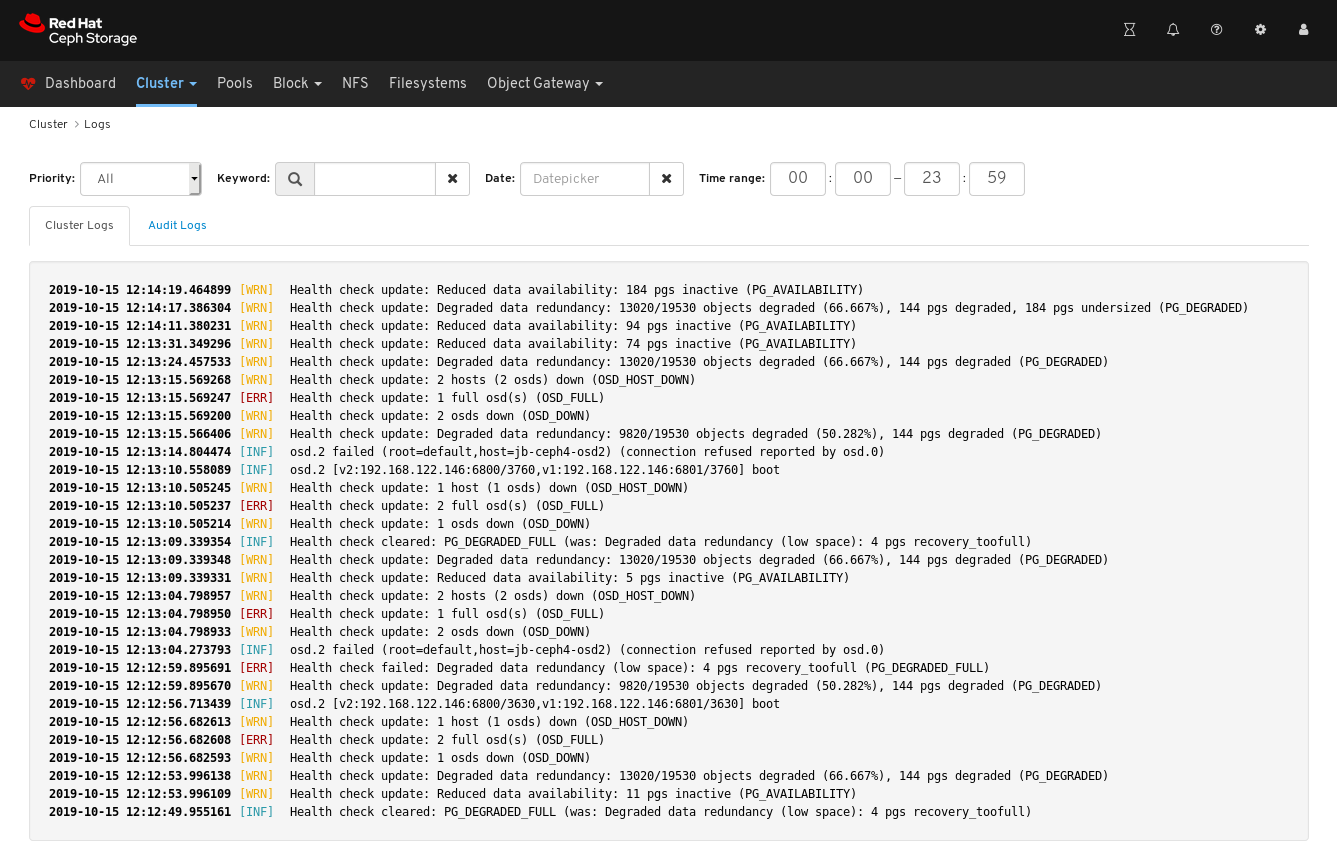
7.4. Filtering logs
The Red Hat Ceph Storage Dashboard allows you to view and filter logs based on several criteria. The criteria include priority, keyword, date, and time range.
Prerequisites
- A running Red Hat Ceph Storage cluster.
- The Dashboard is installed.
- Log entries have been generated since the Monitor was last started.
The Dashboard logging feature only displays the thirty latest high level events. The events are stored in memory by the Monitor. The entries disappear after restarting the Monitor. If you need to review detailed or older logs, refer to the file based logs. See Additional Resources below for more information about file based logs.
Procedure
- Log in to the Dashboard.
-
Click the
Clusterdrop-down menu in the top navigation bar. -
Click
Logsin the drop-down menu. View the last thirty unfiltered log entries.
To filter by priority, click the
Prioritydrop-down menu and select eitherInfo,Warning, orError. The example below only shows log entries with the priority ofError.
To filter by keyword, enter text into the
Keywordform. The example below only shows log entries that include the textosd.2.
To filter by date, click the
Dateform and either use the date picker to select a date from the menu, or enter a date in the form of YYYY-MM-DD. The example below only shows log entries with the date of2019-10-15.
To filter by time, enter a range in the
Time rangefields using the HH:MM - HH:MM format. Hours must be entered using numbers0to23. The example below only shows log entries from12:14to12:23.
To combine filters, set two or more filters. The example below only shows entries that have both a Priority of
Warningand the keyword ofosd.
Additional Resources
- See the Configuring Logging section in the Troubleshooting Guide for more information.
- See the Understanding Ceph Logs section in the Troubleshooting Guide for more information.
7.5. Configuring OSD recovery settings
As a storage administrator, you can change the OSD recovery priority and customize how the cluster recovers. This allows you to influence your cluster’s rebuild performance or recovery speed.
Prerequisites
- A Red Hat Ceph Storage cluster.
- The dashboard is installed.
Procedure
- Log in to the dashboard.
- Click the Cluster drop-down menu in the top navigation bar.
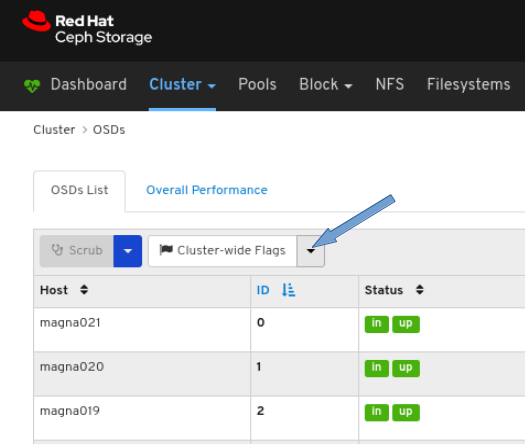
- Click OSDs in the drop-down menu.
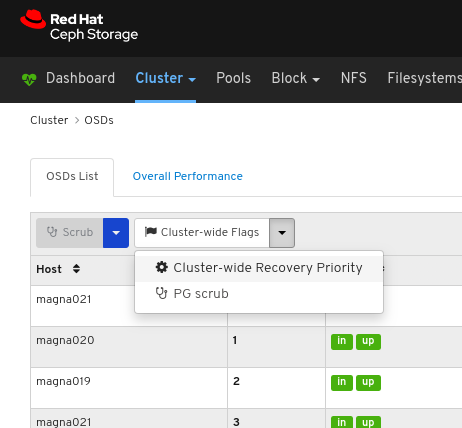
Click the Cluster-Wide Flags drop-down menu.
Select Cluster-wide Recovery Priority in the drop-down.
Optional: Select Priority in the drop-down menu , and then click the Submit button.
NoteThere are 3 predefined options: Low, Default, High
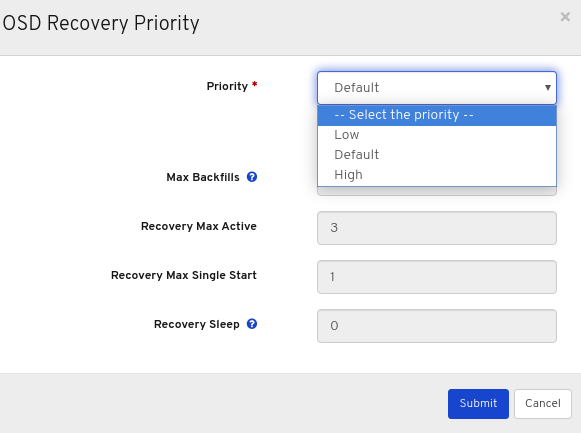
Optional: Click Customize priority values, make the required changes, and then click the Submit button.
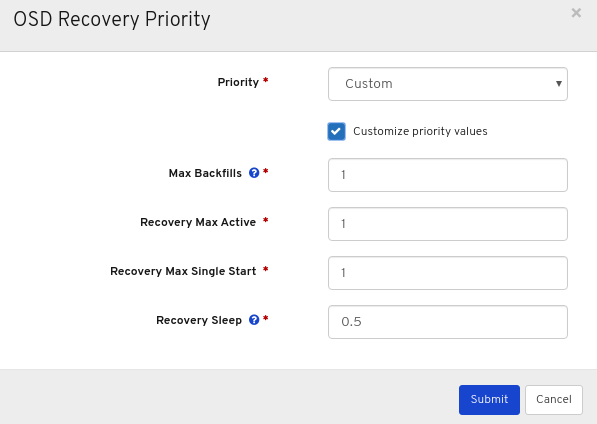
A notification towards the top right corner of the page pops up indicating the flags were updated successfully.

Additional Resources
- For more information on OSD recovery, see OSD Recovery in the Configuration Guide.
7.6. Viewing and monitoring configuration
The Red Hat Ceph Storage Dashboard allows you to view the list of all configuration options for the Ceph cluster. You can also edit the configuration on the Dashboard.
Prerequisites
- A running Red Hat Ceph Storage cluster.
- Dashboard is installed.
Procedure
- Log in to the Dashboard.
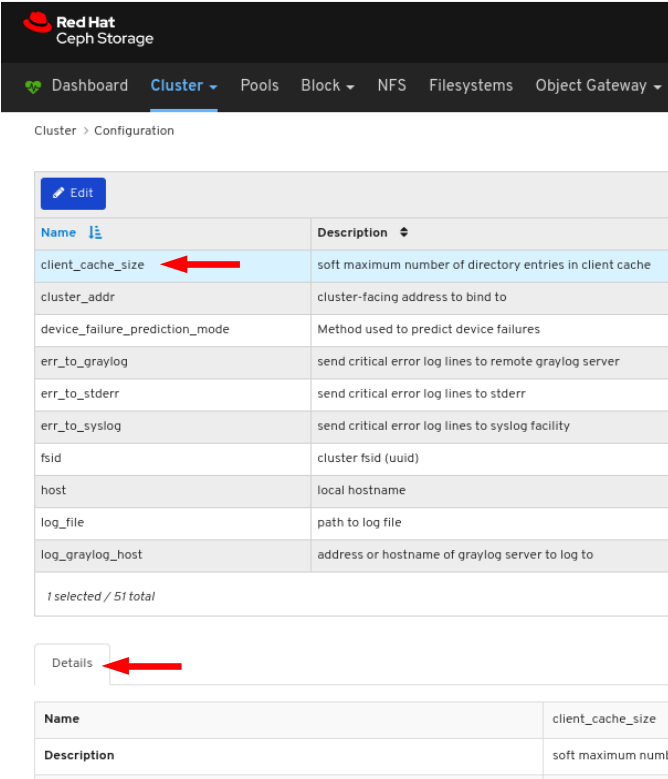
- On the navigation bar, click Cluster and then click Configuration.
To view the details of the configuration, click its row:
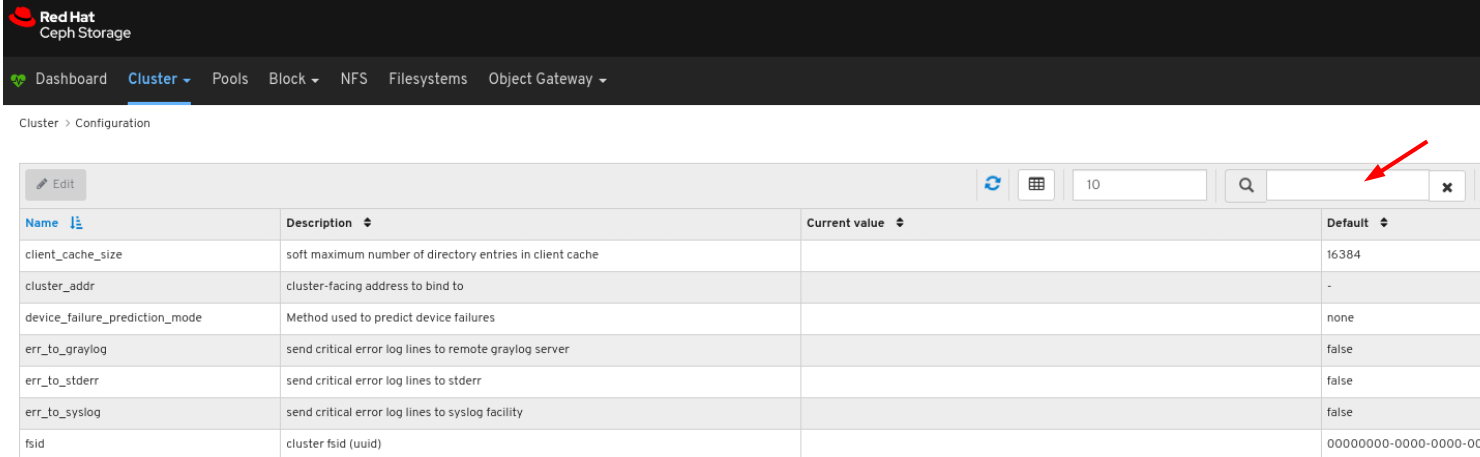
You can search for the configuration using the Search box:
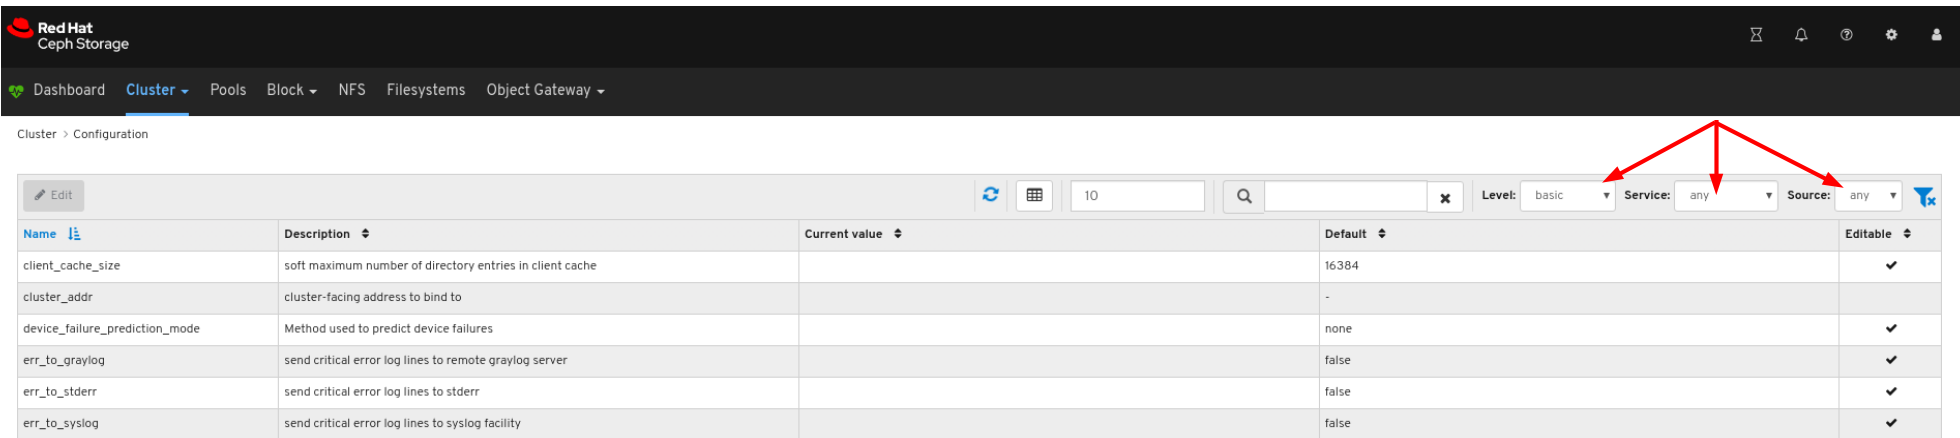
You can filter for the configuration using Level, Service or Source drop-down:
To edit a configuration, click its row and click the Edit button:

In the dialog window, edit the required parameters and Click the Save button:
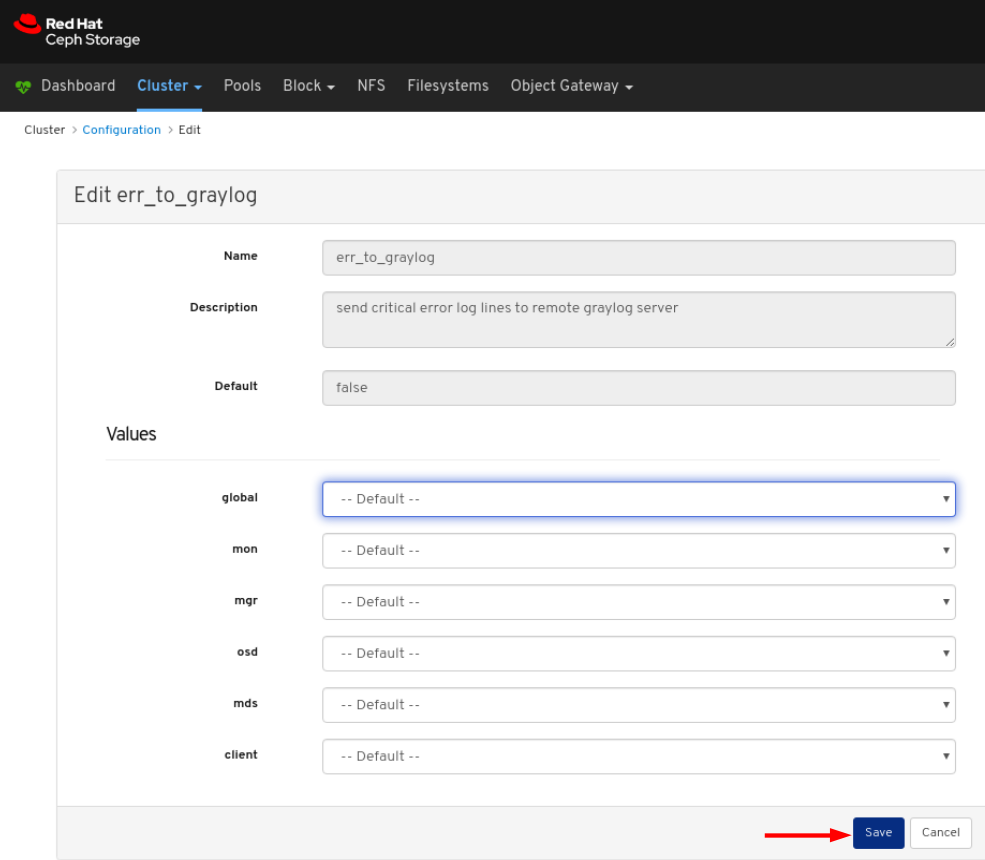
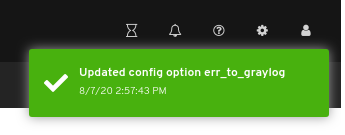
A notification confirming the change appears in the upper-right corner of the page.
Additional Resources
- See the Ceph Network Configuration chapter in the Red Hat Ceph Storage Configuration Guide for more details.
7.7. Managing the Prometheus environment
To monitor a Ceph storage cluster with Prometheus you can configure and enable the Prometheus exporter so the metadata information about the Ceph storage cluster can be collected.
Prerequisites
- A running Red Hat Ceph Storage 3.1 or higher cluster.
- Installation of the Red Hat Ceph Storage Dashboard.
- Root-level access to the Red Hat Ceph Storage Dashboard node.
Procedure
Open and edit the
/etc/prometheus/prometheus.ymlfile.Under the
globalsection, set thescrape_intervalandevaluation_intervaloptions to 15 seconds.Example
global:
  scrape_interval:     15s
  evaluation_interval: 15s
Under the
scrape_configssection, add thehonor_labels: trueoption, and edit thetargets, andinstanceoptions for each of theceph-mgrnodes.Example
scrape_configs: - job_name: 'node' honor_labels: true static_configs: - targets: [ 'node1.example.com:9100' ] labels: instance: "node1.example.com" - targets: ['node2.example.com:9100'] labels: instance: "node2.example.com"NoteUsing the
honor_labelsoption enables Ceph to output properly-labelled data relating to any node in the Ceph storage cluster. This allows Ceph to export the properinstancelabel without Prometheus overwriting it.To add a new node, simply add the
targets, andinstanceoptions in the following format:Example
- targets: [ 'new-node.example.com:9100' ] labels: instance: "new-node"NoteThe
instancelabel has to match what appears in Ceph’s OSD metadatainstancefield, which is the short host name of the node. This helps to correlate Ceph stats with the node’s stats.
Add Ceph targets to the
/etc/prometheus/ceph_targets.ymlfile in the following format.Example
[
    {
        "targets": [ "cephnode1.example.com:9283" ],
        "labels": {}
    }
]
Enable the Prometheus module:
[root@mon ~]# ceph mgr module enable prometheus
7.8. Restoring grafana-server and Prometheus
The grafana-server includes the Grafana UI, Prometheus, the containers, and the Red Hat Ceph Storage configuration. When the grafana-server crashes or is faulty, you can restore it by taking a back-up of the files and restoring it using the backed-up files. For Prometheus, you can take an external back-up and then restore the data.
Prerequisites
- A running Red Hat Ceph Storage cluster.
- Root-level access to the Grafana nodes.
Procedure
Take the back-up of the Grafana database:
On the grafana-server node, stop the Grafana service:
Example
[root@node04 ~]# systemctl stop grafana-server.service
[root@node04 ~]# systemctl status grafana-server.service
Take the back-up of the Grafana database:
Example
[root@node04 ~]# cp /var/lib/grafana/grafana.db /var/lib/grafana/grafana_backup.dbOn the grafana-server node, restart the Grafana service:
Example
[root@node04 ~]# systemctl restart grafana-server.service
Restore the grafana-server:
On the grafana-server node, if the Grafana service is running, stop the service:
Example
[root@node04 ~]# systemctl stop grafana-server.service
[root@node04 ~]# systemctl status grafana-server.service
Move the backed-up
grafana.dbfile to/var/lib/grafana/directory:Example
[root@node04 ~]# mv /var/lib/grafana/grafana_backup.db /var/lib/grafana/On the grafana-server node, restart the Grafana service:
Example
[root@node04 ~]# systemctl restart grafana-server.service
For the Prometheus alerts, you have to take external back-up of
prometheus_data_dirdirectory, a Ceph-Ansible setting which by default isvar/lib/prometheusdirectory and restore the service using the backed-up directory.On the grafana-server node, stop the Prometheus service:
Example
[root@node04 ~]# systemctl stop prometheus.service
[root@node04 ~]# systemctl status prometheus.service
Take the back-up of the default Prometheus directory:
Example
[root@node04 ~]# cp /var/lib/prometheus/ /var/lib/prometheus_backup/Replace the
prometheus_data_dirdirectory with the backed-up directory:Example
[root@node04 ~]# mv /var/lib/prometheus_backup/ /var/lib/prometheus_data_dirOn the grafana-server node, restart the prometheus service:
Example
[root@node04 ~]# systemctl restart prometheus.service [root@node04 ~]# systemctl status prometheus.serviceNoteIf you have made changes to the Prometheus parameters in
group_vars/all.ymlfile, then you have to rerun the playbook.
Optional: If the changes do not reflect on the Red Hat Ceph Storage Dashboard, then you have to disable and then enable the dashboard:
Example
[root@node04 ~]# ceph mgr module disable dashboard
[root@node04 ~]# ceph mgr module enable dashboard
7.9. Viewing and managing alerts
As a storage administrator, you can see the details of alerts and create silences for them on the Red Hat Ceph Storage dashboard. This includes the following pre-defined alerts:
- OSD(s) Down
- Ceph Health Error
- Ceph Health Warning
- Cluster Capacity Low
- Disk(s) Near Full
- MON(s) Down
- Network Errors
- OSD Host Loss Check
- OSD Host(s) Down
- OSD(s) with High PG Count
- PG(s) Stuck
- Pool Capacity Low
- Slow OSD Responses
7.9.1. Viewing alerts
After an alert has fired, you can view it on the Red Hat Ceph Storage Dashboard. You can also enable the dashboard to send an email about the alert.
Simple mail transfer protocol (SMTP) and SSL is not supported in Red Hat Ceph Storage 4 cluster.
Prerequisite
- A running Red Hat Ceph Storage cluster.
- Dashboard is installed.
- An alert fired.
Procedure
- Log in to the Dashboard.
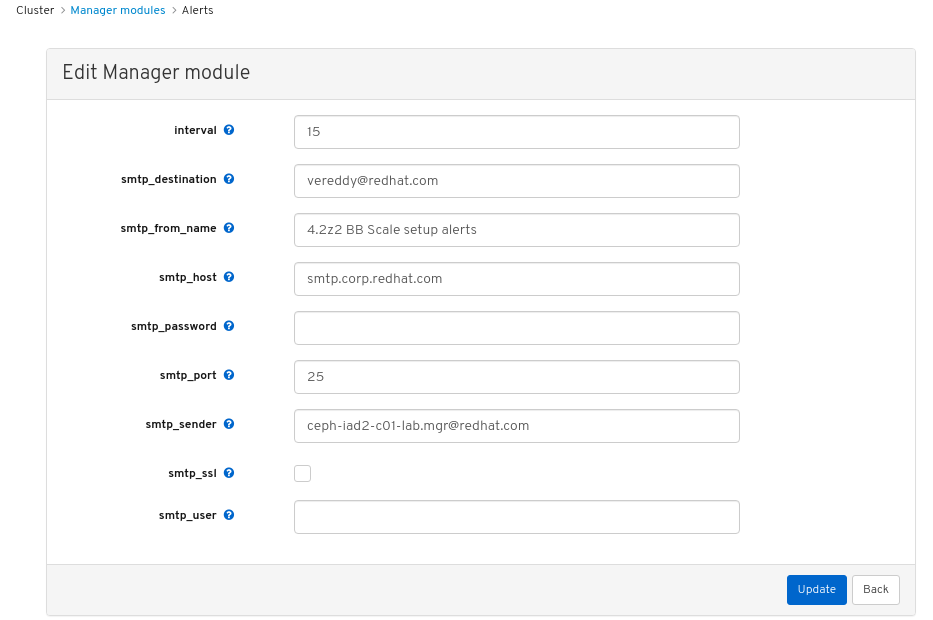
Customize the alerts module on the dashboard to get an email alert for the storage cluster:
- On the navigation bar, click Cluster.
- Select Manager modules.
- Select alerts module.
- In the Edit drop-down menu, select Edit.
In the Edit Manager module, update the required parameters and click Update.
Figure 7.1. Edit Manager module for alerts
- On the navigation bar, click Cluster.
- Select Monitoring from the drop-down menu.
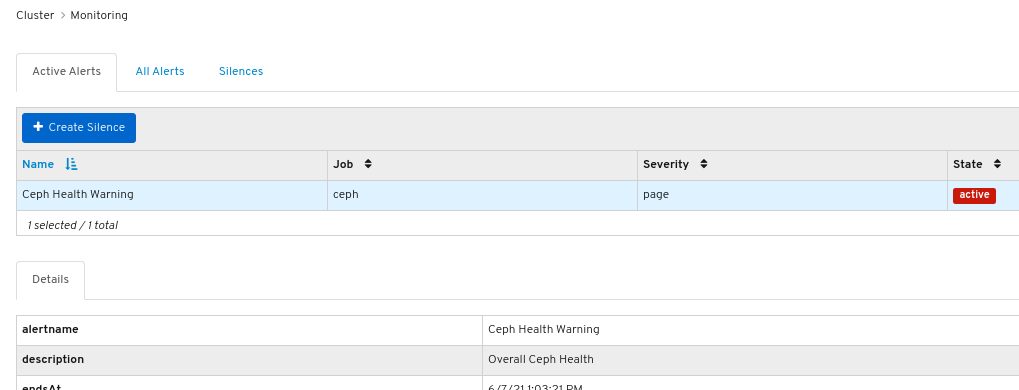
To view details about the alert, click on its row:
Figure 7.2. Alert Details
- To view the source of an alert, click on its row, and then click Source.
7.9.2. Creating a silence
You can create a silence for an alert for a specified amount of time on the Red Hat Ceph Storage Dashboard.
Prerequisite
- A running Red Hat Ceph Storage cluster.
- Dashboard is installed.
- An alert fired.
Procedure
- Log in to the Dashboard.
- On the navigation bar, click Cluster.
- Select Monitoring from the drop-down menu.
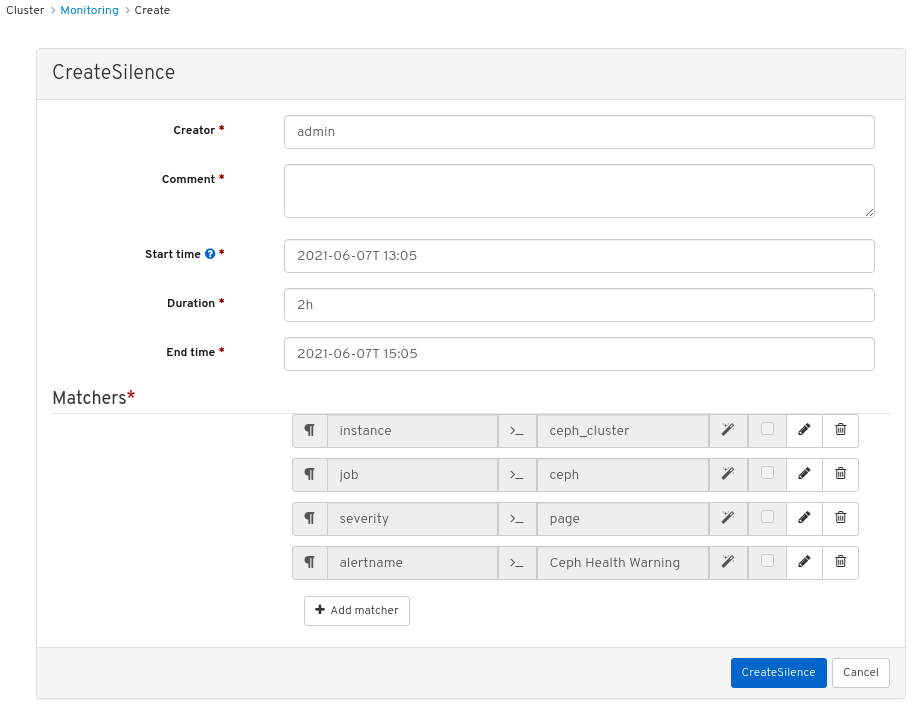
- Click on the row for the alert and then click +Create Silence.
In the CreateSilence window, Add the details for the Duration and click Create Silence.
Figure 7.3. Create Silence
- You get a notification that the silence was created successfully.
7.9.3. Re-creating a silence
You can re-create a silence from an expired silence on the Red Hat Ceph Storage Dashboard.
Prerequisite
- A running Red Hat Ceph Storage cluster.
- Dashboard is installed.
- An alert fired.
- A silence created for the alert.
Procedure
- Log in to the Dashboard.
- Select Monitoring from the drop-down menu.
- Click the Silences tab.
- Click on the row for the expired silence.
- Click the Recreate button.
In the RecreateSilence window, add the details and click RecreateSilence.
Figure 7.4. Recreate silence
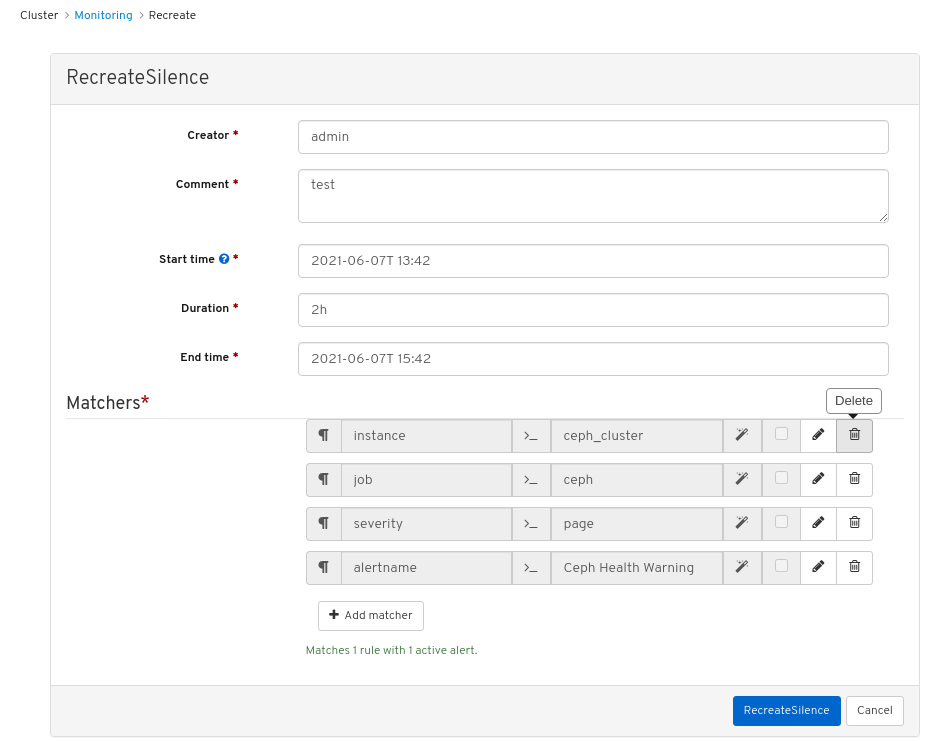
- You get a notification that the silence was recreated successfully.
7.9.4. Editing a silence
You can edit an active silence, for example, to extend the time it is active on the Red Hat Ceph Storage Dashboard. If the silence has expired, you can either recreate a silence or create a new silence for the alert.
Prerequisite
- A running Red Hat Ceph Storage cluster.
- Dashboard is installed.
- An alert fired.
- A silence created for the alert.
Procedure
- Log in to the Dashboard.
- On the navigation bar, click Cluster.
- Select Monitoring from the drop-down menu.
- Click the Silences tab.
- Click on the row for the silence.
- In the Edit drop-down menu, select Edit.
In the EditSilence window, update the details and click Edit Silence.
Figure 7.5. Edit silence

- You get a notification that the silence was updated successfully.
7.9.5. Expiring a silence
You can expire a silence so any matched alerts will not be suppressed on the Red Hat Ceph Storage Dashboard.
Prerequisite
- A running Red Hat Ceph Storage cluster.
- Dashboard is installed.
- An alert fired.
- A silence created for the alert.
Procedure
- Log in to the Dashboard.
- On the navigation bar, click Cluster.
- Select Monitoring from the drop-down menu.
- Click the Silences tab.
- Click on the row for the silence.
- In the Edit drop-down menu, select Expire.
In the Expire Silence dialog box, select Yes, I am sure, and then click Expire Silence.
Figure 7.6. Expire Silence
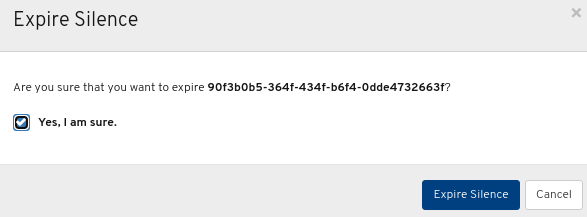
- You get a notification that the silence was expired successfully.
7.10. Managing pools
As a storage administrator, you can create, delete, and edit pools.
Prerequisites
- A running Red Hat Ceph Storage cluster.
- Dashboard is installed
7.10.1. Creating pools
You can create pools to logically partition your storage objects.
Prerequisites
- A running Red Hat Ceph Storage cluster.
- Dashboard is installed.
Procedure
- Log in to the dashboard.
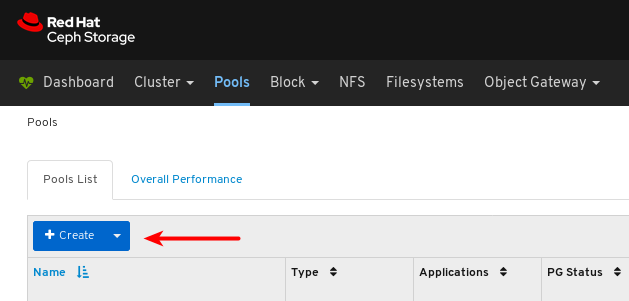
On the navigation bar, click Pools.
Click the Create button towards the top left corner of the page.
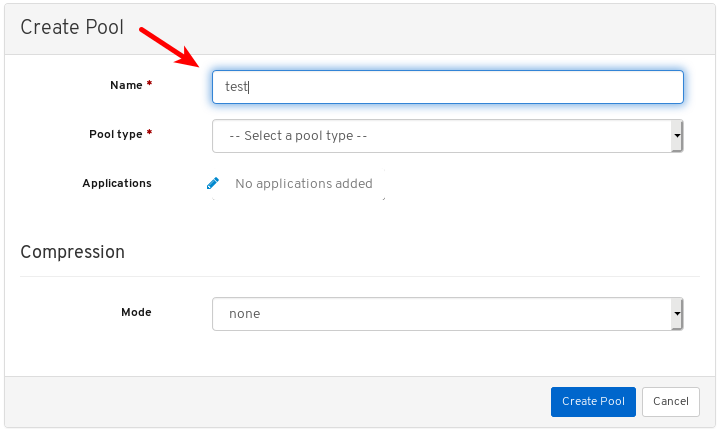
In the dialog window, set the name.
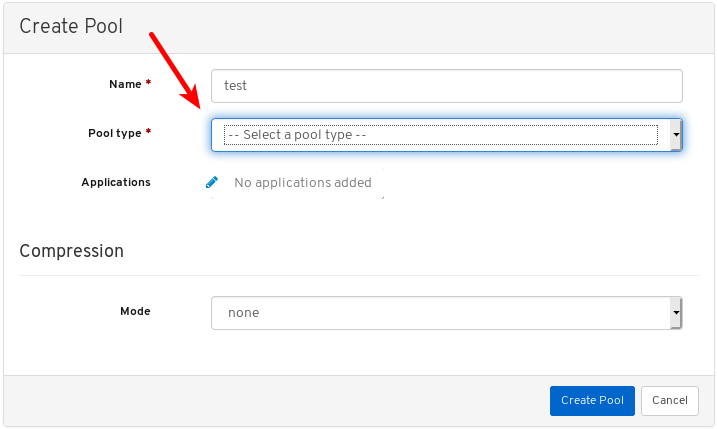
Select either replicated or Erasure Coded (EC) pool type.
Set the Placement Group (PG) number.
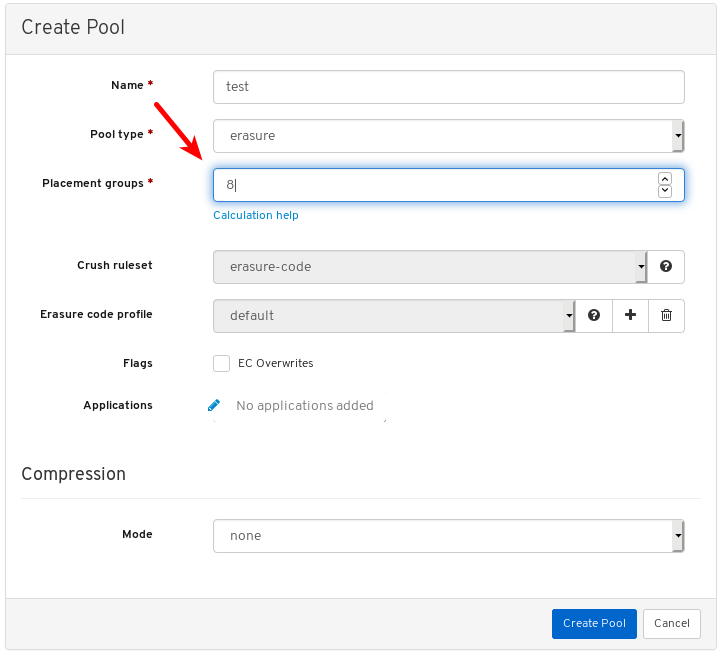
For assistance in choosing the PG number, use the PG calculator. Contact Red Hat Technical Support if unsure.
Optional: If using a replicated pool type, set the replicated size.

Optional: If using an EC pool type configure the following additional settings.
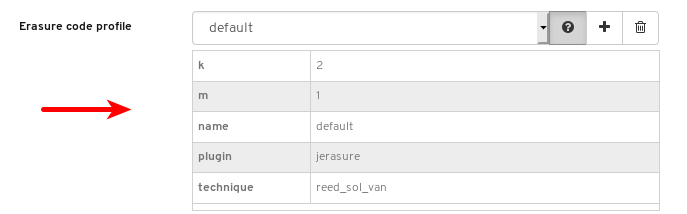
Optional: To see the settings for the currently selected EC profile, click the question mark.
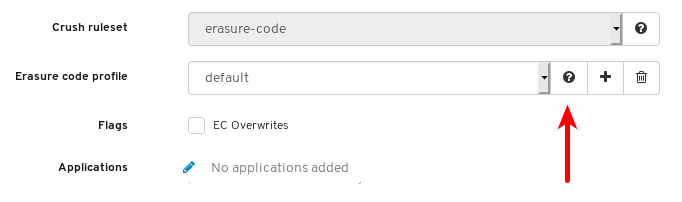
A table of the settings for the selected EC profile is shown.
Optional: Add a new EC profile by clicking the plus symbol.
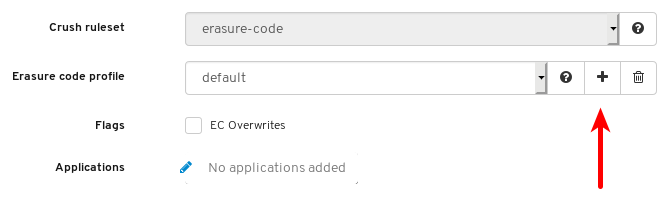
Set the name of the new EC profile, at 1, click any question mark symbol for info about that setting, at 2, and after modifying all required settings, click Create EC Profile, at 3.

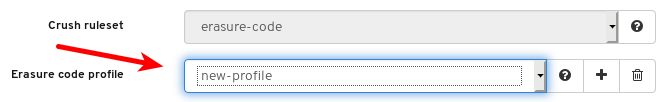
Select the new EC profile.
Optional: If EC overwrites are required, click its button.
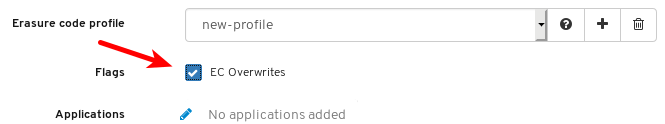
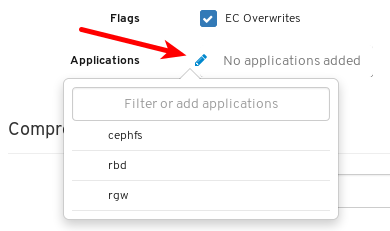
Optional: Click the pencil symbol to select an application for the pool.
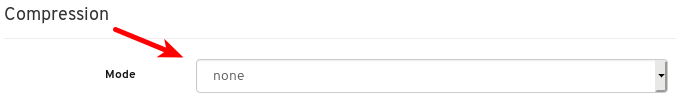
Optional: If compression is required, select passive, aggressive, or force.
Click the Create Pool button.

Notifications towards the top right corner of the page indicate the pool was created successfully.

Additional Resources
- For more information, see Ceph pools in the Architecture Guide.
7.10.2. Editing pools
The Red Hat Ceph Storage Dashboard allows editing of pools.
Prerequisites
- A running Red Hat Ceph Storage cluster.
- Dashboard is installed.
- A pool is created.
Procedure
- Log in to the dashboard.
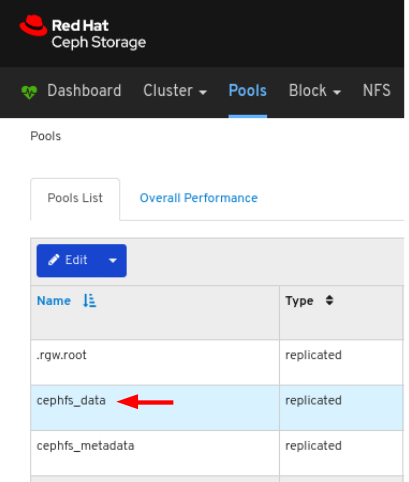
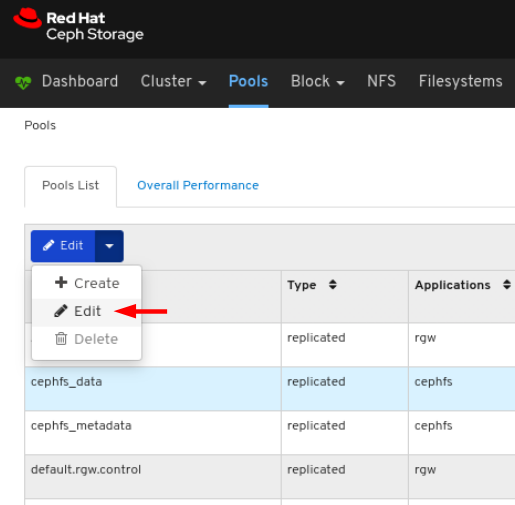
On the navigation bar, click Pools.
To edit the pool, click its row:
Select Edit In the Edit drop-down:
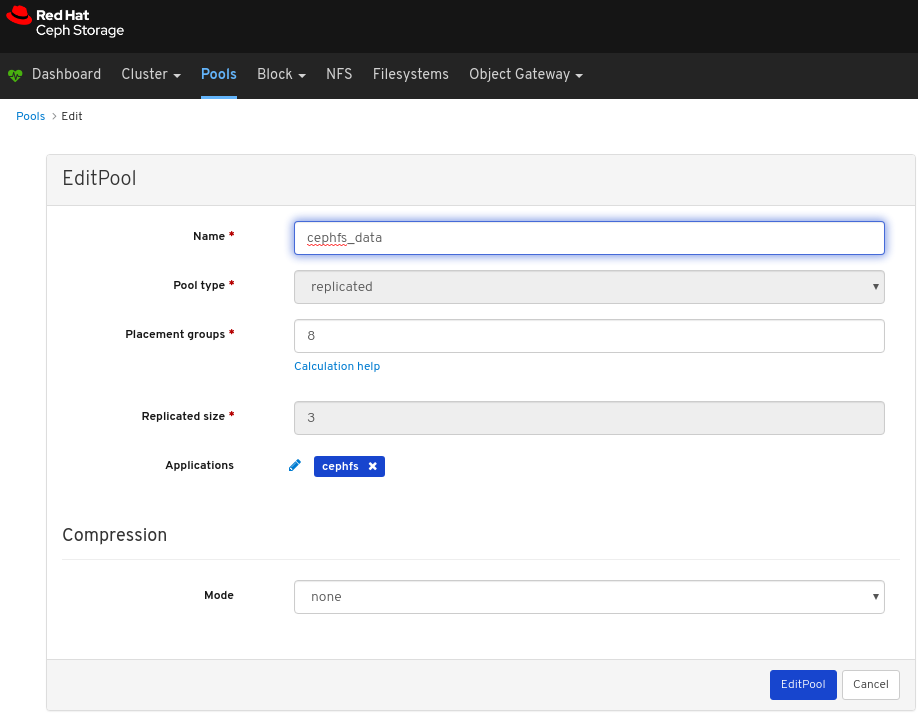
In the dialog window, edit the required parameters and click the EditPool button:
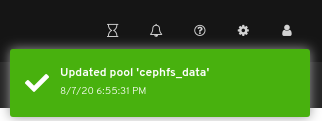
A notifications towards the top right corner of the page indicates the pool was updated successfully.
Additional Resources
- See the Ceph pools in the Red Hat Ceph Storage Architecture Guide for more information.
- See the Pool values in the Red Hat Ceph Storage Storage Strategies Guide for more information on Compression Modes.
7.10.3. Deleting pools
The Red Hat Ceph Storage Dashboard allows deletion of pools.
Prerequisites
- A running Red Hat Ceph Storage cluster.
- Dashboard is installed.
- A pool is created.
Procedure
- Log in to the dashboard.
Ensure the values of
mon_allow_pool_deleteis set totrue:- On the navigation bar, click Cluster and then click Configuration.
In the Level drop-down menu, select Advanced:
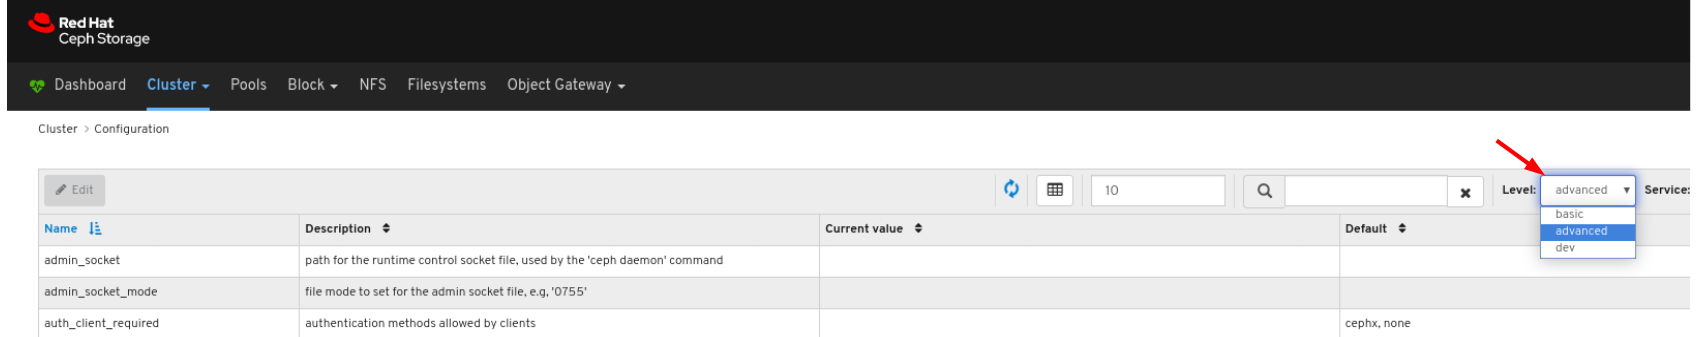
Search for
mon_allow_pool_deleteand set the values totrue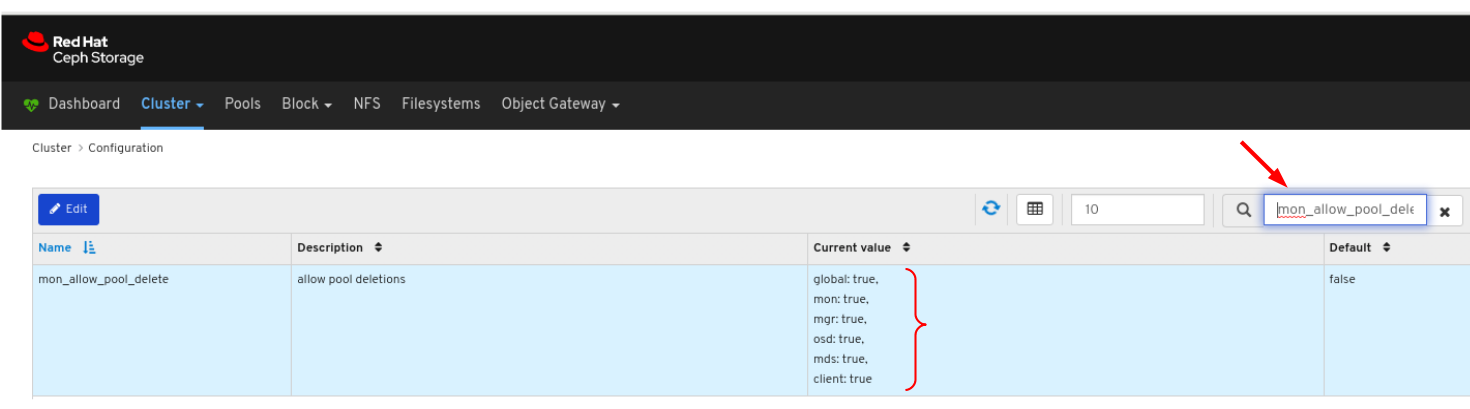
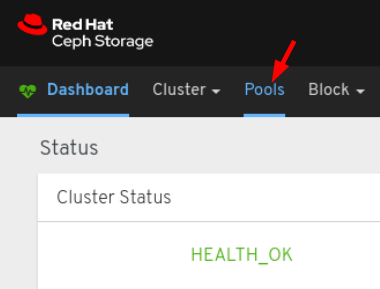
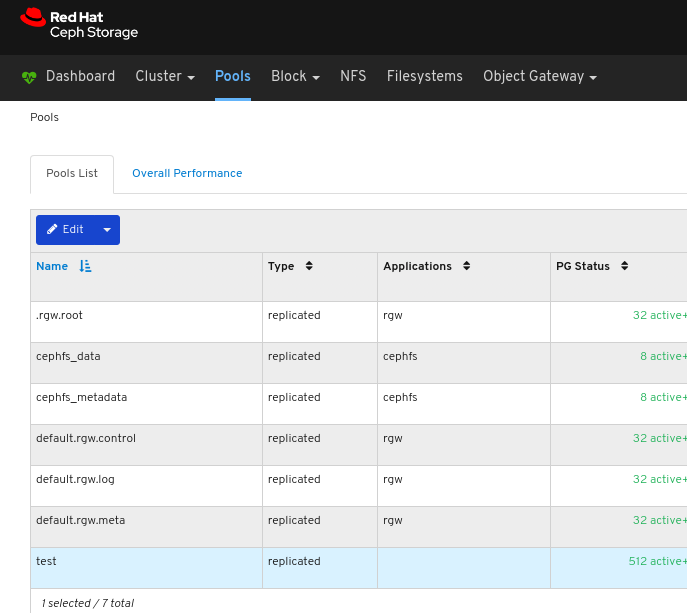
On the navigation bar, click Pools:
To delete the pool, click on its row:
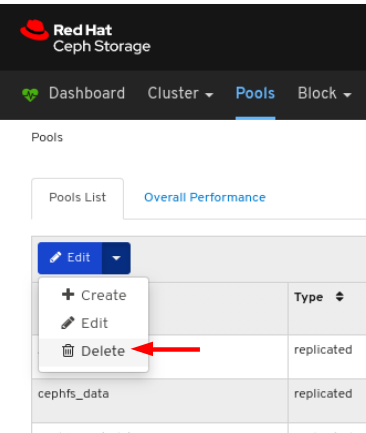
Select Delete in the Edit drop-down:
In the Delete Pool dialog window, Click the Yes, I am sure box and then Click Delete Pool to save the settings:
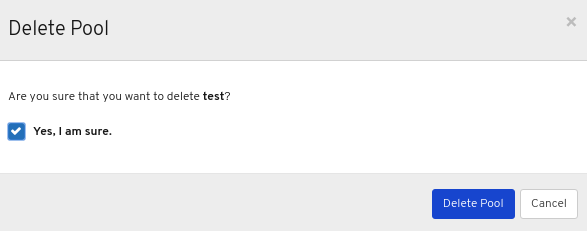
A notification towards the top right corner of the page indicates the pool was deleted successfully.
Additional Resources
- See the Ceph pools in the Red Hat Ceph Storage Architecture Guide for more information.
- See the Monitoring Configuration in the Red Hat Ceph Storage Dashboard Guide for more inforamtion.
- See the Pool values in the Red Hat Ceph Storage Storage Strategies Guide for more information on Compression Modes.
Chapter 8. Object gateway
As a storage administrator, the object gateway functions of the dashboard allow you to manage and monitor the Ceph Object Gateway.
For example, monitoring functions allow you to view details about a gateway daemon such as its zone name, or performance graphs of GET and PUT rates. Management functions allow you to view, create, and edit both users and buckets.
Object gateway functions are divided between daemon functions, user functions, and bucket functions.
8.1. Prerequisites
- A running Red Hat Ceph Storage cluster.
- Dashboard is installed.
- Ceph Object Gateway is installed.
8.2. Object gateway daemon functions
As a storage administrator, the Red Hat Ceph Storage Dashboard allows you to view and monitor information about Ceph Object Gateway daemons.
8.2.1. Prerequisites
- A running Red Hat Ceph Storage cluster.
- Dashboard is installed.
- The Ceph Object Gateway is installed.
- Object gateway login credentials are added to the dashboard.
8.2.2. Viewing object gateway daemons
The dashboard allows you to view a list of all Ceph Object Gateway daemons.
Prerequisites
- A running Red Hat Ceph Storage cluster.
- Dashboard is installed.
- The Ceph Object Gateway is installed.
- Object gateway login credentials are added to the dashboard.
Procedure
- Log in to the Dashboard.
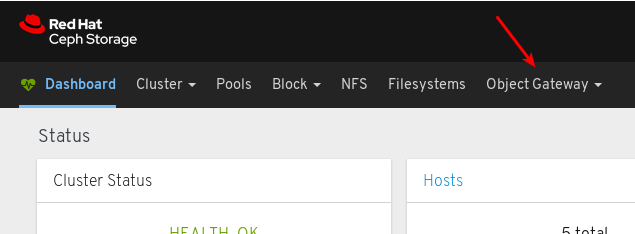
On the navigation bar, click Object Gateway.
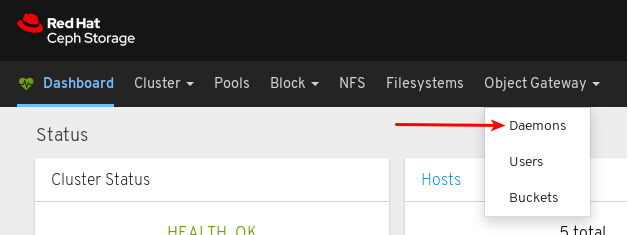
Click Daemons.
In the example below, you can see a daemon with the ID
jb-ceph4-rgw.rgw0in the Daemons List.
To view details, select the daemon by clicking the row for
jb-ceph4-rgw.rgw0: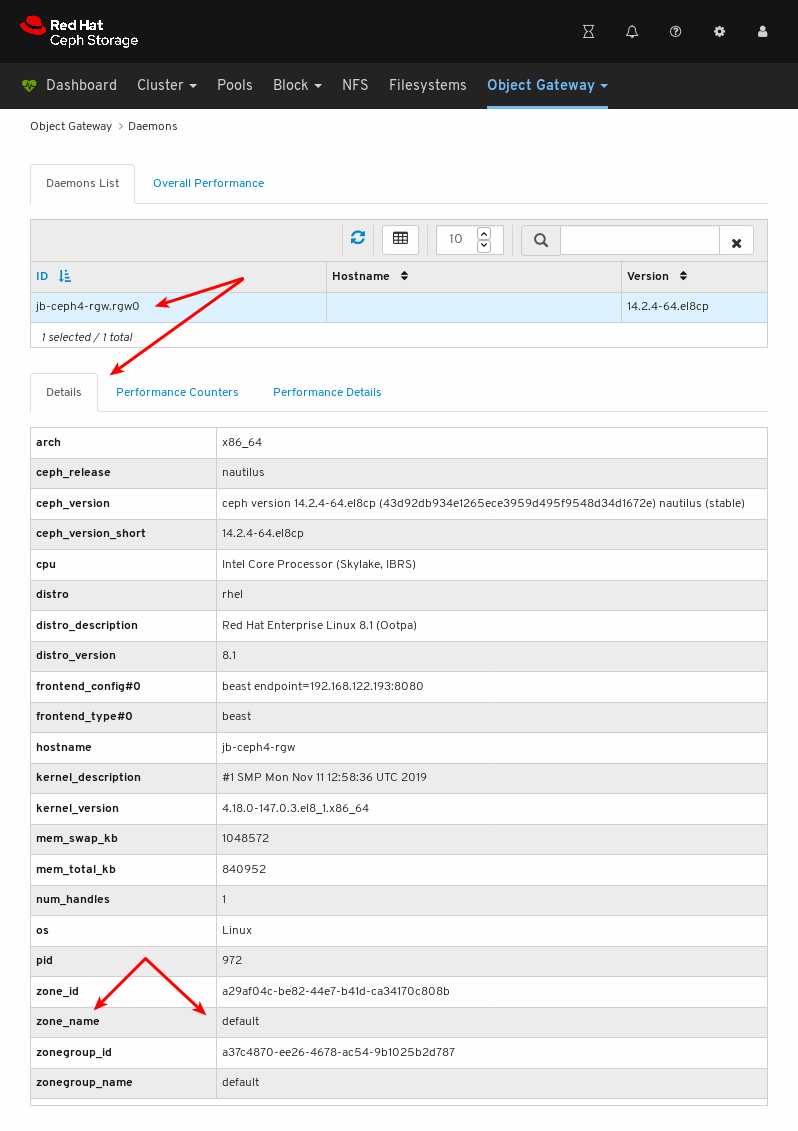
You can see the zone name the daemon is serving is
default.
Additional Resources
- For information on how to install the Ceph Object Gateway, see Installing the Ceph Object Gateway in the Installation Guide.
- For information on how to add object gateway login credentials to the dashboard, see Adding object gateway login credentials to the dashboard in the Dashboard guide.
8.3. Object gateway user functions
As a storage administrator, the Red Hat Ceph Storage Dashboard allows you to view and manage Ceph Object Gateway users.
8.3.1. Prerequisites
- A running Red Hat Ceph Storage cluster.
- Dashboard is installed.
- The Ceph Object Gateway is installed.
- Object gateway login credentials are added to the dashboard.
8.3.2. Viewing object gateway users
The dashboard allows you to view a list of all Ceph Object Gateway users.
Prerequisites
- A running Red Hat Ceph Storage cluster.
- Dashboard is installed.
- The Ceph Object Gateway is installed.
- Object gateway login credentials are added to the dashboard.
Procedure
- Log in to the Dashboard.
On the navigation bar, click Object Gateway.
Click Users.
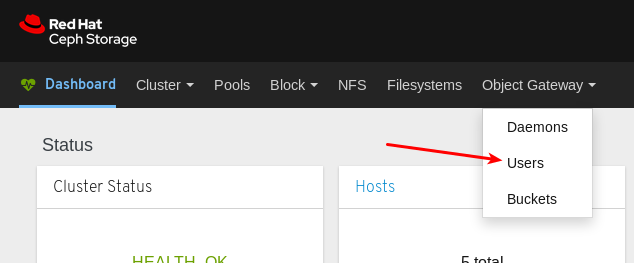
In the example below, you can see a user named
rgw-userin the table.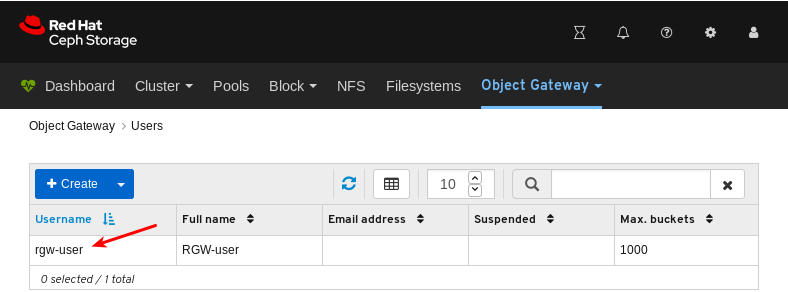
To view details, select the user by clicking the row for
rgw-user:
Additional Resources
- For information on how to install the Ceph Object Gateway, see Installing the Ceph Object Gateway in the Installation Guide.
- For information on how to add object gateway login credentials to the dashboard, see Adding object gateway login credentials to the dashboard in the Dashboard guide.
- For more information on the Ceph Object Gateway, see the Object Gateway Configuration and Administration Guide.
8.3.3. Creating object gateway users
The dashboard allows you to create Ceph Object Gateway users.
Prerequisites
- A running Red Hat Ceph Storage cluster.
- Dashboard is installed.
- The Ceph Object Gateway is installed.
- Object gateway login credentials are added to the dashboard.
Procedure
- Log in to the Dashboard.
On the navigation bar, click Object Gateway.
Click Users.
Click Create.
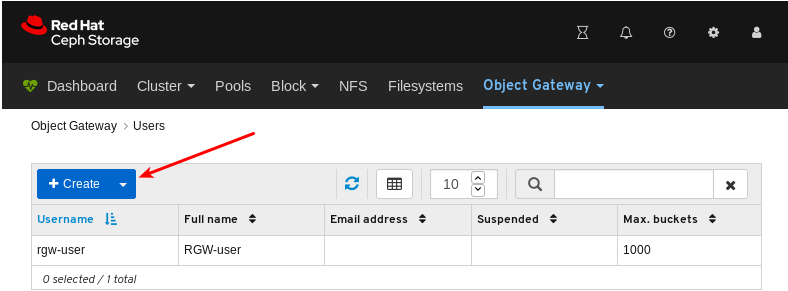
Set the user name, full name, and edit the maximum number of buckets if required.
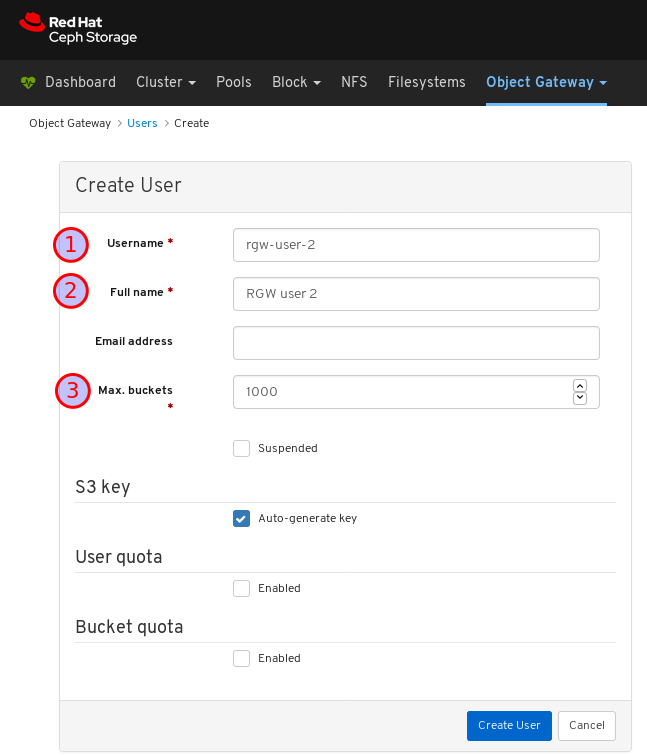
Optional: Set an email address or suspended status.
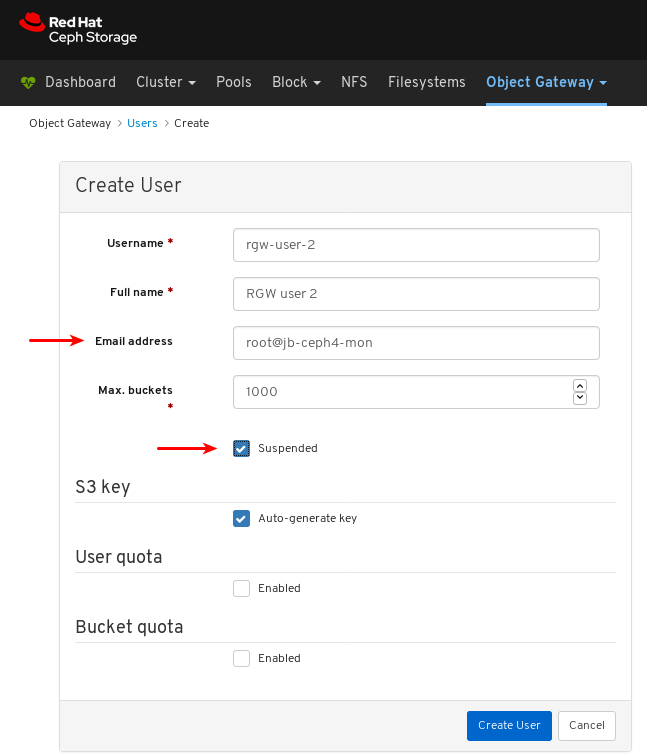
Optional: Set a custom access key and secret key by unchecking Auto-generate key.
Uncheck Auto-generate key:
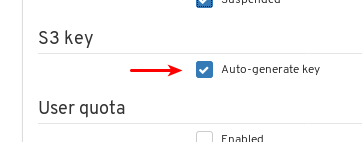
Set the access key and secret key:

Optional: Set a user quota.
Check Enabled under User quota:
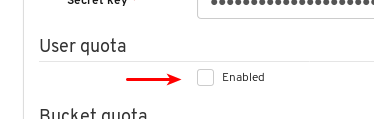
Uncheck Unlimited size or Unlimited objects:
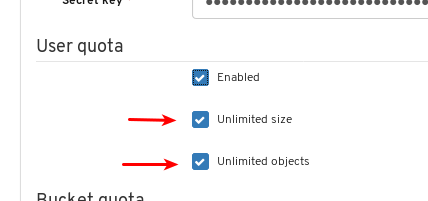
Enter the required values for Max. size or Max. objects:
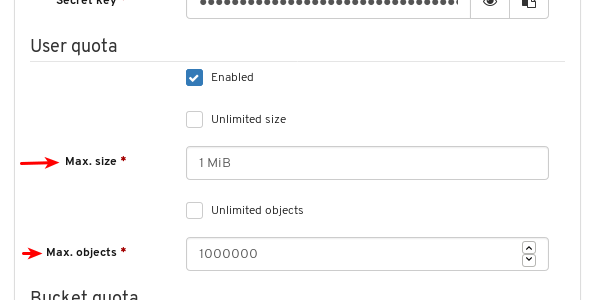
Optional: Set a bucket quota.
Check Enabled under Bucket quota:
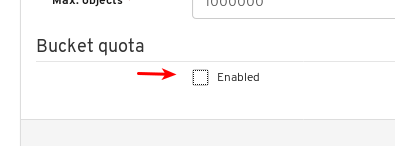
Uncheck Unlimited size or Unlimited objects:
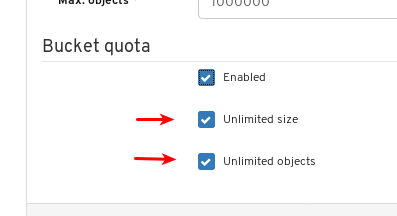
Enter the required values for Max. size or Max. objects:
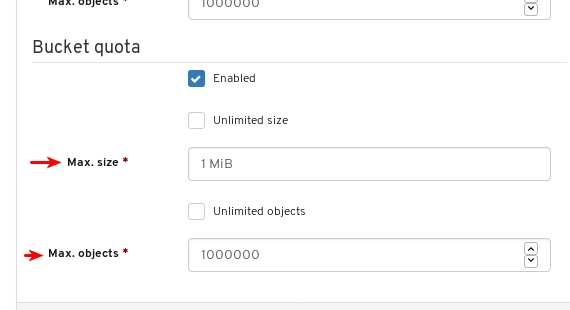
Finalize the user creation by clicking Create User.
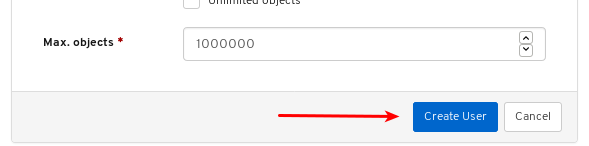
Verify the user creation was successful. A notification confirms the user was created and the user can be seen in the table of users.
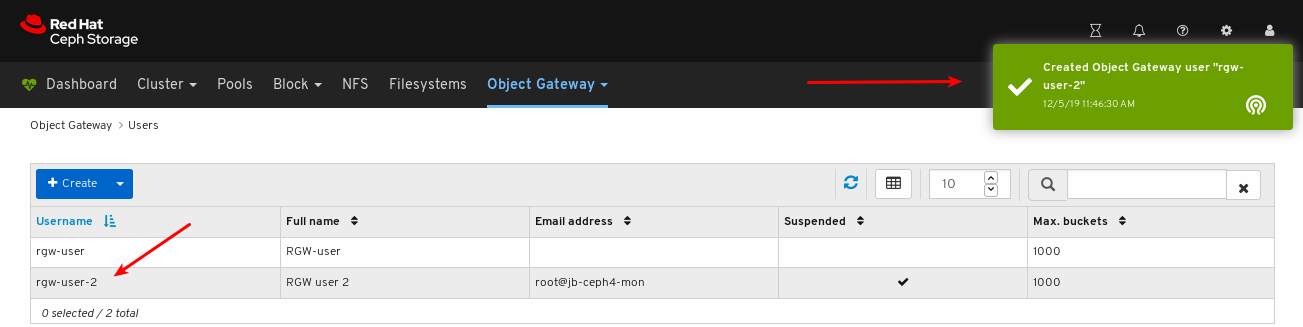
Additional Resources
- For information on how to install the Ceph Object Gateway, see Installing the Ceph Object Gateway in the Installation Guide.
- For information on how to add object gateway login credentials to the dashboard, see Adding object gateway login credentials to the dashboard in the Dashboard guide.
- For more information on the Ceph Object Gateway, see the Object Gateway Configuration and Administration Guide.
8.3.4. Editing object gateway users
The dashboard allows you to edit Ceph Object Gateway users.
Prerequisites
- A running Red Hat Ceph Storage cluster.
- Dashboard is installed.
- The Ceph Object Gateway is installed.
- Object gateway login credentials are added to the dashboard.
- A Ceph Object Gateway user created.
Procedure
- Log in to the Dashboard.
On the navigation bar, click Object Gateway:
Click Users:
To edit the user capabilities, click its row:
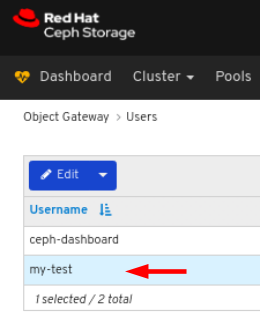
Select Edit In the Edit drop-down:
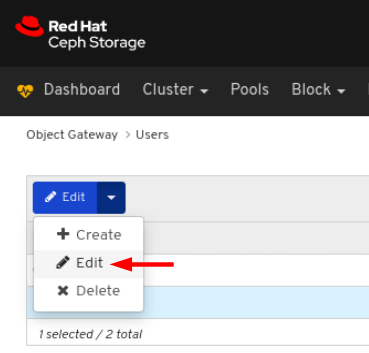
In the EditUser window, edit the required parameters and click the EditUser button:
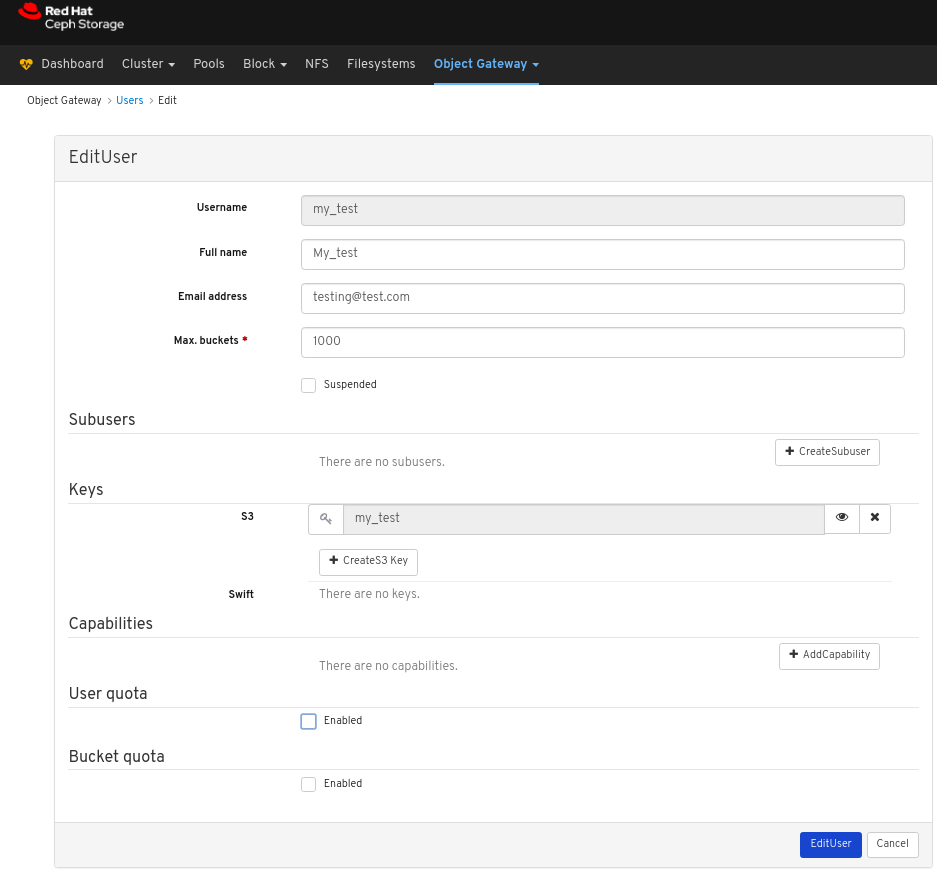
A notification towards the top right corner of the page indicates the user was updated successfully.
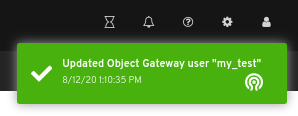
8.3.5. Deleting object gateway users
The dashboard allows you to delete Ceph Object Gateway users.
Prerequisites
- A running Red Hat Ceph Storage cluster.
- Dashboard is installed.
- The Ceph Object Gateway is installed.
- Object gateway login credentials are added to the dashboard.
- A Ceph Object Gateway user created.
Procedure
- Log in to the Dashboard.
On the navigation bar, click Object Gateway:
Click Users:
To delete the user, click its row:
Select Delete In the Edit drop-down:
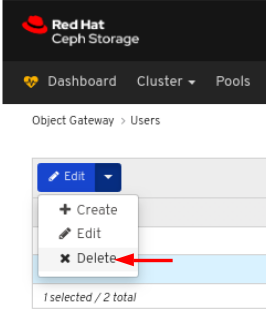
In the Delete User dialog window, Click the Yes, I am sure box and then Click Delete User to save the settings:

8.3.6. Creating object gateway subusers
A subuser is associated with a user of the S3 interface. The dashboard allows you to create Ceph Object Gateway subusers.
Prerequisites
- A running Red Hat Ceph Storage cluster.
- Dashboard is installed.
- The Ceph Object Gateway is installed.
- Object gateway login credentials are added to the dashboard.
- Object gateway user is created.
Procedure
- Log in to the Dashboard.
On the navigation bar, click Object Gateway.
Click Users from the drop-down menu.
In the example below, you can see a user named
ceph-dashboardin the table. Select the user by clicking its row.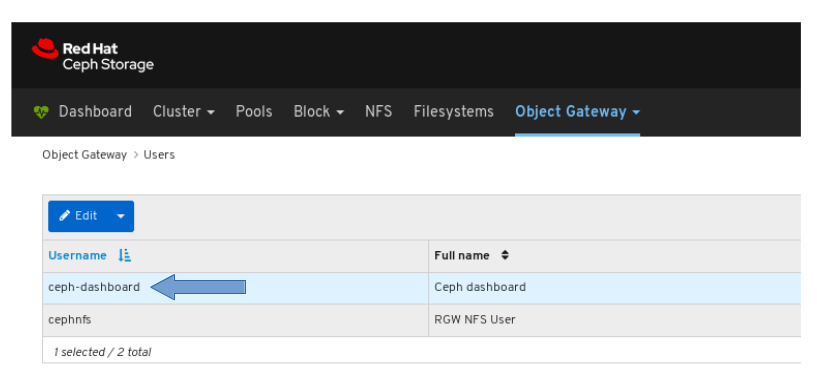
Click Edit drop-down menu, and then select Edit.
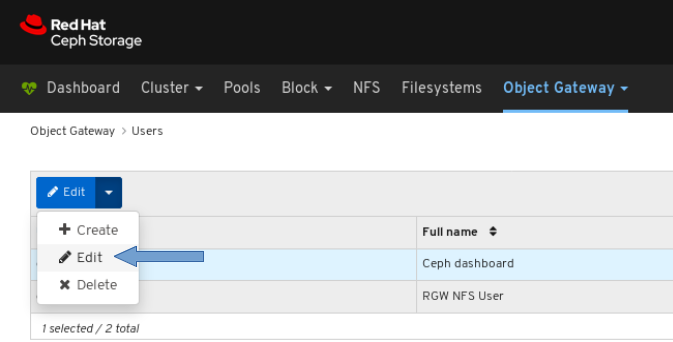
Click the +CreateSubuser button.
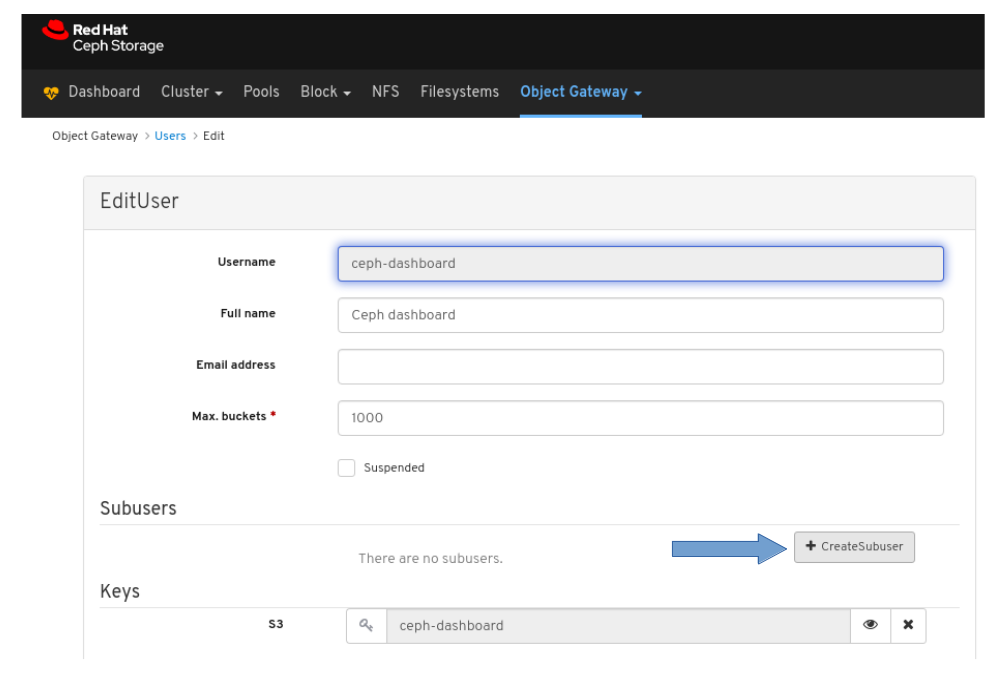
Enter a Subuser name and select the appropriate permissions.
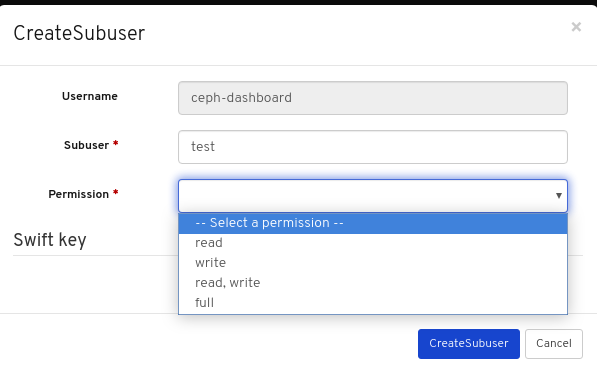
Click the Auto-generate secret box and then click the Create Subuser button.
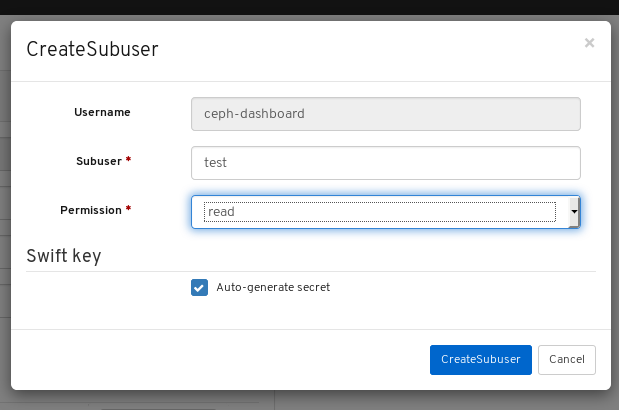 Note
NoteBy clicking Auto-generate-secret checkbox, the secret key for object gateway is generated automatically.
Click the Edit user button in the Edit User window.
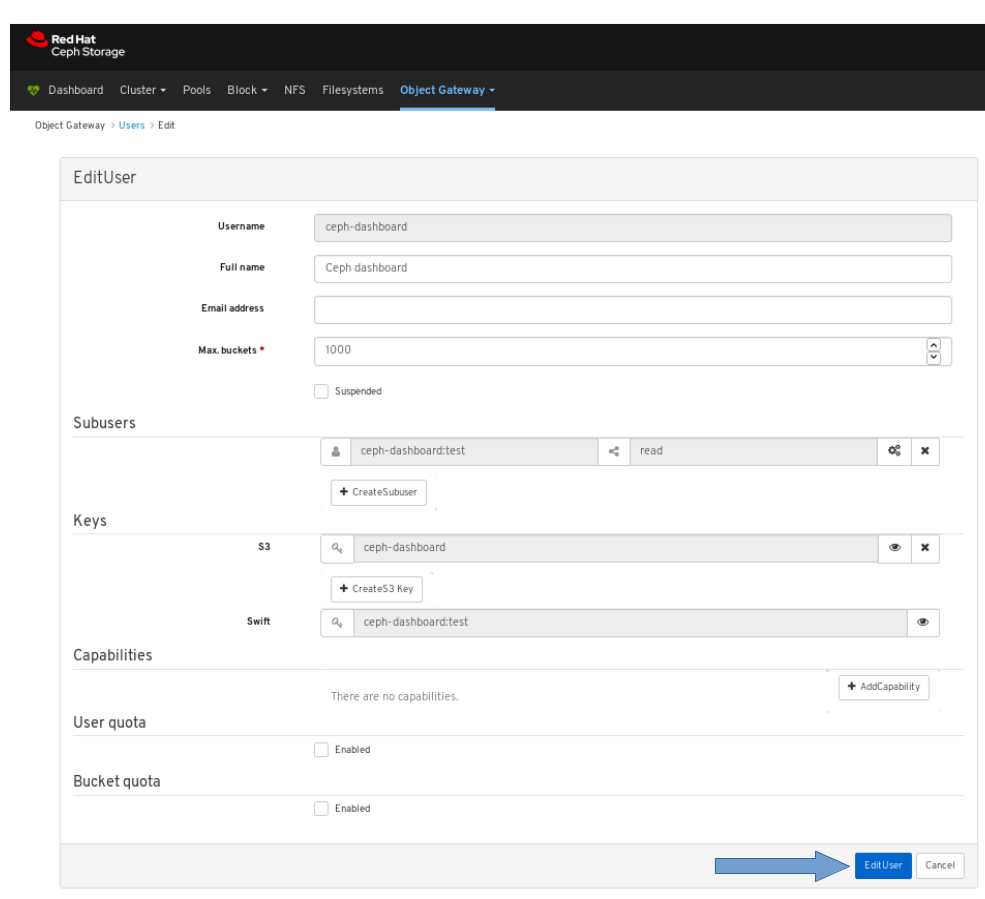
Verify the subuser creation was successful. A notification towards the top right corner of the page pops up indicating that the Object Gateway user was updated successfully.
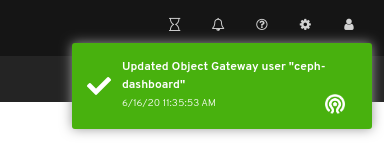
Additional Resources
- For information on how to install the Ceph Object Gateway, see the Installing the Ceph Object Gateway in the Red Hat Ceph Storage Installation Guide.
- For information on how to manually add object gateway login credentials to the dashboard, see the Manually adding object gateway login credentials to the dashboard in the Dashboard guide.
- For more information on the Ceph Object Gateway, see the Object Gateway Configuration and Administration Guide.
8.4. Object gateway bucket functions
As a storage administrator, the Red Hat Ceph Storage Dashboard allows you to view and manage Ceph Object Gateway buckets.
8.4.1. Prerequisites
- A running Red Hat Ceph Storage cluster.
- Dashboard is installed.
- The Ceph Object Gateway is installed.
- Object gateway login credentials are added to the dashboard.
8.4.2. Viewing object gateway buckets
The dashboard allows you to view and manage Ceph Object Gateway buckets.
Prerequisites
- A running Red Hat Ceph Storage cluster.
- Dashboard is installed.
- The Ceph Object Gateway is installed.
- Object gateway login credentials are added to the dashboard.
- An object gateway bucket is created.
Procedure
- Log in to the Dashboard.
On the navigation bar, click Object Gateway.
Click Buckets.
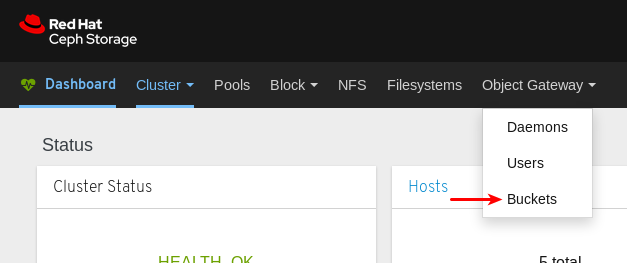
In the example below, you can see a bucket named
my-bucketin the table.
To view details, select the bucket by clicking the row for
my-bucket.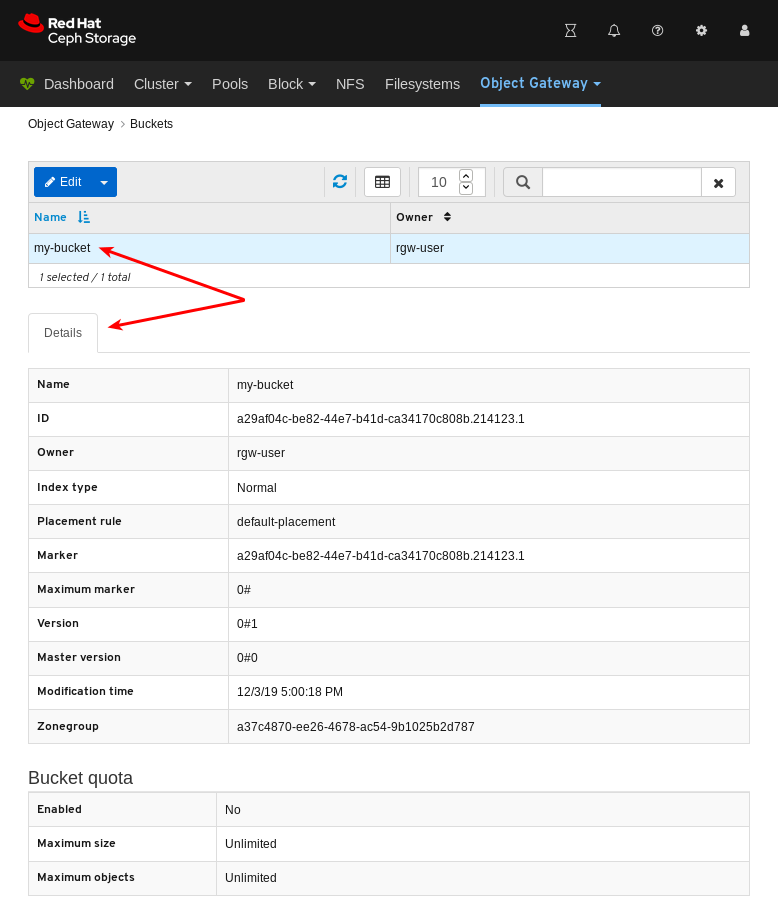
Additional Resources
- For information on how to install the Ceph Object Gateway, see Installing the Ceph Object Gateway in the Installation Guide.
- For information on how to add object gateway login credentials to the dashboard, see Adding object gateway login credentials to the dashboard in the Dashboard guide.
- For more information on the Ceph Object Gateway, see the Object Gateway Configuration and Administration Guide.
8.4.3. Creating object gateway buckets
The dashboard allows you to create Ceph Object Gateway buckets.
Prerequisites
- A running Red Hat Ceph Storage cluster.
- Dashboard is installed.
- The Ceph Object Gateway is installed.
- Object gateway login credentials are added to the dashboard.
- An object gateway user that is not suspended is created.
Procedure
- Log in to the Dashboard.
On the navigation bar, click Object Gateway.
Click Buckets.
Click Create.
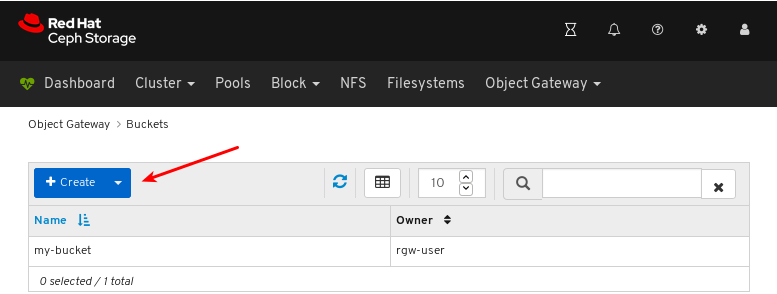
Enter a value for Name and select a user that is not suspended.

Click Create bucket.
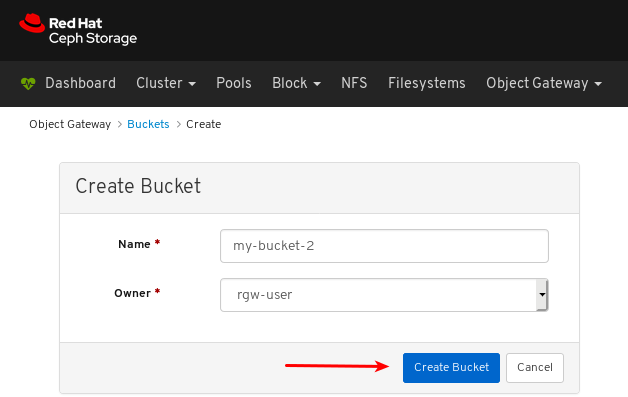
Verify the bucket creation was successful. A notification confirms the bucket was created and the bucket can be seen in the table of buckets.
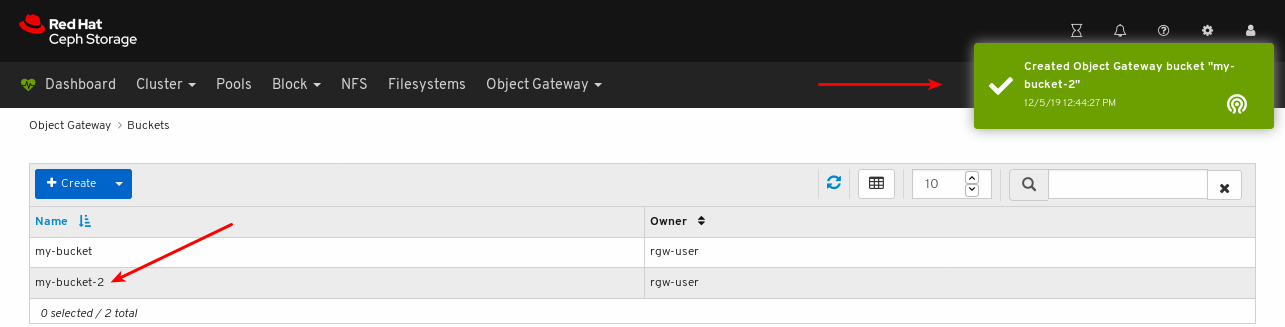
Additional Resources
- For information on how to install the Ceph Object Gateway, see Installing the Ceph Object Gateway in the Installation Guide.
- For information on how to add object gateway login credentials to the dashboard, see Adding object gateway login credentials to the dashboard in the Dashboard guide.
- For more information on the Ceph Object Gateway, see the Object Gateway Configuration and Administration Guide.
8.4.4. Editing object gateway buckets
The dashboard allows you to edit Ceph Object Gateway buckets.
Prerequisites
- A running Red Hat Ceph Storage cluster.
- Dashboard is installed.
- The Ceph Object Gateway is installed.
- Object gateway login credentials are added to the dashboard.
- A Ceph Object Gateway user that is not suspended is created.
- A Ceph Object Gateway bucket created.
Procedure
- Log in to the Dashboard.
On the navigation bar, click Object Gateway:
Click Buckets:
To edit the bucket, click its row:
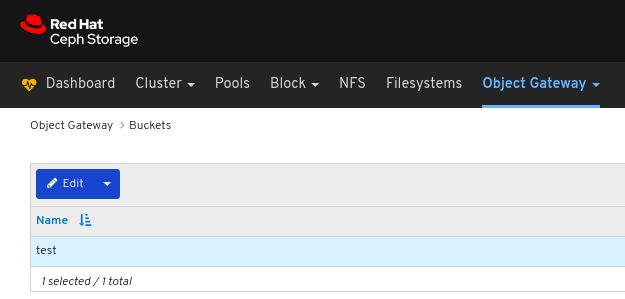
Select Edit In the Edit drop-down:
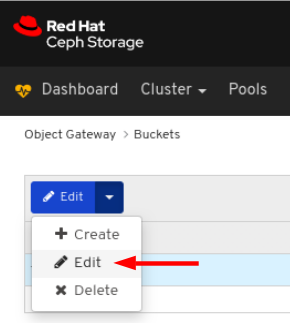
In the EditBucket window, edit the required parameters and click the EditBucket button:
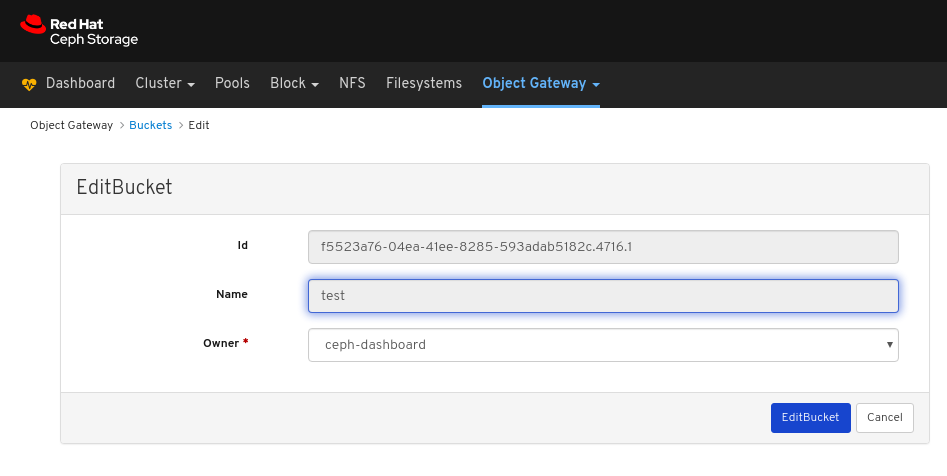
A notification towards the top right corner of the page indicates the bucket was updated successfully.
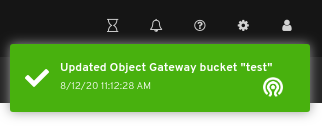
Additional Resources
- See the Installing the Ceph Object Gateway section in the Red Hat Ceph Storage Installation Guide for more information.
- See the Adding object gateway login credentials to the dashboard section in the Red Hat Ceph Storage Dashboard Guide for more information.
8.4.5. Deleting object gateway buckets
The dashboard allows you to delete Ceph Object Gateway buckets.
Prerequisites
- A running Red Hat Ceph Storage cluster.
- Dashboard is installed.
- The Ceph Object Gateway is installed.
- Object gateway login credentials are added to the dashboard.
- A Ceph Object Gateway user that is not suspended is created.
- A Ceph Object Gateway bucket created.
Procedure
- Log in to the Dashboard.
On the navigation bar, click Object Gateway:
Click Buckets:
To delete the bucket, click its row:
Select Delete In the Edit drop-down:
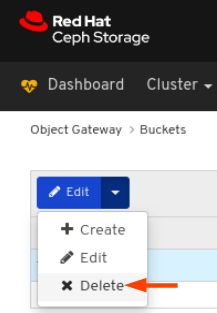
In the Delete Bucket dialog window, Click the Yes, I am sure box and then Click Delete bucket to save the settings:

8.5. Manually adding object gateway login credentials to the dashboard
The Red Hat Ceph Storage Dashboard can manage the Ceph Object Gateway, also known as the RADOS Gateway, or RGW. To manage the Ceph Object Gateway, the dashboard must connect to it using login credentials of an RGW user with the system flag. When the Object Gateway is installed using ceph-ansible, it automatically adds the login credentials to the dashboard. It is also possible to set the login credentials manually.
Prerequisites
- A running Red Hat Ceph Storage cluster.
- Dashboard is installed.
- Ceph Object Gateway is installed.
Procedure
Obtain the
access_keyandsecret_keyof an RGW user with thesystemflag enabled:If you do not have an RGW user with the
systemflag enabled, create one.radosgw-admin user create --uid=USER_ID --display-name=DISPLAY_NAME --systemExample:
[root@mon ~]# radosgw-admin user create --uid=rgw-user --display-name=RGW-user --system
{
    "user_id": "rgw-user",
    "display_name": "RGW-user",
    "email": "",
    "suspended": 0,
    "max_buckets": 1000,
    "subusers": [],
    "keys": [
        {
            "user": "rgw-user",
            "access_key": "BYC5SWQQH24A2BFHS2RC",
            "secret_key": "159d94uHK9ADiWZrGsNYWYjRXCDrhL2xVi8PO6kT"
        }
    ],
    "swift_keys": [],
    "caps": [],
    "op_mask": "read, write, delete",
    "system": "true",
    "default_placement": "",
    "default_storage_class": "",
    "placement_tags": [],
    "bucket_quota": {
        "enabled": false,
        "check_on_raw": false,
        "max_size": -1,
        "max_size_kb": 0,
        "max_objects": -1
    },
    "user_quota": {
        "enabled": false,
        "check_on_raw": false,
        "max_size": -1,
        "max_size_kb": 0,
        "max_objects": -1
    },
    "temp_url_keys": [],
    "type": "rgw",
    "mfa_ids": []
}
Take note of the values for
access_keyandsecret_key. In the example above,access_keyisBYC5SWQQH24A2BFHS2RCandsecret_keyis159d94uHK9ADiWZrGsNYWYjRXCDrhL2xVi8PO6kT.If an RGW user with the
systemflag enabled is already created, obtain the credentials using theuser infocommand of theradosgw-adminutility.radosgw-admin user info --uid=USER_IDExample:
[root@mon ~]# radosgw-admin user info --uid=rgw-user
{
    "user_id": "rgw-user",
    "display_name": "RGW-user",
    "email": "",
    "suspended": 0,
    "max_buckets": 1000,
    "subusers": [],
    "keys": [
        {
            "user": "rgw-user",
            "access_key": "BYC5SWQQH24A2BFHS2RC",
            "secret_key": "159d94uHK9ADiWZrGsNYWYjRXCDrhL2xVi8PO6kT"
        }
    ],
    "swift_keys": [],
    "caps": [],
    "op_mask": "read, write, delete",
    "system": "true",
    "default_placement": "",
    "default_storage_class": "",
    "placement_tags": [],
    "bucket_quota": {
        "enabled": false,
        "check_on_raw": false,
        "max_size": -1,
        "max_size_kb": 0,
        "max_objects": -1
    },
    "user_quota": {
        "enabled": false,
        "check_on_raw": false,
        "max_size": -1,
        "max_size_kb": 0,
        "max_objects": -1
    },
    "temp_url_keys": [],
    "type": "rgw",
    "mfa_ids": []
}
Take note of the values for
access_keyandsecret_key. In the example above,access_keyisBYC5SWQQH24A2BFHS2RCandsecret_keyis159d94uHK9ADiWZrGsNYWYjRXCDrhL2xVi8PO6kT.
Provide the
access_keyandsecret_keycredentials to the dashboard:Provide the
access_keyto the dashboard.ceph dashboard set-rgw-api-access-key ACCESS_KEYExample:
[root@mon ~]# ceph dashboard set-rgw-api-access-key BYC5SWQQH24A2BFHS2RC
Option RGW_API_ACCESS_KEY updated
Provide the
secret_keyto the dashboard.ceph dashboard set-rgw-api-secret-key SECRET_KEYExample:
[root@mon ~]# ceph dashboard set-rgw-api-secret-key 159d94uHK9ADiWZrGsNYWYjRXCDrhL2xVi8PO6kT
Option RGW_API_SECRET_KEY updated
Provide the host name and port of the object gateway to the dashboard:
Provide the host name to the dashboard.
ceph dashboard set-rgw-api-host HOST_NAMEExample:
[root@mon ~]# ceph dashboard set-rgw-api-host 192.168.122.193
Option RGW_API_HOST updated
Provide the port to the dashboard.
ceph dashboard set-rgw-api-port PORTExample:
[root@mon ~]# ceph dashboard set-rgw-api-port 8080
Option RGW_API_PORT updated
Optional: If you are using HTTPS with a self-signed certificate, disable certificate verification in the dashboard to avoid refused connections.
Refused connections can happen when the certificate is signed by an unknown Certificate Authority, or if the host name used does not match the host name in the certificate.
ceph dashboard set-rgw-api-ssl-verify falseExample:
[root@mon ~]# ceph dashboard set-rgw-api-ssl-verify false
Option RGW_API_SSL_VERIFY updated
Additional Resources
- For information on how to install the Ceph Object Gateway, see Installing the Ceph Object Gateway in the Installation Guide.
- For more information on the Ceph Object Gateway, see the Object Gateway Configuration and Administration Guide.
Chapter 9. Block devices
9.1. Block devices introduction
The block device functions of the dashboard allow you to manage and monitor block device images. The functionality is divided between generic image functions, mirroring functions, iSCSI functions, and Quality of Service configuration. For example, you can create new images, view the state of images mirrored across clusters, manage or monitor iSCSI targets, and set IOPS limits on an image.
9.2. Images functions
The dashboard provides several functions related to managing and monitoring images.
9.2.1. Prerequisites
- A running Red Hat Ceph Storage cluster.
- Dashboard is installed.
9.2.2. Creating images
The dashboard allows you to create images.
Prerequisites
- A running Red Hat Ceph Storage cluster.
- Dashboard is installed.
- A pool with the rbd application enabled is created.
Procedure
- Log in to the Dashboard.
On the navigation bar, click the Block:
Select Images from the drop-down:
In the Images tab, Click the Create button:
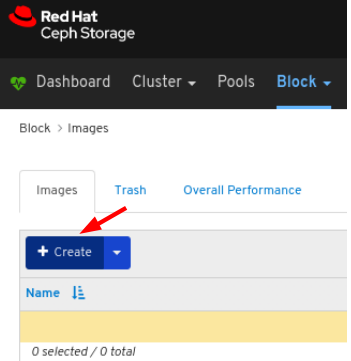
In the CreateRBD window, enter the parameters:
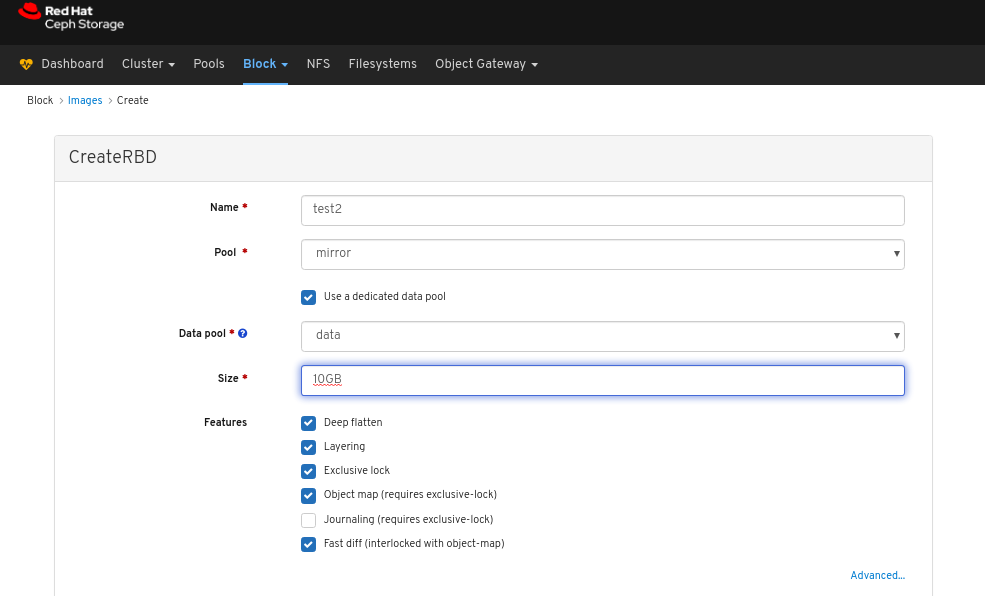
Optional: Click Advanced and set the parameters:
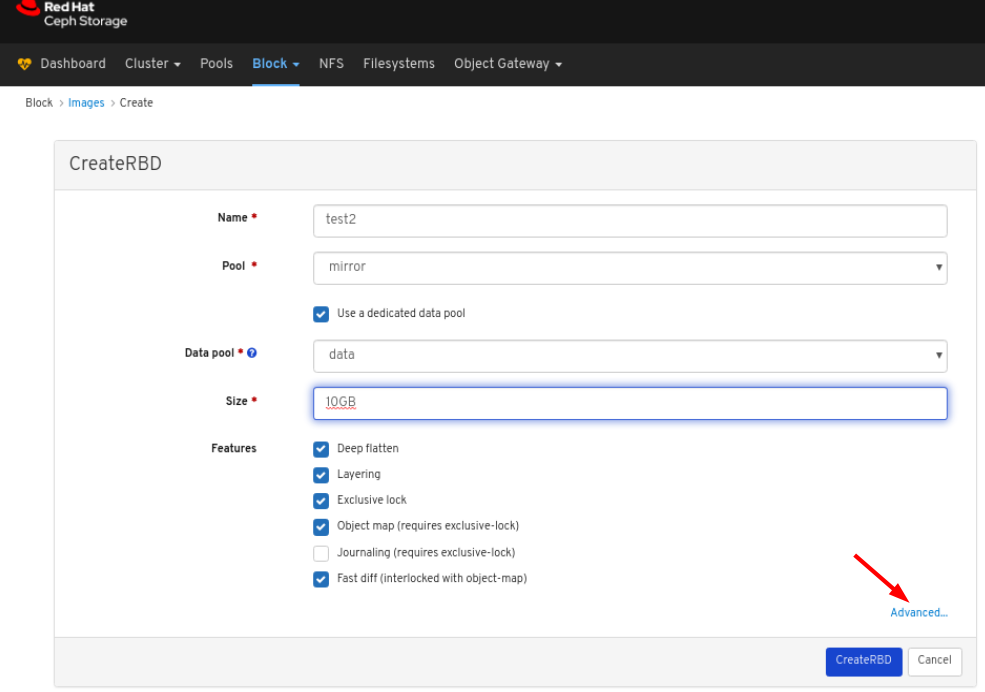
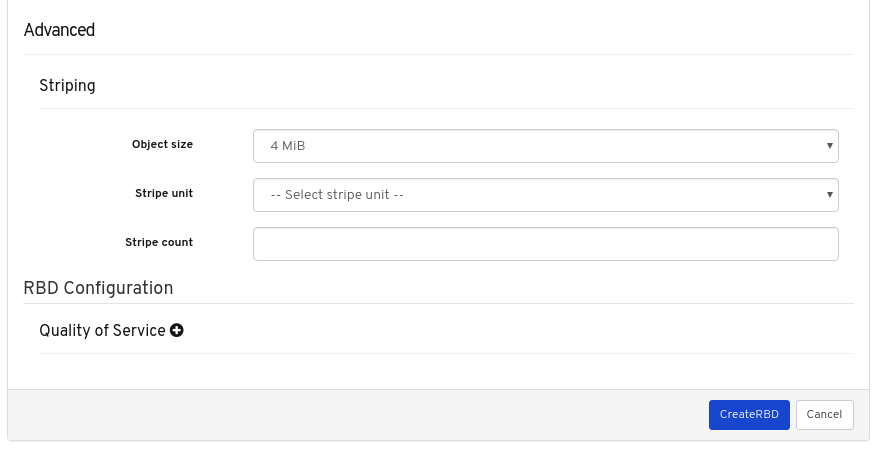
Click the CreateRBD button:
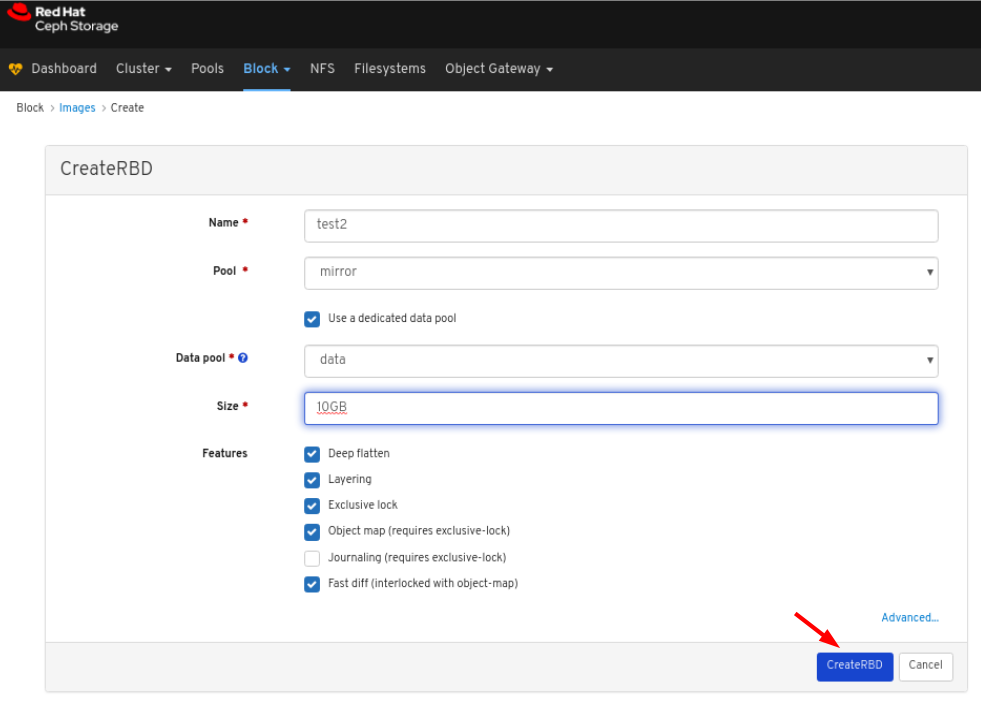
Notifications towards the top right corner of the page indicate the image was created successfully.
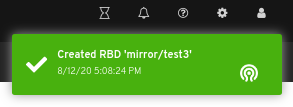
Additional Resources
- See the Red Hat Ceph Storage Block Device Guide for more information on Images.
- See the Creating pools section in the Red Hat Ceph Storage Dashboard Guide for more details on creating RBD pools.
9.2.3. Viewing images
The dashboard allows you to view images.
Prerequisites
- A running Red Hat Ceph Storage cluster.
- Dashboard is installed.
- An image is in the cluster.
Procedure
- Log in to the Dashboard.
- On the navigation bar, click Block.
Click Images:
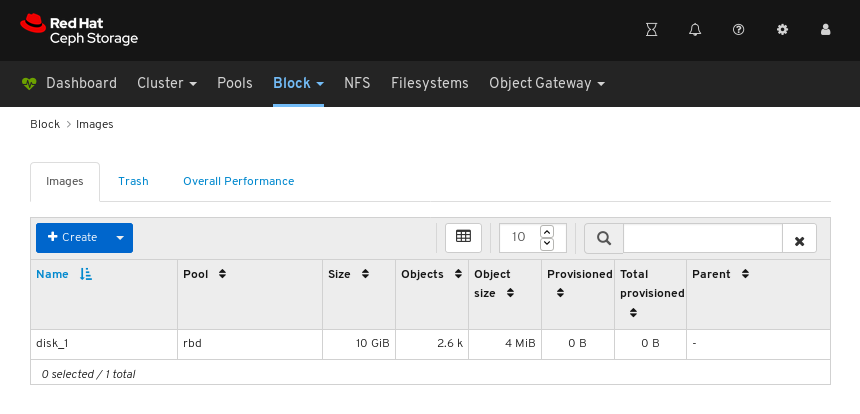
In the above example, you can see a 10 GiB image named disk_1.
To view details, select the image by clicking the row for disk_1:
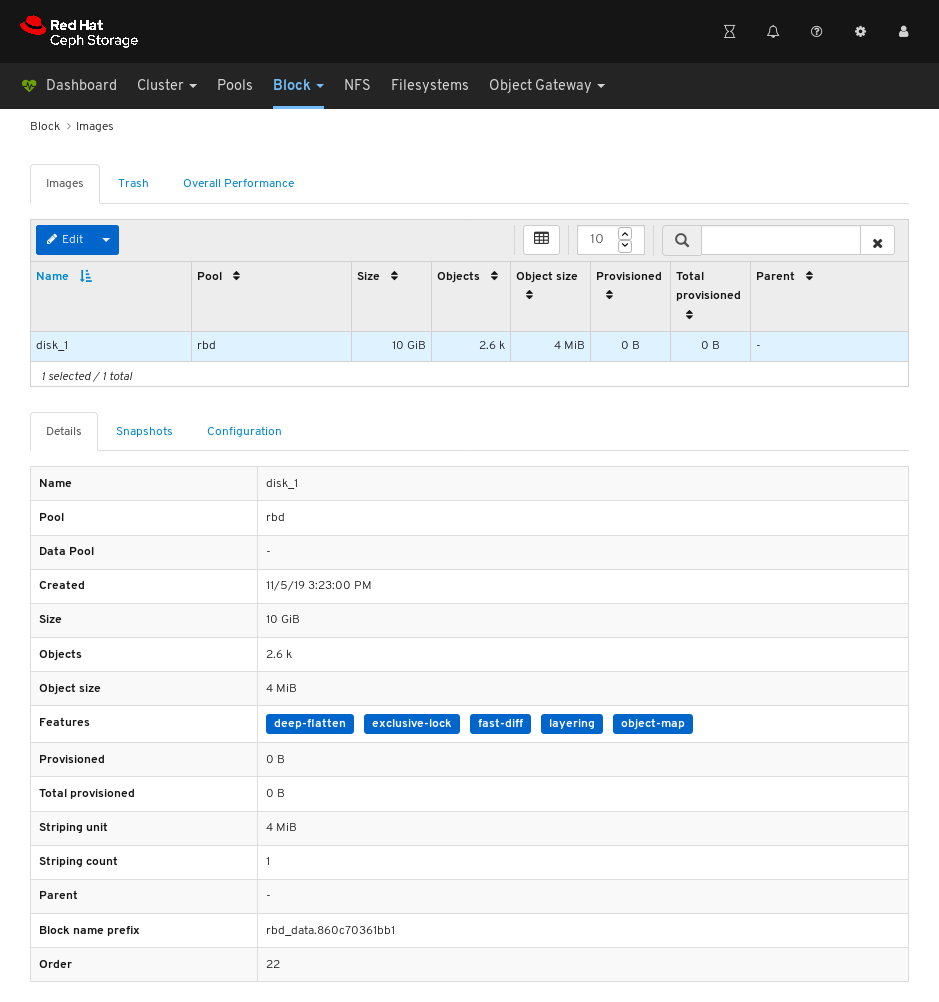
Additional Resources
- For more information on images, see the Block Device Guide.
9.2.4. Editing images
The dashboard allows you to edit images
Prerequisites
- A running Red Hat Ceph Storage cluster.
- Dashboard is installed.
- A pool with the rbd application enabled is created.
- An image is created.
Procedure
- Log in to the Dashboard.
On the navigation bar, click Block:
Select Images from the drop-down:
To edit the image, in the Images tab, click its row:
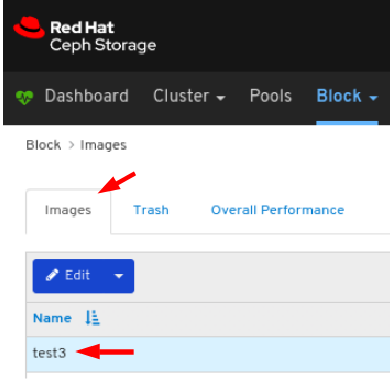
Select Edit In the Edit drop-down:
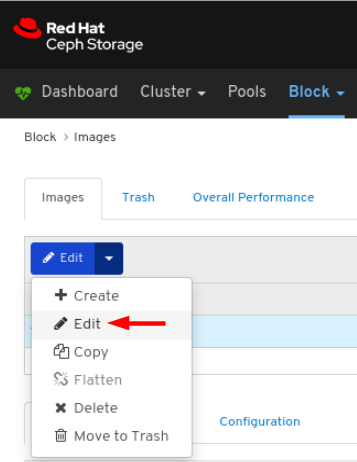
In the EditRBD dialog, edit the required parameters and click the EditRBD button:
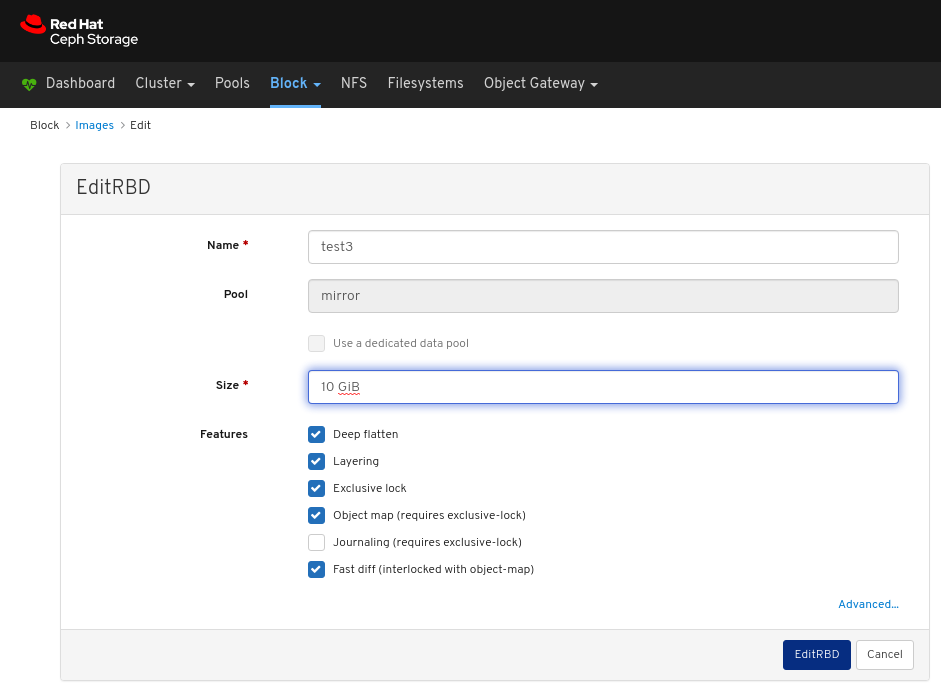
A notification towards the top right corner of the page indicates the image was updated successfully.

Additional Resources
- See the Creating Images section in the Red Hat Ceph Storage Dashboard Guide for more information.
9.2.5. Copying images
The dashboard allows you to copy images.
Prerequisites
- A running Red Hat Ceph Storage cluster.
- Dashboard is installed.
- A pool with the rbd application enabled is created.
- An image is created.
Procedure
- Log in to the Dashboard.
On the navigation bar, click Block:
Select Images from the drop-down:
To copy the image, in the Images tab, click its row:
Select Copy In the Edit drop-down:
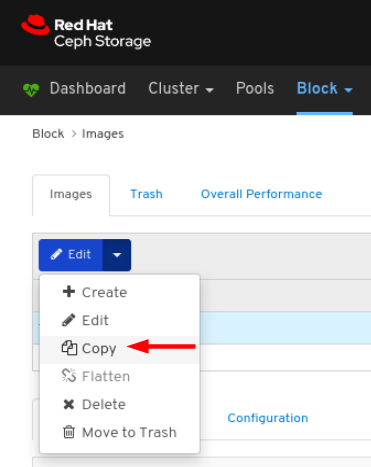
In the CopyRBD window, edit the required parameters and click the CopyRBD button:
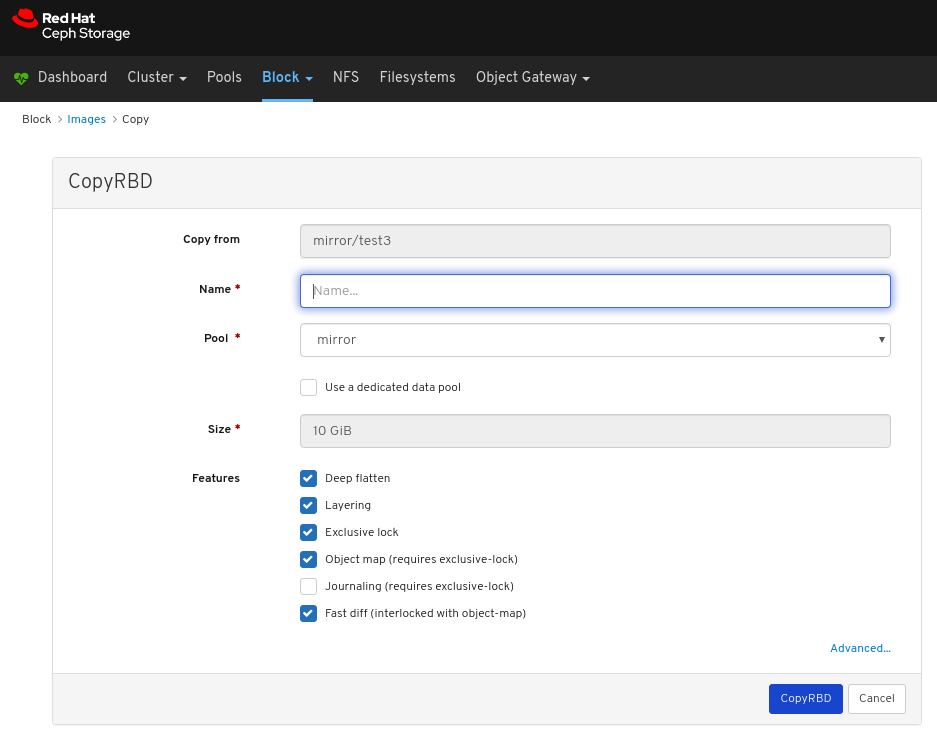
A notification towards the top right corner of the page indicates the image was updated successfully.
Additional Resources
- See the Creating Images section in the Red Hat Ceph Storage Dashboard Guide for more information.
9.2.6. Moving images to trash
The dashboard allows you to move images to trash.
Prerequisites
- A running Red Hat Ceph Storage cluster.
- Dashboard is installed.
- A pool with the rbd application enabled is created.
- An image is created.
Procedure
- Log in to the Dashboard.
On the navigation bar, click Block:
Select Images from the drop-down:
To move the image to Trash, in the Images tab, click its row:
Select Move to Trash In the Edit drop-down:
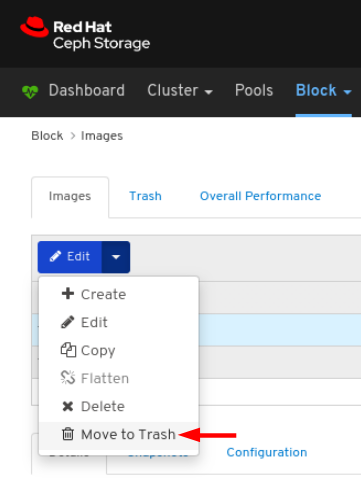
In the Moving an image to trash window, edit the date till which the image needs protection, and then click the Move Image button:
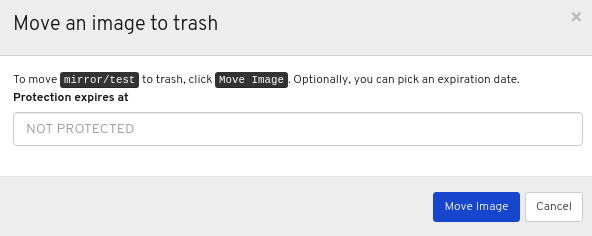
A notification towards the top right corner of the page indicates the image was moved to trash successfully.
9.2.7. Purging trash
The dashboard allows you to purge trash of images.
Prerequisites
- A running Red Hat Ceph Storage cluster.
- Dashboard is installed.
- A pool with the rbd application enabled is created.
- An image is trashed.
Procedure
- Log in to the Dashboard.
On the navigation bar, click Block:
Select Images from the drop-down:
In the Trash tab, click the Purge Trash button:
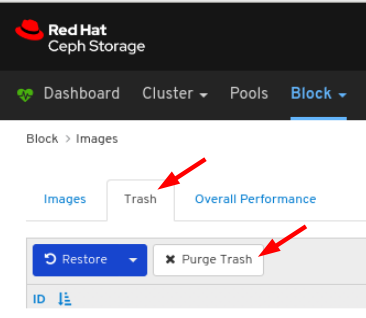
In the Purge Trash window, select the pool, and then click the Purge Trash button:

A notification towards the top right corner of the page indicates the images were purged from the selected pools successfully.
Additional resources
- See the Purging the Block Device Snapshots section in the Red Hat Ceph Storage Block Device Guide for more details.
9.2.8. Restoring images from trash
The dashboard allows you to restore images from trash.
Prerequisites
- A running Red Hat Ceph Storage cluster.
- Dashboard is installed.
- A pool with the rbd application enabled is created.
- An image is trashed.
Procedure
- Log in to the Dashboard.
On the navigation bar, click Block:
Select Images from the drop-down:
To restore the image from Trash, in the Trash tab, click its row:
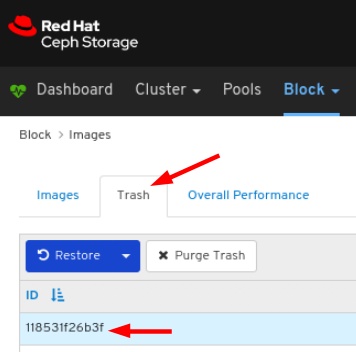
Select Restore in the Restore drop-down:

In the Restore Image window, enter the name of the image , and then click the Restore Image button:
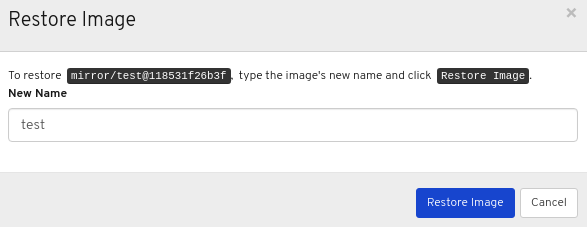
Notification towards the top right corner of the page indicate the image was restored from trash successfully.
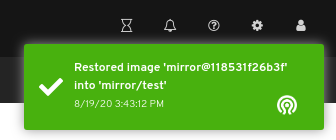
Additional resources
- See the Creating images section in the Red Hat Ceph Storage Dashboard Guide for more details on creating images in an RBD pool.
9.2.9. Deleting images
The dashboard allows you to delete images.
Prerequisites
- A running Red Hat Ceph Storage cluster.
- Dashboard is installed.
- A pool with the rbd application enabled is created.
- An image is created.
Procedure
- Log in to the Dashboard.
On the navigation bar, click Block:
Select Images from the drop-down:
To edit the image, in the Images tab, click its row:
Select Delete In the Edit drop-down:
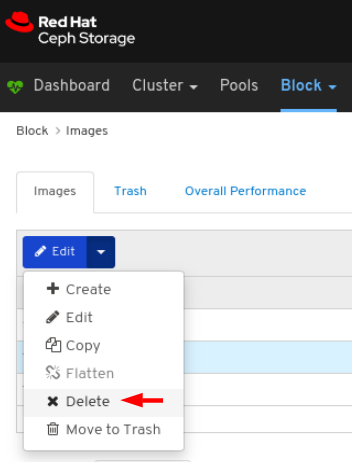
In the Delete RBD dialog window, Click the Yes, I am sure box and then Click Delete RBD to save the settings:
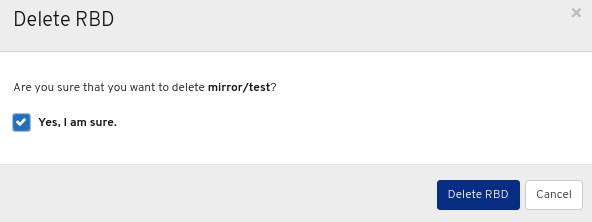
A notification towards the top right corner of the page indicates the image was moved to trash successfully.
9.2.10. Creating snapshots of images
The dashboard allows you to take snapshots of Ceph block device images.
Prerequisites
- A running Red Hat Ceph Storage cluster.
- Dashboard is installed.
- A pool with the rbd application enabled is created.
- An image is created.
Procedure
- Log in to the Dashboard.
On the navigation bar, click Block:
Select Images from the drop-down:
To take the snapshot of the image, in the Images tab, click its row, and then click the Snapshots tab:
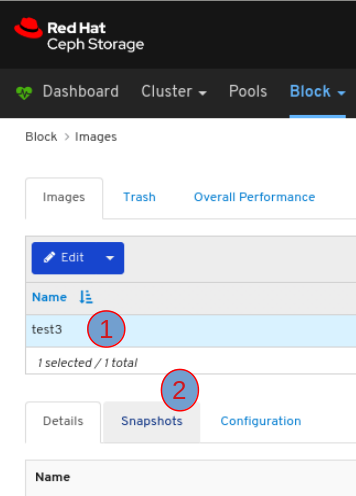
Select Create in the Create drop-down:
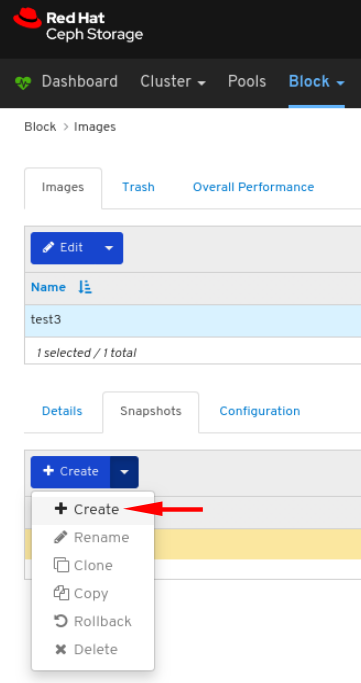
In the CreateRBD Snapshot dialog, enter the parameters and click the CreateRBD Snapshot button:
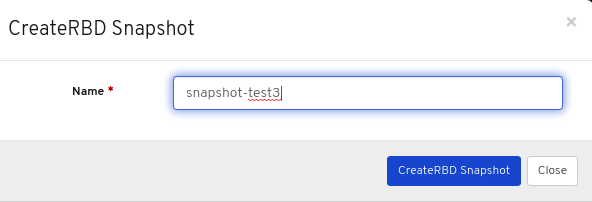
A notification towards the top right corner of the page indicates the snapshot of the image was created successfully.
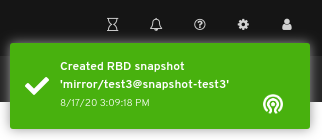
Additional Resources
- See the Creating a block device snapshot section in the Red Hat Ceph Storage Block Device Guide] for more information on creating snapshots.
- See the Creating pools section in the Red Hat Ceph Storage Dashboard Guide for more details on creating RBD pools.
- See the Creating images section in the Red Hat Ceph Storage Dashboard Guide for more details.
9.2.11. Renaming snapshots of images
The dashboard allows you to rename snapshots of Ceph block device images.
Prerequisites
- A running Red Hat Ceph Storage cluster.
- Dashboard is installed.
- A pool with the rbd application enabled is created.
- An image is created.
- A snapshot of the image is created.
Procedure
- Log in to the Dashboard.
On the navigation bar, click Block:
Select Images from the drop-down:
To rename the snapshot of the image, in the Images tab, click its row, and then click the Snapshots tab:
Select Rename in the the Rename drop-down:
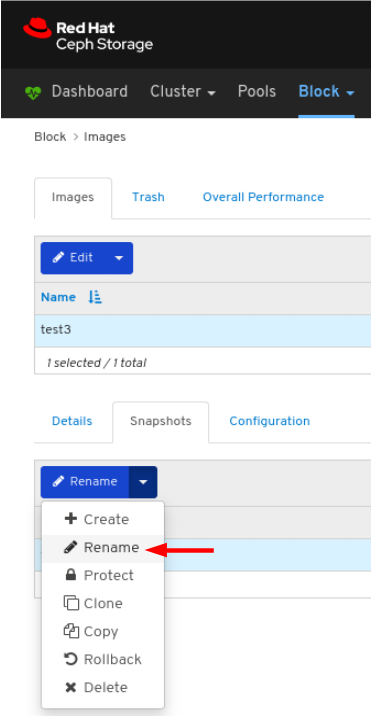
In the RenameRBD Snapshot dialog, enter the parameters and click the RenameRBD Snapshot button:
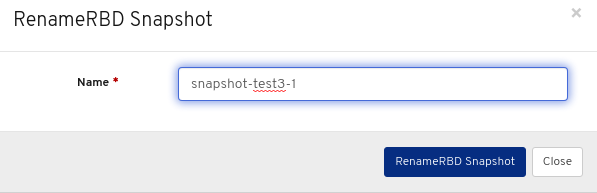
A notification towards the top right corner of the page indicates the snapshot of the image was updated successfully.
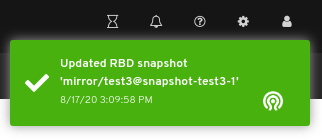
Additional Resources
- See the Renaming a block device snapshot section in the Red Hat Ceph Storage Block Device Guide] for more information.
- See the Creating pools section in the Red Hat Ceph Storage Dashboard Guide for more details on creating RBD pools.
- See the Creating images section in the Red Hat Ceph Storage Dashboard Guide for more details on creating images in an RBD pool.
9.2.12. Protecting snapshots of images
The dashboard allows you to protect snapshots of Ceph block device images. This is required when you need to clone the snapshots.
Prerequisites
- A running Red Hat Ceph Storage cluster.
- Dashboard is installed.
- A pool with the rbd application enabled is created.
- An image is created.
- A snapshot of the image is created.
Procedure
- Log in to the Dashboard.
On the navigation bar, click Block:
Select Images from the drop-down:
To protect the snapshot of the image, in the Images tab, click its row, and then click the Snapshots tab:
Select Protect in the the Rename drop-down:
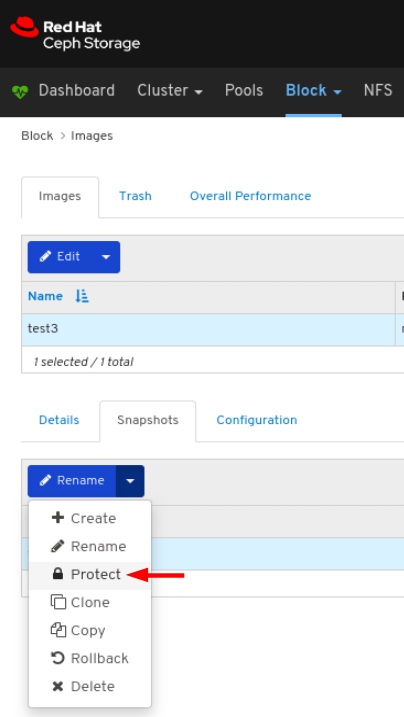
A notification towards the top right corner of the page indicates the snapshot of the image was updated successfully.
Additional Resources
- See the Protecting a block device snapshot section in the Red Hat Ceph Storage Block Device Guide] for more information.
- See the Creating pools section in the Red Hat Ceph Storage Dashboard Guide for more details on creating RBD pools.
- See the Creating images section in the Red Hat Ceph Storage Dashboard Guide for more details on creating images in an RBD pool.
9.2.13. Cloning snapshots of images
The dashboard allows you to clone snapshots of Ceph block device images.
Prerequisites
- A running Red Hat Ceph Storage cluster.
- Dashboard is installed.
- A pool with the rbd application enabled is created.
- An image is created.
- A snapshot of the image is created.
- A snapshot of the image is protected.
Procedure
- Log in to the Dashboard.
On the navigation bar, click Block:
Select Images from the drop-down:
To clone the snapshot of the image, in the Images tab, click its row, and then click the Snapshots tab:
Select Clone in the the Rename drop-down:
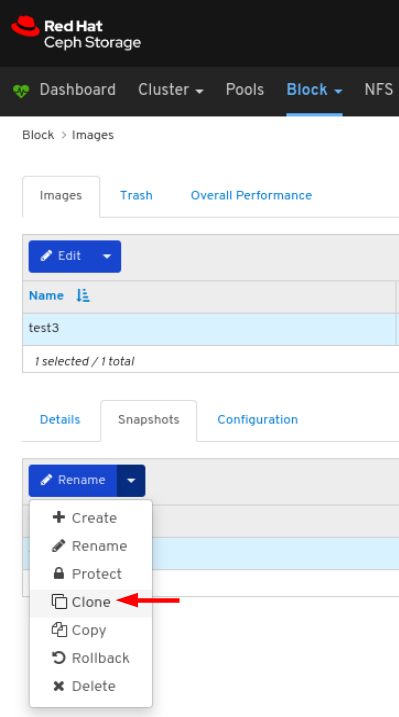
In the CloneRBD dialog, enter the parameters and click the CloneRBD button:

A notification towards the top right corner of the page indicates the snapshot of the image was cloned successfully.
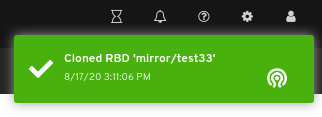
Additional Resources
- See the Renaming a block device snapshot section in the Red Hat Ceph Storage Block Device Guide] for more information.
- See the Protecting a Block device Snapshot section in the Red Hat Ceph Storage Block Device Guide for more information.
- See the Creating pools section in the Red Hat Ceph Storage Dashboard Guide for more details on creating RBD pools.
- See the Creating images section in the Red Hat Ceph Storage Dashboard Guide for more details on creating images in an RBD pool.
- See the Protecting snapshots of images section in the Red Hat Ceph Storage Dashboard Guide for more details.
9.2.14. Copying snapshots of images
The dashboard allows you to copy snapshots of Ceph block device images.
Prerequisites
- A running Red Hat Ceph Storage cluster.
- Dashboard is installed.
- A pool with the rbd application enabled is created.
- An image is created.
- A snapshot of the image is created.
Procedure
- Log in to the Dashboard.
On the navigation bar, click Block:
Select Images from the drop-down:
To copy the snapshot of the image, in the Images tab, click its row, and then click the Snapshots tab:
Select Copy in the the Rename drop-down:

In the CopyRBD dialog, enter the parameters and click the CopyRBD button:
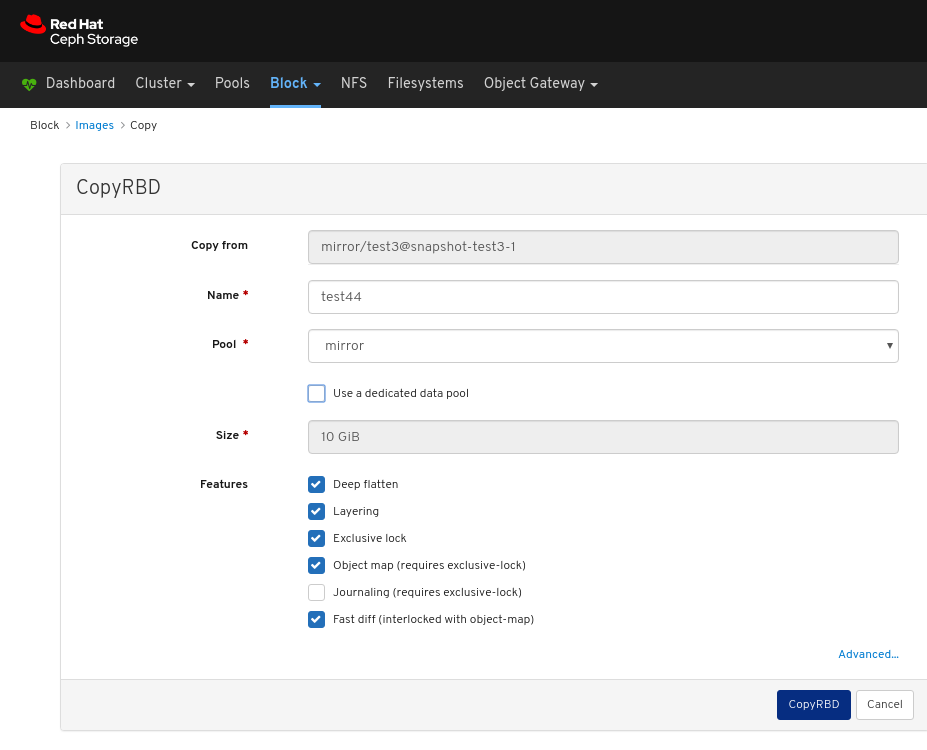
A notification towards the top right corner of the page indicates the snapshot of the image was updated successfully.
Additional Resources
- See the Creating pools section in the Red Hat Ceph Storage Dashboard Guide for more details on creating RBD pools.
- See the Creating images section in the Red Hat Ceph Storage Dashboard Guide for more details on creating images in an RBD pool.
9.2.15. Rolling back snapshots of images
The dashboard allows you to rollback snapshots of Ceph block device images.
Prerequisites
- A running Red Hat Ceph Storage cluster.
- Dashboard is installed.
- A pool with the rbd application enabled is created.
- An image is created.
- A snapshot of the image is created.
Procedure
- Log in to the Dashboard.
On the navigation bar, click Block:
Select Images from the drop-down:
To rollback the snapshot of the image, in the Images tab, click its row, and then click the Snapshots tab:
Select Rollback in the the Rename drop-down:

In the RBD snapshot rollback window, click the Rollback button:
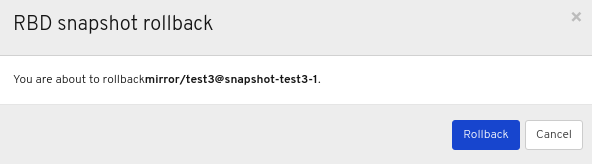
A notification towards the top right corner of the page indicates the snapshot of the image was rolled back successfully.
Additional Resources
- See the Rolling a block device snapshot section in the Red Hat Ceph Storage Block Device Guide] for more information.
- See the Creating pools section in the Red Hat Ceph Storage Dashboard Guide for more details.
- See the Creating images section in the Red Hat Ceph Storage Dashboard Guide for more details.
9.2.16. Unprotecting snapshots of images
The dashboard allows you to unprotect snapshots of Ceph block device images. This is required when you need to delete the snapshots.
Prerequisites
- A running Red Hat Ceph Storage cluster.
- Dashboard is installed.
- A pool with the rbd application enabled is created.
- An image is created.
- A snapshot of the image is created.
- A snapshot of the image is protected.
Procedure
- Log in to the Dashboard.
On the navigation bar, click Block:
Select Images from the drop-down:
To unprotect the snapshot of the image, in the Images tab, click its row, and then click the Snapshots tab:
Select UnProtect in the the Rename drop-down:
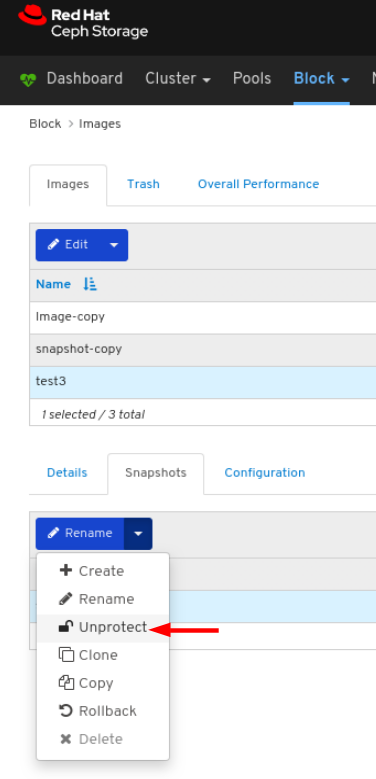
A notification towards the top right corner of the page indicates the snapshot of the image was updated successfully.
Additional Resources
- See the Unprotecting a block device snapshot section in the Red Hat Ceph Storage Block Device Guide for more information.
- See the Creating pools section in the Red Hat Ceph Storage Dashboard Guide for more details on creating RBD pools.
- See the Creating images section in the Red Hat Ceph Storage Dashboard Guide for more details on creating images in an RBD pool.
- See the Protecting snapshots of Images section in the Red Hat Ceph Storage Dashboard Guide for more details.
9.2.17. Deleting snapshots of images
The dashboard allows you to delete snapshots of Ceph block device images.
Prerequisites
- A running Red Hat Ceph Storage cluster.
- Dashboard is installed.
- A pool with the rbd application enabled is created.
- An image is created.
- A snapshot of the image is created.
- A snapshot of the image is unprotected.
Procedure
- Log in to the Dashboard.
On the navigation bar, click Block:
Select Images from the drop-down:
To delete the snapshot of the image, in the Images tab, click its row, and then click the Snapshots tab:
Select Delete in the the Rename drop-down:
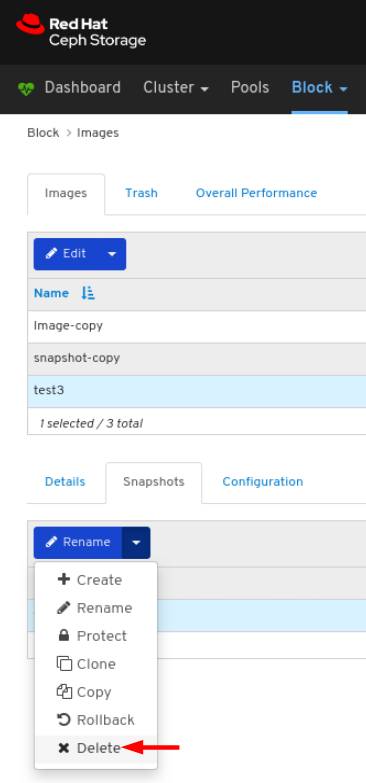
A notification towards the top right corner of the page indicates the snapshot of the image was updated successfully.
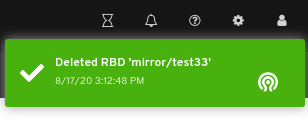
Additional Resources
- See the Deleting a block device snapshot section in the Red Hat Ceph Storage Block Device Guide] for more information.
- See the Unprotecting snapshots of Images section in the Red Hat Ceph Storage Dashboard Guide for more details.
9.3. Mirroring functions
The dashboard allows you to manage and monitor mirroring functions.
9.3.1. Prerequisites
- A running Red Hat Ceph Storage cluster.
- Dashboard is installed.
9.3.2. Mirroring view
The dashboard allows you to view the overall state of mirroring functions.
Prerequisites
- A running Red Hat Ceph Storage cluster.
- Dashboard is installed.
- Mirroring is configured.
Procedure
- Log in to the Dashboard.
- On the navigation bar, click Block.
Click Mirroring:

In the above example, you can see mirroring information categorized into tables labeled Daemons, Pools, and Images.
Additional Resources
- For more information on mirroring, see Block Device Mirroring in the Block Device Guide.
9.3.3. Editing mode
The dashboard allows you to edit mode of the overall state of mirroring functions, which includes pools and images.
Prerequisites
- A running Red Hat Ceph Storage cluster.
- Dashboard is installed.
- A pool with the rbd application enabled is created.
- An image is created.
- Mirroring is configured.
Procedure
- Log in to the Dashboard.
On the navigation bar, click Block:
Click Mirroring from the drop-down:
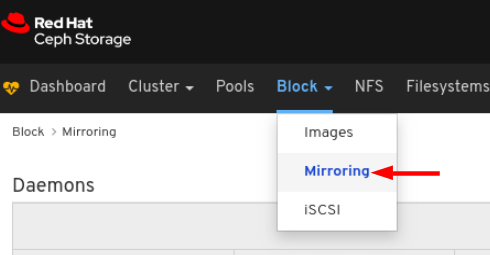
In the Pools tab, click the row:
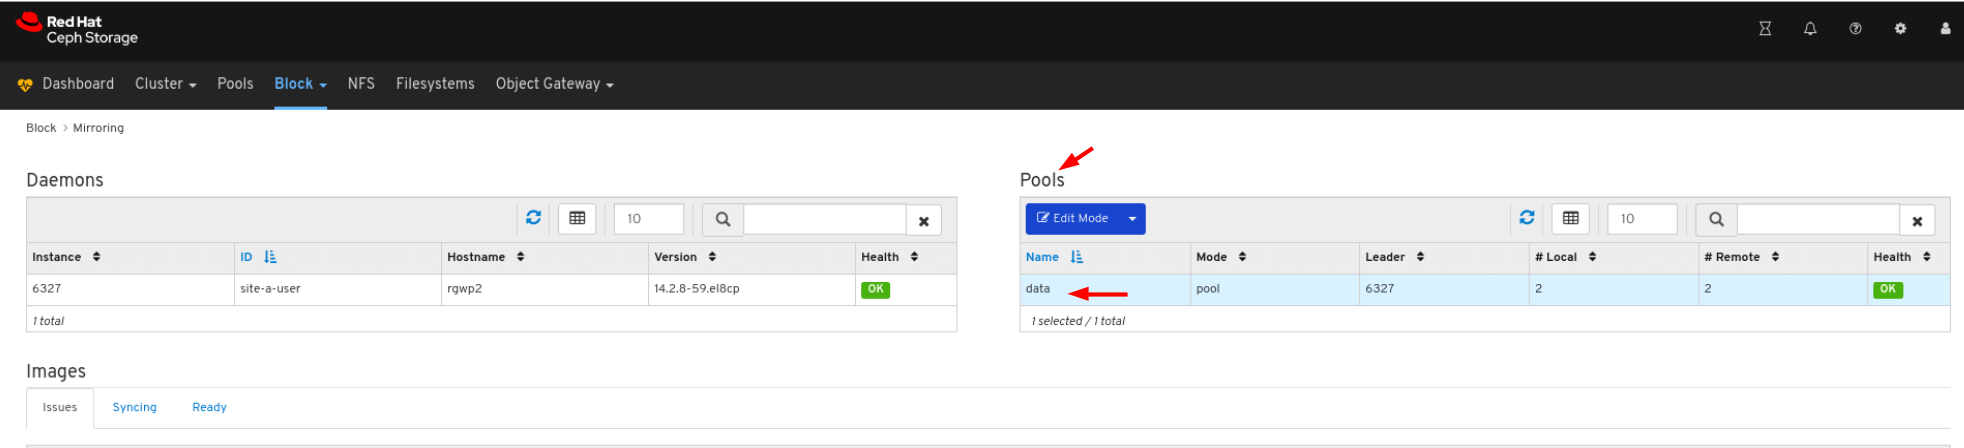
In the Edit Mode drop-down, select Edit Mode:
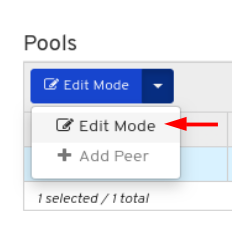
In the Edit Pool mirror mode window, select the mode from the drop-down, and then click the Update button:
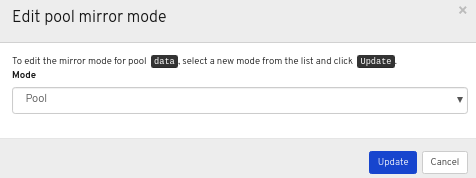
A notification towards the top right corner of the page indicates the mirror mode was updated successfully.
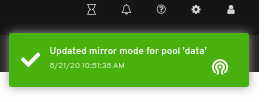
Additional Resources
- See the Ceph Block Device Mirroring section in the Red Hat Ceph Storage Block Device Guide for more information.
9.3.4. Adding peer in mirroring
The dashboard allows you to add storage cluster peer for the`rbd-daemon` mirror to discover its peer storage cluster.
Prerequisites
- A running Red Hat Ceph Storage cluster.
- Dashboard is installed.
- A pool with the rbd application enabled is created.
- An image is created.
- Mirroring is configured.
Procedure
- Log in to the Dashboard.
On the navigation bar, click Block:
Click Mirroring from the drop-down:
In the Pools tab, click the row
In the Edit Mode drop-down, select Add peer:
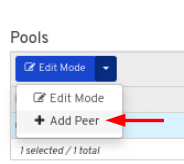
In the Add pool mirror peer window, enter the parameters, and then click the Submit button:

A notification towards the top right corner of the page indicates the mirror peer was created successfully.
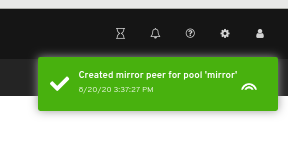
Additional Resources
- See the Adding a storage cluster peer section in the Red Hat Ceph Storage Block Device Guide for more information.
9.3.5. Editing peer in mirroring
The dashboard allows you to edit storage cluster peer for the`rbd-daemon` mirror to discover its peer storage cluster.
Prerequisites
- A running Red Hat Ceph Storage cluster.
- Dashboard is installed.
- A pool with the rbd application enabled is created.
- An image is created.
- Mirroring is configured.
- A peer is added.
Procedure
- Log in to the Dashboard.
On the navigation bar, click Block.
Click Mirroring from the drop-down:
In the Pools tab, click the row
In the Edit Mode drop-down, select Edit peer:
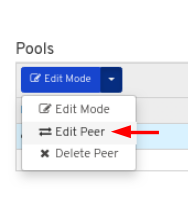
In the Edit pool mirror peer window, edit the parameters, and then click the Submit button:
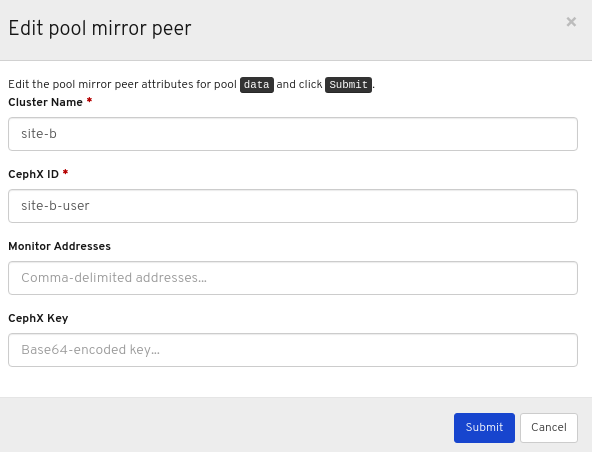
A notification towards the top right corner of the page indicates the mirror peer was updated successfully.
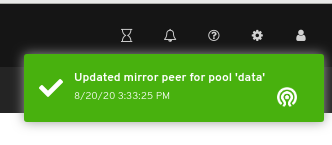
Additional Resources
- See the Adding peer in mirroring section in the Red Hat Ceph Storage Dashboard Guide for more information.
9.3.6. Deleting peer in mirroring
The dashboard allows you to edit storage cluster peer for the`rbd-daemon` mirror to discover its peer storage cluster.
Prerequisites
- A running Red Hat Ceph Storage cluster.
- Dashboard is installed.
- A pool with the rbd application enabled is created.
- An image is created.
- Mirroring is configured.
- A peer is added.
Procedure
- Log in to the Dashboard.
On the navigation bar, click Block.
Click Mirroring from the drop-down:
In the Pools tab, click the row:
In the Edit Mode drop-down, select Delete peer:

In the Delete mirror peer dialog window, Click the Yes, I am sure box and then Click Delete mirror peer to save the settings:
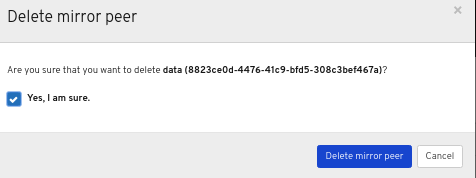
A notification towards the top right corner of the page indicates the image was moved to trash successfully.
Additional Resources
- See the Adding peer in mirroring section in the Red Hat Ceph Storage Dashboard Guide for more information.
9.4. iSCSI functions (Limited Availability)
The dashboard allows you to manage and monitor iSCSI images and targets. Before you can use the dashboard to manage and monitor iSCSI images and targets, you must add gateways to it and enable the dashboard iSCSI feature.
This technology is Limited Availability. See the Deprecated functionality chapter for additional information.
9.4.1. Prerequisites
- A running Red Hat Ceph Storage cluster.
- Dashboard is installed.
- iSCSI gateways are added to the dashboard.
9.4.2. Manually adding iSCSI gateways to the dashboard
The Red Hat Ceph Storage Dashboard can manage iSCSI targets using the REST API provided by the rbd-target-api service of the Ceph iSCSI Gateway. You must add the API address to the dashboard before the dashboard can access it.
Prerequisites
- A running Red Hat Ceph Storage cluster.
- Dashboard is installed.
- The Ceph iSCSI Gateway is installed.
The Ceph iSCSI gateway requires at lest two gateways to provide high availability.
Procedure
- Log in to a Monitor node.
Optional: If the REST API for the iSCSI gateway is configured in HTTPS mode using a self-signed certificate, you must configure the dashboard to avoid SSL certificate verification when accessing the API. Run the following command to disable SSL verification.
# ceph dashboard set-iscsi-api-ssl-verification falseExample:
[root@mon ~]# ceph dashboard set-iscsi-api-ssl-verification false
Option ISCSI_API_SSL_VERIFICATION updated
Create two files for the gateways:
# echo "SCHEME :// USERNAME : PASSWORD @ HOST [: PORT ]" > FILE_CONTAINING_GATEWAY_URLExample:
[root@mon ~]# echo "http://admin:admin@192.168.122.157:5000" > /tmp/first_gateway [root@mon ~]# echo "http://admin:admin@192.168.122.193:5000" > /tmp/second_gatewayNoteThe USERNAME and PASSWORD were set when you configured the iSCSI target. The credentials can be retrieved from the
iscsi-gateway.cfgfile on the iSCSI Gateway node.Add the two gateways to the dashboard:
# ceph dashboard iscsi-gateway-add -i FILE_CONTAINING_GATEWAY_URLExample:
[root@mon ~]# ceph dashboard iscsi-gateway-add -i /tmp/first_gateway
Success
[root@mon ~]# ceph dashboard iscsi-gateway-add -i /tmp/second_gateway
Success
Verify the gateways were added correctly:
# ceph dashboard iscsi-gateway-listExample:
[root@mon ~]# ceph dashboard iscsi-gateway-list
{"gateways": {"ceph4": {"service_url": "http://admin:admin@192.168.122.193:5000"}, "ceph4": {"service_url": "http://admin:admin@192.168.122.193:5000"}}}
Optional: If you make a mistake adding a gateway you can remove it by specifying its hostname as mentioned in the command
iscsi-gateway-list:# ceph dashboard iscsi-gateway-rm GATEWAY_NAMEExample:
[root@mon ~]# ceph dashboard iscsi-gateway-rm ceph4
Success
Additional Resources
- For information on how to install the Ceph iSCSI Gateway, see Installing the iSCSI gateway in the Block Device Guide.
9.4.3. iSCSI overview
The dashboard provides an overview that displays iSCSI gateway hosts and images exported over iSCSI.
Prerequisites
- A running Red Hat Ceph Storage cluster.
- Dashboard is installed.
- The Ceph iSCSI gateway is installed.
- iSCSI gateways are added to the dashboard.
- The dashboard iSCSI feature is enabled.
Procedure
- Log in to the Dashboard.
- On the navigation bar, click Block.
Click iSCSI:
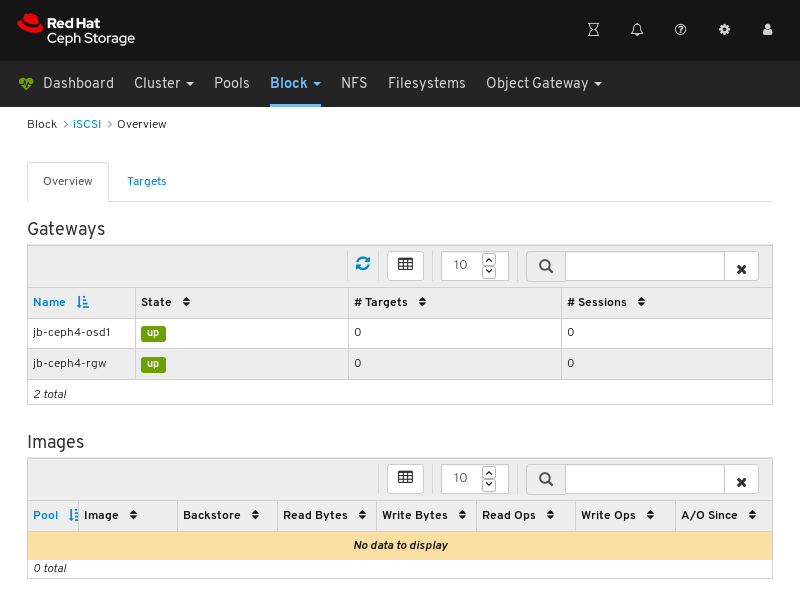
Additional Resources
- For information on how to install the Ceph iSCSI Gateway, see Installing the iSCSI gateway in the Block Device Guide.
- For information on how to add iSCSI gateways to the dashboard, see Manually adding iSCSI gateways to the dashboard in the Dashboard Guide.
- For information on how to enable the dashboard iSCSI feature see Enabling the dashboard iSCSI feature in the dashboard in the Dashboard Guide.
9.4.4. Creating iSCSI targets
The dashboard allows you to create iSCSI targets.
Prerequisites
- A running Red Hat Ceph Storage cluster.
- Dashboard is installed.
- The Ceph iSCSI gateway is installed with at least two gateways.
- iSCSI gateways are added to the dashboard.
- The dashboard iSCSI feature is enabled.
- A replicated pool with the RBD application enabled.
- An erasure coded pool with the RBD application enabled.
Procedure
- Log in to the Dashboard.
- On the navigation bar, click Block.
Click iSCSI:
Towards the upper left corner of the page, click the Targets tab:

Towards the upper left corner of the page, click the Add button:
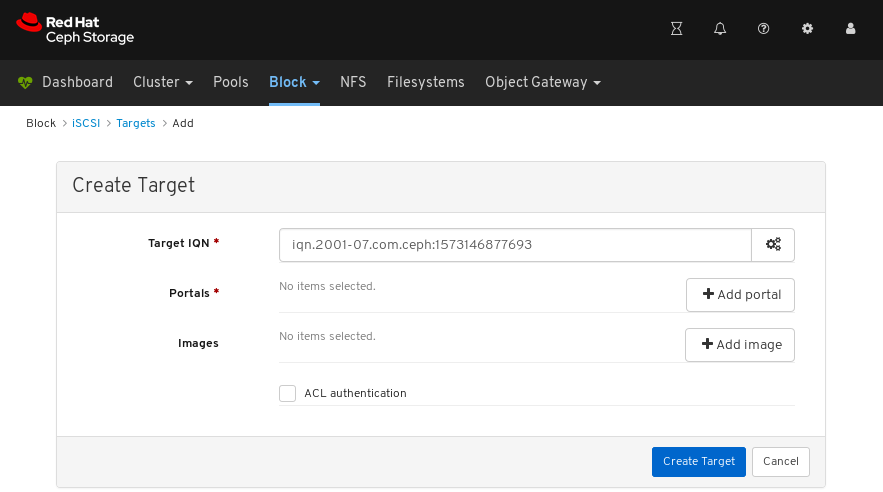
Optional: Modify the Target IQN.

Optional: Set advanced settings for the target.
Click the gear to set advanced settings for the target.

Set advanced settings in the Advanced Settings dialog window.
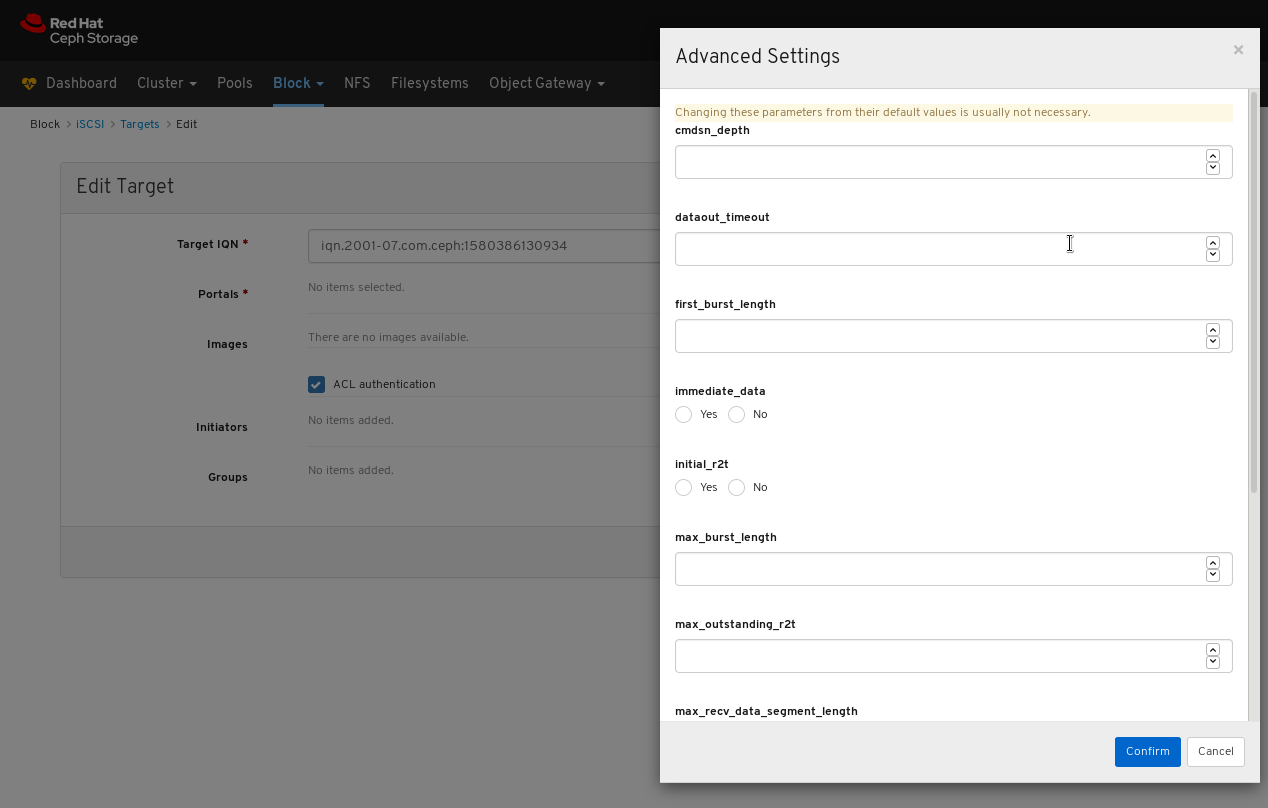
- Click Confirm to save the settings.
Click the Add portal button and select the first of at least two gateways:
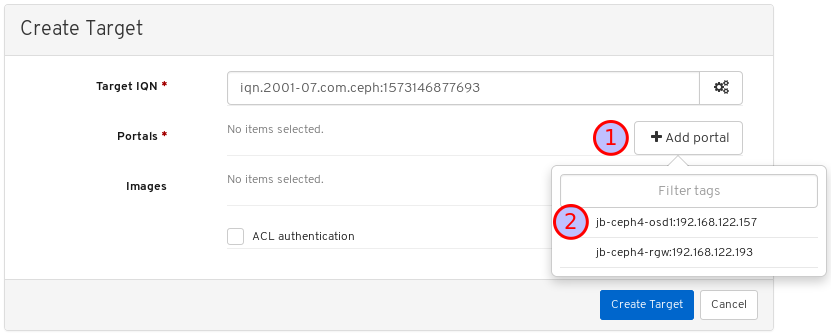
Click the Add portal button and select the second of at least two gateways:
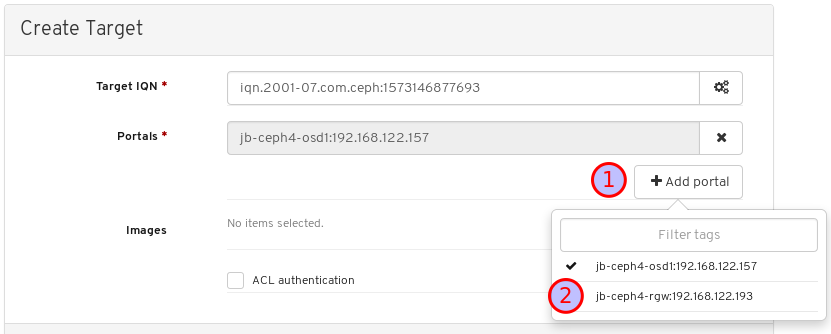
Repeat this step for any additional gateways.
Click the Add image button and select an image to be exported by the target:
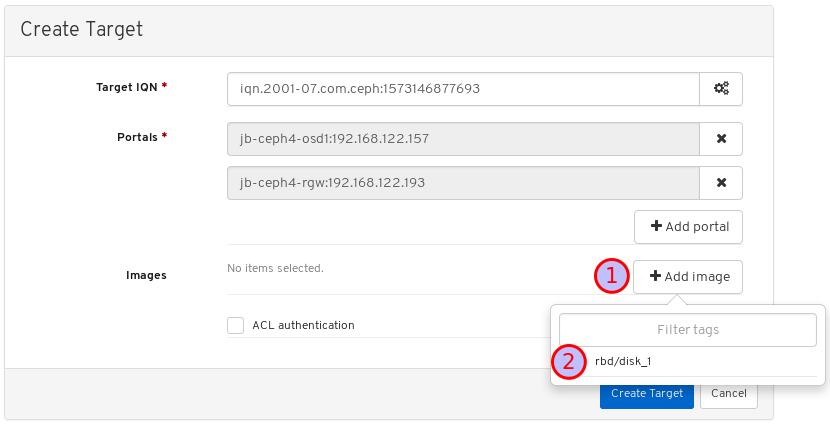
Repeat this step for any additional images.
Optional: Modify the Images.
Click the gear to the right of the image

Modify image settings in the Configure dialog window:
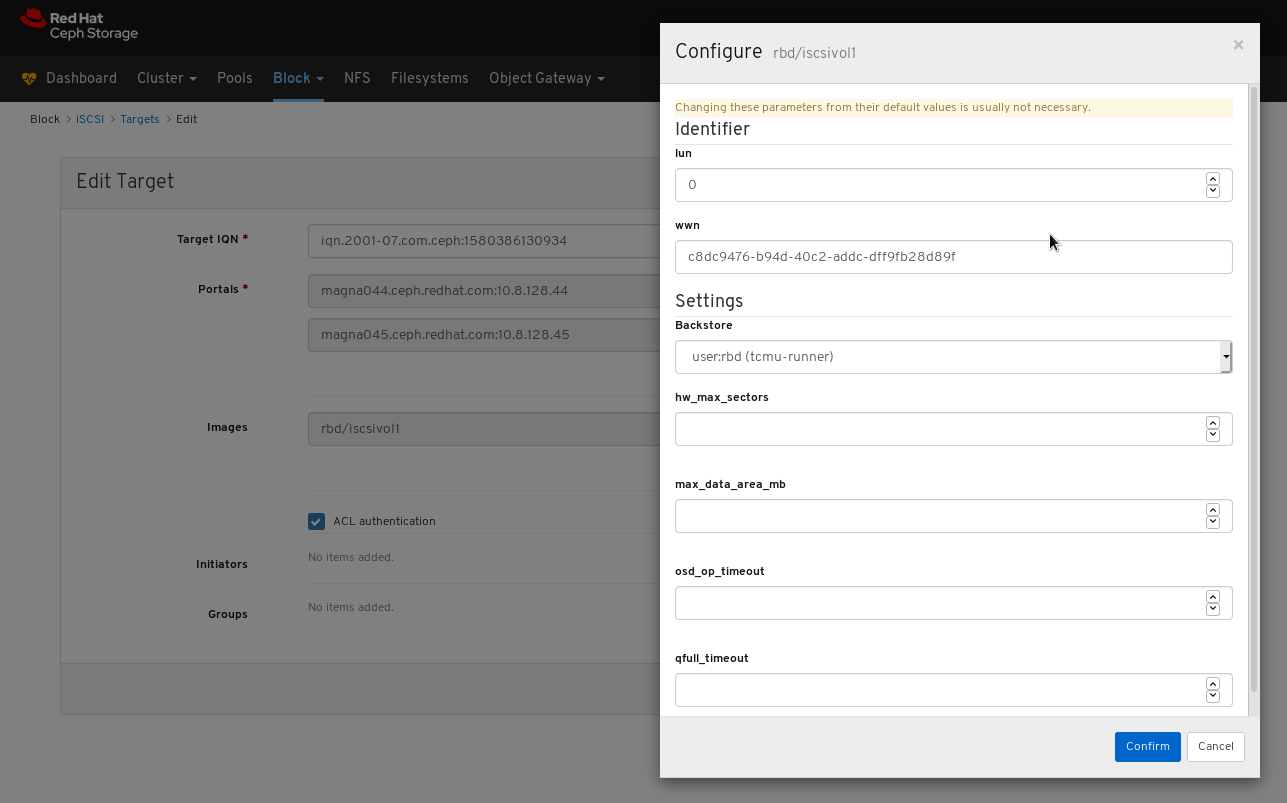
- Click Confirm to save the settings.
Click the ACL authentication box and then click the Add initiator button:
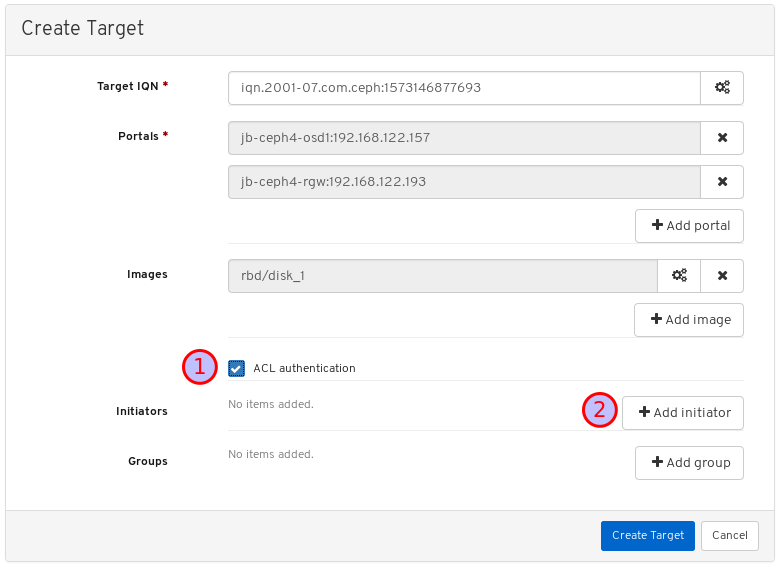
Enter the IQN from your client in the first text box:
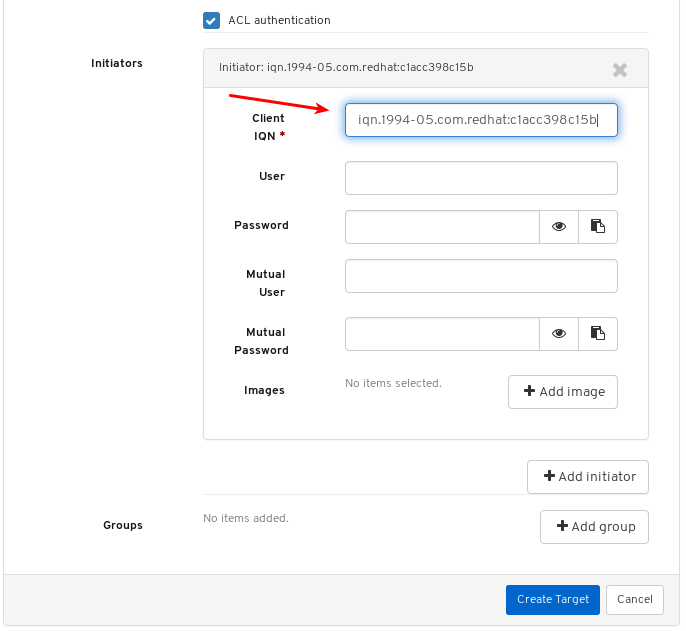
Retrieve the client IQN from the system where the initiator software runs. See Configuring the iSCSI initiator in the Block Device Guide for more information.
Enter a user name and password details for the target:
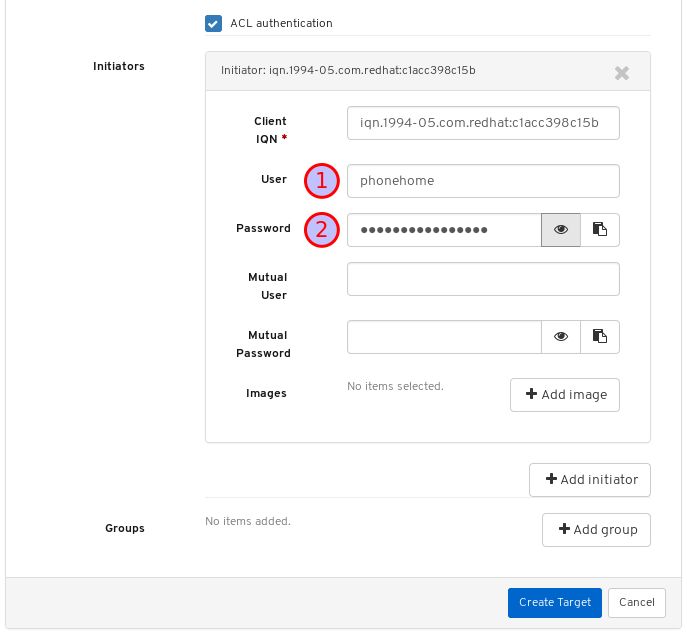
Click Add image and select an image:

Repeat this step for any additional images.
Finish the procedure by clicking the Create Target button:

Verify the target was added by looking for it on the Targets page.
To locate the Targets page, follow the procedure Viewing iSCSI targets in the Dashboard guide.
Additional Resources
- For information on how to install the Ceph iSCSI Gateway, see Installing the iSCSI gateway in the Block Device Guide.
- For information on how to add iSCSI gateways to the dashboard, see Manually adding iSCSI gateways to the dashboard in the Dashboard Guide.
- For information on how to enable the dashboard iSCSI feature see Enabling the dashboard iSCSI feature in the dashboard in the Dashboard Guide.
- For information on how to create a pool with the RBD application enabled, see Creating Block Device Pools in the Block Device Guide
- For information on how to create images see Creating block device images in the Block Device Guide.
9.4.5. Viewing iSCSI targets
The dashboard allows you to view iSCSI targets.
Prerequisites
- A running Red Hat Ceph Storage cluster.
- Dashboard is installed.
- The Ceph iSCSI gateway is installed.
- An iSCSI target is created.
Procedure
- Log in to the Dashboard.
On the navigation bar, click Block and then click iSCSI:

Towards the upper left corner of the page, click the Targets tab:

To view details about a target, click on its row:
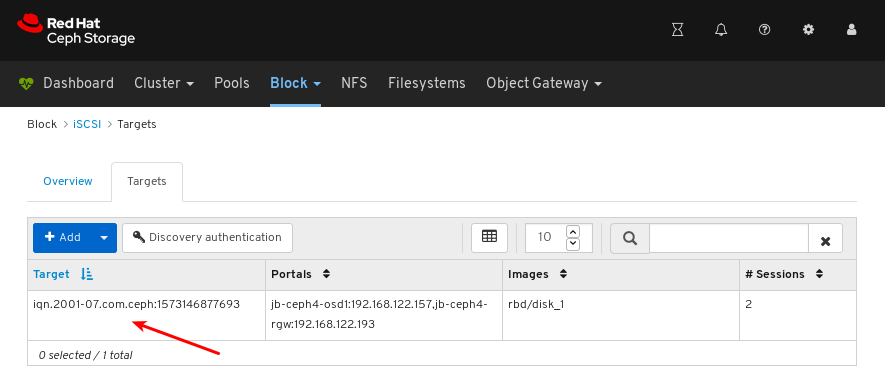
You can see the iSCSI topology, including whether an initiator is logged in:
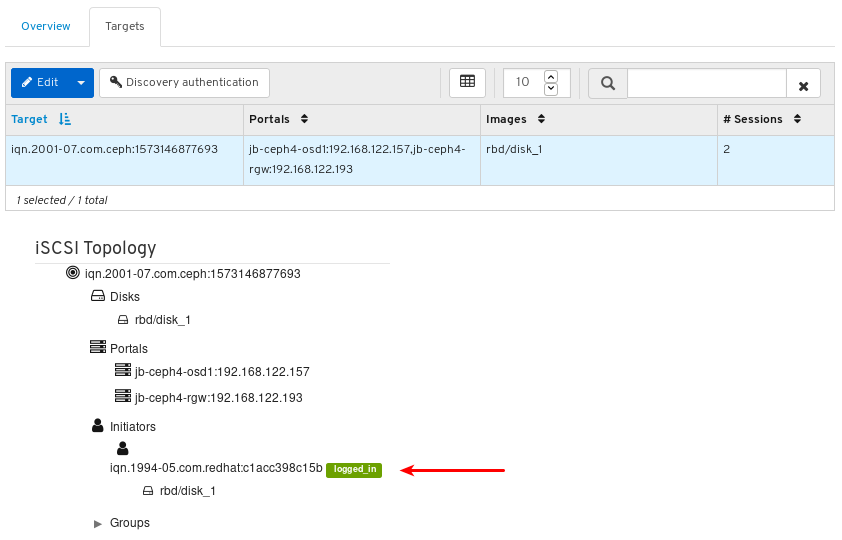
Click an object to view detailed information about it:
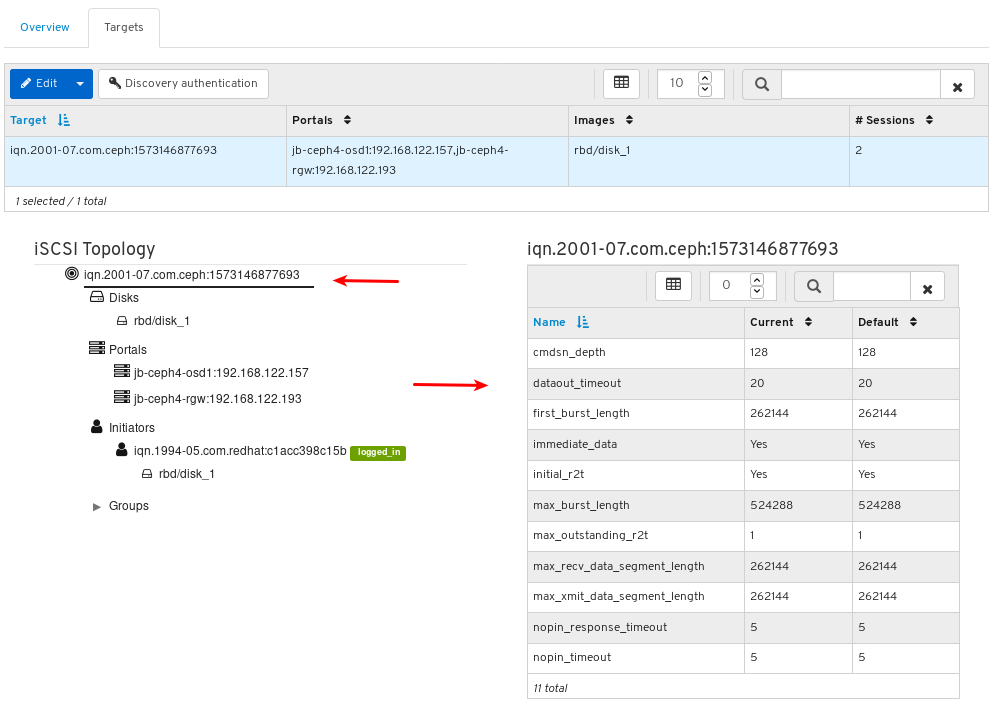
Note: Only some objects display detailed information when clicked.
Additional Resources
- For information on how to install the Ceph iSCSI gateway, see Installing the iSCSI gateway in the Block Device Guide.
- For information on how to create iSCSI targets in dashboard, see Creating iSCSI targets in the Dashboard guide.
9.4.6. Editing iSCSI targets
The dashboard allows you to edit iSCSI targets.
Prerequisites
- A running Red Hat Ceph Storage cluster.
- Dashboard is installed.
- The Ceph iSCSI gateway is installed with at least two gateways.
- iSCSI gateways are added to the dashboard.
- The dashboard iSCSI feature is enabled.
- A replicated pool with the RBD application enabled.
- An erasure coded pool with the RBD application enabled.
- An iSCSI target is created.
Procedure
- Log in to the Dashboard.
- On the navigation bar, click Block.
Click iSCSI:
Towards the upper left corner of the page, click the Targets tab:
To edit a target, click on its row:
Towards the upper left corner of the page, click the Edit button.
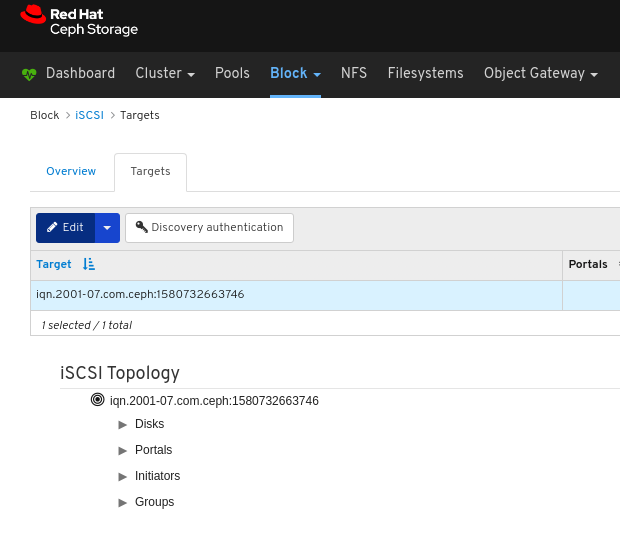
Edit the parameters and click the Edit Target button.
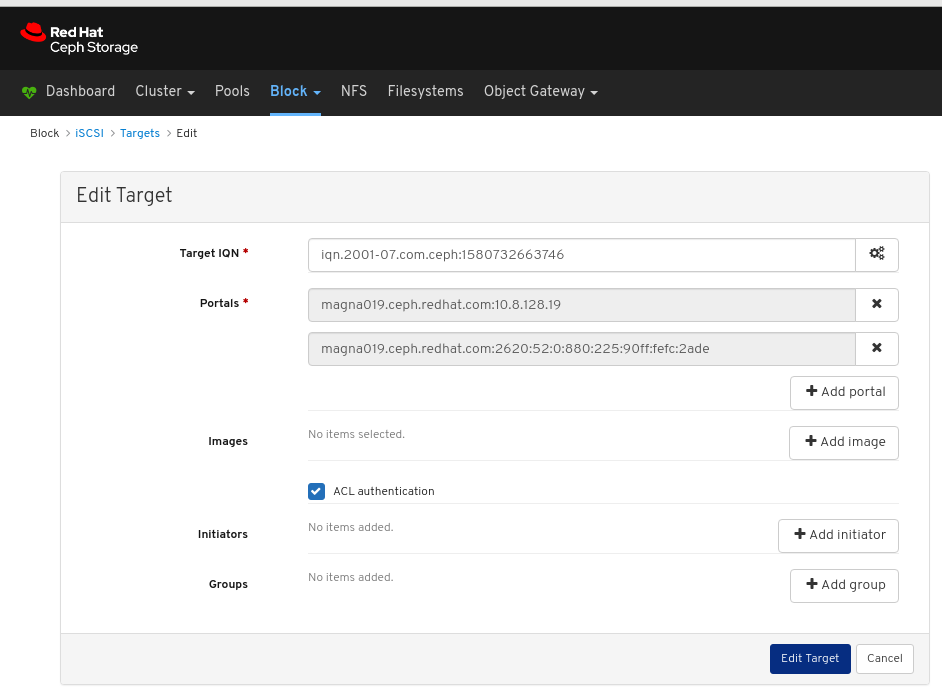
Verify the target was edited by looking for it on the Targets page.
To locate the Targets page, follow the procedure Viewing iSCSI targets in the Dashboard guide.
Additional Resources
- For information on how to install the Ceph iSCSI Gateway, see Installing the iSCSI gateway in the Block Device Guide.
- For information on how to add iSCSI gateways to the dashboard, see Manually adding iSCSI gateways to the dashboard in the Dashboard Guide.
- For information on how to enable the dashboard iSCSI feature see Enabling the dashboard iSCSI feature in the dashboard in the Dashboard Guide.
- For information on how to create a pool with the RBD application enabled, see Creating Block Device Pools in the Block Device Guide
- For information on how to create images see Creating block device images in the Block Device Guide.
9.4.7. Deleting iSCSI targets
The dashboard allows you to delete iSCSI targets.
Prerequisites
- A running Red Hat Ceph Storage cluster.
- Dashboard is installed.
- The Ceph iSCSI gateway is installed with at least two gateways.
- iSCSI gateways are added to the dashboard.
- The dashboard iSCSI feature is enabled.
- An iSCSI target is created.
- Disconnect all iSCSI Initiators. See Disconnecting iSCSI initiators.
Procedure
- Log in to the Dashboard.
- On the navigation bar, click Block.
Click iSCSI:
Towards the upper left corner of the page, click the Targets tab:
To delete a target, click on its row:
- Towards the upper left corner of the page, click the Edit drop down.
From the drop-down, select Delete:
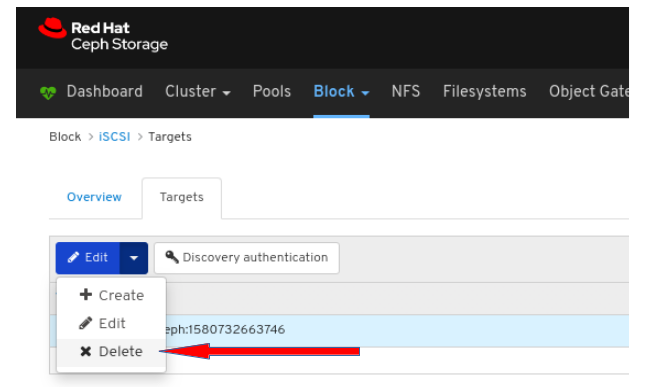
Click the Yes, I am sure box and then Click Delete iSCSI to save the settings.
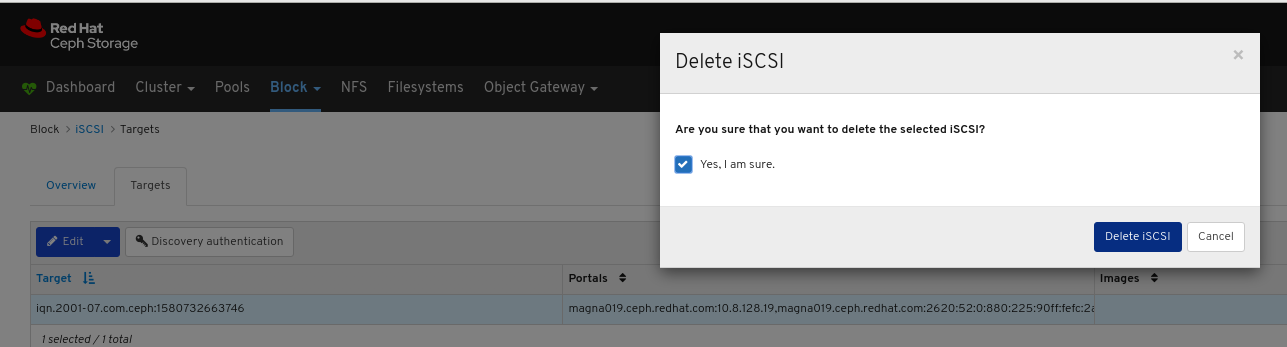
Additional Resources
- For information on how to install the Ceph iSCSI Gateway, see Installing the iSCSI gateway in the Block Device Guide.
- For information on how to add iSCSI gateways to the dashboard, see Manually adding iSCSI gateways to the dashboard in the Dashboard Guide.
- For information on how to disconnect iSCSI initiators see Disconnecting iSCSI initiators in the Block Device Guide.
9.4.8. Setting Discovery Authentication
The dashboard allows Discovery Authentication by using CHAP/CHAP_MUTUAL.
Prerequisites
- A running Red Hat Ceph Storage cluster.
- Dashboard is installed.
- The Ceph iSCSI gateway is installed with at least two gateways.
- iSCSI gateways are added to the dashboard.
- The dashboard iSCSI feature is enabled.
- A replicated pool with the RBD application enabled.
- An erasure coded pool with the RBD application enabled.
Procedure
- Log in to the Dashboard.
- On the navigation bar, click Block.
Click iSCSI:
Towards the upper left corner of the page, click the Targets tab.
Towards the upper left corner of the page, click the Discovery authentication button.
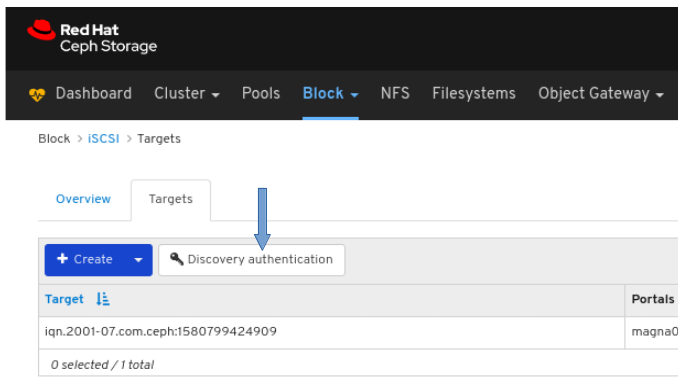
in Discovery Authentication window, provide the details and then Click the Submit button.

9.5. Quality of Service configuration
As a storage administrator, you can use Quality of Service (QoS) limits to prioritize or deprioritize the performance of pools or images so all images get the resources they need to meet specific business needs.
9.5.1. Prerequisites
- A running Red Hat Ceph Storage cluster.
- Dashboard is installed.
9.5.2. Configuring Quality of Service on an existing image
As a storage administrator, you can use Quality of Service (QoS) limits to priortize or deprioritize the performance of an existing image.
Prerequisites
- A running Red Hat Ceph Storage cluster.
- Dashboard is installed.
- A replicated pool with the RBD application enabled.
- An erasure coded pool with the RBD application enabled.
- An existing image.
Procedure
- Log in to the dashboard.
On the navigation bar, click Block and then click Images:
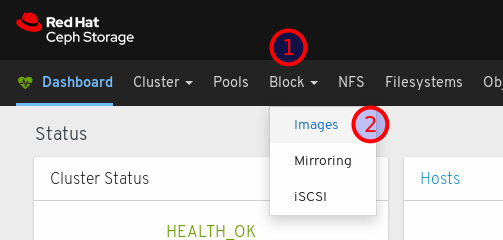
Click the row of an image to select it for editing:

Click the Edit button:
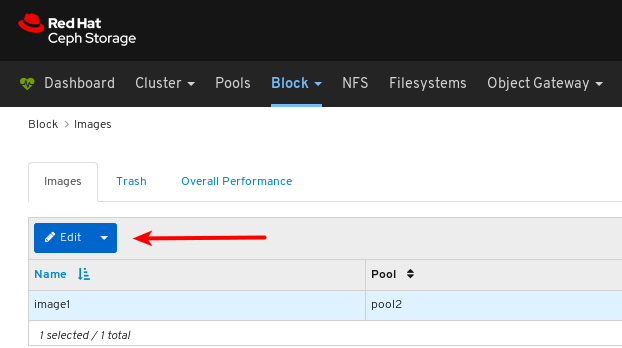
Click Advanced towards the bottom right corner of the dialog:
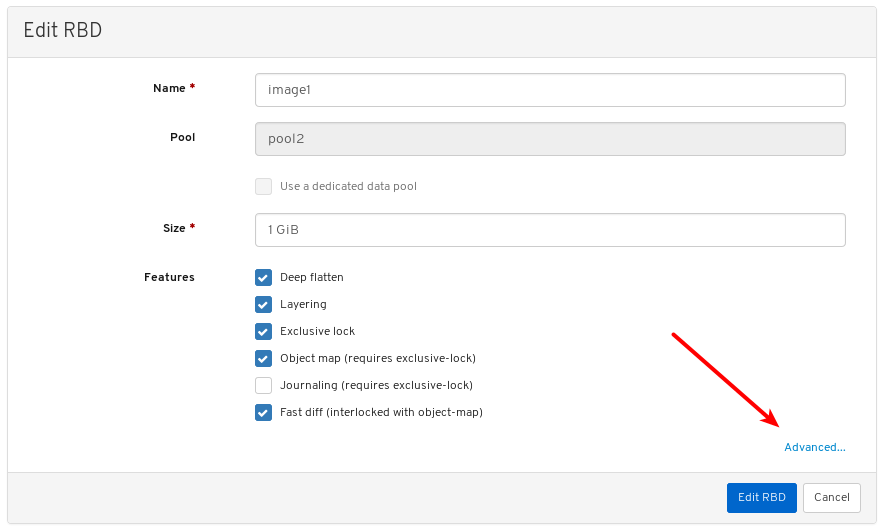
Click the plus symbol next to Quality of Service to open the QoS settings:
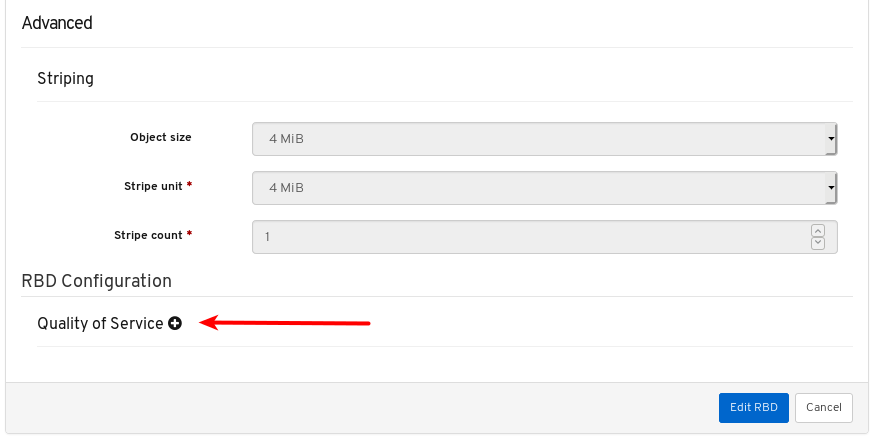
Optional: Click the question mark symbol next to an individual setting to find out more about it.
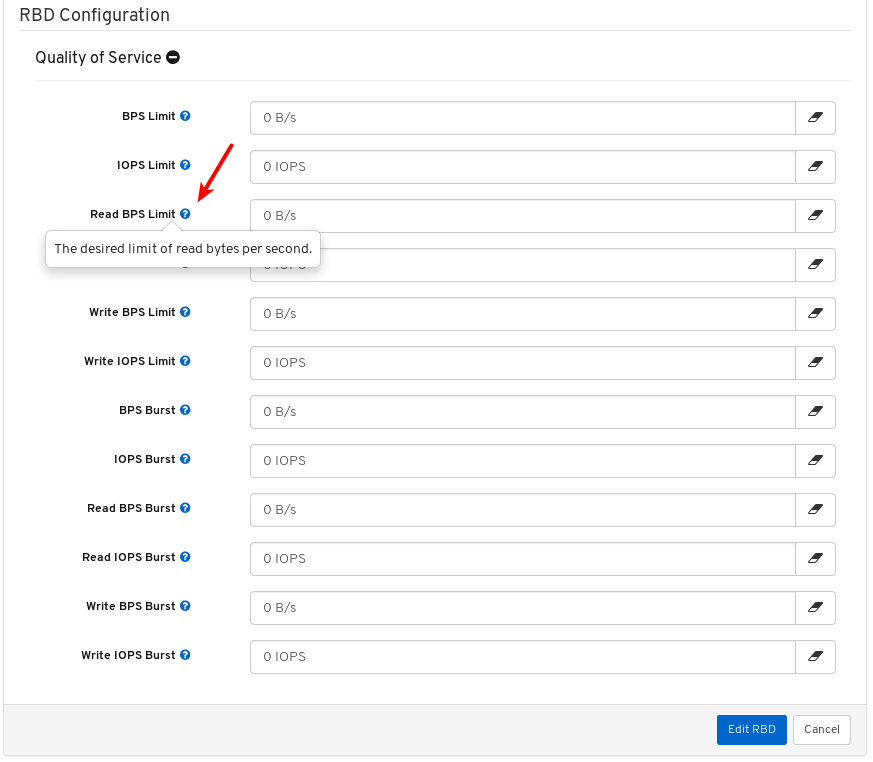
Enter or edit values for the QoS settings you want to change:
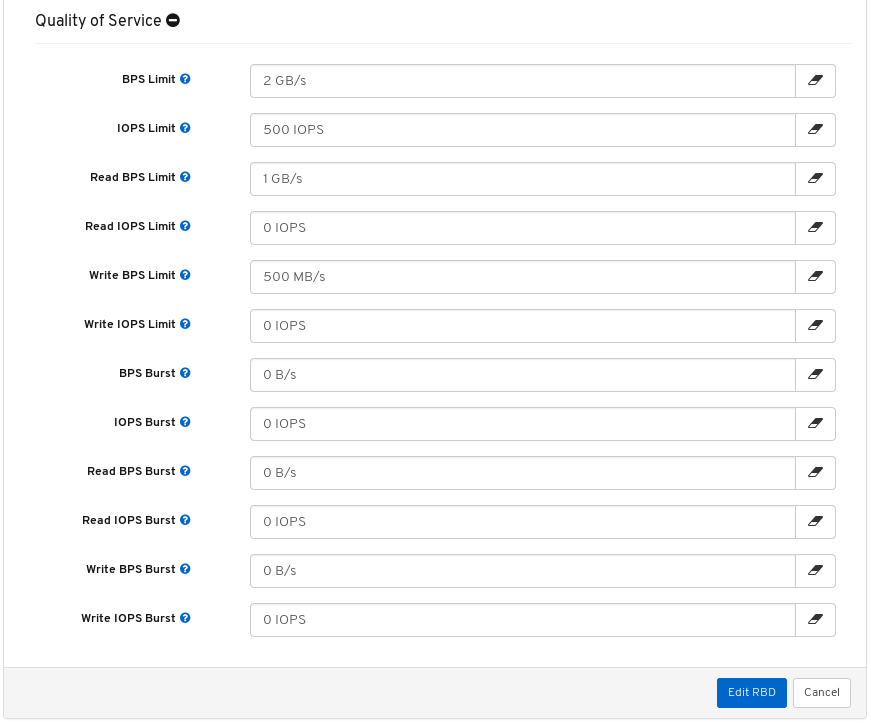
Optional: Click the eraser symbol for any setting to remove the local value and inherit the value from the parent pool or global configuration.

The field for the setting is disabled to indicate it is inheriting the value from the parent.
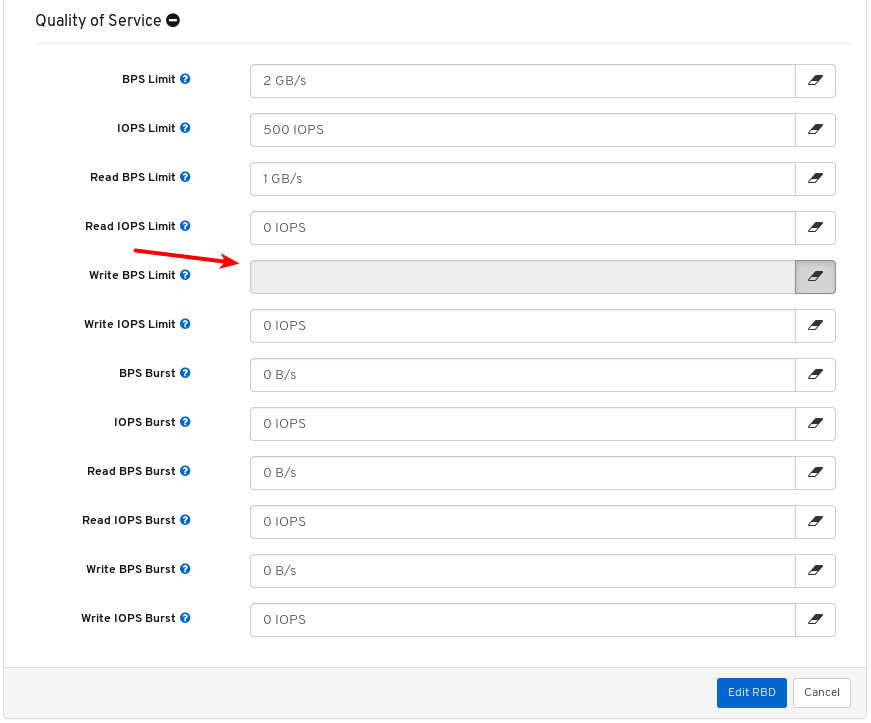
Click the Edit button to save the changes.
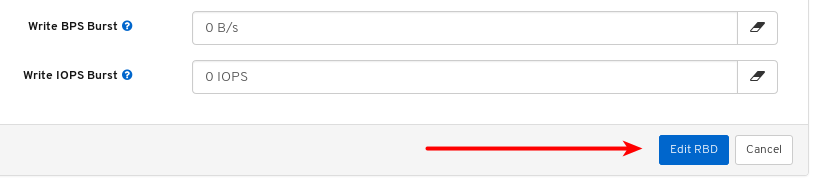
9.5.3. Configuring Quality of Service on an existing pool
As a storage administrator, you can configure Quality of Service (QoS) on an existing pool.
Prerequisites
- A running Red Hat Ceph Storage cluster.
- Dashboard is installed.
- A replicated pool with the RBD application enabled.
- An erasure coded pool with the RBD application enabled.
Procedure
- Log in to the dashboard.
On the navigation bar, click Pools.
Click the row of a replicated pool with the RBD application to select it for editing:
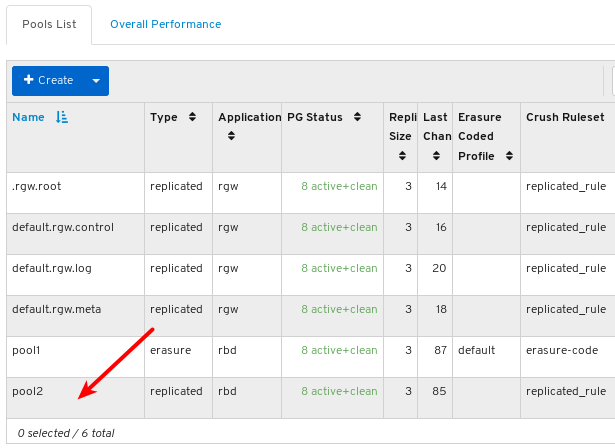
Click the Edit button:
Click the plus symbol next to Quality of Service to open the QoS settings:
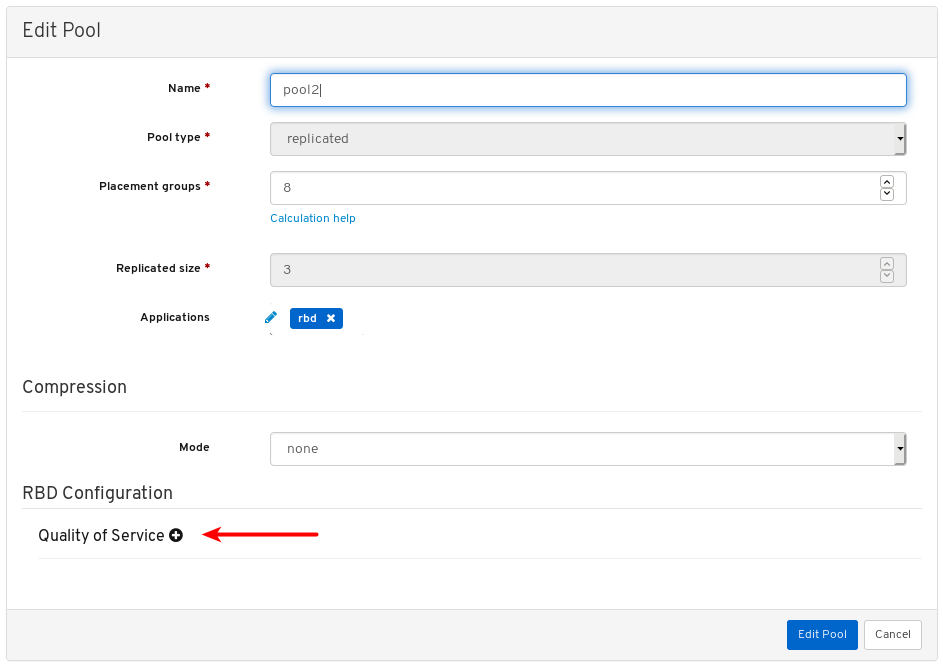
Optional: Click the question mark symbol next to an individual setting to find out more about it.

Enter or edit values for the QoS settings you want to change:

Optional: Click the eraser symbol for any setting to remove the local value and inherit the value from the parent global configuration.

The field for the setting is disabled to indicate it is inheriting the value from the parent.

Click the Edit button to save the changes.

9.5.4. Configuring Quality of Service when creating an image
As a storage administrator, you can configure Quality of Service (QoS) limits when creating an image.
Prerequisites
- A running Red Hat Ceph Storage cluster.
- Dashboard is installed.
- A replicated pool with the RBD application enabled.
- An erasure coded pool with the RBD application enabled.
Procedure
- Log in to the dashboard.
On the navigation bar, click Block and then click Images:
Click the Create button:

At 1, set the name, at 2, set the pool, at 3, set the size, and at 4, click Advanced.
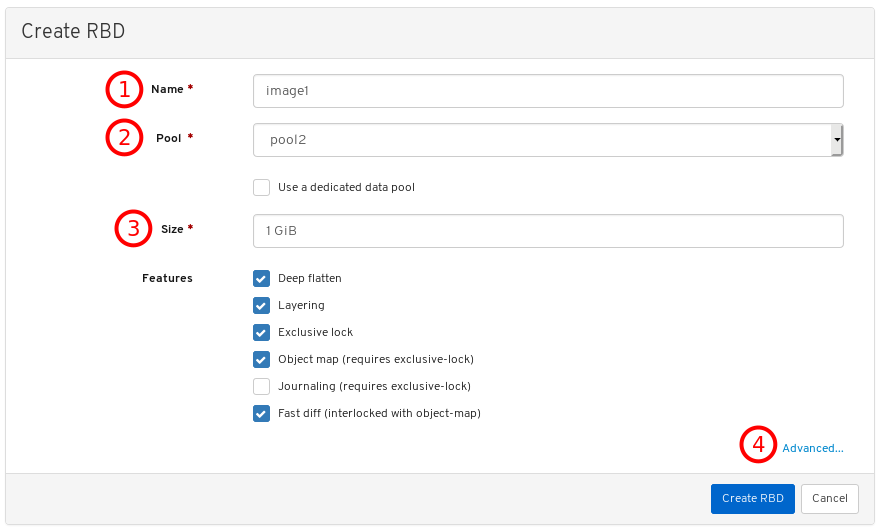
Click the plus symbol next to Quality of Service to open the QoS settings:
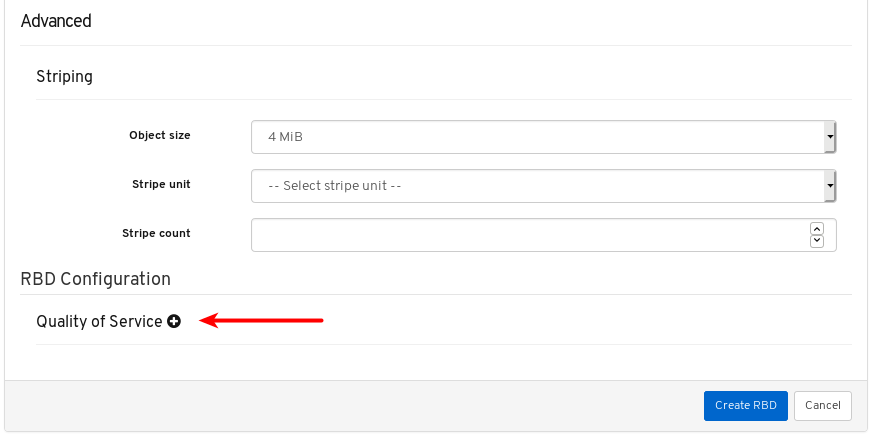
Optional: Click the question mark symbol next to an individual setting to find out more about it.

Enter or edit values for the QoS settings you want to change:

Optional: Click the eraser symbol for any setting to remove the local value and inherit the value from the parent pool configuration.

The field for the setting is disabled to indicate it is inheriting the value from the parent.

Click the Create RBD button:
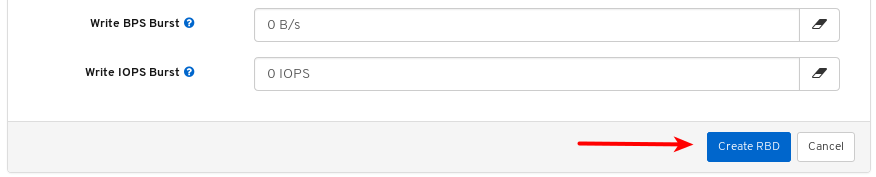
9.5.5. Configuring Quality of Service when creating a pool
As a storage administrator, you can configure Quality of Service (QoS) when creating a pool.
Prerequisites
- A running Red Hat Ceph Storage cluster.
- Dashboard is installed.
- A replicated pool with the RBD application enabled.
- An erasure coded pool with the RBD application enabled.
Procedure
- Log in to the dashboard.
On the navigation bar, click Pools.
Click the Create button towards the top left corner of the page:
In the dialog box, at 1, set the pool name, at 2, set the pool type to erasure, at 3, set the number of placement groups, at 4, enable EC Overwrites, at 5, set the rbd application, finally, at 6, click Create Pool.
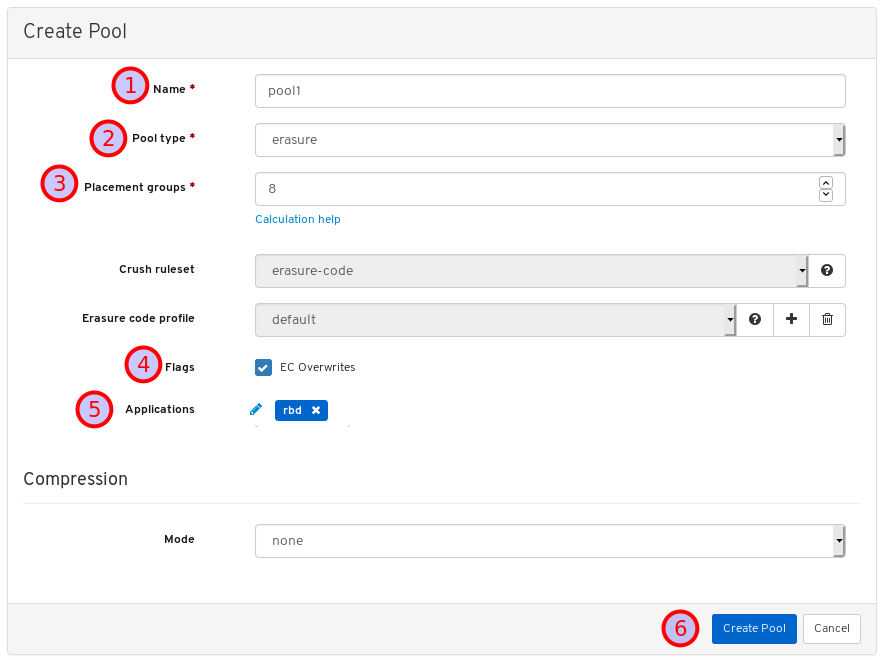
Create another pool but this time set its type to replicated:
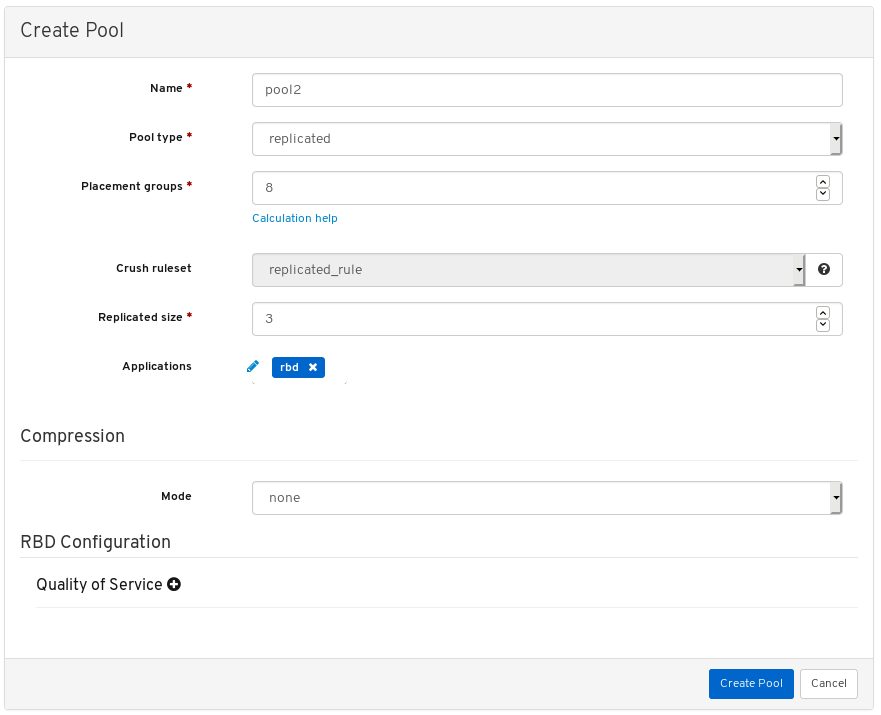
Click the plus symbol next to Quality of Service to open the QoS settings:
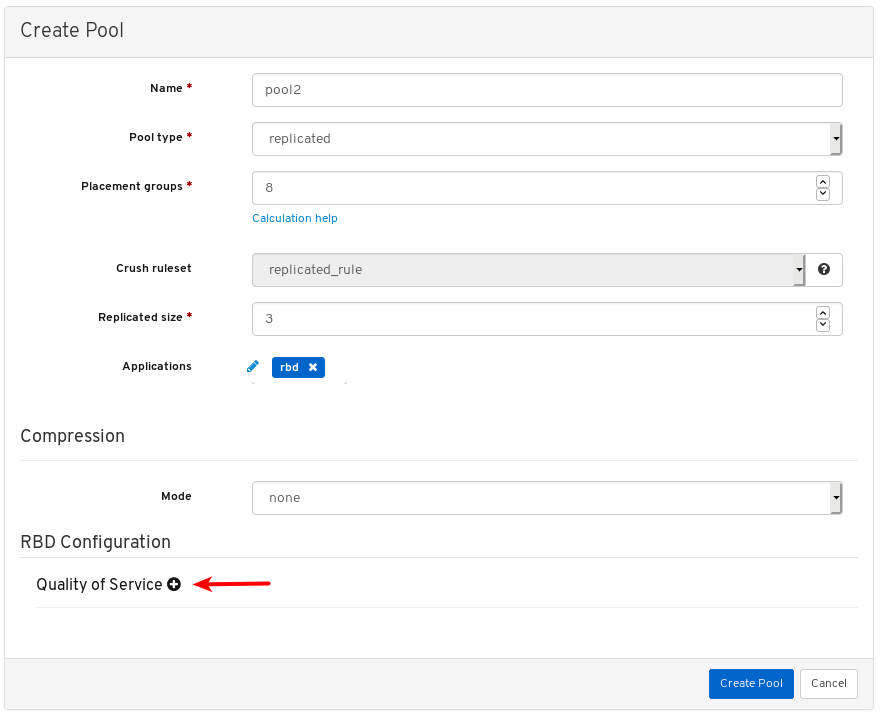
Optional: Click the question mark symbol next to an individual setting to find out more about it.

Enter or edit values for the QoS settings you want to change:

Optional: Click the eraser symbol for any setting to remove the local value and inherit the value from the parent global configuration.

The field for the setting is disabled to indicate it is inheriting the value from the parent.

Click the Create Pool button:
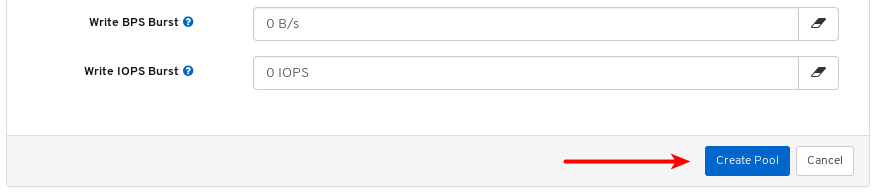
9.5.6. Additional Resources
- For more information on block devices, see the Block Device guide.
Appendix A. Troubleshooting
This section provides the multiple troubleshooting scenarios while using the dashboard.
A.1. Dashboard response is slow
If the dashboard response is slow, clear the browser cache and reload the dashboard.
A.2. Dashboard shows a service is down
Dashboard is only a replica of the cluster. If the service is down, check the service status on the node as dashboard displays information collected via node-exporter running on the node. The issue may be in the cluster, configuration, or network.
A.3. Task failure on Dashboard
While performing any task on the dashboard, if there is any failure, check the respective Ceph daemons. For more information refer to the Troubleshooting Guide
A.4. Images cannot be viewed
An image can only be viewed under Block > Images if the pool it is in has the RBD application enabled on it.
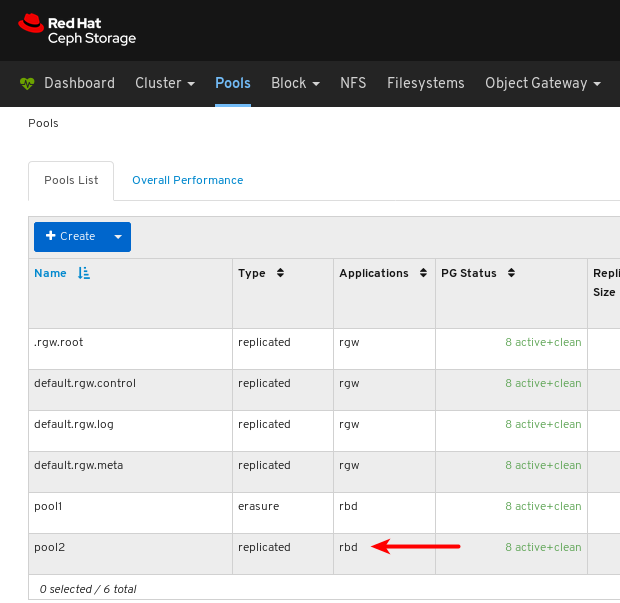
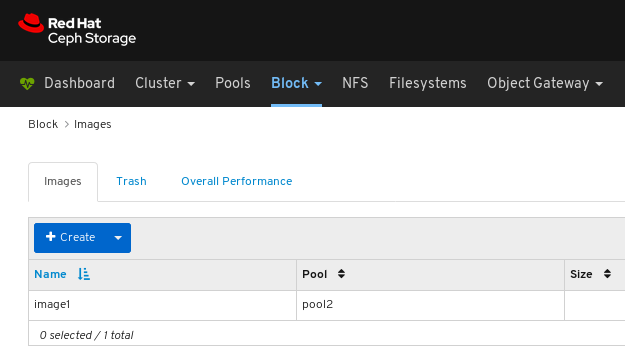
Additional resources
For more information, refer to the Troubleshooting Guide