Ce contenu n'est pas disponible dans la langue sélectionnée.
Chapter 15. Starting the Camel Debugger
Overview
Copier lienLien copié sur presse-papiers!
Note
You must set breakpoints in your routing context file before you can start the Camel debugger.
You run the Camel debugger on the routing context file, so be sure to save any changes you made to the file before you invoke the debugger. Otherwise your changes will not be included in the debugging session.
Procedure
Copier lienLien copié sur presse-papiers!
- In Project Explorer, select the routing context file you want to debug.
- Right-click it to open the context menu, and then select
. Fuse Tooling builds the Camel route, starts up Apache Camel, starts the routing context, enables JMX, starts the route(s) in the routing context, adds the breakpoints to the nodes, and enables the Camel debugger.The Camel debugger suspends execution of the routing context at the first breakpoint it encounters, and asks whether you want it to open the Debug perspective.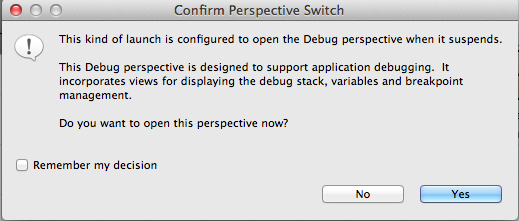
- Click Yes to open Debug perspective.Debug perspective opens with the routing context suspended at the first breakpoint in the running routing context.ImportantBreakpoints are held for a maximum of five minutes, after which debugging automatically resumes, moving on to the next breakpoint or to the end of the routing context if there are no more breakpoints.
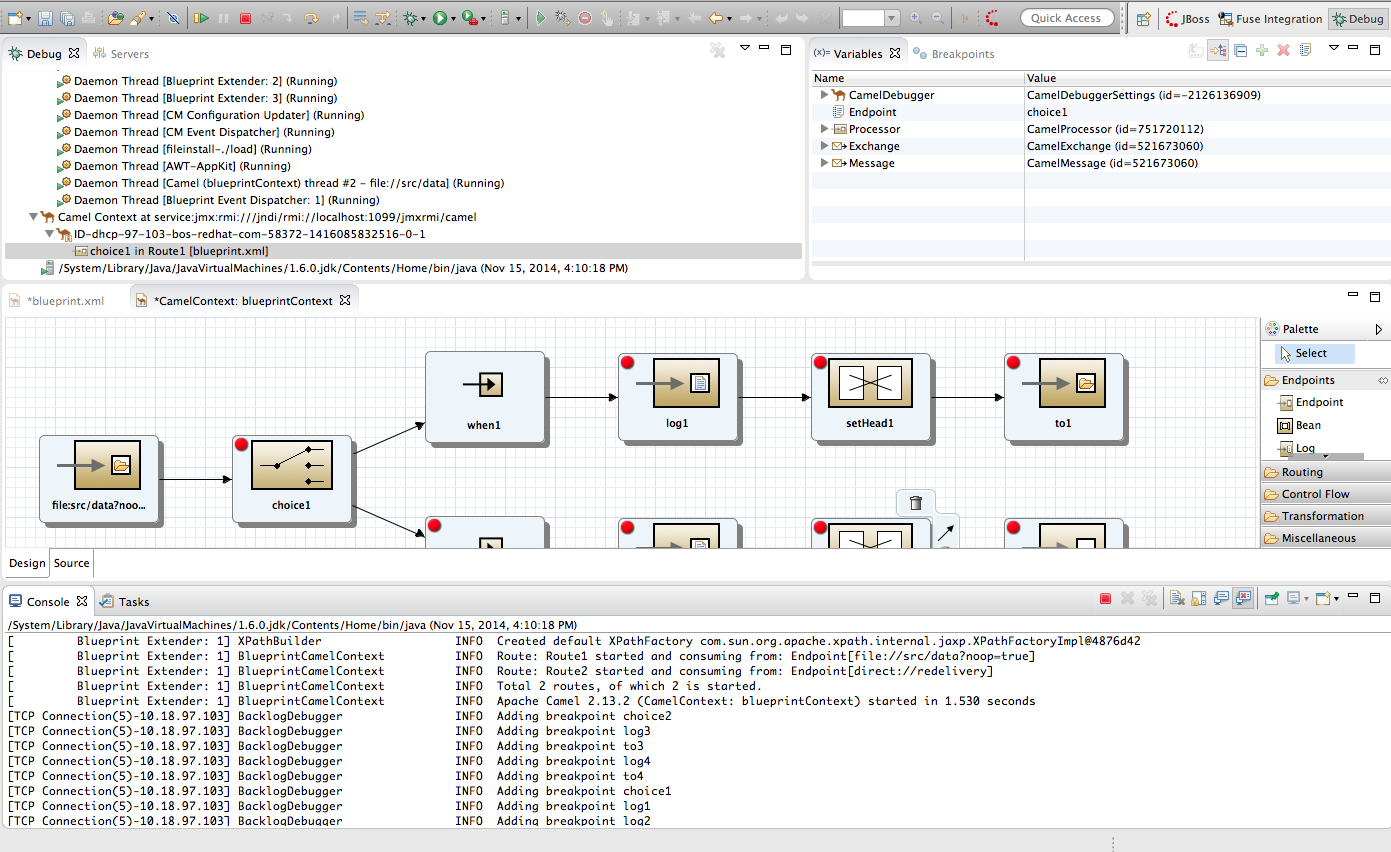 NoteTo see the console output, you'll need to open Console view if it was not open when you switched perspectives.NoteBy default, Debug perspective opens displaying Outline view, which provides the means to switch between separate routes in a routing context. If your routing context contains a single route, closing Outline view will provide more space to expand the other views, making it easier to access and examine debugger output.
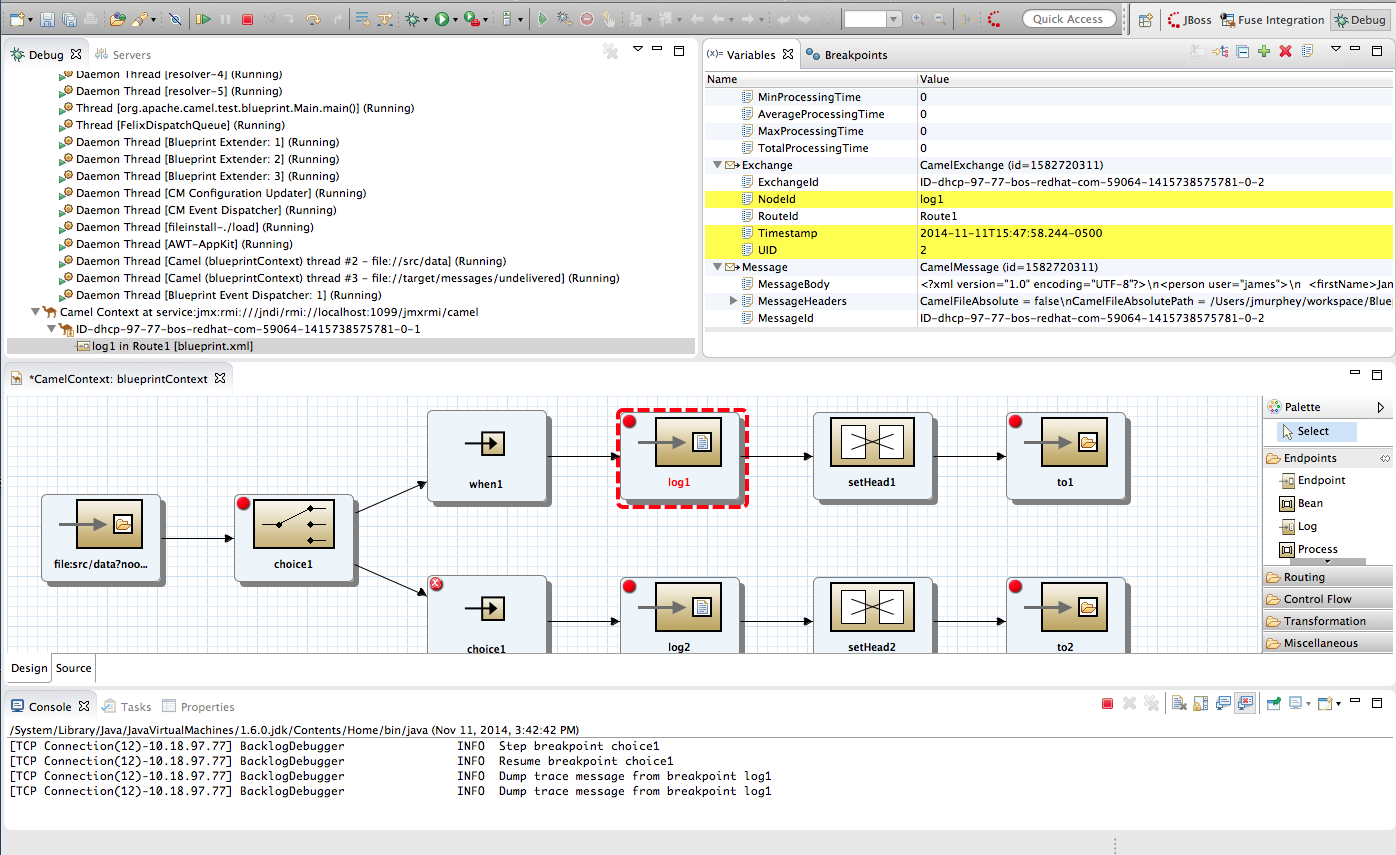
Watching message exchanges progress through the routing context
Copier lienLien copié sur presse-papiers!
Click
 (Step Over) to jump to the next node of execution in the routing context. Click
 (Resume) to continue execution at the next active breakpoint in the routing context.
Related topics
Copier lienLien copié sur presse-papiers!
| Chapter 16, Stopping the Camel Debugger |
| chapter "To Debug a Routing Context" in "Tooling Tutorials" |