Este conteúdo não está disponível no idioma selecionado.
Chapter 2. Console monitoring and alerting
Red Hat Quay provides support for monitoring instances that were deployed by using the Red Hat Quay Operator, from inside the OpenShift Container Platform console. The new monitoring features include a Grafana dashboard, access to individual metrics, and alerting to notify for frequently restarting Quay pods.
To enable the monitoring features, the Red Hat Quay Operator must be installed in All Namespaces mode.
2.1. Dashboard
On the OpenShift Container Platform console, click Monitoring
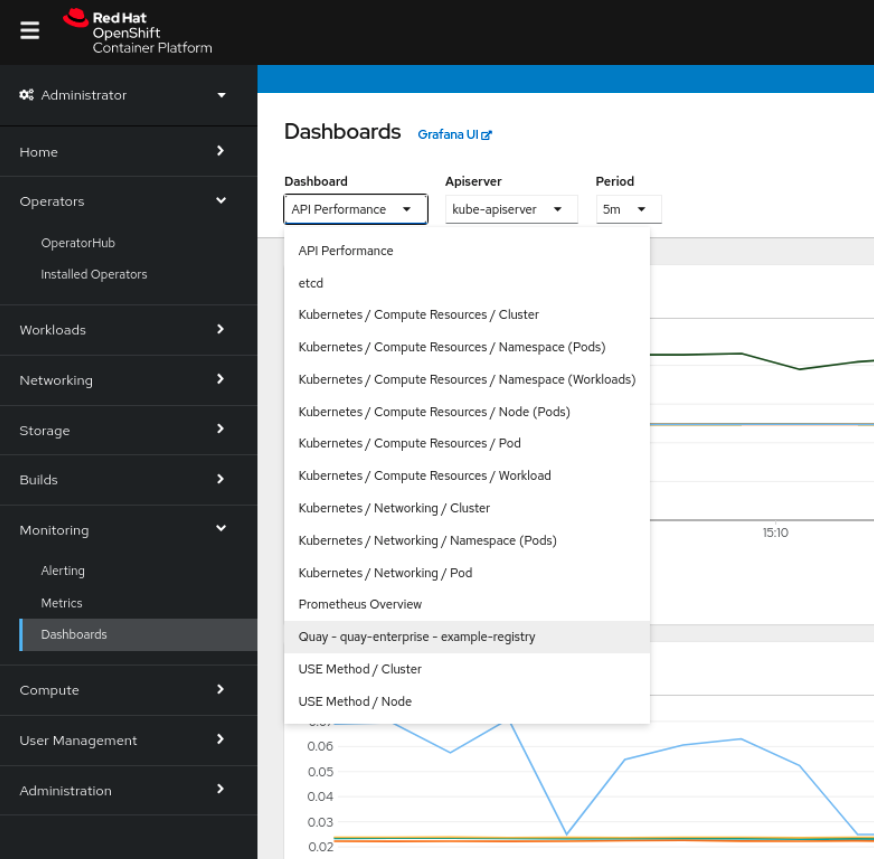
The dashboard shows various statistics including the following:
- The number of Organizations, Repositories, Users, and Robot accounts
- CPU Usage
- Max memory usage
- Rates of pulls and pushes, and authentication requests
- API request rate
- Latencies

2.2. Metrics
You can see the underlying metrics behind the Red Hat Quay dashboard by accessing Monitoring quay_ to see the list of metrics available:

Select a sample metric, for example, quay_org_rows:

This metric shows the number of organizations in the registry. It is also directly surfaced in the dashboard.
2.3. Alerting
An alert is raised if the Quay pods restart too often. The alert can be configured by accessing the Alerting rules tab from Monitoring

Select the QuayPodFrequentlyRestarting rule detail to configure the alert:
