此内容没有您所选择的语言版本。
Chapter 27. Camel Events Page
Abstract
You view and analyze events for all containers with Camel routes in the Camel page. This page provides functionality similar to route tracing.
Overview
复制链接链接已复制到粘贴板!
You access the Camel Events page from the Insight perspective. This page is available only when you install and configure the Insight plugin for one or more containers with a Camel route.
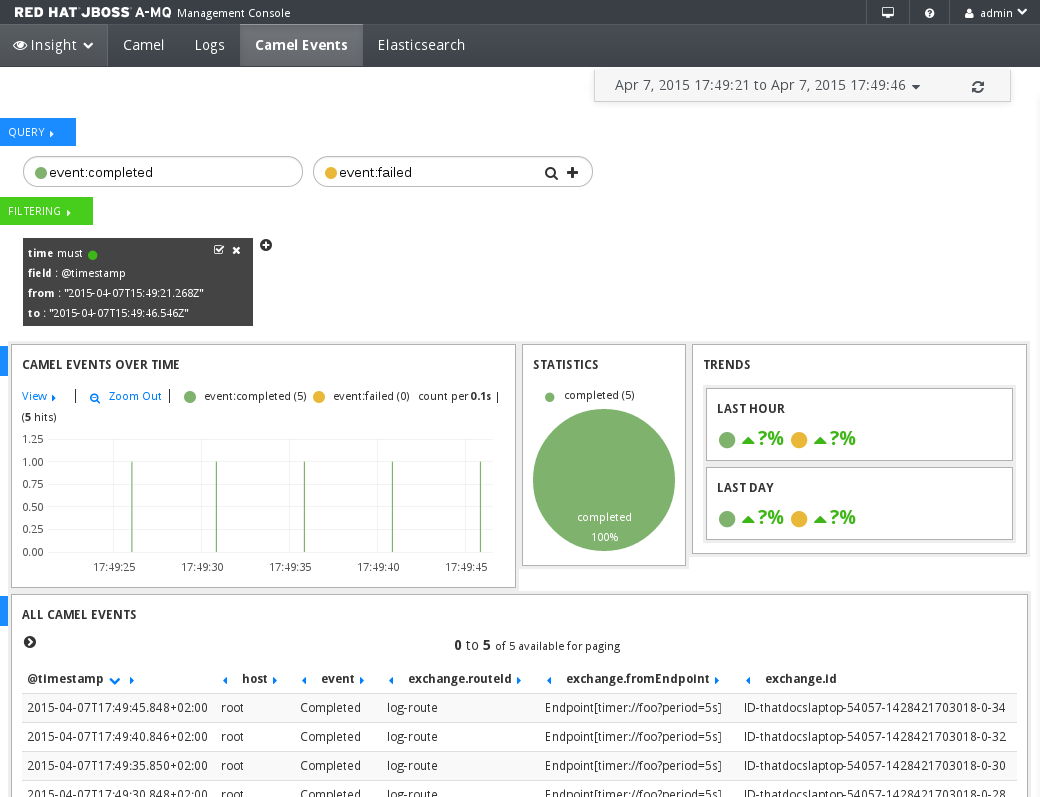
The following image shows an example of the Camel Events page:

The Camel Events page contains the following sections:
- Quick-filter
- Drop-down list with options to filter the event list and graph according to predefined times, such as last 15 minutes or last 7 days. The list also includes a Refresh icon that you can use to display messages that were generated after you navigated to this page.
- Query box
- Text box where you enter a query to search for events in the data store. By default, the page shows only completed and failed events. You can define queries with the lucene query string, regular expressions, or topN formats. For information and conventions, click the colored circle icon on the left side of the query box and open the About dialog box.
- Filtering pane
- Filter settings for the event list. You can use this pane to add, edit or delete filter settings.
- Camel Events Over Time graph
- Visual representation of the events as they are collected in the data store. You can drag the mouse cursor to highlight an area in the graph and show the events that occured during the selected time frame. The event list refreshes as you zoom in or out in the graph.
- Statistics pie chart
- Visual representation of the percentage of completed events. You can click the completed area in the pie chart to add a filter that shows only completed events.
- Trends overview
- Statistical information about the Camel events that occured in the last hour and the last day. The trends are displayed based on the query settings. By default, the overview shows information about completed and failed events.
- All Camel Events list
- List of events for all Camel containers and brokers in the Insight ensemble. The events in this list depend on the query, filter, and graph settings. Use the left and right arrows to navigate the list.You can click an event to drill down to detailed information, such as exchange ID, full message, endpoint, and so on. You can also perform actions on the event, such as add or remove a filter based on one of the event properties.