14. Viewing Alert Data
Once an alert notification is triggered, JBoss ON records it in an alert history for the resource. The history includes the time the alert was sent and the condition which triggered it. Crucially, JBoss ON also shows whether an alert has been acknowledged and, if so, what user addressed it.
While monitoring and alerting work together to make administrators immediately aware of a problem with a resource, the alert history gives a much broader view into resource performance and IT staff responses. Knowing, historically, what kind of alerts have been triggered and when can help with root cause analysis, incident response, and maintenance policies.
14.1. Viewing the Alert Definitions Report
While the alert definitions for a specific resource are always available by viewing that resource entry, it is also possible to view all of the alert definitions configured in JBoss ON in the Alert Definitions Report.
- Select the Reports tab in the top navigation bar.
- In the Subsystems menu box on the left, select Alert Definitions.
- The definitions report shows a list of all configured definitions, for all resources in the inventory.
 The results table provide the most basic information for the definitions:
- The resource (Name).
- The parent or ancestry. Since resources are arranged hierarchically, sorting by the parent is very useful for finding all alert definitions for all services and applications that relate to a high-level resource like a server.
- The description of the alert.
- Whether it is active (enabled).
Note
A user may have the write to create and edit an alert definition, but that does not mean that the user has the right to delete an item from the alert history.
Deleting elements in the history requires the manage inventory permission.
Note
Reports can be exported to CSV, which can be used for office systems or further data manipulation.
To export a report, simply click the button. The report will automatically be downloaded as
alertDefinitions.csv.
14.2. Viewing Alerts
The alert history can be reviewed for a resource, a group of resources, a parent, or the whole JBoss ON server.
14.2.1. Viewing Alert Details for a Specific Resource
Note
A user may have the write to create and edit an alert definition, but that does not mean that the user has the right to delete an item from the alert history.
Deleting elements in the history requires the manage inventory permission.
- Click the Inventory tab in the top menu.
- Select the resource type in the Resources menu table on the left, and then browse or search for the resource.

- Click the resource in the list.
- Click the Alerts tab, and make sure that the History subtab is selected.
- In the list, click the timestamp or alert definition name for the fired alert.

- The alert page has tabs for each detail for the alert, including which alert definition was triggered, the conditions that triggered, and any operations that were launched as a result.

14.2.2. Viewing the Fired Alerts Report
- Select the Reports tab in the top navigation bar.
- In the Subsystems menu box on the left, select Recent Alerts.

All of the alerts for all resources in JBoss ON are listed in the results table. Several elements are useful for analysis:
- The resource (Name)
- The parent (ancestor)
- The name of the definition which triggered the alert
- The condition which triggered the alert
- The value of the resource at the time the alert was sent
- The date, which is very useful for correlating the alert notification to an external event
Note
A user may have the write to create and edit an alert definition, but that does not mean that the user has the right to delete an item from the alert history.
Deleting elements in the history requires the manage inventory permission.
Note
Reports can be exported to CSV, which can be used for office systems or further data manipulation.
To export a report, simply click the button. The report will automatically be downloaded as
recentAlerts.csv.
14.2.3. Viewing Alerts in the Dashboard
All of the recently-fired alerts, by default, are listed on the Dashboard page of JBoss ON in the recent alerts portlet.
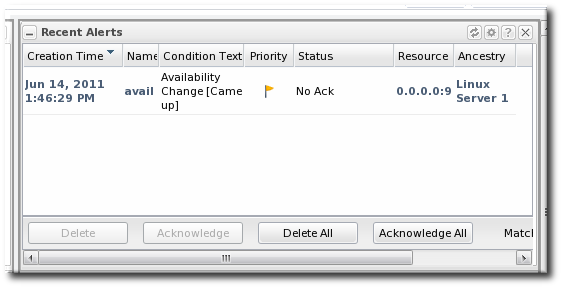
Figure 34. Recent Alerts Portlet
The alerts displayed in the portlet can be filtered for different conditions:
- A time range for when the alert was fired
- The alert priority (which is initially configured in the alert definition)
These conditions are evaluated in order, meaning that alerts are filtered first based on time, then priority.
To set the conditions for the alerts portlet in the Dashboard page:
- In the top menu, click Dashboard.
- In the Recent Alerts portlet, click the gear icon to open the portlet configuration page.

- Change the display criteria as desired.
14.3. Acknowledging an Alert
Acknowledging an alert is a way of identifying that the condition which triggered the alert has been addressed in some way. When an alert is acknowledged, the name of the user who acknowledged the alert is recorded. Recording the acknowledger's name allows the action to be audited later if necessary.
There are several different ways to acknowledge an alert:
- Through the Recent Alerts Report
- Through a group
- Through the resource entry
Using the Recent Alerts Report is useful because you can acknowledge multiple alerts at the same time and for multiple resource types, which could be simpler if a known outage triggered many alerts. Acknowledging an alert is not a requirement to close the alert, but it can be useful as part of auditing an incident response or making sure that issues have been addressed.
- Select the Reports tab in the top navigation bar.
- In the Subsystems menu box on the left, select Recent Alerts.
- Select the alert to acknowledge.
- Click the Acknowledge button, and, when prompted, confirm the action.

Note
It is also possible to acknowledge a single alert through the alert details page.
When the alert is acknowledged, the Status shows the name of the user who acknowledged (and presumably resolved) the alert.
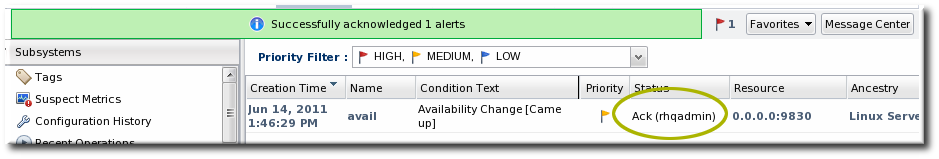
Figure 35. Alert Acknowledgment
14.4. Troubleshooting Alerts
- Q: I just created an alert definition, and I know that my agent reported data that should have fired an alert immediately. But I don't see an alert. Why not?
- Q: Why do I see alerts triggered on different metric values on different alert definition conditions when they are using the same metric?
Q:
I just created an alert definition, and I know that my agent reported data that should have fired an alert immediately. But I don't see an alert. Why not?
A:
After an alert definition is created, it takes a few seconds to be inserted into the JBoss ON server alert caches and then propagatd throughout the JBoss ON server cloud. An alert won't be fired until that alert definiton is in the server alert cache.
When the alert definition is inserted into the cache, a message is recored in the JBoss ON server logs:
INFO  [CacheConsistencyManagerBean] localhost took [51]ms to reload global cache
INFO  [CacheConsistencyManagerBean] localhost took [49]ms to reload cache for 1 agents
It generally takes around 30 seconds for an alert definition to be added to the cache. Wait at least a minute after creating a definition before checking if it fires an alert.
Q:
Why do I see alerts triggered on different metric values on different alert definition conditions when they are using the same metric?
A:
This can occur due to the nature of how alert conditions are processed when measurement data comes in from the agent. This happens if a single alert definition has multiple conditions that use the same metric and that alert definition uses the "ALL" conjunction. For example, if an alert definition has one condition for "alert if metric X is greater than 5" and a separate condition for "alert if metric X less than 10."
The alert condition range works around this by doing range checking. For more information, see Section 12.2, “Detailed Discussion: Ranges, AND, and OR Operators with Conditions”.