Dieser Inhalt ist in der von Ihnen ausgewählten Sprache nicht verfügbar.
5.2. XFS File System Performance Analysis with Performance Co-Pilot
This section describes PCP XFS performance metrics and how to use them. Once started, the Performance Metric Collector Daemon (PMCD) begins collecting performance data from the installed Performance Metric Domain Agents (PMDAs). PMDAs can be individually loaded or unloaded on the system and are controlled by the PMCD on the same host. The XFS PMDA, which is part of the default PCP installation, is used to gather performance metric data of XFS file systems in PCP.
For a list of system services and tools that are distributed with PCP, see Table A.1, “System Services Distributed with Performance Co-Pilot in Red Hat Enterprise Linux 7” and Table A.2, “Tools Distributed with Performance Co-Pilot in Red Hat Enterprise Linux 7”.
5.2.1. Installing XFS PMDA to Gather XFS Data with PCP
Link kopierenLink in die Zwischenablage kopiert!
The XFS PMDA ships as part of the pcp package and is enabled by default on installation. To install PCP, enter:
Copy to Clipboard
Copied!
Toggle word wrap
Toggle overflow
yum install pcp
# yum install pcp
To enable and start the PMDA service on the host machine after the pcp and pcp-gui packages are installed, use the following commands:
systemctl enable pmcd.service
# systemctl enable pmcd.servicesystemctl start pmcd.service
# systemctl start pmcd.service
To query the PCP environment to verify that the PMCD process is running on the host and that the XFS PMDA is listed as enabled in the configuration, enter:
Copy to Clipboard
Copied!
Toggle word wrap
Toggle overflow
Installing XFS PMDA Manually
If the XFS PMDA is not listed in PCP configuration readout, install the PMDA agent manually. The PMDA installation script prompts you to specify the PMDA role: collector, monitor, or both.
The default option is
- The
collectorrole allows the collection of performance metrics on the current system
- The
monitorrole allows the system to monitor local systems, remote systems, or both.
both collector and monitor, which allows the XFS PMDA to operate correctly in most scenarios.
To install XFS PMDA manually, change to the xfs directory:
Copy to Clipboard
Copied!
Toggle word wrap
Toggle overflow
In the
Copy to Clipboard
Copied!
Toggle word wrap
Toggle overflow
cd /var/lib/pcp/pmdas/xfs/
# cd /var/lib/pcp/pmdas/xfs/xfs directory, enter:
5.2.2. Configuring and Examining XFS Performance Metrics
Link kopierenLink in die Zwischenablage kopiert!
Examining Metrics with pminfo
Link kopierenLink in die Zwischenablage kopiert!
With PCP installed and the XFS PMDA enabled, instructions are available in Section 5.2.1, “Installing XFS PMDA to Gather XFS Data with PCP”, the easiest way to start looking at the performance metrics available for PCP and XFS is to use the
pminfo tool, which displays information about available performance metrics. The command displays a list of all available metrics provided by the XFS PMDA.
To display a list of all available metrics provided by the XFS PMDA:
pminfo xfs
# pminfo xfs
Use the following options to display information on selected metrics:
-t metric- Displays one-line help information describing the selected metric.
-T metric- Displays more verbose help text describing the selected metric.
-f metric- Displays the current reading of the performance value that corresponds to the metric.
You can use the
-t, -T, and -f options with a group of metrics or an individual metric. Most metric data is provided for each mounted XFS file system on the system at time of probing.
There are different groups of XFS metrics, which are arranged so that each different group is a new leaf node from the root XFS metric, using a dot (
.) as a separator. The leaf node semantics (dots) applies to all PCP metrics. For an overview of the types of metrics that are available in each of the groups, see Table A.3, “PCP Metric Groups for XFS”.
Example 5.1. Using the pminfo Tool to Examine XFS Read and Write Metrics
To display one-line help information describing the
xfs.write_bytes metric:
pminfo -t xfs.write_bytes
# pminfo -t xfs.write_bytes

xfs.write_bytes [number of bytes written in XFS file system write operations]
To display more verbose help text describing the
xfs.read_bytes metric:
To obtain the current reading of the performance value that corresponds to the
xfs.read_bytes metric:
pminfo -f xfs.read_bytes
# pminfo -f xfs.read_bytes

xfs.read_bytes
    value 4891346238
Configuring Metrics with pmstore
Link kopierenLink in die Zwischenablage kopiert!
With PCP, you can modify the values of certain metrics, especially if the metric acts as a control variable, for example the
xfs.control.reset metric. To modify a metric value, use the pmstore tool.
Example 5.2. Using pmstore to Reset the xfs.control.reset Metric
This example shows how to use
Copy to Clipboard
Copied!
Toggle word wrap
Toggle overflow
Copy to Clipboard
Copied!
Toggle word wrap
Toggle overflow
Copy to Clipboard
Copied!
Toggle word wrap
Toggle overflow
pmstore with the xfs.control.reset metric to reset the recorded counter values for the XFS PMDA back to zero.
pminfo -f xfs.write
$ pminfo -f xfs.write

xfs.write
    value 325262
pmstore xfs.control.reset 1
# pmstore xfs.control.reset 1

xfs.control.reset old value=0 new value=1
pminfo -f xfs.write
$ pminfo -f xfs.write

xfs.write
    value 0
5.2.3. Examining XFS Metrics Available per File System
Link kopierenLink in die Zwischenablage kopiert!
Starting with Red Hat Enterprise Linux 7.3, PCP enables XFS PMDA to allow the reporting of certain XFS metrics per each of the mounted XFS file systems. This makes it easier to pinpoint specific mounted file system issues and evaluate performance. For an overview of the types of metrics available per file system in each of the groups, see Table A.4, “PCP Metric Groups for XFS per Device”.
Example 5.3. Obtaining per-Device XFS Metrics with pminfo
The
Copy to Clipboard
Copied!
Toggle word wrap
Toggle overflow
pminfo command provides per-device XFS metrics that give instance values for each mounted XFS file system.
5.2.4. Logging Performance Data with pmlogger
Link kopierenLink in die Zwischenablage kopiert!
PCP allows you to log performance metric values that can be replayed later and used for a retrospective performance analysis. Use the
pmlogger tool to create archived logs of selected metrics on the system.
With pmlogger, you can specify which metrics are recorded on the system and how often. The default pmlogger configuration file is
/var/lib/pcp/config/pmlogger/config.default. The configuration file specifies which metrics are logged by the primary logging instance.
To log metric values on the local machine with
pmlogger, start a primary logging instance:
systemctl start pmlogger.service
# systemctl start pmlogger.servicesystemctl enable pmlogger.service
# systemctl enable pmlogger.service
When
Copy to Clipboard
Copied!
Toggle word wrap
Toggle overflow
pmlogger is enabled and a default configuration file is set, a pmlogger line is included in the PCP configuration:
Modifying the pmlogger Configuration File with pmlogconf
When the
pmlogger service is running, PCP logs a default set of metrics on the host. You can use the pmlogconf utility to check the default configuration, and enable XFS logging groups as needed. Important XFS groups to enable include the XFS information, XFS data, and log I/O traffic groups.
Follow
Copy to Clipboard
Copied!
Toggle word wrap
Toggle overflow
pmlogconf prompts to enable or disable groups of related performance metrics, and to control the logging interval for each enabled group. Group selection is made by pressing y (yes) or n (no) in response to the prompt. To create or modify the generic PCP archive logger configuration file with pmlogconf, enter:
pmlogconf -r /var/lib/pcp/config/pmlogger/config.default
# pmlogconf -r /var/lib/pcp/config/pmlogger/config.defaultModifying the pmlogger Configuration File Manually
You can edit the
pmlogger configuration file manually and add specific metrics with given intervals to create a tailored logging configuration.
Example 5.4. The pmlogger Configuration File with XFS Metrics
The following example shows an extract of the
Copy to Clipboard
Copied!
Toggle word wrap
Toggle overflow
pmlogger config.default file with some specific XFS metrics added.
Replaying the PCP Log Archives
After recording metric data, you can replay the PCP log archives on the system in the following ways:
- You can export the logs to text files and import them into spreadsheets by using PCP utilities such as
pmdumptext,pmrep, orpmlogsummary. - You can replay the data in the PCP Charts application and use graphs to visualize the retrospective data alongside live data of the system. See Section 5.2.5, “Visual Tracing with PCP Charts”.
You can use the
pmdumptext tool to view the log files. With pmdumptext, you can parse the selected PCP log archive and export the values into an ASCII table. The pmdumptext tool enables you to dump the entire archive log, or only select metric values from the log by specifying individual metrics on the command line.
Example 5.5. Displaying a Specific XFS Metric Log Information
For example, to show data on the
xfs.perdev.log metric collected in an archive at a 5 second interval and display all headers:
For more information, see the pmdumptext(1) manual page, which is available from the pcp-doc package.
5.2.5. Visual Tracing with PCP Charts
Link kopierenLink in die Zwischenablage kopiert!
To be able to use the graphical PCP Charts application, install the pcp-gui package:
yum install pcp-gui
# yum install pcp-gui
You can use the PCP Charts application to plot performance metric values into graphs. The PCP Charts application allows multiple charts to be displayed simultaneously. The metrics are sourced from one or more live hosts with alternative options to use metric data from PCP log archives as a source of historical data. To launch PCP Charts from the command line, use the
pmchart command.
After starting PCP Charts, the GUI appears:
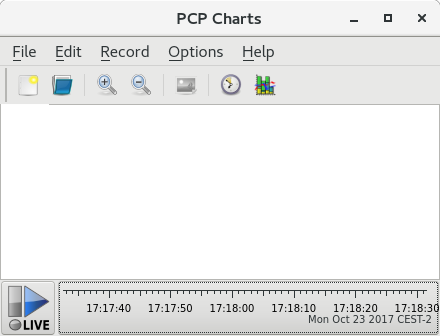
The PCP Charts application
The
pmtime server settings are located at the bottom. The and button allows you to control:
- The interval in which PCP polls the metric data
- The date and time for the metrics of historical data
Go to
There are multiple options to take images or record the views created in PCP Charts:
- Click
to save an image of the current view. - Click
to start a recording. Click to stop the recording. After stopping the recording, the recorded metrics are archived to be viewed later.
You can customize the PCP Charts interface to display the data from performance metrics in multiple ways, including:
- line plot
- bar graphs
- utilization graphs
In PCP Charts, the main configuration file, known as the
view, allows the metadata associated with one or more charts to be saved. This metadata describes all chart aspects, including the metrics used and the chart columns. You can create a custom view configuration, save it by clicking view configuration later. For more information about view configuration files and their syntax, see the pmchart(1) manual page.
Example 5.6. Stacking Chart Graph in PCP Charts View Configuration
The example PCP Charts view configuration file describes a stacking chart graph showing the total number of bytes read and written to the given XFS file system
Copy to Clipboard
Copied!
Toggle word wrap
Toggle overflow
loop1.