Dieser Inhalt ist in der von Ihnen ausgewählten Sprache nicht verfügbar.
11.2. Debugging
11.2.1. Debugging
Link kopierenLink in die Zwischenablage kopiert!
JBoss Developer Studio can be used to debug processes and examine the state of the running processes.
11.2.2. The Process Instances View
Link kopierenLink in die Zwischenablage kopiert!
The process instances view shows the currently running process instances.
To open the process instances viewer, select
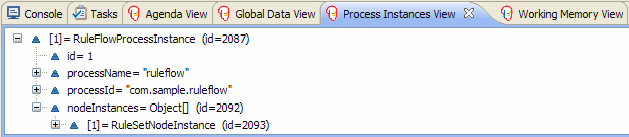
The Sample Process Instances View below shows that there is currently one running process (instance), currently executing one node instance, i.e. business rule task. When double-clicking a process instance, the process instance viewer will graphically display the progress of the process instance.
Example 11.2. Sample Process Instances View
11.2.3. The Human Task View
Link kopierenLink in die Zwischenablage kopiert!
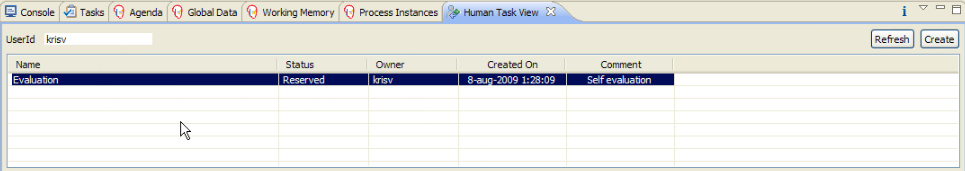
The Human Task View can connect to a running human task service and request the relevant tasks for a particular user (i.e. the tasks where the user is either a potential owner or the tasks that the user already claimed and is executing). The life cycle of these tasks can then be executed, i.e. claiming or releasing a task, starting or stopping the execution of a task, completing a task, etc.
To open the human task viewer, select
To configure the task service to connect to, select
Example 11.3. Sample Human Task View
11.2.4. The Audit View
Link kopierenLink in die Zwischenablage kopiert!
The audit view shows the audit log, which is a log of all events that were logged from the session. To create a logger, use the KnowledgeRuntimeLoggerFactory to create a new logger and attach it to a session. Note that using a threaded file logger will save the audit log to the file system at regular intervals, and the audit viewer will then be able to show the latest state. The Threaded File Logger below shows an example with the audit log file and the interval (in milliseconds) specified.
Example 11.4. Threaded File Logger
KnowledgeRuntimeLogger logger = KnowledgeRuntimeLoggerFactory
   .newThreadedFileLogger(ksession, "logdir/mylogfile", 1000);
// do something with the session here
logger.close();
To open the audit view, select
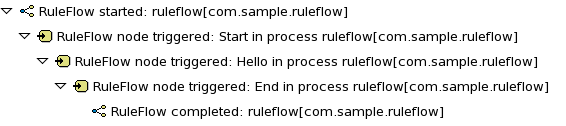
To open up an audit tree in the audit view, open the selected log file in the audit view or simply drag the file into the audit view. A tree-based view is generated based on the audit log. An event is shown as a sub node of another event if the child event is caused by (a direct consequence of) the parent event: