Dieser Inhalt ist in der von Ihnen ausgewählten Sprache nicht verfügbar.
9.5. Monitoring Host and Cluster Utilization
9.5.1. Monitoring Host and Cluster Utilization
Link kopierenLink in die Zwischenablage kopiert!
You can monitor utilization and set alerts and notifications for the utilization changes.
You can monitor Host and Cluster utilization using Nagios plug-in and validate the status of clusters and hosts from the utilization graph through Red Hat Storage Console.
Note
By default, you can view the Utilization report of the last 24 hours.
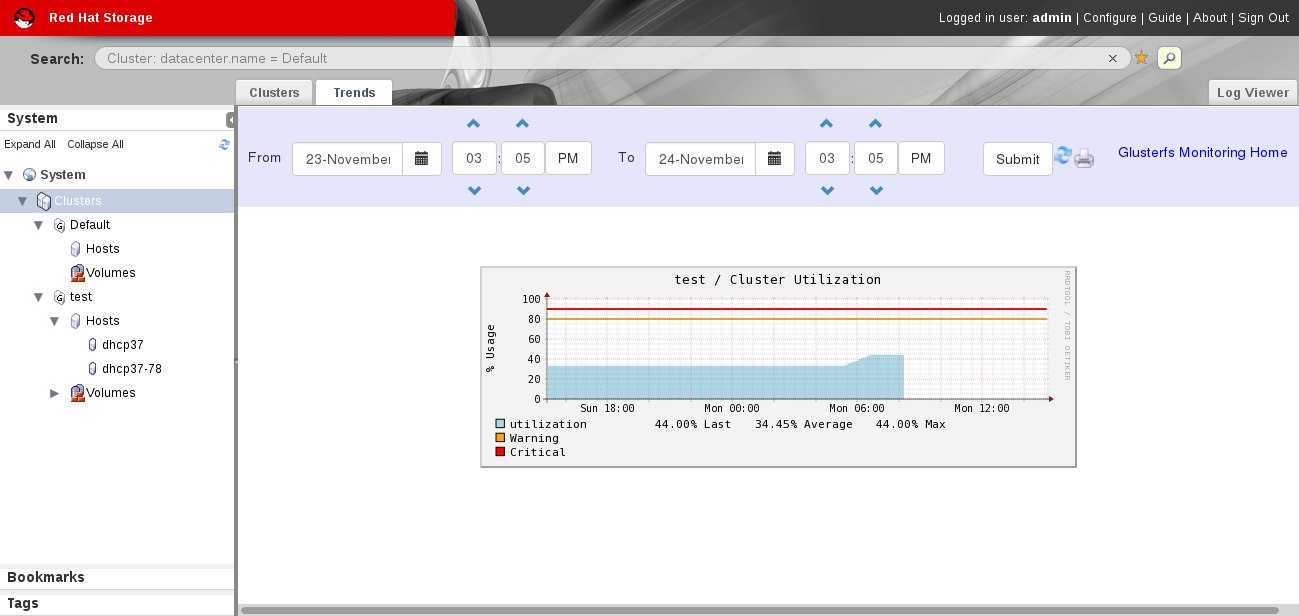
Procedure 9.1. To Monitor Cluster Utilization
- Click System and select Clusters in the Tree pane.
- Click Trends tab.
Figure 9.13. Trends
- Select the date and time duration to view the cluster utilization report.
- Click Submit. The Cluster Utilization graph of all clusters for the selected period is displayed.You can refresh the status by clicking the refresh button and also print the report or save as a pdf file by clicking the print button. Click Glusterfs Monitoring Home to view the Nagios Home page.
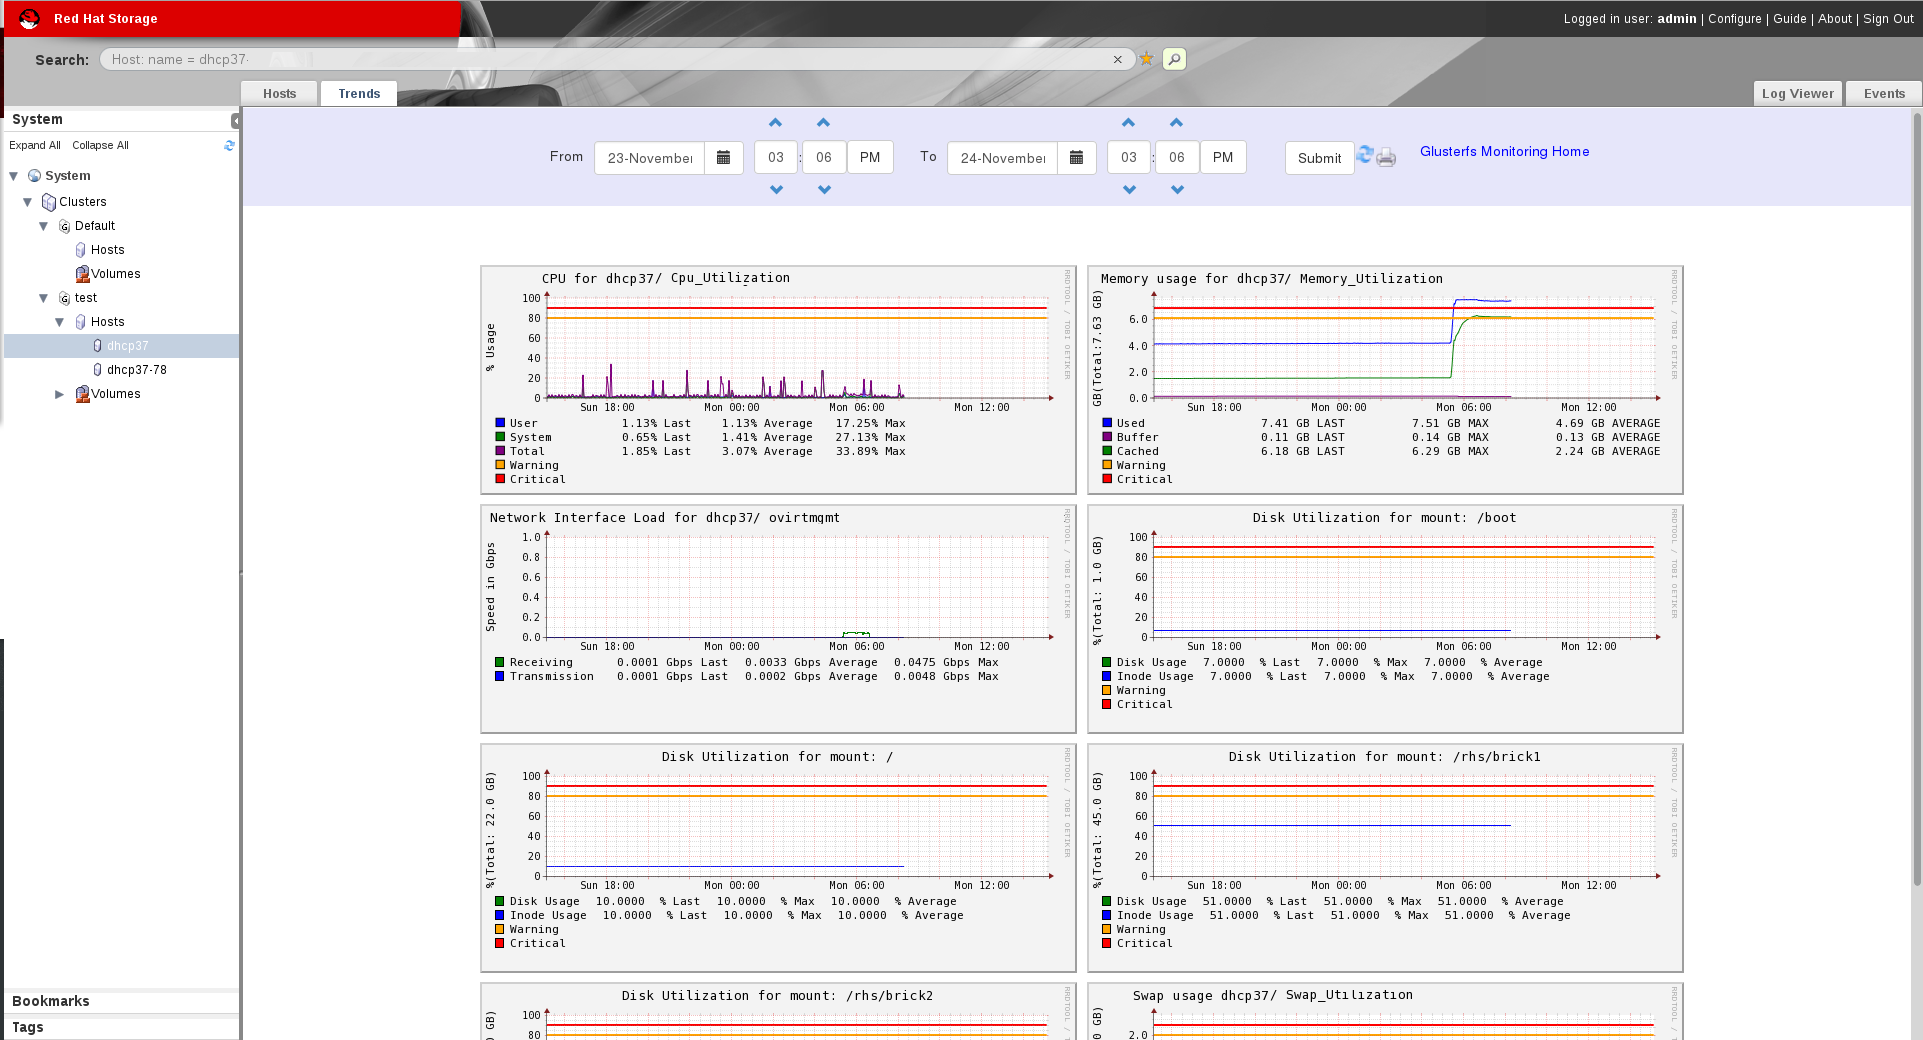
Procedure 9.2. To Monitor Utilization for Hosts
- Click System and select Clusters in the Tree pane.
- Click Hosts in the tree pane and click Trends tab to view the CPU Utilization for all the hosts.To view CPU Utilization, Network Interface Utilization, Disk Utilization,Memory Uttilization and Swap Utilization for each host, select the Host name from the tree pane and click Trends tab.
Figure 9.14. Utilization for selected Host
- Select the date and time to view the Host Utilization report.
- Click Submit. The CPU Utilization graph for all the Hosts for the selected period is displayed.You can refresh the status by clicking the refresh button and also print the report or save as a pdf file by clicking the print button. To view the Nagios Home page, click Glusterfs Monitoring Home.
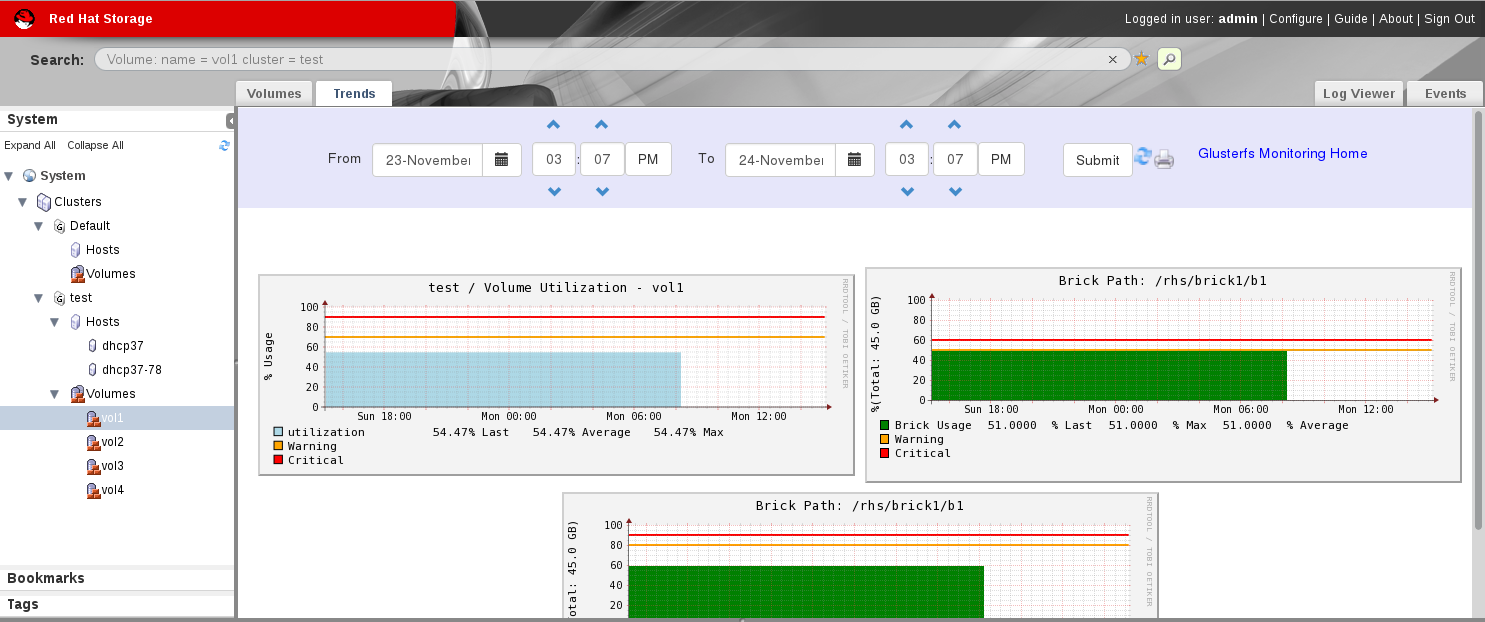
Procedure 9.3. To monitor Volume and Brick Utilization
- Open the Volumes view in the tree pane and select Volumes.
- Click Trends tab.
- Select the date and time duration to view the volume and brick utilization report.
- Click Submit. The Volume Utilization graph and Brick Utilization graph for the selected period is displayed.
Figure 9.15. Volume and Brick Utilization
You can refresh the status by clicking the refresh button and also print the report or save as a pdf file by clicking the print button. To view the Nagios Home page, click Glusterfs Monitoring Home.
9.5.2. Enabling and Disabling Monitoring
Link kopierenLink in die Zwischenablage kopiert!
You can enable and disable monitoring using the command line interface after setting up Red Hat Storage Console. The Trends tab is displayed with host and cluster utilization details when monitoring is enabled on the server.
Important
You must refresh the browser after enabling or disabling monitoring to view the changes.
- To enable monitoring, run the following command in the Red Hat Storage Console Server :
rhsc-monitoring enable
# rhsc-monitoring enable
Setting the monitoring flag...
Starting nagios: done.
Starting nsca: [  OK  ]
INFO: Move the nodes of existing cluster (with compatibilty version >= 3.4) to maintenance and re-install them.
Copy to Clipboard Copied! Toggle word wrap Toggle overflow The Trends tab is displayed in the Red Hat Storage Console Administrator portal with the host and cluster utilization details. - To disable monitoring, run the following command in the Red Hat Storage Console Server:
#rhsc-monitoring disable
Setting the monitoring flag...
Stopping nagios: .done.
Shutting down nsca: [  OK  ]
 #rhsc-monitoring disable
Setting the monitoring flag...
Stopping nagios: .done.
Shutting down nsca: [  OK  ]
Copy to Clipboard Copied! Toggle word wrap Toggle overflow The Trends tab is not displayed in the Red Hat Storage Console Administrator portal and the user cannot view host and cluster utilization details. Receiving email and SNMP notifications are disabled. Disabling monitoring also stops Nagios and NSCA services.Disabling monitoring does not stop theglusterpmdservice. Run the following commands on all the Red Hat Storage nodes to stopglusterpmdservice and to removechkconfigfor glusterpmd service:service glusterpmd stop chkconfig glusterpmd off
# service glusterpmd stop
# chkconfig glusterpmd off
Copy to Clipboard Copied! Toggle word wrap Toggle overflow