CLI Guide
Learn how to use the Migration Toolkit for Applications CLI to migrate your applications.
Abstract
Making open source more inclusive
Red Hat is committed to replacing problematic language in our code, documentation, and web properties. We are beginning with these four terms: master, slave, blacklist, and whitelist. Because of the enormity of this endeavor, these changes will be implemented gradually over several upcoming releases. For more details, see our CTO Chris Wright’s message.
Chapter 1. Introduction
1.1. About the CLI Guide
This guide is for engineers, consultants, and others who want to use the Migration Toolkit for Applications (MTA) to migrate Java applications, .NET applications, or other components. In MTA 7.1 and later, you can use MTA to analyze applications written in languages other than Java. To run analysis on applications written in languages other than Java, add a custom rule set and do not specify a target language. This guide describes how to install and run the CLI, review the generated reports, and take advantage of additional features.
.NET migration is a Developer Preview feature only. Developer Preview features are not supported by Red Hat in any way and are not functionally complete or production-ready. Do not use Developer Preview features for production or business-critical workloads. Developer Preview features provide early access to upcoming product features in advance of their possible inclusion in a Red Hat product offering, enabling customers to test functionality and provide feedback during the development process. These features might not have any documentation, are subject to change or removal at any time, and testing is limited. Red Hat might provide ways to submit feedback on Developer Preview features without an associated SLA.
Analyzing applications written in a language other than Java is a Developer Preview feature only. Developer Preview features are not supported by Red Hat in any way and are not functionally complete or production-ready. Do not use Developer Preview features for production or business-critical workloads. Developer Preview features provide early access to upcoming product features in advance of their possible inclusion in a Red Hat product offering, enabling customers to test functionality and provide feedback during the development process. These features might not have any documentation, are subject to change or removal at any time, and testing is limited. Red Hat might provide ways to submit feedback on Developer Preview features without an associated SLA.
1.2. About the Migration Toolkit for Applications
What is the Migration Toolkit for Applications?
Migration Toolkit for Applications (MTA) accelerates large-scale application modernization efforts across hybrid cloud environments on Red Hat OpenShift. This solution provides insight throughout the adoption process, at both the portfolio and application levels: inventory, assess, analyze, and manage applications for faster migration to OpenShift via the user interface.
In MTA 7.1 and later, when you add an application to the Application Inventory, MTA automatically creates and executes language and technology discovery tasks. Language discovery identifies the programming languages used in the application. Technology discovery identifies technologies, such as Enterprise Java Beans (EJB), Spring, etc. Then, each task assigns appropriate tags to the application, reducing the time and effort you spend manually tagging the application.
MTA uses an extensive default questionnaire as the basis for assessing your applications, or you can create your own custom questionnaire, enabling you to estimate the difficulty, time, and other resources needed to prepare an application for containerization. You can use the results of an assessment as the basis for discussions between stakeholders to determine which applications are good candidates for containerization, which require significant work first, and which are not suitable for containerization.
MTA analyzes applications by applying one or more rulesets to each application considered to determine which specific lines of that application must be modified before it can be modernized.
MTA examines application artifacts, including project source directories and application archives, and then produces an HTML report highlighting areas needing changes.
How does the Migration Toolkit for Applications simplify migration?
The Migration Toolkit for Applications looks for common resources and known trouble spots when migrating applications. It provides a high-level view of the technologies used by the application.
MTA generates a detailed report evaluating a migration or modernization path. This report can help you to estimate the effort required for large-scale projects and to reduce the work involved.
1.2.1. Supported Migration Toolkit for Applications migration paths
The Migration Toolkit for Applications (MTA) supports the following migrations:
- Migrating from third-party enterprise application servers, such as Oracle WebLogic Server, to JBoss Enterprise Application Platform (JBoss EAP).
- Upgrading to the latest release of JBoss EAP.
- Migrating from a Windows-only .NET 4.5+ Framework to cross-platform .NET 8.0. (Developer Preview)
MTA provides a comprehensive set of rules to assess the suitability of your applications for containerization and deployment on Red Hat OpenShift Container Platform (RHOCP). You can run an MTA analysis to assess your applications' suitability for migration to multiple target platforms.
| Source platform ⇒ | Migration to JBoss EAP 7 & 8 | OpenShift (cloud readiness) | OpenJDK 11, 17, and 21 | Jakarta EE 9 | Camel 3 & 4 | Spring Boot in Red Hat Runtimes | Quarkus | Open Liberty |
|---|---|---|---|---|---|---|---|---|
| Oracle WebLogic Server | ✔ | ✔ | ✔ | - | - | - | - | - |
| IBM WebSphere Application Server | ✔ | ✔ | ✔ | - | - | - | - | ✔ |
| JBoss EAP 4 | ✘ [a] | ✔ | ✔ | - | - | - | - | - |
| JBoss EAP 5 | ✔ | ✔ | ✔ | - | - | - | - | - |
| JBoss EAP 6 | ✔ | ✔ | ✔ | - | - | - | - | - |
| JBoss EAP 7 | ✔ | ✔ | ✔ | - | - | - | ✔ | - |
| Thorntail | ✔ [b] | - | - | - | - | - | - | - |
| Oracle JDK | - | ✔ | ✔ | - | - | - | - | - |
| Camel 2 | - | ✔ | ✔ | - | ✔ | - | - | - |
| Spring Boot | - | ✔ | ✔ | ✔ | - | ✔ | ✔ | - |
| Any Java application | - | ✔ | ✔ | - | - | - | - | - |
| Any Java EE application | - | - | - | ✔ | - | - | - | - |
[a]
Although MTA does not currently provide rules for this migration path, Red Hat Consulting can assist with migration from any source platform to JBoss EAP 7.
[b]
Requires JBoss Enterprise Application Platform expansion pack 2 (EAP XP 2)
| ||||||||
- .NET migration paths: Source platform ⇒ Target platform (Developer Preview)
| Source platform ⇒ | OpenShift (cloud readiness) | Migration to .NET 8.0 |
|---|---|---|
| .NET Framework 4.5+ (Windows only) | ✔ | ✔ |
For more information about use cases and migration paths, see the MTA for developers web page.
1.3. The MTA CLI
The CLI is a command-line tool in the Migration Toolkit for Applications that you can use to assess and prioritize migration and modernization efforts for applications. It provides numerous reports that highlight the analysis without using the other tools. The CLI includes a wide array of customization options. By using the CLI, you can tune MTA analysis options or integrate with external automation tools.
Chapter 2. Installing and Running the CLI
2.1. Installing the CLI
You can install the CLI on Linux, Windows, or macOS operating systems using the downloadable .zip file.
Prerequisites
-
Red Hat Container Registry Authentication for
registry.redhat.io. Red Hat distributes container images fromregistry.redhat.io, which requires authentication. For more details, see Red Hat Container Registry Authentication.
2.1.1. Installing the CLI .zip file
Procedure
Navigate to the MTA Download page and download the OS-specific CLI file or the
srcfile:- mta-7.1.1-cli-linux.zip
- mta-7.1.1-cli-macos.zip
- mta-7.1.1-cli-windows.zip
- mta-7.1.1-cli-src.zip
Extract the
.zipfile to a directory of your choice. The.zipfile extracts a single binary, called mta-cli.When you encounter
<MTA_HOME>in this guide, replace it with the actual path to your MTA installation.
2.1.2. Installing the CLI by using Podman
You can install the CLI using podman pull.
Prerequisites
-
Red Hat Container Registry Authentication for
registry.redhat.io. Red Hat distributes container images fromregistry.redhat.io, which requires authentication. See Red Hat Container Registry Authentication for additional details. - Podman must be installed.
Podman is a daemonless, open source, Linux-native tool designed to make it easy to find, run, build, share, and deploy applications using Open Containers Initiative (OCI) Containers and Container Images. Podman provides a command-line interface (CLI) familiar to anyone who has used the Docker Container Engine. For more information on installing and using Podman, see Podman installation instructions.
Procedure
Use Podman to authenticate to
registry.redhat.ioby running the following command:$ podman login registry.redhat.io
Enter the user name and password:
Username: <username>
Password: <***********>
Copy the binary
PATHto enable system-wide use by running the following command:$ podman cp $(podman create registry.redhat.com/mta-toolkit/mta-mta-cli-rhel9:{ProductVersion}):/usr/local/bin/mta-cli ./WarningAlthough installation using Podman is possible, downloading and installing the
.zipfile is the preferred installation.
2.1.3. Installing the CLI for use with Docker on Windows (Developer Preview)
You can install the CLI for use with Docker on Windows. This is the required approach when migrating applications built with .NET framework 4.5 or later on Windows to cross-platform .NET 8.0.
Prerequisites
- A host with Windows 11+ 64-bit version 21H2 or higher.
- You have download the Docker Desktop for Windows installer. See Install Docker Desktop on Windows for additional details.
Procedure
- Open a PowerShell with Administrator privileges.
Ensure Hyper-V is installed and enabled:
PS C:\Users\<your_user_name>> Enable-WindowsOptionalFeature -Online `
   -FeatureName Microsoft-Hyper-V-All
PS C:\Users\<your_user_name>> Enable-WindowsOptionalFeature -Online `
   -FeatureName Containers
NoteYou may need to reboot Windows.
Install Docker Desktop on Windows.
-
Double-click
Docker_Desktop_Installer.exeto run the installer. By default, Docker Desktop is installed atC:\Program Files\Docker\Docker. - Deselect the Use WSL 2 instead of Hyper-V option on the Configuration page to ensure that Docker will run Windows containers as the backend instead of Linux containers.
-
Double-click
In PowerShell, create a folder for MTA:
PS C:\Users\<your_user_name>> mkdir C:\Users\<your_user_name>\MTA
Replace
<your_user_name>with the username for your home directory.Extract the
mta-7.1.1-cli-windows.zipfile to theMTAfolder:PS C:\Users\<your_user_name>> cd C:\Users\<your_user_name>\Downloads
Replace
<your_user_name>with the username for your home directory.PS C:\Users\<your_user_name>> Expand-Archive ` -Path "{ProductShortNameLower}-{ProductVersion}-cli-windows.zip" ` -DestinationPath "C:\Users\<your_user_name>\MTA"Replace
<your_user_name>with the username for your home directory.Ensure Docker is running Windows containers:
PS C:\Users\<your_user_name>> docker version
Client:
 Version:           27.0.3
 API version:       1.46
 Go version:        go1.21.11
 Git commit:        7d4bcd8
 Built:             Sat Jun 29 00:03:32 2024
 OS/Arch:           windows/amd64 1
 Context:           desktop-windows
Server: Docker Desktop 4.32.0 (157355)
 Engine:
  Version:          27.0.3
  API version:      1.46 (minimum version 1.24)
  Go version:       go1.21.11
  Git commit:       662f78c
  Built:            Sat Jun 29 00:02:13 2024
  OS/Arch:          windows/amd64 2
  Experimental:     false
Set the
PODMAN_BINenvironment variable to use Docker:PS C:\Users\<your_user_name>> $env:PODMAN_BIN="C:\Windows\system32\docker.exe"
Set the
DOTNET_PROVIDER_IMGenvironment variable to use the upstreamdotnet-external-provider:PS C:\Users\<your_user_name>> $env:DOTNET_PROVIDER_IMG="quay.io/konveyor/dotnet-external-provider:v0.5.0"
Set the
RUNNER_IMGenvironment variable to use the upstream image:PS C:\Users\<your_user_name>> $env:RUNNER_IMG="quay.io/konveyor/kantra:v0.5.0"
2.2. Installing MTA on a disconnected environment
On a connected device, first download and save the MTA binary. Then download and save the Podman images, the MTA CLI image and the provider image that you need.
Download the required MTA CLI binary from the Migration Toolkit for Applications Red Hat Developer page:
- CLI for Linux x86_64
- CLI for Linux aarch64
- CLI for MacOS x86_64
- CLI for MacOS aarch64
- CLI for Windows x86_64
- CLI for Windows aarch64
- On a connected device, download and save the images.
- Copy the binary to the disconnected device.
- In addition, you must save and import the associated container images by using Podman.
2.2.1. Downloading the Podman images
Prerequisites
- Podman installed. For more information, see Podman.
Procedure
Use Podman to authenticate to registry.redhat.io:
$ podman login registry.redhat.io
Enter your username and then your password for registry.redhat.io:
Username: <registry_service_account_username>
Password: <registry_service_account_password>
You should see the following output:
Login Succeeded!
Use Podman to pull the image from the registry:
$ podman pull registry.redhat.io/mta/mta-cli-rhel9:7.1.0
Use Podman to pull the provider image that you need from the registry:
For Java, run:
$ podman pull registry.redhat.io/mta/mta-java-external-provider-rhel9:7.1.0
For .NET, run:
$ podman pull registry.redhat.io/mta/mta-dotnet-external-provider-rhel9:7.1.0
Save the images:
$ podman save <image> -o <my_image.image>
-
Copy the
.imagefile and the binary onto a USB or directly to the file system of the disconnected device. On the disconnected device, run
$ podman load --input <my_image.image>
2.2.2. CLI known issues
Limitations with Podman on Microsoft Windows
The CLI is built and distributed with support for Microsoft Windows.
However, when running any container image based on Red Hat Enterprise Linux 9 (RHEL9) or Universal Base Image 9 (UBI9), the following error can be returned when starting the container:
Fatal glibc error: CPU does not support x86-64-v2
This error is caused because Red Hat Enterprise Linux 9 or Universal Base Image 9 container images must be run on a CPU architecture that supports x86-64-v2.
For more details, see (Running Red Hat Enterprise Linux 9 (RHEL) or Universal Base Image (UBI) 9 container images fail with "Fatal glibc error: CPU does not support x86-64-v2").
CLI runs the container runtime correctly. However, different container runtime configurations are not supported.
Although unsupported, you can run CLI with Docker instead of Podman, which would resolve this issue.
To achieve this, you replace the PODMAN_BIN path with the path to Docker.
For example, if you experience this issue, instead of issuing:
PODMAN_BIN=/usr/local/bin/docker mta-cli analyze
You replace PODMAN_BIN with the path to Docker:
<Docker Root Dir>=/usr/local/bin/docker mta-cli analyze
While this is not supported, it would allow you to explore CLI while you work to upgrade your hardware or move to hardware that supports x86_64-v2.
2.3. Running the CLI
You can run the Migration Toolkit for Applications (MTA) CLI against one or more applications.
Before MTA 7.1.0, if you wanted to run the CLI against multiple applications, you ran a series of --analyze commands, each against an application, and each generating a separate report. This option, which is still fully supported, is described in Running the MTA CLI against an application.
In MTA 7.1.0 and later, you can run the CLI against multiple applications by using the --bulk option, to generate a single report. This option, which is presented as a Developer Preview, is described in Running the MTA CLI against multiple applications and generating a single report (Developer Preview).
Running the CLI against one or more applications is a Developer Preview feature only. Developer Preview features are not supported by Red Hat in any way and are not functionally complete or production-ready. Do not use Developer Preview features for production or business-critical workloads. Developer Preview features provide early access to upcoming product features in advance of their possible inclusion in a Red Hat product offering, enabling customers to test functionality and provide feedback during the development process. These features might not have any documentation, are subject to change or removal at any time, and testing is limited. Red Hat might provide ways to submit feedback on Developer Preview features without an associated SLA.
2.3.1. Running the MTA CLI against an application
You can run the Migration Toolkit for Applications (MTA) CLI against an application.
Procedure
-
Open a terminal and navigate to the
<MTA_HOME>/directory. Run the
mta-cliscript, ormta-cli.exefor Windows, and specify the appropriate arguments:$ ./mta-cli analyze --input <path_to_input> \ --output <path_to_output> --source <source_name> --target <target_source> \-
--input: The application to be evaluated. -
--output: The output directory for the generated reports. -
--source: The source technology for the application migration. For example,weblogic. -
--target: The target technology for the application migration. For example,eap8.
-
- Access the report.
2.3.1.1. MTA command examples
Running MTA on an application archive
The following command analyzes the example EAR archive named jee-example-app-1.0.0.ear for migrating from JBoss EAP 5 to JBoss EAP 7:
$ <MTA_HOME>/mta-cli analyze \
    --input <path_to_jee-example-app-1.0.0.ear> \
    --output <path_to_report_output> --source eap5 --target eap7 \
Running MTA on source code
The following command analyzes the source code of an example application called customer-management for migrating to JBoss EAP 8.
$ <MTA_HOME>/mta-cli analyze --mode source-only --input <path_to_customer-management>
--output <path_to_report_output> --target eap8
Running cloud-readiness rules
The following command analyzes the example EAR archive named jee-example-app-1.0.0.ear for migrating to JBoss EAP 7. It also evaluates the archive for cloud readiness:
$ <MTA_HOME>/mta-cli analyze --input <path_to_jee-example-app-1.0.0.ear> \
    --output <path_to_report_output> \
    --target eap7
2.3.2. Running the MTA CLI against multiple applications and generating a single report (Developer Preview)
You can now run the Migration Toolkit for Applications (MTA) CLI against multiple applications and generate a combined report. This can save you time and give you a better idea of how to prepare a set of applications for migration.
This feature is currently a Developer Preview feature.
Running the CLI against one or more applications is a Developer Preview feature only. Developer Preview features are not supported by Red Hat in any way and are not functionally complete or production-ready. Do not use Developer Preview features for production or business-critical workloads. Developer Preview features provide early access to upcoming product features in advance of their possible inclusion in a Red Hat product offering, enabling customers to test functionality and provide feedback during the development process. These features might not have any documentation, are subject to change or removal at any time, and testing is limited. Red Hat might provide ways to submit feedback on Developer Preview features without an associated SLA.
Procedure
-
Open a terminal and navigate to the
<MTA_HOME>/directory. Run the
mta-cliscript, ormta-cli.exefor Windows, and specify the appropriate arguments, entering one input peranalyzecommand, but entering the same output directory for all inputs. For example, to analyze applications A, B, and C:Enter the following command for input A:
$ ./{mta-cli} analyze --bulk --input=<path_to_input_A> --output=<path_to_output_ABC> --source <source_A> --target <target_A>-
--input: The application to be evaluated. -
--output: The output directory for the generated reports. -
--source: The source technology for the application migration. For example,weblogic. -
--target: The target technology for the application migration. For example,eap8.
-
Enter the following command for input B:
$ ./{mta-cli} analyze --bulk --input=<path_to_input_B> --output=<path_to_output_ABC> --source <source_B> --target <target_B>Enter the following command for input C:
$ ./{mta-cli} analyze --bulk --input=<path_to_input_C> --output=<path_to_output_ABC> --source <source_C> --target <target_C>MTA generates a single report, listing all issues that need to be resolved before the applications can be migrated.
- Access the report.
2.3.3. Performing analysis using the command line
Analyze supports running source code and binary analysis by using the analyzer-lsp tool. analyzer-lsp evaluates the rules for the providers and determines rule matches.
To run analysis on application source code, run the following command:
mta-cli analyze --input=<path_to_source_code> --output=<path_to_output_directory>
All flags:
Analyze application source code

Usage:
  mta-cli analyze [flags]

Flags:

      --analyze-known-libraries           Analyze known open-source libraries.
      --context-lines (int)               Number of lines of source code to
                                          include in the output for each
                                          incident (default: `100`).
  -d, --dependency-folders (stringArray)  Directory for dependencies.
      --enable-default-rulesets           Run default rulesets with analysis
                                          (default: `true`).
  -h, --help                              Help for analyze.
      --http-proxy (string)               HTTP proxy string URL.
      --https-proxy (string)              HTTPS proxy string URL.
      --incident-selector (string)        An expression to select incidents
                                          based on custom variables.
                                          Example:
                                          !package=io.demo.config-utils
  -i, --input (string)                    Path to application source code or
                                          a binary.
      --jaeger-endpoint (string)          Jaeger endpoint to collect traces.
      --json-output                       Create analysis and dependency
                                          output as JSON.
      --list-sources                      List rules for available
                                          migration sources.
      --list-targets                      List rules for available
                                          migration targets.
  -l, --label-selector (string)           Run rules based on specified label
                                          selector expression.
      --maven-settings (string)           Path to the custom maven
                                          settings file to use.
      --overwrite                         Overwrite output directory.
      --skip-static-report                Do not generate the static report.
  -m, --mode (string)                     Analysis mode, must be one of
                                          `full` or `source-only`
                                          (default: `full`).
      --no-proxy (string)                 Proxy-excluded URLs
                                          (relevant only with proxy).
  -o, --output (string)                   Path to the directory for analysis
                                          output.
      --overwrite                         Overwrite output directory.
      --rules (stringArray)               Filename or directory containing
                                          rule files.
      --skip-static-report                Do not generate the static report.
  -s, --source (string)                   Source technology to consider
                                          for analysis.
                                          To specify multiple sources,
                                          repeat the parameter:
                                          `--source <source_1>
                                          --source <source_2>` etc.
  -t, --target (string)                   Target technology to consider
                                          for analysis.
                                          To specify multiple targets,
                                          repeat the parameter:
                                          `--target <target_1>
                                          --target <target_2>` etc.


Global Flags:
      --log-level uint32                  Log level (default: 4).
      --no-cleanup                        Do not cleanup temporary resources.
The list of flags above does not include the --bulk flag because this flag is only offered as part of a Developer Preview feature. That feature is described in Support for providing a single report when analyzing multiple applications on the CLI.
Usage example
- Get an example application to run analysis on.
List available target technologies.
mta-cli analyze --list-targets
Run an analysis with a specified target technology, for example
cloud-readiness.mta-cli analyze --input=<path-to/example-applications/example-1> --output=<path-to-output-dir> --target=cloud-readiness
Several analysis reports are created in your specified output path:
$ ls ./output/ -1
analysis.log
dependencies.yaml
dependency.log
output.yaml
static-report
-
output.yamlis the file that contains the issues report. -
static-reportcontains the static HTML report. -
dependencies.yamlcontains the dependencies report.
-
2.3.4. Performing transformation by using the command line
You can use transformation to perform the following actions:
-
Transform Java applications source code by using the
transform openrewritecommand. -
Convert XML rules to YAML rules by using the
transform rulescommand.
Performing transformation requires the container runtime to be configured. For more information, see Installing the CLI by using Podman.
Transform application source code or mta XML rules

Usage:
  mta-cli transform [flags]
  mta-cli transform [command]

Available Commands:
  openrewrite Transform application source code using OpenRewrite recipes
  rules       Convert XML rules to YAML

Flags:
  -h, --help   help for transform

Global Flags:
      --log-level uint32   log level (default 4)
      --no-cleanup         do not clean up temporary resources

Use "mta-cli transform [command] --help" for more information about a command.
2.3.4.1. OpenRewrite
The openrewrite subcommand allows running OpenRewrite recipes on source code.
Transform application source code using OpenRewrite recipes

Usage:
  mta-cli transform openrewrite [flags]

Flags:
  -g, --goal string     target goal (default "dryRun")
  -h, --help            help for openrewrite
  -i, --input string    path to application source code directory
  -l, --list-targets    list all available OpenRewrite recipes
  -s, --maven-settings string   path to a custom maven settings file to use
  -t, --target string   target openrewrite recipe to use. Run --list-targets to get a list of packaged recipes.

Global Flags:
      --log-level uint32   log level (default 4)
      --no-cleanup         do not clean up temporary resources
To run transform openrewrite on application source code, run the following command:
mta-cli transform openrewrite --input=<path/to/source/code> --target=<exactly_one_target_from_the_list>
You can only use a single target to run the transform overwrite command.
2.3.4.2. Rules
You can use the rules subcommand of the transform command to convert mta XML rules to analyzer-lsp YAML rules. To covert rules, the rules subcommand uses the windup-shim tool.
analyzer-lsp evaluates the rules for the providers and determines rule matches.
Convert XML rules to YAML

Usage:
  mta-cli transform rules [flags]

Flags:
  -h, --help                help for rules
  -i, --input stringArray   path to XML rule file(s) or directory
  -o, --output string       path to output directory

Global Flags:
      --log-level int   log level (default 5)
To run transform rules on application source code, run the following:
mta-cli transform rules --input=<path/to/xmlrules> --output=<path/to/output/dir>
Usage example
- Get an example application to transform source code.
View the available OpenRewrite recipes.
mta-cli transform openrewrite --list-targets
Run a recipe on the example application.
mta-cli transform openrewrite --input=<path-to/jakartaee-duke> --target=jakarta-imports
Inspect the
jakartaee-dukeapplication source code diff to see the transformation.
2.3.4.3. Available OpenRewrite recipes
| Migration path | Purpose | rewrite.configLocation | activeRecipes |
|---|---|---|---|
| Java EE to Jakarta EE |
Replace import of
Replace |
|
|
| Java EE to Jakarta EE | Rename bootstrapping files |
|
|
| Java EE to Jakarta EE |
Transform |
|
|
| Spring Boot to Quarkus |
Replace |
|
|
2.4. Accessing reports
When you run the Migration Toolkit for Applications, a report is generated in the <OUTPUT_REPORT_DIRECTORY> that you specify using the --output argument in the command line.
The output directory contains the following files and subdirectories:
<OUTPUT_REPORT_DIRECTORY>/
├── index.html          // Landing page for the report
├── <EXPORT_FILE>.csv   // Optional export of data in CSV format
├── archives/           // Archives extracted from the application
├── mavenized/          // Optional Maven project structure
├── reports/            // Generated HTML reports
├── stats/              // Performance statistics
Procedure
Obtain the path of the
index.htmlfile of your report from the output that appears after you run MTA:Report created: <OUTPUT_REPORT_DIRECTORY>/index.html Access it at this URL: file:///<OUTPUT_REPORT_DIRECTORY>/index.htmlOpen the
index.htmlfile by using a browser.The generated report is displayed.
2.5. Analyzing multi-language applications with CLI
Starting from MTA 7.1.0, you can run the application analysis on applications written in multiple languages. You can perform the analysis either of the following ways:
- Select the supported language provider to run the analysis for.
- Override the existing supported language provider with your own unsupported language provider and run the analysis for this unsupported provider.
2.5.1. Analyzing a multi-language application for the selected supported language provider
When analyzing a multi-language application with Migration Toolkit for Applications (MTA) CLI, you can explicitly set a supported language provider according to your application language to run the analysis for.
Prerequisites
- You are running the latest version of MTA CLI.
Procedure
List language providers supported for the analysis:
$ mta-cli analyze --list-providers
Run the application analysis for the selected language provider:
$ mta-cli analyze --input <_path_to_the_source_repository_> --output <_path_to_the_output_directory_> --provider <_language_provider_> --rules <_path_to_custom_rules_>
Note that if you do not set the
--provideroption, the analysis might fail because it detects unsupported providers. The analysis will complete without--provideronly if all discovered providers are supported.
2.5.2. Analyzing a multi-language application for an unsupported language provider
When analyzing a multi-language application with Migration Toolkit for Applications (MTA) CLI, you can run the analysis for an unsupported language provider. To do so, you must override an existing supported language provider with your own unsupported language provider by using the --override-provider-settings option.
You must create a configuration file for your unsupported language provider before overriding the supported provider.
Prerequisites
- You created a configuration file for your unsupported language provider.
Procedure
Override an existing supported language provider with your unsupported provider:
$ mta-cli analyze --provider-override <path_to_configuration_file> --output=<path_to_the_output_directory> --rules <path_to_custom_rules>
Chapter 3. Reviewing the reports
Use a browser to open the index.html file located in the report output directory. This opens a landing page that lists the applications that were processed. Each row contains a high-level overview of the story points, number of incidents, and technologies encountered in that application.
Figure 3.1. Application list
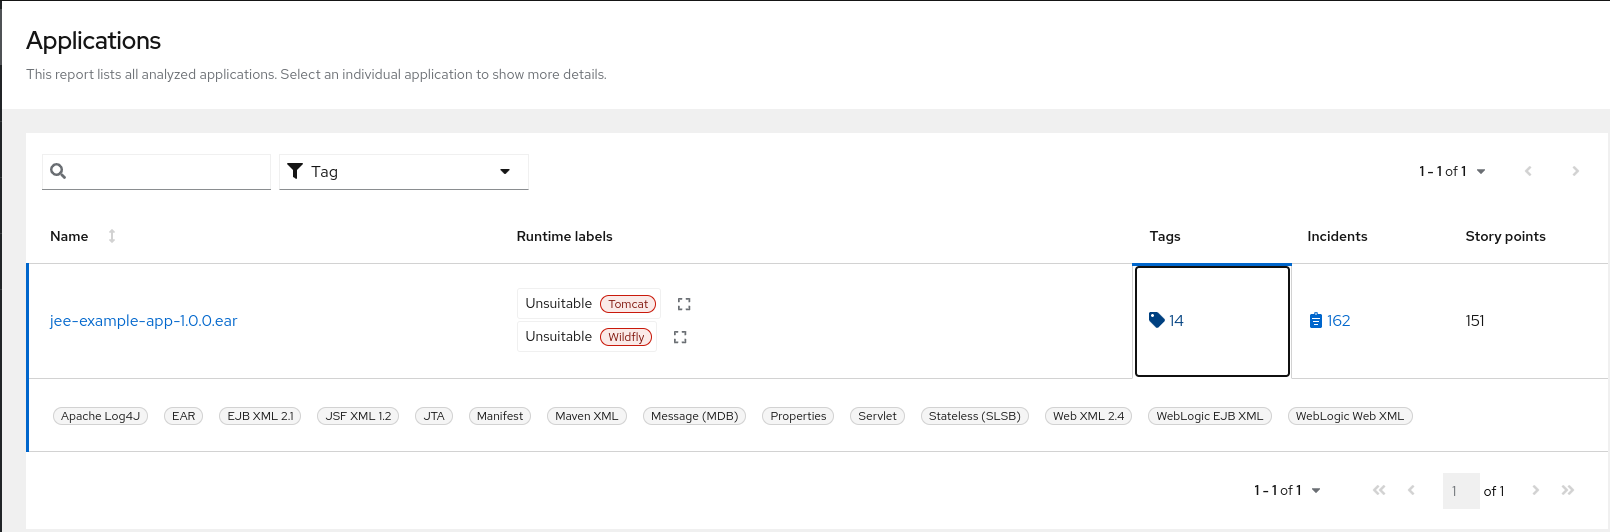
The incidents and estimated story points change as new rules are added to MTA. The values here may not match what you see when you test this application.
The following table lists all of the reports and pages that can be accessed from this main MTA landing page. Click the name of the application, jee-example-app-1.0.0.ear, to view the application report.
| Page | How to Access |
|---|---|
| Application | Click the name of the application. |
| Technologies report | Click the Technologies link at the top of the page. |
| Archives shared by multiple applications | Click the Archives shared by multiple applications link. Note that this link is only available when there are shared archives across multiple applications. |
| Rule providers execution overview | Click the Rule providers execution overview link at the bottom of the page. |
Note that if an application shares archives with other analyzed applications, you will see a breakdown of how many story points are from shared archives and how many are unique to this application.
Figure 3.2. Shared archives
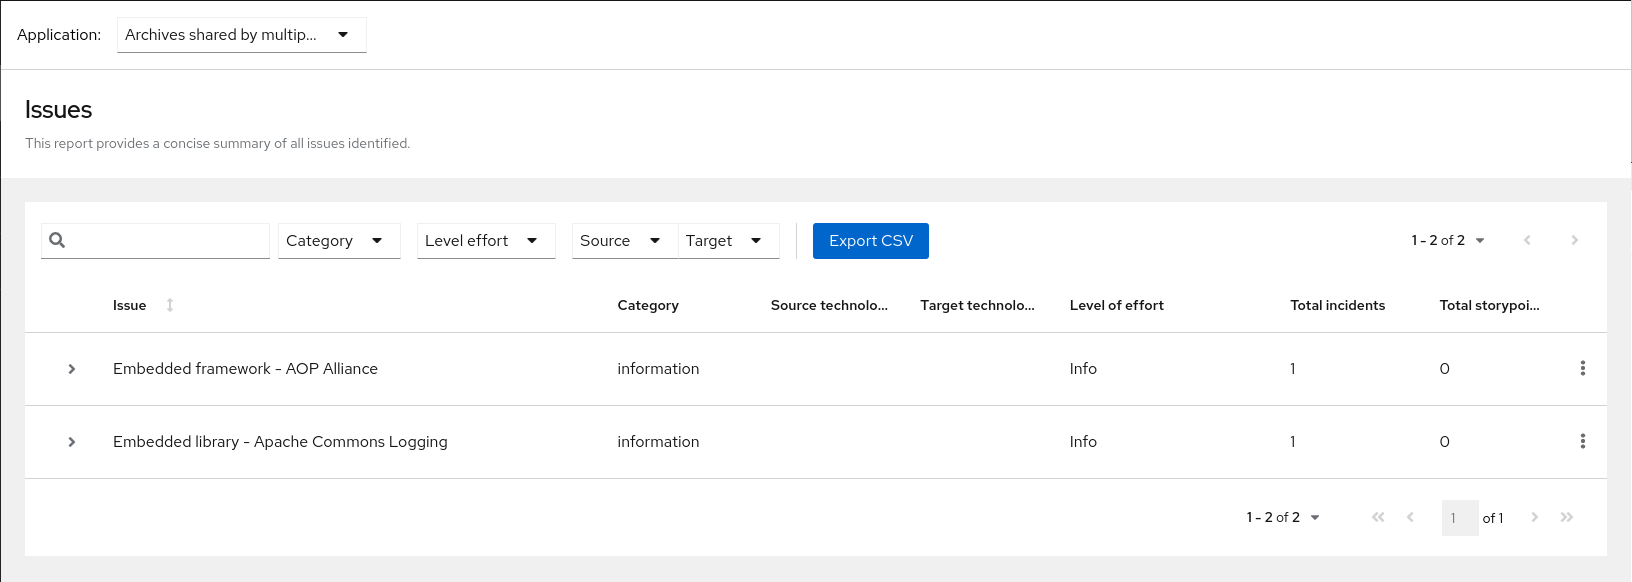
Information about the archives that are shared among applications can be found in the Archives Shared by Multiple Applications reports.
3.1. Application report
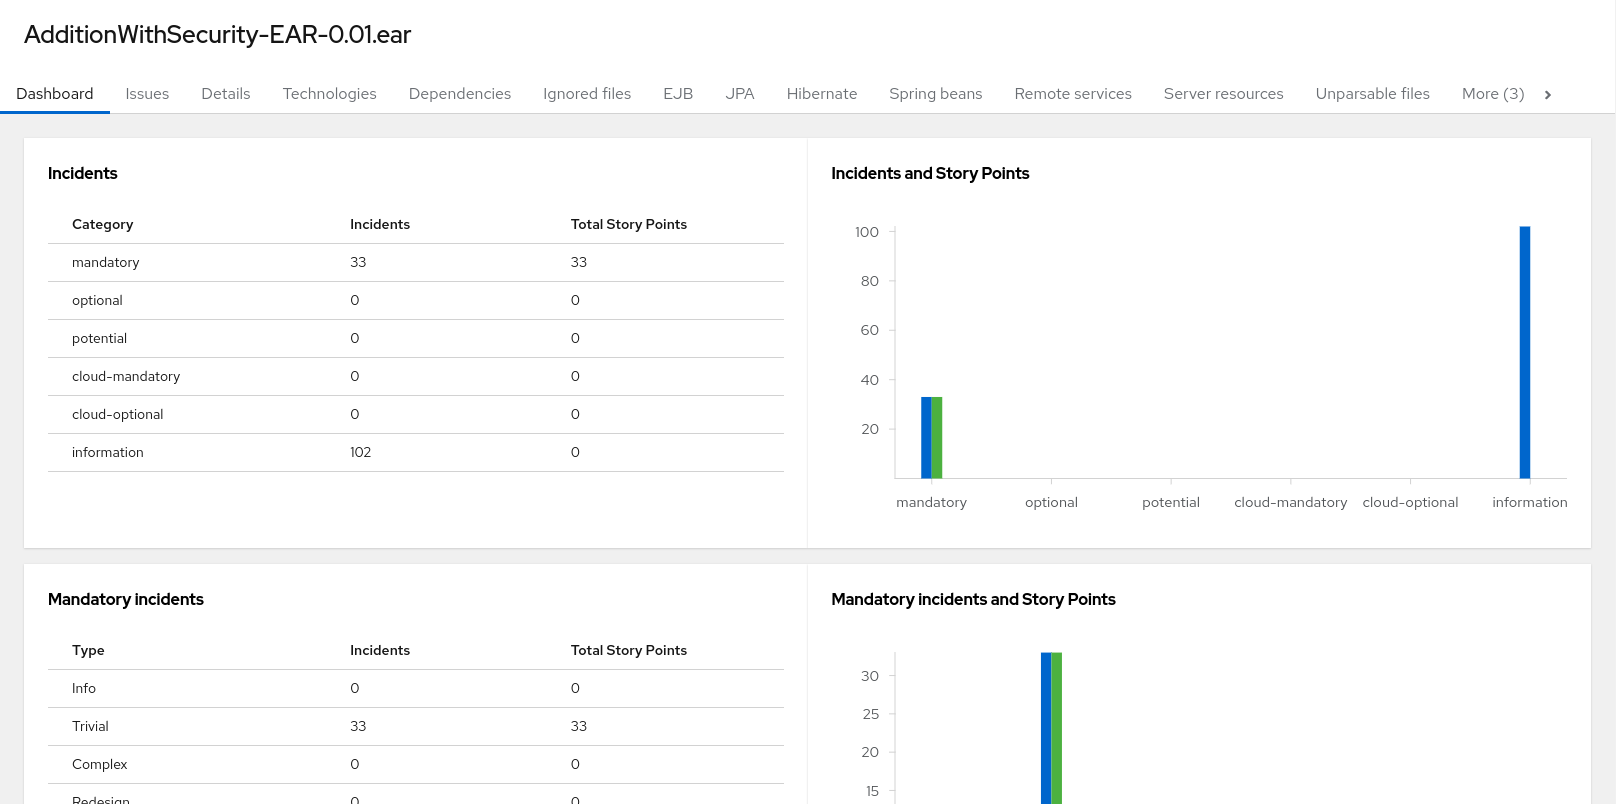
3.1.1. Dashboard
Access this report from the report landing page by clicking on the application name in the Application List.
The dashboard gives an overview of the entire application migration effort. It summarizes:
- The incidents and story points by category
- The incidents and story points by level of effort of the suggested changes
- The incidents by package
Figure 3.3. Dashboard
The top navigation bar lists the various reports that contain additional details about the migration of this application. Note that only those reports that are applicable to the current application will be available.
| Report | Description |
|---|---|
| Issues | Provides a concise summary of all issues that require attention. |
| Insights | Provides information about the technologies used in the application and their usage in the code. However, these Insights do not impact the migration. |
| Application details | Provides a detailed overview of all resources found within the application that may need attention during the migration. |
| Technologies | Displays all embedded libraries grouped by functionality, allowing you to quickly view the technologies used in each application. |
| Dependencies | Displays all Java-packaged dependencies found within the application. |
| Unparsable |
Shows all files that MTA could not parse in the expected format. For instance, a file with a |
| Remote services | Displays all remote services references that were found within the application. |
| EJBs | Contains a list of EJBs found within the application. |
| JBPM | Contains all of the JBPM-related resources that were discovered during analysis. |
| JPA | Contains details on all JPA-related resources that were found in the application. |
| Hibernate | Contains details on all Hibernate-related resources that were found in the application. |
| Server resources | Displays all server resources (for example, JNDI resources) in the input application. |
| Spring Beans | Contains a list of Spring Beans found during the analysis. |
| Hard-coded IP addresses | Provides a list of all hard-coded IP addresses that were found in the application. |
| Ignored files |
Lists the files found in the application that, based on certain rules and MTA configuration, were not processed. See the |
| About | Describes the current version of MTA and provides helpful links for further assistance. |
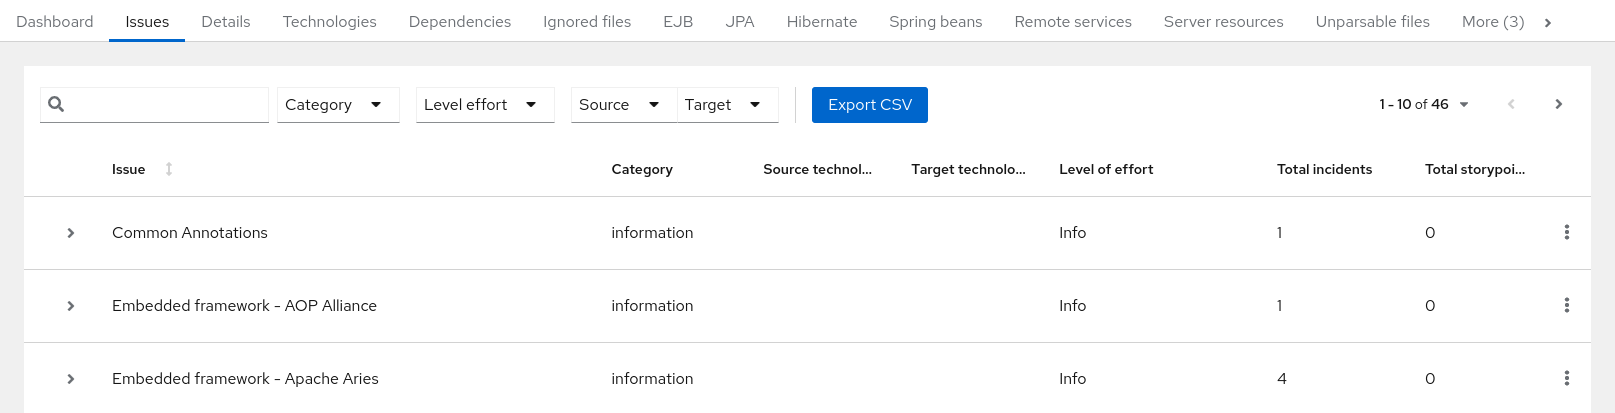
3.1.2. Issues report
Access this report from the dashboard by clicking the Issues link.
This report includes details about every issue that was raised by the selected migration paths. The following information is provided for each issue encountered:
- A title to summarize the issue.
- The total number of incidents, or times the issue was encountered.
- The rule story points to resolve a single instance of the issue.
- The estimated level of effort to resolve the issue.
- The total story points to resolve every instance encountered. This is calculated by multiplying the number of incidents found by the story points per incident.
Figure 3.4. Issues report
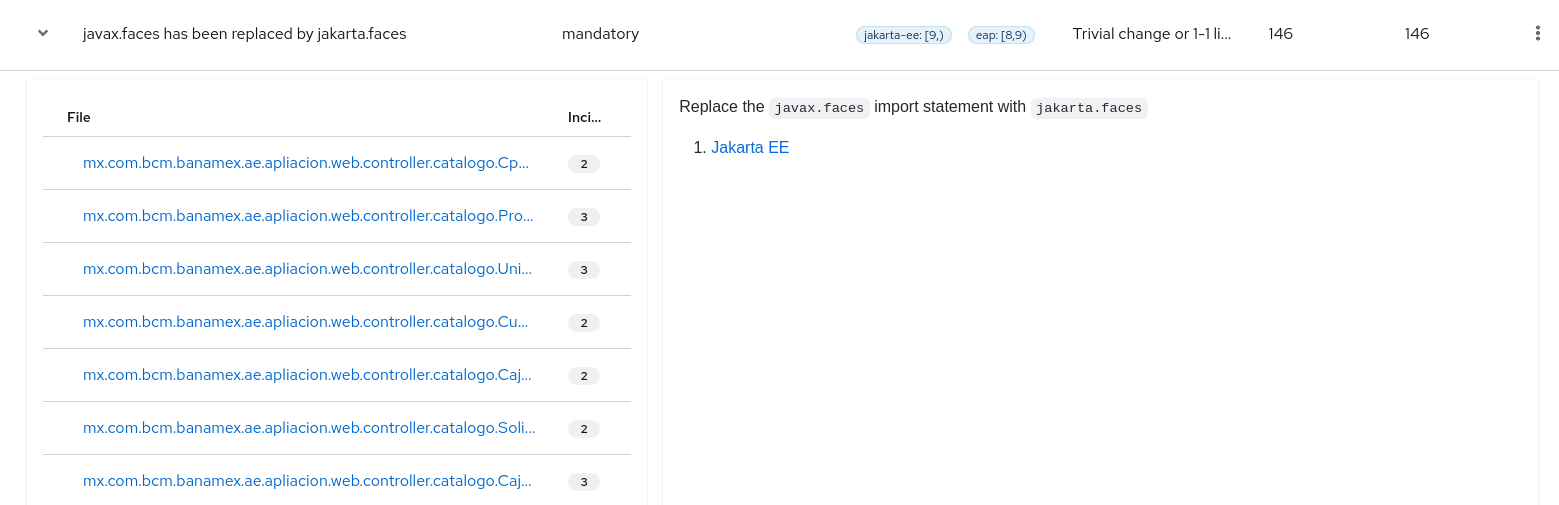
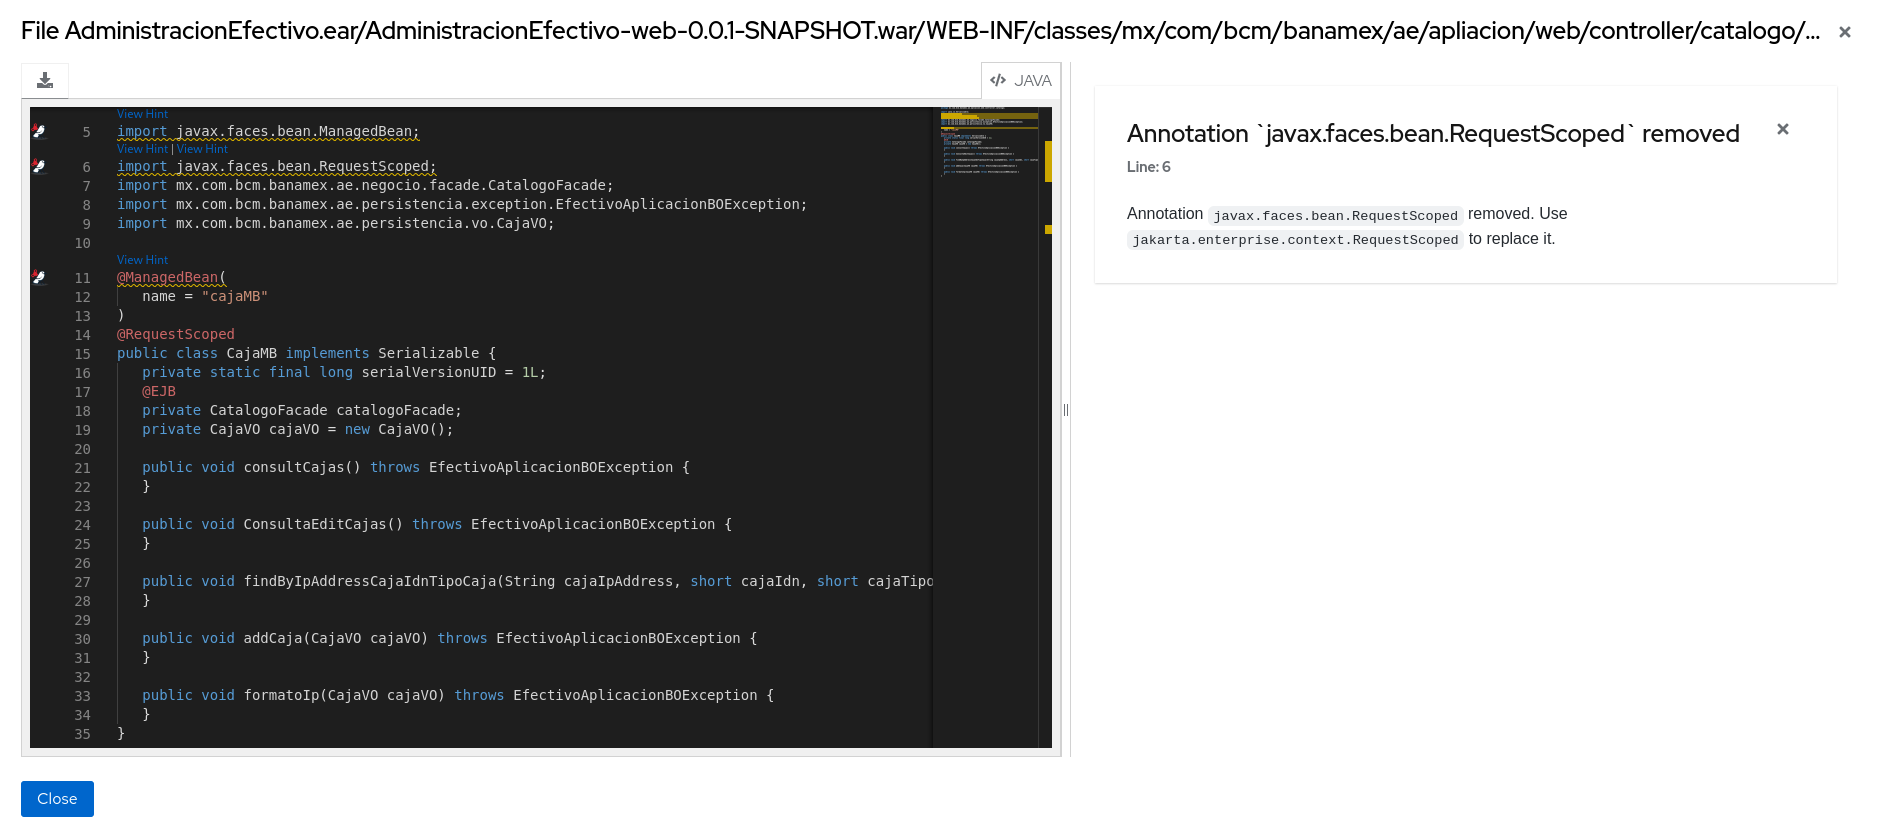
Each reported issue may be expanded, by clicking on the title, to obtain additional details. The following information is provided.
- A list of files where the incidents occurred, along with the number of incidents within each file. If the file is a Java source file, then clicking the filename will direct you to the corresponding Source report.
- A detailed description of the issue. This description outlines the problem, provides any known solutions, and references supporting documentation regarding either the issue or resolution.
- A direct link, entitled Show Rule, to the rule that generated the issue.
Figure 3.5. Expanded issue
Issues are sorted into four categories by default. Information on these categories is available at ask Category.
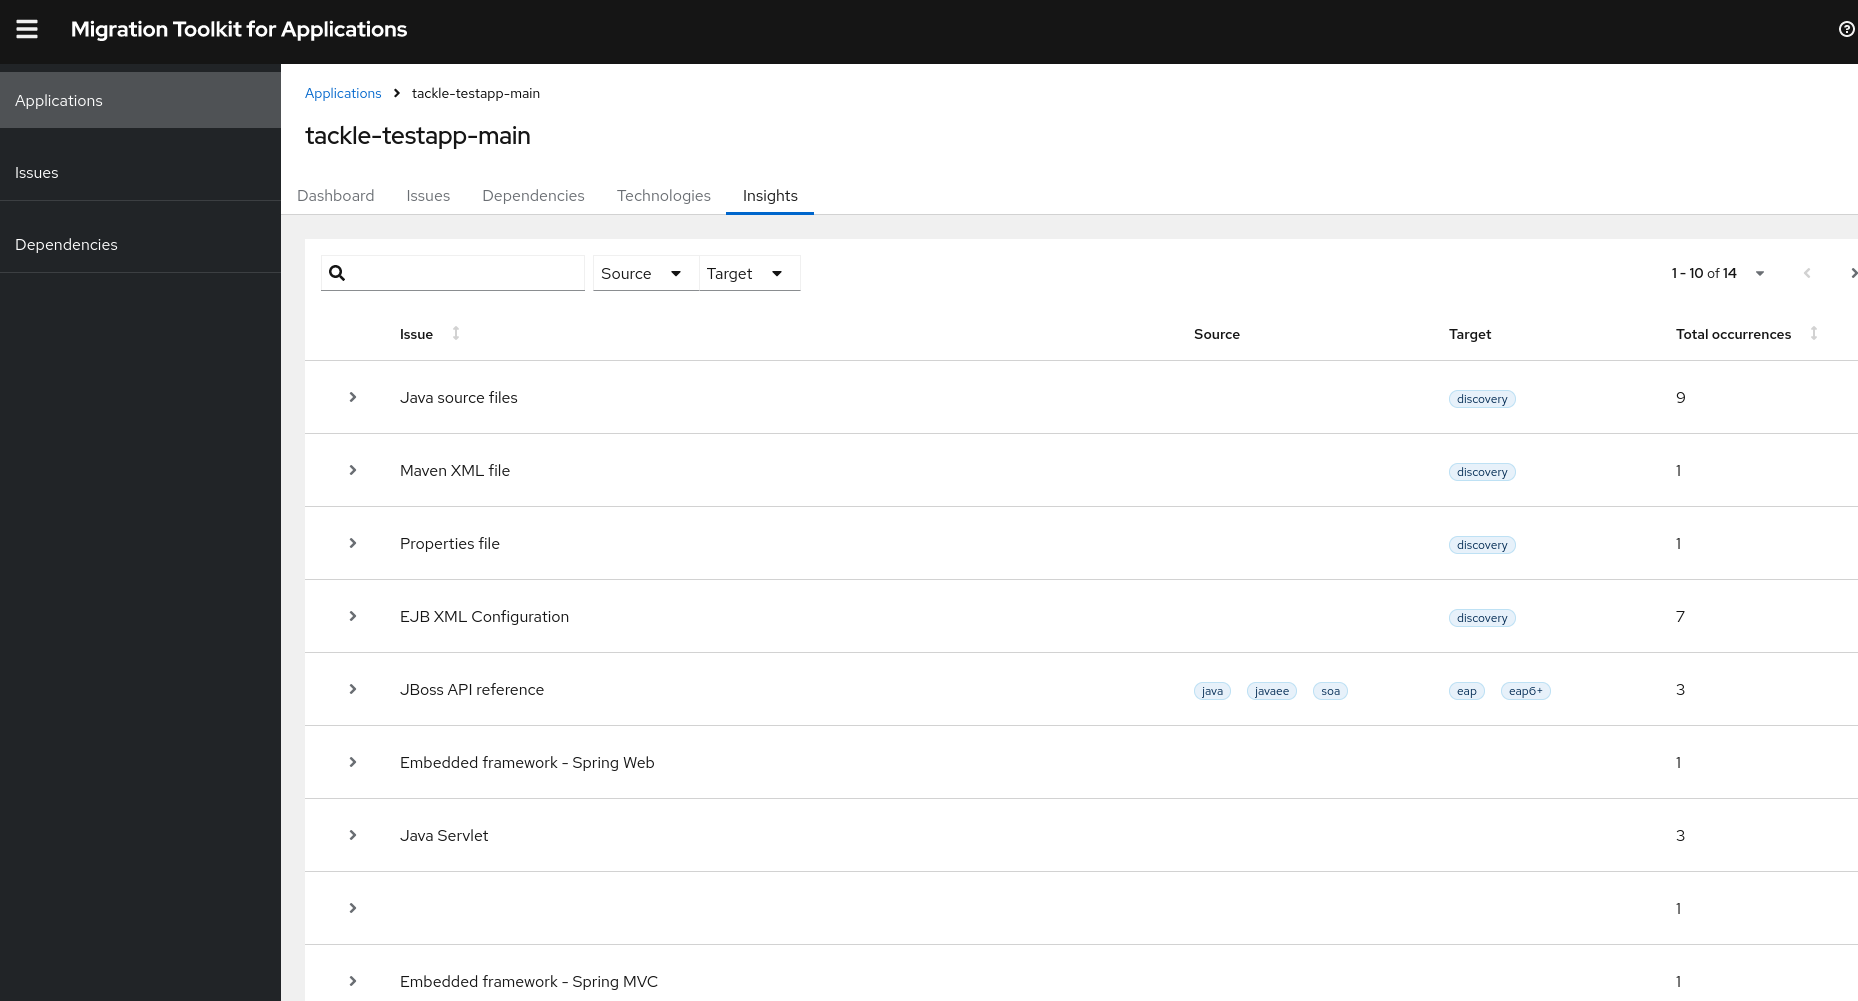
3.1.3. Insights
Insights is a Technology Preview feature only. Technology Preview features are not supported with Red Hat production service level agreements (SLAs) and might not be functionally complete. Red Hat does not recommend using them in production. These features provide early access to upcoming product features, enabling customers to test functionality and provide feedback during the development process.
For more information about the support scope of Red Hat Technology Preview features, see Technology Preview Features Support Scope.
Previously, a violation generated by a rule with zero effort was listed as an issue in the static report. This is now listed as an insight instead. Issues are generated by general rules, whereas string tags are generated by tagging rules. String tags indicate the presence of a technology but do not show the code location. With the introduction of Insights, you can see the technology used in the application along with its usage in the code.
For example, a rule searching for deprecated API usage in the code that does not impact the current migration but can be tracked and fixed when needed in the future.
Unlike issues, insights do not need to be fixed for a successful migration. They are generated by any rule that doesn’t have a positive effort value and category assigned. They might have a message and tag.
Insights are generated automatically if applicable or present. Currently, MTA supports generating Insights when application anaylsis is done using CLI.
You can view Insights under the Insights tab in the static report.
Example: Insights generated by a tagging rule with undefined effort
- customVariables: []
  description: Embedded library - Apache Wicket
  labels:
  - konveyor.io/include=always
  links: []
  ruleID: mvc-01000
  tag:
  - Apache Wicket
  - Embedded library - Apache Wicket
  when:
    builtin.file:
      pattern: .*wicket.*\.jar
Example: Insights generated by a non-tagging rule with zero effort
- category: potential
  customVariables: []
  description: RESTful Web Services @Context annotation has been deprecated
  effort: 0
  message: Future versions of this API will no longer support `@Context` and related
    types such as `ContextResolver`.
  ruleID: jakarta-ws-rs-00001
  when:
    java.referenced:
      location: ANNOTATION
      pattern: jakarta.ws.rs.core.Context
3.1.4. Application details report
Access this report from the dashboard by clicking the Application Details link.
The report lists the story points, the Java incidents by package, and a count of the occurrences of the technologies found in the application. Next is a display of application messages generated during the migration process. Finally, there is a breakdown of this information for each archive analyzed during the process.
Figure 3.6. Application Details report
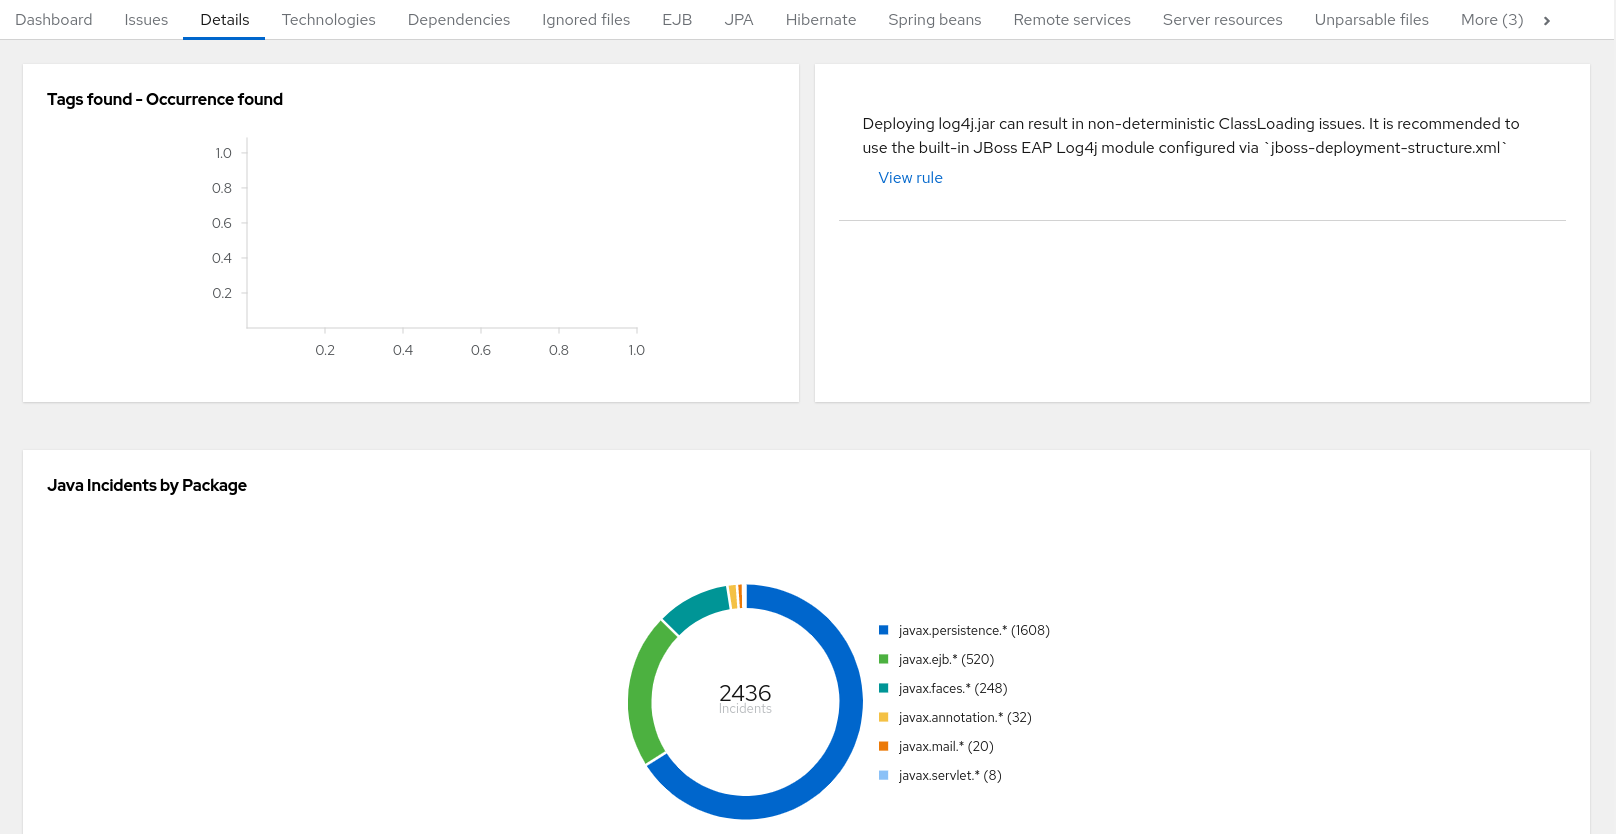
Expand the jee-example-app-1.0.0.ear/jee-example-services.jar to review the story points, Java incidents by package, and a count of the occurrences of the technologies found in this archive. This summary begins with a total of the story points assigned to its migration, followed by a table detailing the changes required for each file in the archive. The report contains the following columns.
| Column Name | Description |
|---|---|
| Name | The name of the file being analyzed. |
| Technology | The type of file being analyzed, for example, Decompiled Java File or Properties. |
| Issues | Warnings about areas of code that need review or changes. |
| Story Points | Level of effort required to migrate the file. |
Note that if an archive is duplicated several times in an application, it will be listed just once in the report and will be tagged with [Included multiple times].
Figure 3.7. Duplicate archive in an application
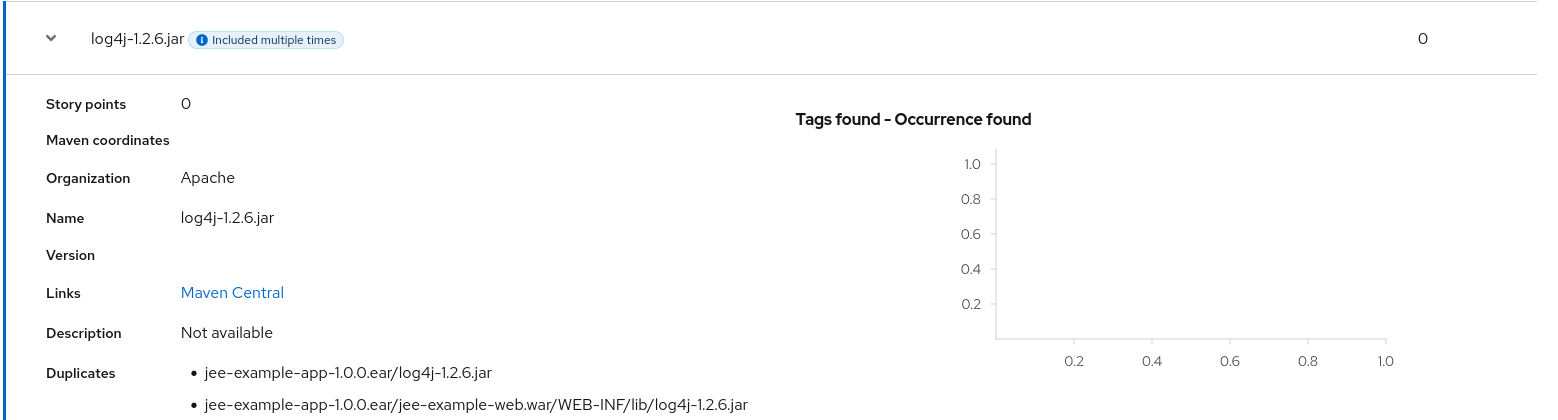
The story points for archives that are duplicated within an application will be counted only once in the total story point count for that application.
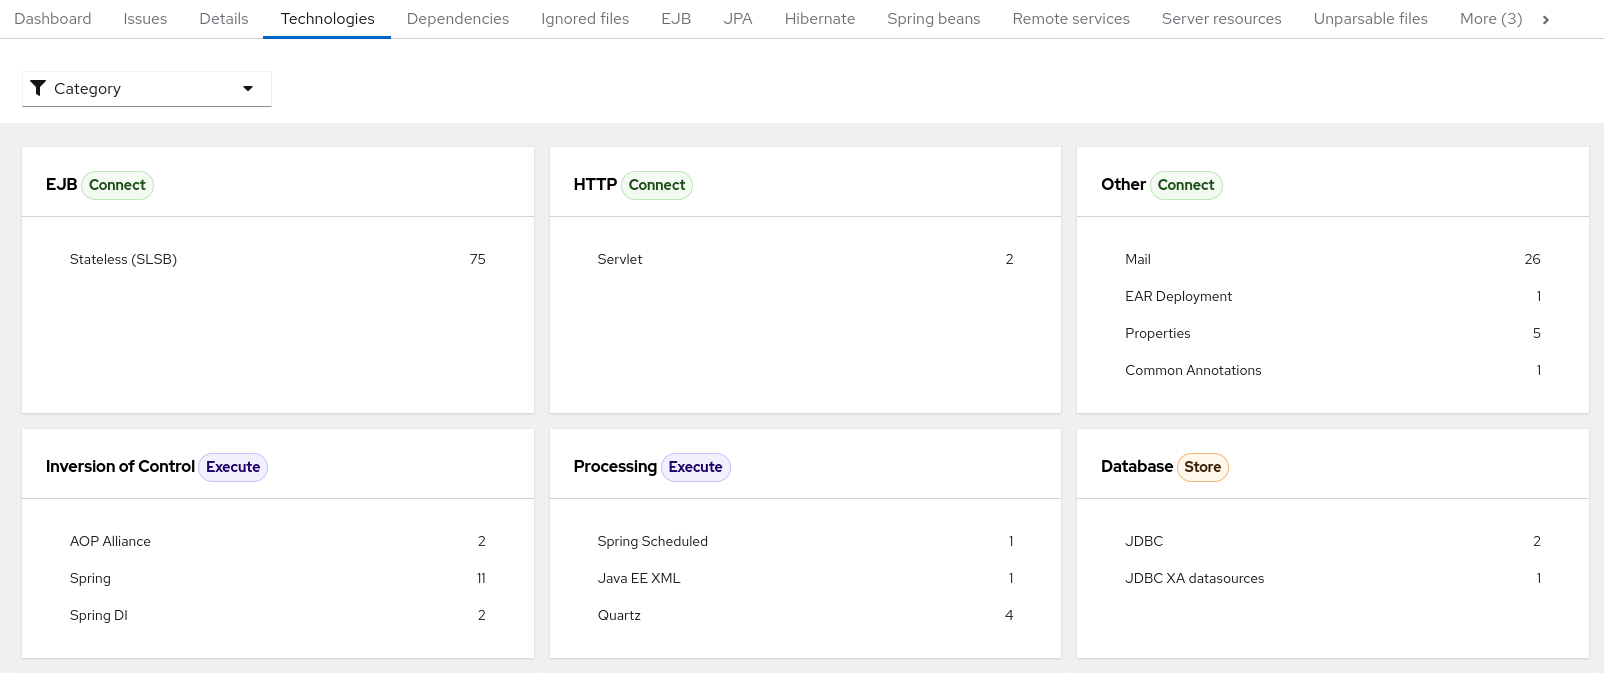
3.1.5. Technologies report
Access this report from the dashboard by clicking the Technologies link.
The report lists the occurrences of technologies, grouped by function, in the analyzed application. It is an overview of the technologies found in the application, and is designed to assist users in quickly understanding each application’s purpose.
The image below shows the technologies used in the jee-example-app.
Figure 3.8. Technologies in an application
3.1.6. Source report
The Source report displays the migration issues in the context of the source file in which they were discovered.
Figure 3.9. Source report
3.2. Technologies report
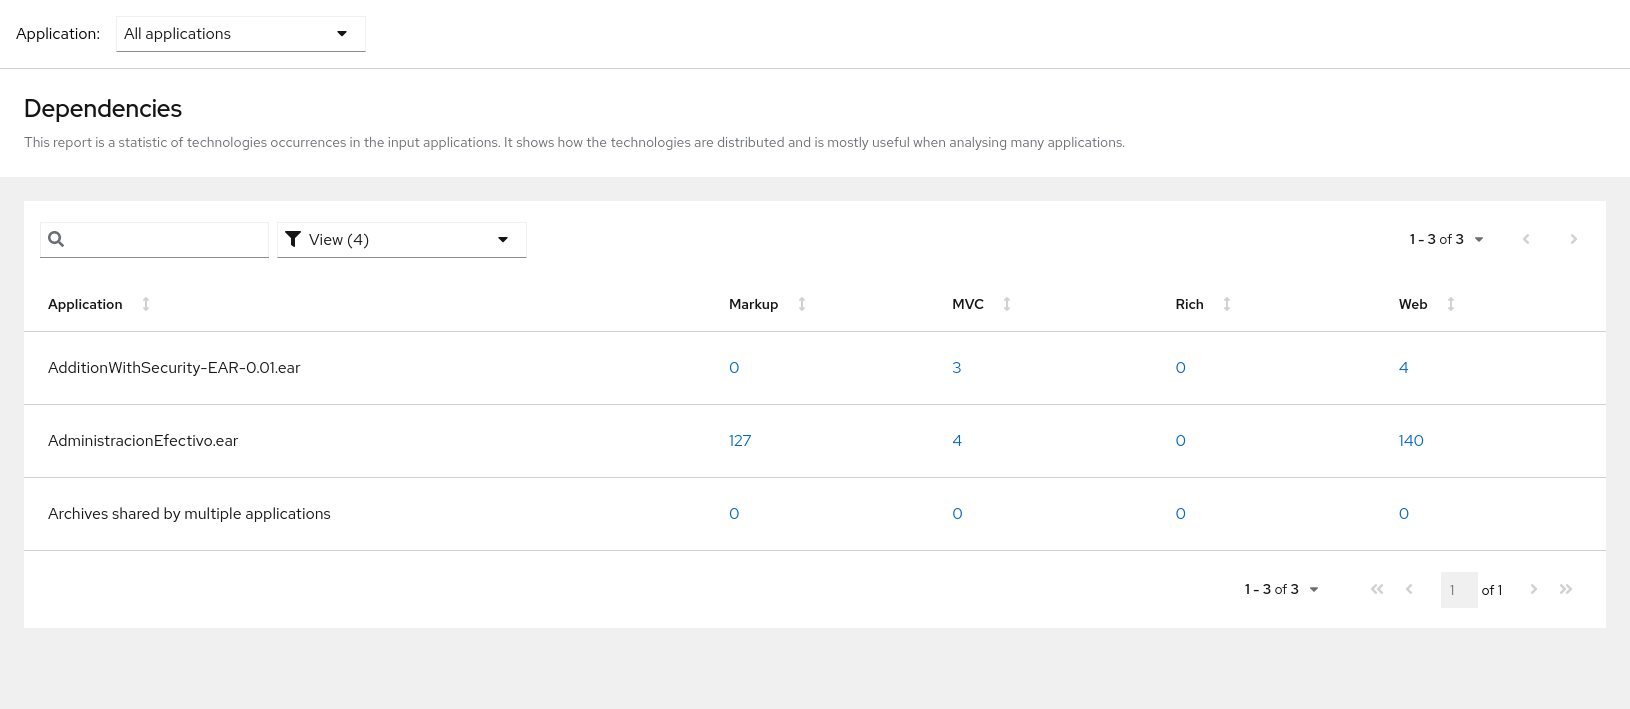
Access this report from the report landing page by clicking the Technologies link.
This report provides an aggregate listing of the technologies used, grouped by function, for the analyzed applications. It shows how the technologies are distributed, and is typically reviewed after analyzing a large number of applications to group the applications and identify patterns. It also shows the size, number of libraries, and story point totals of each application.
Clicking any of the headers, such as Markup, sorts the results in descending order. Selecting the same header again will resort the results in ascending order. The currently selected header is identified in bold, next to a directional arrow, indicating the direction of the sort.
Figure 3.10. Technologies used across multiple applications
Chapter 4. Optimizing MTA performance
MTA performance depends on a number of factors, including hardware configuration, the number and types of files in the application, the size and number of applications to be evaluated, and whether the application contains source or compiled code. For example, a file that is larger than 10 MB may need a lot of time to process.
In general, MTA spends about 40% of the time decompiling classes, 40% of the time executing rules, and the remainder of the time processing other tasks and generating reports. This section describes what you can do to improve the performance of MTA.
4.1. Deploying and running the application
Try these suggestions first before upgrading hardware.
- If possible, run MTA against the source code instead of the archives. This eliminates the need to decompile additional JARs and archives.
- Increase your ulimit when analyzing large applications. See this Red Hat Knowledgebase article for instructions on how to do this for Red Hat Enterprise Linux.
- If you have access to a server that has better resources than your laptop or desktop machine, you may want to consider running MTA on that server.
4.2. Upgrading hardware
If the application and command-line suggestions above do not improve performance, you may need to upgrade your hardware.
- If you have access to a server that has better resources than your laptop/desktop, then you may want to consider running MTA on that server.
- Very large applications that require decompilation have large memory requirements. 8 GB RAM is recommended. This allows 3 - 4 GB RAM for use by the JVM.
- An upgrade from a single or dual-core to a quad-core CPU processor provides better performance.
- Disk space and fragmentation can impact performance. A fast disk, especially a solid-state drive (SSD), with greater than 4 GB of defragmented disk space should improve performance.
Appendix A. Reference material
A.1. About MTA command-line arguments
The following is a detailed description of the available MTA command line arguments.
To run the MTA command without prompting, for example when executing from a script, you must use the following arguments:
-
--overwrite -
--input -
--target
Example A.1. MTA CLI arguments
| Command | Type | Description |
|---|---|---|
|
| Flag to analyze known open-source libraries. | |
|
| Flag for running multiple analyze commands in bulk, which result in a combined static report. | |
|
| Integer |
Flag to define the number of lines of source code to include in the output for each incident (default: |
|
| String Array | Flag for the directory for dependencies. |
|
| Boolean |
Flag to run default rulesets with analysis (default: |
|
| Flag to output help for analyze | |
|
| String | Flag for Hyper Text Transfer Protocol (HTTP) proxy string URL |
|
| String | Flag for Hypertext Transfer Protocol Secure (HTTPS) proxy string URL |
|
| String |
Flag to select incidents based on custom variables, for example, |
|
| String | Flag for the path to application source code or a binary. For more details, see Specifying the input. |
|
| String | Flag for the jaeger endpoint to collect traces. |
|
| Flag to create analysis and dependency output as JSON. | |
|
| String | Flag to run rules based on a specified label selector expression. |
|
| Flag to list available supported providers. | |
|
| Flag to list rules for available migration sources. | |
|
| Flag to list rules for available migration targets. | |
|
| string | Flag path to a custom Maven settings file to use |
|
| String |
Flag for analysis mode, this must be one of |
|
| String | Flag to excluded URLs from passing through any proxy (relevant only with proxy) |
|
| String | Flag for the path to the directory for analysis output. For more details, see Specifying the output directory. |
|
| String | Flag to override the provider settings. The analysis pod runs on the host network, and no providers are started. |
|
|
Flag to overwrite the output directory. If you do not specify this argument and the | |
|
| String Array | Flag to specify which provider or providers to run. |
|
| String Array |
Flag to specify the filename or directory containing rule files. Use multiple times for additional rules, for example, |
|
| Local flag to run analysis directly on local system without containers (for Java and Maven) | |
|
| Flag to not generate static report. | |
|
| String Array |
Flag for the source technology to consider for analysis. Use multiple times for additional sources, for example, |
|
| String Array |
Flag for the target technology to consider for analysis. Use multiple times for additional targets, for example, |
A.1.1. Specifying the input
A space-delimited list of the path to the file or directory containing one or more applications to be analyzed. This argument is required.
Usage
--input <INPUT_ARCHIVE_OR_DIRECTORY> [...]
Depending on whether the input file type provided to the --input argument is a file or directory, it will be evaluated as follows depending on the additional arguments provided.
- Directory
-
--sourceMode: The directory is evaluated as a single application.
-
- File
-
--sourceMode: The file is evaluated as a compressed project.
-
A.1.2. Specifying the output directory
Specify the path to the directory to output the report information generated by MTA.
Usage
--output <OUTPUT_REPORT_DIRECTORY>
-
If omitted, the report will be generated in an
<INPUT_ARCHIVE_OR_DIRECTORY>.reportdirectory. If the output directory exists, you will be prompted with the following question with a default answer of
N:Overwrite all contents of "/home/username/<OUTPUT_REPORT_DIRECTORY>" (anything already in the directory will be deleted)? [y,N]
However, if you specify the --overwrite argument, MTA will proceed to delete and recreate the directory. See the description of this argument for more information.
A.1.3. Setting the source technology
A space-delimited list of one or more source technologies, servers, platforms, or frameworks to migrate from. You can use this argument, in conjunction with the --target argument, to determine which rulesets are used. Use the --listSourceTechnologies argument to list all available sources.
Usage
--source <SOURCE_1> <SOURCE_2>
The --source argument now provides version support, which follows the Maven version range syntax. This instructs MTA to only run the rulesets matching the specified versions, for example, --source eap:5.
When migrating to JBoss EAP, be sure to specify the version, for example, eap:6. Specifying only eap will run rulesets for all versions of JBoss EAP, including those not relevant to your migration path.
See Supported migration paths in Introduction to the Migration Toolkit for Applications for the appropriate JBoss EAP version.
A.1.4. Setting the target technology
A space-delimited list of one or more target technologies, servers, platforms, or frameworks to migrate to. You can use this argument, in conjunction with the --source argument, to determine which rulesets are used. If you do not specify this option, you are prompted to select a target. Use the --listTargetTechnologies argument to list all available targets.
Usage
--target <TARGET_1> <TARGET_2>
The --target argument now provides version support, which follows the Maven version range syntax. This instructs MTA to only run the rulesets matching the specified versions, for example, --target eap:7.
A.2. Supported technology tags
The following technology tags are supported in MTA 7.1.1:
- 0MQ Client
- 3scale
- Acegi Security
- AcrIS Security
- ActiveMQ library
- Airframe
- Airlift Log Manager
- AKKA JTA
- Akka Testkit
- Amazon SQS Client
- AMQP Client
- Anakia
- AngularFaces
- ANTLR StringTemplate
- AOP Alliance
- Apache Accumulo Client
- Apache Aries
- Apache Commons JCS
- Apache Commons Validator
- Apache Flume
- Apache Geronimo
- Apache Hadoop
- Apache HBase Client
- Apache Ignite
- Apache Karaf
- Apache Mahout
- Apache Meecrowave JTA
- Apache Sirona JTA
- Apache Synapse
- Apache Tapestry
- Apiman
- Applet
- Arquillian
- AspectJ
- Atomikos JTA
- Avalon Logkit
- Axion Driver
- Axis
- Axis2
- BabbageFaces
- Bean Validation
- BeanInject
- Blaze
- Blitz4j
- BootsFaces
- Bouncy Castle
- ButterFaces
- Cache API
- Cactus
- Camel
- Camel Messaging Client
- Camunda
- Cassandra Client
- CDI
- Cfg Engine
- Chunk Templates
- Cloudera
- Coherence
- Common Annotations
- Composite Logging
- Composite Logging JCL
- Concordion
- CSS
- Cucumber
- Dagger
- DbUnit
- Demoiselle JTA
- Derby Driver
- Drools
- DVSL
- Dynacache
- EAR Deployment
- Easy Rules
- EasyMock
- Eclipse RCP
- EclipseLink
- Ehcache
- EJB
- EJB XML
- Elasticsearch
- Entity Bean
- EtlUnit
- Eureka
- Everit JTA
- Evo JTA
- Feign
- File system Logging
- FormLayoutMaker
- FreeMarker
- Geronimo JTA
- GFC Logging
- GIN
- GlassFish JTA
- Google Guice
- Grails
- Grapht DI
- Guava Testing
- GWT
- H2 Driver
- Hamcrest
- Handlebars
- HavaRunner
- Hazelcast
- Hdiv
- Hibernate
- Hibernate Cfg
- Hibernate Mapping
- Hibernate OGM
- HighFaces
- HornetQ Client
- HSQLDB Driver
- HTTP Client
- HttpUnit
- ICEfaces
- Ickenham
- Ignite JTA
- Ikasan
- iLog
- Infinispan
- Injekt for Kotlin
- Iroh
- Istio
- Jamon
- Jasypt
- Java EE Batch
- Java EE Batch API
- Java EE JACC
- Java EE JAXB
- Java EE JAXR
- Java EE JSON-P
- Java Transaction API
- JavaFX
- JavaScript
- Javax Inject
- JAX-RS
- JAX-WS
- JayWire
- JBehave
- JBoss Cache
- JBoss EJB XML
- JBoss logging
- JBoss Transactions
- JBoss Web XML
- JBossMQ Client
- JBPM
- JCA
- Jcabi Log
- JCache
- JCunit
- JDBC
- JDBC datasources
- JDBC XA datasources
- Jersey
- Jetbrick Template
- Jetty
- JFreeChart
- JFunk
- JGoodies
- JMock
- JMockit
- JMS Connection Factory
- JMS Queue
- JMS Topic
- JMustache
- JNA
- JNI
- JNLP
- JPA entities
- JPA Matchers
- JPA named queries
- JPA XML
- JSecurity
- JSF
- JSF Page
- JSilver
- JSON-B
- JSP Page
- JSTL
- JTA
- Jukito
- JUnit
- Ka DI
- Keyczar
- Kibana
- KLogger
- Kodein
- Kotlin Logging
- KouInject
- KumuluzEE JTA
- LevelDB Client
- Liferay
- LiferayFaces
- Lift JTA
- Log.io
- Log4J
- Log4s
- Logback
- Logging Utils
- Logstash
- Lumberjack
- Macros
- Magicgrouplayout
- Management EJB
- MapR
- MckoiSQLDB Driver
- Memcached
- Message (MDB)
- Micro DI
- Micrometer
- Microsoft SQL Driver
- MiGLayout
- MinLog
- Mixer
- Mockito
- MongoDB Client
- Monolog
- Morphia
- MRules
- Mule
- Mule Functional Test Framework
- MultithreadedTC
- Mycontainer JTA
- MyFaces
- MySQL Driver
- Narayana Arjuna
- Needle
- Neo4j
- NLOG4J
- Nuxeo JTA/JCA
- OACC
- OAUTH
- OCPsoft Logging Utils
- OmniFaces
- OpenFaces
- OpenPojo
- OpenSAML
- OpenWS
- OPS4J Pax Logging Service
- Oracle ADF
- Oracle DB Driver
- Oracle Forms
- Orion EJB XML
- Orion Web XML
- Oscache
- OTR4J
- OW2 JTA
- OW2 Log Util
- OWASP CSRF Guard
- OWASP ESAPI
- Peaberry
- Pega
- Persistence units
- Petals EIP
- PicketBox
- PicketLink
- PicoContainer
- Play
- Play Test
- Plexus Container
- Polyforms DI
- Portlet
- PostgreSQL Driver
- PowerMock
- PrimeFaces
- Properties
- Qpid Client
- RabbitMQ Client
- RandomizedTesting Runner
- Resource Adapter
- REST Assured
- Restito
- RichFaces
- RMI
- RocketMQ Client
- Rythm Template Engine
- SAML
- Santuario
- Scalate
- Scaldi
- Scribe
- Seam
- Security Realm
- ServiceMix
- Servlet
- ShiftOne
- Shiro
- Silk DI
- SLF4J
- Snippetory Template Engine
- SNMP4J
- Socket handler logging
- Spark
- Specsy
- Spock
- Spring
- Spring Batch
- Spring Boot
- Spring Boot Actuator
- Spring Boot Cache
- Spring Boot Flo
- Spring Cloud Config
- Spring Cloud Function
- Spring Data
- Spring Data JPA
- spring DI
- Spring Integration
- Spring JMX
- Spring Messaging Client
- Spring MVC
- Spring Properties
- Spring Scheduled
- Spring Security
- Spring Shell
- Spring Test
- Spring Transactions
- Spring Web
- SQLite Driver
- SSL
- Standard Widget Toolkit (SWT)
- Stateful (SFSB)
- Stateless (SLSB)
- Sticky Configured
- Stripes
- Struts
- SubCut
- Swagger
- SwarmCache
- Swing
- SwitchYard
- Syringe
- Talend ESB
- Teiid
- TensorFlow
- Test Interface
- TestNG
- Thymeleaf
- TieFaces
- tinylog
- Tomcat
- Tornado Inject
- Trimou
- Trunk JGuard
- Twirl
- Twitter Util Logging
- UberFire
- Unirest
- Unitils
- Vaadin
- Velocity
- Vlad
- Water Template Engine
- Web Services Metadata
- Web Session
- Web XML File
- WebLogic Web XML
- Webmacro
- WebSocket
- WebSphere EJB
- WebSphere EJB Ext
- WebSphere Web XML
- WebSphere WS Binding
- WebSphere WS Extension
- Weka
- Weld
- WF Core JTA
- Wicket
- Winter
- WSDL
- WSO2
- WSS4J
- XACML
- XFire
- XMLUnit
- Zbus Client
- Zipkin
A.3. About rule story points
A.3.1. What are story points?
Story points are an abstract metric commonly used in Agile software development to estimate the level of effort needed to implement a feature or change.
The Migration Toolkit for Applications uses story points to express the level of effort needed to migrate particular application constructs, and the application as a whole. It does not necessarily translate to man-hours, but the value should be consistent across tasks.
A.3.2. How story points are estimated in rules
Estimating the level of effort for the story points for a rule can be tricky. The following are the general guidelines MTA uses when estimating the level of effort required for a rule.
| Level of Effort | Story Points | Description |
|---|---|---|
| Information | 0 | An informational warning with very low or no priority for migration. |
| Trivial | 1 | The migration is a trivial change or a simple library swap with no or minimal API changes. |
| Complex | 3 | The changes required for the migration task are complex, but have a documented solution. |
| Redesign | 5 | The migration task requires a redesign or a complete library change, with significant API changes. |
| Rearchitecture | 7 | The migration requires a complete rearchitecture of the component or subsystem. |
| Unknown | 13 | The migration solution is not known and may need a complete rewrite. |
A.3.3. Task category
In addition to the level of effort, you can categorize migration tasks to indicate the severity of the task. The following categories are used to group issues to help prioritize the migration effort.
- Mandatory
- The task must be completed for a successful migration. If the changes are not made, the resulting application will not build or run successfully. Examples include replacement of proprietary APIs that are not supported in the target platform.
- Optional
- If the migration task is not completed, the application should work, but the results may not be optimal. If the change is not made at the time of migration, it is recommended to put it on the schedule soon after your migration is completed.
- Potential
- The task should be examined during the migration process, but there is not enough detailed information to determine if the task is mandatory for the migration to succeed. An example of this would be migrating a third-party proprietary type where there is no directly compatible type.
- Information
- The task is included to inform you of the existence of certain files. These may need to be examined or modified as part of the modernization effort, but changes are typically not required.
For more information on categorizing tasks, see Using custom rule categories.
A.4. Additional Resources
A.4.1. Contributing to the project
To help the Migration Toolkit for Applications cover most application constructs and server configurations, including yours, you can help with any of the following items:
- Send an email to jboss-migration-feedback@redhat.com and let us know what MTA migration rules must cover.
- Provide example applications to test migration rules.
Identify application components and problem areas that might be difficult to migrate:
- Write a short description of the problem migration areas.
- Write a brief overview describing how to solve the problem in migration areas.
- Try Migration Toolkit for Applications on your application. Make sure to report any issues you meet.
Contribute to the Migration Toolkit for Applications rules repository:
- Write a Migration Toolkit for Applications rule to identify or automate a migration process.
- Create a test for the new rule.
For more information, see Rule Development Guide.
Contribute to the project source code:
- Create a core rule.
- Improve MTA performance or efficiency.
Any level of involvement is greatly appreciated!
A.4.2. Migration Toolkit for Applications development resources
Use the following resources to learn and contribute to the Migration Toolkit for Applications development:
- MTA forums: https://developer.jboss.org/en/windup
- Jira issue tracker: https://issues.redhat.com/projects/MTA/issues
- MTA mailing list: jboss-migration-feedback@redhat.com
A.4.3. Reporting issues
MTA uses Jira as its issue tracking system. If you encounter an issue executing MTA, submit a Jira issue.
Revised on 2024-12-31 15:02:59 UTC