Advanced networking
Specialized and advanced networking topics in OpenShift Container Platform
Abstract
Chapter 1. Verifying connectivity to an endpoint
The Cluster Network Operator (CNO) runs a controller, the connectivity check controller, that performs a connection health check between resources within your cluster. By reviewing the results of the health checks, you can diagnose connection problems or eliminate network connectivity as the cause of an issue that you are investigating.
1.1. Connection health checks that are performed
To verify that cluster resources are reachable, a TCP connection is made to each of the following cluster API services:
- Kubernetes API server service
- Kubernetes API server endpoints
- OpenShift API server service
- OpenShift API server endpoints
- Load balancers
To verify that services and service endpoints are reachable on every node in the cluster, a TCP connection is made to each of the following targets:
- Health check target service
- Health check target endpoints
1.2. Implementation of connection health checks
The connectivity check controller orchestrates connection verification checks in your cluster. The results for the connection tests are stored in PodNetworkConnectivity objects in the openshift-network-diagnostics namespace. Connection tests are performed every minute in parallel.
The Cluster Network Operator (CNO) deploys several resources to the cluster to send and receive connectivity health checks:
- Health check source
-
This program deploys in a single pod replica set managed by a
Deploymentobject. The program consumesPodNetworkConnectivityobjects and connects to thespec.targetEndpointspecified in each object. - Health check target
- A pod deployed as part of a daemon set on every node in the cluster. The pod listens for inbound health checks. The presence of this pod on every node allows for the testing of connectivity to each node.
You can configure the nodes which network connectivity sources and targets run on with a node selector. Additionally, you can specify permissible tolerations for source and target pods. The configuration is defined in the singleton cluster custom resource of the Network API in the config.openshift.io/v1 API group.
Pod scheduling occurs after you have updated the configuration. Therefore, you must apply node labels that you intend to use in your selectors before updating the configuration. Labels applied after updating your network connectivity check pod placement are ignored.
Refer to the default configuration in the following YAML:
Default configuration for connectivity source and target pods
apiVersion: config.openshift.io/v1
kind: Network
metadata:
  name: cluster
spec:
  # ...
    networkDiagnostics:
mode: "All"
sourcePlacement:
        nodeSelector:
          checkNodes: groupA
        tolerations:
        - key: myTaint
          effect: NoSchedule
          operator: Exists
      targetPlacement:
        nodeSelector:
          checkNodes: groupB
        tolerations:
        - key: myOtherTaint
          effect: NoExecute
operator: Exists- 1
- Specifies the network diagnostics configuration. If a value is not specified or an empty object is specified, and
spec.disableNetworkDiagnostics=trueis set in thenetwork.operator.openshift.iocustom resource namedcluster, network diagnostics are disabled. If set, this value overridesspec.disableNetworkDiagnostics=true. - 2
- Specifies the diagnostics mode. The value can be the empty string,
All, orDisabled. The empty string is equivalent to specifyingAll. - 3
- Optional: Specifies a selector for connectivity check source pods. You can use the
nodeSelectorandtolerationsfields to further specify thesourceNodepods. These are optional for both source and target pods. You can omit them, use both, or use only one of them. - 4
- Optional: Specifies a selector for connectivity check target pods. You can use the
nodeSelectorandtolerationsfields to further specify thetargetNodepods. These are optional for both source and target pods. You can omit them, use both, or use only one of them.
1.3. Configuring pod connectivity check placement
As a cluster administrator, you can configure which nodes the connectivity check pods run by modifying the network.config.openshift.io object named cluster.
Prerequisites
-
Install the OpenShift CLI (
oc).
Procedure
Edit the connectivity check configuration by entering the following command:
$ oc edit network.config.openshift.io cluster-
In the text editor, update the
networkDiagnosticsstanza to specify the node selectors that you want for the source and target pods. - Save your changes and exit the text editor.
Verification
- Verify that the source and target pods are running on the intended nodes by entering the following command:
$ oc get pods -n openshift-network-diagnostics -o wideExample output
NAME                                    READY   STATUS    RESTARTS   AGE     IP           NODE                                        NOMINATED NODE   READINESS GATES
network-check-source-84c69dbd6b-p8f7n   1/1     Running   0          9h      10.131.0.8   ip-10-0-40-197.us-east-2.compute.internal   <none>           <none>
network-check-target-46pct              1/1     Running   0          9h      10.131.0.6   ip-10-0-40-197.us-east-2.compute.internal   <none>           <none>
network-check-target-8kwgf              1/1     Running   0          9h      10.128.2.4   ip-10-0-95-74.us-east-2.compute.internal    <none>           <none>
network-check-target-jc6n7              1/1     Running   0          9h      10.129.2.4   ip-10-0-21-151.us-east-2.compute.internal   <none>           <none>
network-check-target-lvwnn              1/1     Running   0          9h      10.128.0.7   ip-10-0-17-129.us-east-2.compute.internal   <none>           <none>
network-check-target-nslvj              1/1     Running   0          9h      10.130.0.7   ip-10-0-89-148.us-east-2.compute.internal   <none>           <none>
network-check-target-z2sfx              1/1     Running   0          9h      10.129.0.4   ip-10-0-60-253.us-east-2.compute.internal   <none>           <none>
1.4. PodNetworkConnectivityCheck object fields
The PodNetworkConnectivityCheck object fields are described in the following tables.
| Field | Type | Description |
|---|---|---|
|
|
|
The name of the object in the following format:
|
|
|
|
The namespace that the object is associated with. This value is always |
|
|
|
The name of the pod where the connection check originates, such as |
|
|
|
The target of the connection check, such as |
|
|
| Configuration for the TLS certificate to use. |
|
|
| The name of the TLS certificate used, if any. The default value is an empty string. |
|
|
| An object representing the condition of the connection test and logs of recent connection successes and failures. |
|
|
| The latest status of the connection check and any previous statuses. |
|
|
| Connection test logs from unsuccessful attempts. |
|
|
| Connect test logs covering the time periods of any outages. |
|
|
| Connection test logs from successful attempts. |
The following table describes the fields for objects in the status.conditions array:
| Field | Type | Description |
|---|---|---|
|
|
| The time that the condition of the connection transitioned from one status to another. |
|
|
| The details about last transition in a human readable format. |
|
|
| The last status of the transition in a machine readable format. |
|
|
| The status of the condition. |
|
|
| The type of the condition. |
The following table describes the fields for objects in the status.conditions array:
| Field | Type | Description |
|---|---|---|
|
|
| The timestamp from when the connection failure is resolved. |
|
|
| Connection log entries, including the log entry related to the successful end of the outage. |
|
|
| A summary of outage details in a human readable format. |
|
|
| The timestamp from when the connection failure is first detected. |
|
|
| Connection log entries, including the original failure. |
1.4.1. Connection log fields
The fields for a connection log entry are described in the following table. The object is used in the following fields:
-
status.failures[] -
status.successes[] -
status.outages[].startLogs[] -
status.outages[].endLogs[]
| Field | Type | Description |
|---|---|---|
|
|
| Records the duration of the action. |
|
|
| Provides the status in a human readable format. |
|
|
|
Provides the reason for status in a machine readable format. The value is one of |
|
|
| Indicates if the log entry is a success or failure. |
|
|
| The start time of connection check. |
1.5. Verifying network connectivity for an endpoint
As a cluster administrator, you can verify the connectivity of an endpoint, such as an API server, load balancer, service, or pod, and verify that network diagnostics is enabled.
Prerequisites
-
Install the OpenShift CLI (
oc). -
Access to the cluster as a user with the
cluster-adminrole.
Procedure
Confirm that network diagnostics are enable by entering the following command:
$ oc get network.config.openshift.io cluster -o yamlExample output
  # ...
  status:
  # ...
    conditions:
    - lastTransitionTime: "2024-05-27T08:28:39Z"
      message: ""
      reason: AsExpected
      status: "True"
      type: NetworkDiagnosticsAvailable
List the current
PodNetworkConnectivityCheckobjects by entering the following command:$ oc get podnetworkconnectivitycheck -n openshift-network-diagnosticsExample output
NAME                                                                                                                                AGE
network-check-source-ci-ln-x5sv9rb-f76d1-4rzrp-worker-b-6xdmh-to-kubernetes-apiserver-endpoint-ci-ln-x5sv9rb-f76d1-4rzrp-master-0   75m
network-check-source-ci-ln-x5sv9rb-f76d1-4rzrp-worker-b-6xdmh-to-kubernetes-apiserver-endpoint-ci-ln-x5sv9rb-f76d1-4rzrp-master-1   73m
network-check-source-ci-ln-x5sv9rb-f76d1-4rzrp-worker-b-6xdmh-to-kubernetes-apiserver-endpoint-ci-ln-x5sv9rb-f76d1-4rzrp-master-2   75m
network-check-source-ci-ln-x5sv9rb-f76d1-4rzrp-worker-b-6xdmh-to-kubernetes-apiserver-service-cluster                               75m
network-check-source-ci-ln-x5sv9rb-f76d1-4rzrp-worker-b-6xdmh-to-kubernetes-default-service-cluster                                 75m
network-check-source-ci-ln-x5sv9rb-f76d1-4rzrp-worker-b-6xdmh-to-load-balancer-api-external                                         75m
network-check-source-ci-ln-x5sv9rb-f76d1-4rzrp-worker-b-6xdmh-to-load-balancer-api-internal                                         75m
network-check-source-ci-ln-x5sv9rb-f76d1-4rzrp-worker-b-6xdmh-to-network-check-target-ci-ln-x5sv9rb-f76d1-4rzrp-master-0            75m
network-check-source-ci-ln-x5sv9rb-f76d1-4rzrp-worker-b-6xdmh-to-network-check-target-ci-ln-x5sv9rb-f76d1-4rzrp-master-1            75m
network-check-source-ci-ln-x5sv9rb-f76d1-4rzrp-worker-b-6xdmh-to-network-check-target-ci-ln-x5sv9rb-f76d1-4rzrp-master-2            75m
network-check-source-ci-ln-x5sv9rb-f76d1-4rzrp-worker-b-6xdmh-to-network-check-target-ci-ln-x5sv9rb-f76d1-4rzrp-worker-b-6xdmh      74m
network-check-source-ci-ln-x5sv9rb-f76d1-4rzrp-worker-b-6xdmh-to-network-check-target-ci-ln-x5sv9rb-f76d1-4rzrp-worker-c-n8mbf      74m
network-check-source-ci-ln-x5sv9rb-f76d1-4rzrp-worker-b-6xdmh-to-network-check-target-ci-ln-x5sv9rb-f76d1-4rzrp-worker-d-4hnrz      74m
network-check-source-ci-ln-x5sv9rb-f76d1-4rzrp-worker-b-6xdmh-to-network-check-target-service-cluster                               75m
network-check-source-ci-ln-x5sv9rb-f76d1-4rzrp-worker-b-6xdmh-to-openshift-apiserver-endpoint-ci-ln-x5sv9rb-f76d1-4rzrp-master-0    75m
network-check-source-ci-ln-x5sv9rb-f76d1-4rzrp-worker-b-6xdmh-to-openshift-apiserver-endpoint-ci-ln-x5sv9rb-f76d1-4rzrp-master-1    75m
network-check-source-ci-ln-x5sv9rb-f76d1-4rzrp-worker-b-6xdmh-to-openshift-apiserver-endpoint-ci-ln-x5sv9rb-f76d1-4rzrp-master-2    74m
network-check-source-ci-ln-x5sv9rb-f76d1-4rzrp-worker-b-6xdmh-to-openshift-apiserver-service-cluster                                75m
View the connection test logs:
- From the output of the previous command, identify the endpoint that you want to review the connectivity logs for.
View the object by entering the following command:
$ oc get podnetworkconnectivitycheck <name> \
  -n openshift-network-diagnostics -o yaml
where
<name>specifies the name of thePodNetworkConnectivityCheckobject.Example output
apiVersion: controlplane.operator.openshift.io/v1alpha1
kind: PodNetworkConnectivityCheck
metadata:
  name: network-check-source-ci-ln-x5sv9rb-f76d1-4rzrp-worker-b-6xdmh-to-kubernetes-apiserver-endpoint-ci-ln-x5sv9rb-f76d1-4rzrp-master-0
  namespace: openshift-network-diagnostics
  ...
spec:
  sourcePod: network-check-source-7c88f6d9f-hmg2f
  targetEndpoint: 10.0.0.4:6443
  tlsClientCert:
    name: ""
status:
  conditions:
  - lastTransitionTime: "2021-01-13T20:11:34Z"
    message: 'kubernetes-apiserver-endpoint-ci-ln-x5sv9rb-f76d1-4rzrp-master-0: tcp
      connection to 10.0.0.4:6443 succeeded'
    reason: TCPConnectSuccess
    status: "True"
    type: Reachable
  failures:
  - latency: 2.241775ms
    message: 'kubernetes-apiserver-endpoint-ci-ln-x5sv9rb-f76d1-4rzrp-master-0: failed
      to establish a TCP connection to 10.0.0.4:6443: dial tcp 10.0.0.4:6443: connect:
      connection refused'
    reason: TCPConnectError
    success: false
    time: "2021-01-13T20:10:34Z"
  - latency: 2.582129ms
    message: 'kubernetes-apiserver-endpoint-ci-ln-x5sv9rb-f76d1-4rzrp-master-0: failed
      to establish a TCP connection to 10.0.0.4:6443: dial tcp 10.0.0.4:6443: connect:
      connection refused'
    reason: TCPConnectError
    success: false
    time: "2021-01-13T20:09:34Z"
  - latency: 3.483578ms
    message: 'kubernetes-apiserver-endpoint-ci-ln-x5sv9rb-f76d1-4rzrp-master-0: failed
      to establish a TCP connection to 10.0.0.4:6443: dial tcp 10.0.0.4:6443: connect:
      connection refused'
    reason: TCPConnectError
    success: false
    time: "2021-01-13T20:08:34Z"
  outages:
  - end: "2021-01-13T20:11:34Z"
    endLogs:
    - latency: 2.032018ms
      message: 'kubernetes-apiserver-endpoint-ci-ln-x5sv9rb-f76d1-4rzrp-master-0:
        tcp connection to 10.0.0.4:6443 succeeded'
      reason: TCPConnect
      success: true
      time: "2021-01-13T20:11:34Z"
    - latency: 2.241775ms
      message: 'kubernetes-apiserver-endpoint-ci-ln-x5sv9rb-f76d1-4rzrp-master-0:
        failed to establish a TCP connection to 10.0.0.4:6443: dial tcp 10.0.0.4:6443:
        connect: connection refused'
      reason: TCPConnectError
      success: false
      time: "2021-01-13T20:10:34Z"
    - latency: 2.582129ms
      message: 'kubernetes-apiserver-endpoint-ci-ln-x5sv9rb-f76d1-4rzrp-master-0:
        failed to establish a TCP connection to 10.0.0.4:6443: dial tcp 10.0.0.4:6443:
        connect: connection refused'
      reason: TCPConnectError
      success: false
      time: "2021-01-13T20:09:34Z"
    - latency: 3.483578ms
      message: 'kubernetes-apiserver-endpoint-ci-ln-x5sv9rb-f76d1-4rzrp-master-0:
        failed to establish a TCP connection to 10.0.0.4:6443: dial tcp 10.0.0.4:6443:
        connect: connection refused'
      reason: TCPConnectError
      success: false
      time: "2021-01-13T20:08:34Z"
    message: Connectivity restored after 2m59.999789186s
    start: "2021-01-13T20:08:34Z"
    startLogs:
    - latency: 3.483578ms
      message: 'kubernetes-apiserver-endpoint-ci-ln-x5sv9rb-f76d1-4rzrp-master-0:
        failed to establish a TCP connection to 10.0.0.4:6443: dial tcp 10.0.0.4:6443:
        connect: connection refused'
      reason: TCPConnectError
      success: false
      time: "2021-01-13T20:08:34Z"
  successes:
  - latency: 2.845865ms
    message: 'kubernetes-apiserver-endpoint-ci-ln-x5sv9rb-f76d1-4rzrp-master-0: tcp
      connection to 10.0.0.4:6443 succeeded'
    reason: TCPConnect
    success: true
    time: "2021-01-13T21:14:34Z"
  - latency: 2.926345ms
    message: 'kubernetes-apiserver-endpoint-ci-ln-x5sv9rb-f76d1-4rzrp-master-0: tcp
      connection to 10.0.0.4:6443 succeeded'
    reason: TCPConnect
    success: true
    time: "2021-01-13T21:13:34Z"
  - latency: 2.895796ms
    message: 'kubernetes-apiserver-endpoint-ci-ln-x5sv9rb-f76d1-4rzrp-master-0: tcp
      connection to 10.0.0.4:6443 succeeded'
    reason: TCPConnect
    success: true
    time: "2021-01-13T21:12:34Z"
  - latency: 2.696844ms
    message: 'kubernetes-apiserver-endpoint-ci-ln-x5sv9rb-f76d1-4rzrp-master-0: tcp
      connection to 10.0.0.4:6443 succeeded'
    reason: TCPConnect
    success: true
    time: "2021-01-13T21:11:34Z"
  - latency: 1.502064ms
    message: 'kubernetes-apiserver-endpoint-ci-ln-x5sv9rb-f76d1-4rzrp-master-0: tcp
      connection to 10.0.0.4:6443 succeeded'
    reason: TCPConnect
    success: true
    time: "2021-01-13T21:10:34Z"
  - latency: 1.388857ms
    message: 'kubernetes-apiserver-endpoint-ci-ln-x5sv9rb-f76d1-4rzrp-master-0: tcp
      connection to 10.0.0.4:6443 succeeded'
    reason: TCPConnect
    success: true
    time: "2021-01-13T21:09:34Z"
  - latency: 1.906383ms
    message: 'kubernetes-apiserver-endpoint-ci-ln-x5sv9rb-f76d1-4rzrp-master-0: tcp
      connection to 10.0.0.4:6443 succeeded'
    reason: TCPConnect
    success: true
    time: "2021-01-13T21:08:34Z"
  - latency: 2.089073ms
    message: 'kubernetes-apiserver-endpoint-ci-ln-x5sv9rb-f76d1-4rzrp-master-0: tcp
      connection to 10.0.0.4:6443 succeeded'
    reason: TCPConnect
    success: true
    time: "2021-01-13T21:07:34Z"
  - latency: 2.156994ms
    message: 'kubernetes-apiserver-endpoint-ci-ln-x5sv9rb-f76d1-4rzrp-master-0: tcp
      connection to 10.0.0.4:6443 succeeded'
    reason: TCPConnect
    success: true
    time: "2021-01-13T21:06:34Z"
  - latency: 1.777043ms
    message: 'kubernetes-apiserver-endpoint-ci-ln-x5sv9rb-f76d1-4rzrp-master-0: tcp
      connection to 10.0.0.4:6443 succeeded'
    reason: TCPConnect
    success: true
    time: "2021-01-13T21:05:34Z"
Chapter 2. Changing the MTU for the cluster network
As a cluster administrator, you can change the maximum transmission unit (MTU) for the cluster network after cluster installation. This change is disruptive as cluster nodes must be rebooted to finalize the MTU change.
2.1. About the cluster MTU
During installation, the cluster network maximum transmission unit (MTU) is set automatically based on the primary network interface MTU of cluster nodes. Typically, you do not need to override the detected MTU, but in some instances you must override it.
You might want to change the MTU of the cluster network for one of the following reasons:
- The MTU detected during cluster installation is not correct for your infrastructure.
- Your cluster infrastructure now requires a different MTU, such as from the addition of nodes that need a different MTU for optimal performance.
Only the OVN-Kubernetes network plugin supports changing the MTU value.
2.1.1. Service interruption considerations
When you initiate a maximum transmission unit (MTU) change on your cluster the following effects might impact service availability:
- At least two rolling reboots are required to complete the migration to a new MTU. During this time, some nodes are not available as they restart.
- Specific applications deployed to the cluster with shorter timeout intervals than the absolute TCP timeout interval might experience disruption during the MTU change.
2.1.2. MTU value selection
When planning your maximum transmission unit (MTU) migration there are two related but distinct MTU values to consider.
- Hardware MTU: This MTU value is set based on the specifics of your network infrastructure.
-
Cluster network MTU: This MTU value is always less than your hardware MTU to account for the cluster network overlay overhead. The specific overhead is determined by your network plugin. For OVN-Kubernetes, the overhead is
100bytes.
If your cluster requires different MTU values for different nodes, you must subtract the overhead value for your network plugin from the lowest MTU value that is used by any node in your cluster. For example, if some nodes in your cluster have an MTU of 9001, and some have an MTU of 1500, you must set this value to 1400.
To avoid selecting an MTU value that is not acceptable by a node, verify the maximum MTU value (maxmtu) that is accepted by the network interface by using the ip -d link command.
2.1.3. How the migration process works
The following table summarizes the migration process by segmenting between the user-initiated steps in the process and the actions that the migration performs in response.
| User-initiated steps | OpenShift Container Platform activity |
|---|---|
| Set the following values in the Cluster Network Operator configuration:
| Cluster Network Operator (CNO): Confirms that each field is set to a valid value.
If the values provided are valid, the CNO writes out a new temporary configuration with the MTU for the cluster network set to the value of the Machine Config Operator (MCO): Performs a rolling reboot of each node in the cluster. |
| Reconfigure the MTU of the primary network interface for the nodes on the cluster. You can use one of the following methods to accomplish this:
| N/A |
|
Set the | Machine Config Operator (MCO): Performs a rolling reboot of each node in the cluster with the new MTU configuration. |
2.2. Changing the cluster network MTU
As a cluster administrator, you can increase or decrease the maximum transmission unit (MTU) for your cluster.
You cannot roll back an MTU value for nodes during the MTU migration process, but you can roll back the value after the MTU migration process completes.
The migration is disruptive and nodes in your cluster might be temporarily unavailable as the MTU update takes effect.
The following procedures describe how to change the cluster network MTU by using machine configs, Dynamic Host Configuration Protocol (DHCP), or an ISO image. If you use either the DHCP or ISO approaches, you must refer to configuration artifacts that you kept after installing your cluster to complete the procedure.
Prerequisites
-
You have installed the OpenShift CLI (
oc). -
You have access to the cluster using an account with
cluster-adminpermissions. -
You have identified the target MTU for your cluster. The MTU for the OVN-Kubernetes network plugin must be set to
100less than the lowest hardware MTU value in your cluster. - If your nodes are physical machines, ensure that the cluster network and the connected network switches support jumbo frames.
- If your nodes are virtual machines (VMs), ensure that the hypervisor and the connected network switches support jumbo frames.
2.2.1. Checking the current cluster MTU value
To ensure network stability and performance in a hybrid environment where part of your cluster is in the cloud and part is an on-premise environment, you can obtain the current maximum transmission unit (MTU) for the cluster network.
Procedure
To obtain the current MTU for the cluster network, enter the following command:
$ oc describe network.config clusterExample output
...
Status:
  Cluster Network:
    Cidr:               10.217.0.0/22
    Host Prefix:        23
  Cluster Network MTU:  1400
  Network Type:         OVNKubernetes
  Service Network:
    10.217.4.0/23
...
2.2.2. Preparing your hardware MTU configuration
To maintain network stability during an MTU change, you must prepare the configuration for your underlying hardware using a method such as DHCP, PXE, or NetworkManager. This preparation ensures that all cluster nodes are ready to accept the new MTU value before you apply the changes to the cluster network.
Procedure
Prepare your configuration for the hardware MTU:
If your hardware MTU is specified with DHCP, update your DHCP configuration such as with the following dnsmasq configuration:
dhcp-option-force=26,<mtu>where:
<mtu>- Specifies the hardware MTU for the DHCP server to advertise.
- If your hardware MTU is specified with a kernel command line with PXE, update that configuration accordingly.
- If your hardware MTU is specified in a NetworkManager connection configuration, complete the following steps. This approach is the default for OpenShift Container Platform if you do not explicitly specify your network configuration with DHCP, a kernel command line, or some other method. Your cluster nodes must all use the same underlying network configuration for the following procedure to work unmodified.
Find the primary network interface by entering the following command:
$ oc debug node/<node_name> -- chroot /host nmcli -g connection.interface-name c show ovs-if-phys0where:
<node_name>- Specifies the name of a node in your cluster.
Create the following
NetworkManagerconfiguration in the<interface>-mtu.conffile:[connection-<interface>-mtu] match-device=interface-name:<interface> ethernet.mtu=<mtu>where:
<interface>- Specifies the primary network interface name.
<mtu>- Specifies the new hardware MTU value.
-
If you used Kubernetes NMState to configure the
br-exbridge, use the Kubernetes NMState Operator to update the MTU for thebr-exbridge. Changing the MTU for this bridge in a.nmconnectionfile could lead to persistence issues as the Machine Config Operator (MCO) might overwrite the file.
2.2.3. Creating MachineConfig objects
To prepare your nodes for a hardware MTU change, you must create MachineConfig objects for both control plane and compute nodes. Creating these objects ensures that the updated network interface settings are ready for deployment without causing immediate cluster instability.
Procedure
Create two
MachineConfigobjects, one for the control plane nodes and another for the worker nodes in your cluster:Create the following Butane config in the
control-plane-interface.bufile:NoteThe Butane version you specify in the config file should match the OpenShift Container Platform version and always ends in
0. For example,4.19.0. See "Creating machine configs with Butane" for information about Butane.variant: openshift version: 4.19.0 metadata: name: 01-control-plane-interface labels: machineconfiguration.openshift.io/role: master storage: files: - path: /etc/NetworkManager/conf.d/99-<interface>-mtu.conf contents: local: <interface>-mtu.conf mode: 0600where:
storage.files.path-
Specifies the
NetworkManagerconnection name for the primary network interface. storage.files.local-
Specifies the local filename for the updated
NetworkManagerconfiguration file from an earlier step.
Create the following Butane config in the
worker-interface.bufile:NoteThe Butane version you specify in the config file should match the OpenShift Container Platform version and always ends in
0. For example,4.19.0. See "Creating machine configs with Butane" for information about Butane.variant: openshift version: 4.19.0 metadata: name: 01-worker-interface labels: machineconfiguration.openshift.io/role: worker storage: files: - path: /etc/NetworkManager/conf.d/99-<interface>-mtu.conf contents: local: <interface>-mtu.conf mode: 0600where:
storage.files.path-
Specifies the
NetworkManagerconnection name for the primary network interface. storage.files.local-
Specifies the local filename for the updated
NetworkManagerconfiguration file from an earlier step.
Create
MachineConfigobjects from the Butane configs by running the following command:$ for manifest in control-plane-interface worker-interface; do butane --files-dir . $manifest.bu > $manifest.yaml doneWarningDo not apply these machine configs until explicitly instructed later in this procedure. Applying these machine configs now causes a loss of stability for the cluster.
2.2.4. Beginning the MTU migration
Start the maximum transmission unit (MTU) migration by specifying the migration configuration for the cluster network and machine interfaces. The Machine Config Operator performs a rolling reboot of the nodes to prepare the cluster for the MTU change.
Procedure
To begin the MTU migration, specify the migration configuration by entering the following command. The Machine Config Operator performs a rolling reboot of the nodes in the cluster in preparation for the MTU change.
$ oc patch Network.operator.openshift.io cluster --type=merge --patch \
  '{"spec": { "migration": { "mtu": { "network": { "from": <overlay_from>, "to": <overlay_to> } , "machine": { "to" : <machine_to> } } } } }'
where:
<overlay_from>- Specifies the current cluster network MTU value.
<overlay_to>-
Specifies the target MTU for the cluster network. This value is set relative to the value of
<machine_to>. For OVN-Kubernetes, this value must be100less than the value of<machine_to>. <machine_to>- Specifies the MTU for the primary network interface on the underlying host network.
$ oc patch Network.operator.openshift.io cluster --type=merge --patch \
  '{"spec": { "migration": { "mtu": { "network": { "from": 1400, "to": 9000 } , "machine": { "to" : 9100} } } } }'
As the Machine Config Operator updates machines in each machine config pool, the Operator reboots each node one by one. You must wait until all the nodes are updated. Check the machine config pool status by entering the following command:
$ oc get machineconfigpoolsA successfully updated node has the following status:
UPDATED=true,UPDATING=false,DEGRADED=false.NoteBy default, the Machine Config Operator updates one machine per pool at a time, causing the total time the migration takes to increase with the size of the cluster.
2.2.5. Verifying the machine configuration
Verify the machine configuration on your hosts to confirm that the maximum transmission unit (MTU) migration applied successfully. Checking the configuration state and system settings help ensures that the nodes use the correct migration script.
Procedure
Confirm the status of the new machine configuration on the hosts:
To list the machine configuration state and the name of the applied machine configuration, enter the following command:
$ oc describe node | egrep "hostname|machineconfig"Example output
kubernetes.io/hostname=master-0
machineconfiguration.openshift.io/currentConfig: rendered-master-c53e221d9d24e1c8bb6ee89dd3d8ad7b
machineconfiguration.openshift.io/desiredConfig: rendered-master-c53e221d9d24e1c8bb6ee89dd3d8ad7b
machineconfiguration.openshift.io/reason:
machineconfiguration.openshift.io/state: Done
Verify that the following statements are true:
-
The value of
machineconfiguration.openshift.io/statefield isDone. -
The value of the
machineconfiguration.openshift.io/currentConfigfield is equal to the value of themachineconfiguration.openshift.io/desiredConfigfield.
-
The value of
To confirm that the machine config is correct, enter the following command:
$ oc get machineconfig <config_name> -o yaml | grep ExecStartwhere:
<config_name>-
Specifies the name of the machine config from the
machineconfiguration.openshift.io/currentConfigfield.
The machine config must include the following update to the systemd configuration:
ExecStart=/usr/local/bin/mtu-migration.sh
2.2.6. Applying the new hardware MTU value
To ensure consistent network communication across your cluster, you must apply the new hardware maximum transmission unit (MTU) value to your nodes. This process involves updating the underlying network interfaces and verifying that the Machine Config Operator successfully reboots and updates each node.
Procedure
Update the underlying network interface MTU value:
If you are specifying the new MTU with a NetworkManager connection configuration, enter the following command. The MachineConfig Operator automatically performs a rolling reboot of the nodes in your cluster.
$ for manifest in control-plane-interface worker-interface; do oc create -f $manifest.yaml done- If you are specifying the new MTU with a DHCP server option or a kernel command line and PXE, make the necessary changes for your infrastructure.
As the Machine Config Operator updates machines in each machine config pool, the Operator reboots each node one by one. You must wait until all the nodes are updated. Check the machine config pool status by entering the following command:
$ oc get machineconfigpoolsA successfully updated node has the following status:
UPDATED=true,UPDATING=false,DEGRADED=false.NoteBy default, the Machine Config Operator updates one machine per pool at a time, causing the total time the migration takes to increase with the size of the cluster.
Confirm the status of the new machine configuration on the hosts:
To list the machine configuration state and the name of the applied machine configuration, enter the following command:
$ oc describe node | egrep "hostname|machineconfig"Example output
kubernetes.io/hostname=master-0
machineconfiguration.openshift.io/currentConfig: rendered-master-c53e221d9d24e1c8bb6ee89dd3d8ad7b
machineconfiguration.openshift.io/desiredConfig: rendered-master-c53e221d9d24e1c8bb6ee89dd3d8ad7b
machineconfiguration.openshift.io/reason:
machineconfiguration.openshift.io/state: Done
Verify that the following statements are true:
-
The value of
machineconfiguration.openshift.io/statefield isDone. -
The value of the
machineconfiguration.openshift.io/currentConfigfield is equal to the value of themachineconfiguration.openshift.io/desiredConfigfield.
-
The value of
To confirm that the machine config is correct, enter the following command:
$ oc get machineconfig <config_name> -o yaml | grep path:where:
<config_name>-
Specifies the name of the machine config from the
machineconfiguration.openshift.io/currentConfigfield.
If the machine config is successfully deployed, the previous output contains the
/etc/NetworkManager/conf.d/99-<interface>-mtu.conffile path and theExecStart=/usr/local/bin/mtu-migration.shline.
2.2.7. Finalizing the MTU migration
Finalize the MTU migration to apply the new maximum transmission unit (MTU) settings to the OVN-Kubernetes network plugin. This updates the cluster configuration and triggers a rolling reboot of the nodes to complete the process.
Procedure
To finalize the MTU migration, enter the following command for the OVN-Kubernetes network plugin:
$ oc patch Network.operator.openshift.io cluster --type=merge --patch \
  '{"spec": { "migration": null, "defaultNetwork":{ "ovnKubernetesConfig": { "mtu": <mtu> }}}}'
where:
<mtu>-
Specifies the new cluster network MTU that you specified with
<overlay_to>.
After finalizing the MTU migration, each machine config pool node is rebooted one by one. You must wait until all the nodes are updated. Check the machine config pool status by entering the following command:
$ oc get machineconfigpoolsA successfully updated node has the following status:
UPDATED=true,UPDATING=false,DEGRADED=false.
Verification
To get the current MTU for the cluster network, enter the following command:
$ oc describe network.config clusterGet the current MTU for the primary network interface of a node:
To list the nodes in your cluster, enter the following command:
$ oc get nodesTo obtain the current MTU setting for the primary network interface on a node, enter the following command:
$ oc adm node-logs <node> -u ovs-configuration | grep configure-ovs.sh | grep mtu | grep <interface> | head -1where:
<node>- Specifies a node from the output from the previous step.
<interface>- Specifies the primary network interface name for the node.
Example output
ens3: <BROADCAST,MULTICAST,UP,LOWER_UP> mtu 8051
Chapter 3. Network bonding considerations
You can use network bonding, also known as link aggregration, to combine many network interfaces into a single, logical interface. This means that you can use different modes for handling how network traffic distributes across bonded interfaces. Each mode provides fault tolerance and some modes provide load balancing capabilities to your network. Red Hat supports Open vSwitch (OVS) bonding and kernel bonding.
3.1. Open vSwitch (OVS) bonding
With an OVS bonding configuration, you create a single, logical interface by connecting each physical network interface controller (NIC) as a port to a specific bond. This single bond then handles all network traffic, effectively replacing the function of individual interfaces.
Consider the following architectural layout for OVS bridges that interact with OVS interfaces:
- A network interface uses a bridge Media Access Control (MAC) address for managing protocol-level traffic and other administrative tasks, such as IP address assignment.
- The physical MAC addresses of physical interfaces do not handle traffic.
- OVS handles all MAC address management at the OVS bridge level.
This layout simplifies bond interface management as bonds act as data paths, where centralized MAC address management happens at the OVS bridge level.
For OVS bonding, you can select either active-backup mode or balance-slb mode. A bonding mode specifies the policy for how bond interfaces get used during network transmission.
3.1.1. Enable active-backup mode for your cluster
The active-backup mode provides fault tolerance for network connections by switching to a backup link where the primary link fails.
The mode specifies the following ports for your cluster:
- An active port where one physical interface sends and receives traffic at any given time.
- A standby port where all other ports act as backup links and continously monitor their link status.
During a failover process, if an active port or its link fails, the bonding logic switches all network traffic to a standby port. This standby port becomes the new active port. For failover to work, all ports in a bond must share the same Media Access Control (MAC) address.
3.1.2. Enabling OVS balance-slb mode for your cluster
You can enable the Open vSwitch (OVS) balance-slb mode so that two or more physical interfaces can share their network traffic. A balance-slb mode interface can give source load balancing (SLB) capabilities to a cluster that runs virtualization workloads, without requiring load balancing negotiation with the network switch.
Currently, source load balancing runs on a bond interface, where the interface connects to an auxiliary bridge, such as br-phy. Source load balancing balances only across different Media Access Control (MAC) address and virtual local area network (VLAN) combinations. Note that all OVN-Kubernetes pod traffic uses the same MAC address and VLAN, so this traffic cannot be load balanced across many physical interfaces.
The following diagram shows balance-slb mode on a simple cluster infrastructure layout. Virtual machines (VMs) connect to specific localnet NetworkAttachmentDefinition (NAD) custom resource definition (CRDs), NAD 0 or NAD 1. Each NAD provides VMs with access to the underlying physical network, supporting VLAN-tagged or untagged traffic. A br-ex OVS bridge receives traffic from VMs and passes the traffic to the next OVS bridge, br-phy. The br-phy bridge functions as the controller for the SLB bond. The SLB bond balances traffic from different VM ports over the physical interface links, such as eno0 and eno1. Additionally, ingress traffic from either physical interface can pass through the set of OVS bridges to reach the VMs.
Figure 3.1. OVS balance-slb mode operating on a localnet with two NADs

You can integrate the balance-slb mode interface into primary or secondary network types by using OVS bonding. Note the following points about OVS bonding:
- Supports the OVN-Kubernetes CNI plugin and easily integrates with the plugin.
-
Natively supports
balance-slbmode.
Prerequisites
-
You have more than one physical interface attached to your primary network and you defined the interfaces in a
MachineConfigfile. -
You created a manifest object and defined a customized
br-exbridge in the object configuration file. - You have more than one physical interfaces attached to your primary network and you defined the interfaces in a NAD CRD file.
Procedure
For each bare-metal host that exists in a cluster, in the
install-config.yamlfile for your cluster define anetworkConfigsection similar to the following example:# ... networkConfig: interfaces: - name: enp1s0 type: ethernet state: up ipv4: dhcp: true enabled: true ipv6: enabled: false - name: enp2s0 type: ethernet state: up mtu: 1500 ipv4: dhcp: true enabled: true ipv6: dhcp: true enabled: true - name: enp3s0 type: ethernet state: up mtu: 1500 ipv4: enabled: false ipv6: enabled: false # ...where:
enp1s0- The interface for the provisioned network interface controller (NIC).
enp2s0- The first bonded interface that pulls in the Ignition config file for the bond interface.
mtu-
Manually set the
br-exmaximum transmission unit (MTU) on the bond ports. enp3s0- The second bonded interface is part of a minimal configuration that pulls ignition during cluster installation.
Define each network interface in an NMState configuration file:
Example NMState configuration file that defines many network interfaces
ovn:
  bridge-mappings:
    - localnet: localnet-network
      bridge: br-ex
      state: present
interfaces:
  - name: br-ex
    type: ovs-bridge
    state: up
    bridge:
      allow-extra-patch-ports: true
      port:
        - name: br-ex
        - name: patch-ex-to-phy
    ovs-db:
      external_ids:
        bridge-uplink: "patch-ex-to-phy"
  - name: br-ex
    type: ovs-interface
    state: up
    mtu: 1500
    ipv4:
      enabled: true
      dhcp: true
      auto-route-metric: 48
    ipv6:
      enabled: false
      dhcp: false
      auto-route-metric: 48
  - name: br-phy
    type: ovs-bridge
    state: up
    bridge:
      allow-extra-patch-ports: true
      port:
        - name: patch-phy-to-ex
        - name: ovs-bond
          link-aggregation:
            mode: balance-slb
            port:
              - name: enp2s0
              - name: enp3s0
  - name: patch-ex-to-phy
    type: ovs-interface
    state: up
    patch:
      peer: patch-phy-to-ex
  - name: patch-phy-to-ex
    type: ovs-interface
    state: up
    patch:
      peer: patch-ex-to-phy
  - name: enp1s0
    type: ethernet
    state: up
    ipv4:
      dhcp: true
      enabled: true
    ipv6:
      enabled: false
  - name: enp2s0
    type: ethernet
    state: up
    mtu: 1500
    ipv4:
      enabled: false
    ipv6:
      enabled: false
  - name: enp3s0
    type: ethernet
    state: up
    mtu: 1500
    ipv4:
      enabled: false
    ipv6:
      enabled: false
# ...
where:
mtu-
Manually set the
br-exMTU on the bond ports.
Use the
base64command to encode the interface content of the NMState configuration file:$ base64 -w0 <nmstate_configuration>.yml<nmstate_configuration>: Where the-w0option prevents line wrapping during the base64 encoding operation.Create
MachineConfigmanifest files for themasterrole and theworkerrole. Ensure that you embed the base64-encoded string from an earlier command into eachMachineConfigmanifest file. The following example manifest file configures themasterrole for all nodes that exist in a cluster. You can also create a manifest file formasterandworkerroles specific to a node.apiVersion: machineconfiguration.openshift.io/v1 kind: MachineConfig metadata: labels: machineconfiguration.openshift.io/role: master name: 10-br-ex-master spec: config: ignition: version: 3.2.0 storage: files: - contents: source: data:text/plain;charset=utf-8;base64,<base64_encoded_nmstate_configuration> mode: 0644 overwrite: true path: /etc/nmstate/openshift/cluster.ymlwhere:
name- The name of the policy.
source- Writes the encoded base64 information to the specified path.
path-
Specify the path to the
cluster.ymlfile. For each node in your cluster, you can specify the short hostname path to your node, such as<node_short_hostname>.yml.
Save each
MachineConfigmanifest file to the./<installation_directory>/manifestsdirectory, where<installation_directory>is the directory in which the installation program creates files.The Machine Config Operator (MCO) takes the content from each manifest file and consistently applies the content to all selected nodes during a rolling update.
3.2. Kernel bonding
You can use kernel bonding, which is a built-in Linux kernel function where link aggregation can exist among many Ethernet interfaces, to create a single logical physical interface. Kernel bonding allows multiple network interfaces to be combined into a single logical interface, which can enhance network performance by increasing bandwidth and providing redundancy in case of a link failure.
Kernel bonding is the default mode if no bond interfaces depend on OVS bonds. This bonding type does not give the same level of customization as supported OVS bonding.
For kernel-bonding mode, the bond interfaces exist outside, which means they are not in the data path, of the bridge interface. Network traffic in this mode is not sent or received on the bond interface port but instead requires additional bridging capabilities for MAC address assignment at the kernel level.
If you enabled kernel-bonding mode on network controller interfaces (NICs) for your nodes, you must specify a Media Access Control (MAC) address failover. This configuration prevents node communication issues with the bond interfaces, such as eno1f0 and eno2f0.
Red Hat supports only the following value for the fail_over_mac parameter:
-
0: Specifies thenonevalue, which disables MAC address failover so that all interfaces receive the same MAC address as the bond interface. This is the default value.
Red Hat does not support the following values for the fail_over_mac parameter:
-
1: Specifies theactivevalue and sets the MAC address of the primary bond interface to always remain the same as active interfaces. If during a failover, the MAC address of an interface changes, the MAC address of the bond interface changes to match the new MAC address of the interface. -
2: Specifies thefollowvalue so that during a failover, an active interface gets the MAC address of the bond interface and a formerly active interface receives the MAC address of the newly active interface.
Chapter 4. Using the Stream Control Transmission Protocol (SCTP)
As a cluster administrator, you can use the Stream Control Transmission Protocol (SCTP) on a bare-metal cluster.
4.1. Support for SCTP on OpenShift Container Platform
As a cluster administrator, you can enable SCTP on the hosts in the cluster. On Red Hat Enterprise Linux CoreOS (RHCOS), the SCTP module is disabled by default.
SCTP is a reliable message based protocol that runs on top of an IP network.
When enabled, you can use SCTP as a protocol with pods, services, and network policy. A Service object must be defined with the type parameter set to either the ClusterIP or NodePort value.
4.1.1. Example configurations using SCTP protocol
You can configure a pod or service to use SCTP by setting the protocol parameter to the SCTP value in the pod or service object.
In the following example, a pod is configured to use SCTP:
apiVersion: v1
kind: Pod
metadata:
  namespace: project1
  name: example-pod
spec:
  containers:
    - name: example-pod
...
      ports:
        - containerPort: 30100
          name: sctpserver
          protocol: SCTP
In the following example, a service is configured to use SCTP:
apiVersion: v1
kind: Service
metadata:
  namespace: project1
  name: sctpserver
spec:
...
  ports:
    - name: sctpserver
      protocol: SCTP
      port: 30100
      targetPort: 30100
  type: ClusterIP
In the following example, a NetworkPolicy object is configured to apply to SCTP network traffic on port 80 from any pods with a specific label:
kind: NetworkPolicy
apiVersion: networking.k8s.io/v1
metadata:
  name: allow-sctp-on-http
spec:
  podSelector:
    matchLabels:
      role: web
  ingress:
  - ports:
    - protocol: SCTP
      port: 80
4.2. Enabling Stream Control Transmission Protocol (SCTP)
As a cluster administrator, you can load and enable the blacklisted SCTP kernel module on worker nodes in your cluster.
Prerequisites
-
Install the OpenShift CLI (
oc). -
Access to the cluster as a user with the
cluster-adminrole.
Procedure
Create a file named
load-sctp-module.yamlthat contains the following YAML definition:apiVersion: machineconfiguration.openshift.io/v1 kind: MachineConfig metadata: name: load-sctp-module labels: machineconfiguration.openshift.io/role: worker spec: config: ignition: version: 3.2.0 storage: files: - path: /etc/modprobe.d/sctp-blacklist.conf mode: 0644 overwrite: true contents: source: data:, - path: /etc/modules-load.d/sctp-load.conf mode: 0644 overwrite: true contents: source: data:,sctpTo create the
MachineConfigobject, enter the following command:$ oc create -f load-sctp-module.yamlOptional: To watch the status of the nodes while the MachineConfig Operator applies the configuration change, enter the following command. When the status of a node transitions to
Ready, the configuration update is applied.$ oc get nodes
4.3. Verifying Stream Control Transmission Protocol (SCTP) is enabled
You can verify that SCTP is working on a cluster by creating a pod with an application that listens for SCTP traffic, associating it with a service, and then connecting to the exposed service.
Prerequisites
-
Access to the internet from the cluster to install the
ncpackage. -
Install the OpenShift CLI (
oc). -
Access to the cluster as a user with the
cluster-adminrole.
Procedure
Create a pod starts an SCTP listener:
Create a file named
sctp-server.yamlthat defines a pod with the following YAML:apiVersion: v1 kind: Pod metadata: name: sctpserver labels: app: sctpserver spec: containers: - name: sctpserver image: registry.access.redhat.com/ubi9/ubi command: ["/bin/sh", "-c"] args: ["dnf install -y nc && sleep inf"] ports: - containerPort: 30102 name: sctpserver protocol: SCTPCreate the pod by entering the following command:
$ oc create -f sctp-server.yaml
Create a service for the SCTP listener pod.
Create a file named
sctp-service.yamlthat defines a service with the following YAML:apiVersion: v1 kind: Service metadata: name: sctpservice labels: app: sctpserver spec: type: NodePort selector: app: sctpserver ports: - name: sctpserver protocol: SCTP port: 30102 targetPort: 30102To create the service, enter the following command:
$ oc create -f sctp-service.yaml
Create a pod for the SCTP client.
Create a file named
sctp-client.yamlwith the following YAML:apiVersion: v1 kind: Pod metadata: name: sctpclient labels: app: sctpclient spec: containers: - name: sctpclient image: registry.access.redhat.com/ubi9/ubi command: ["/bin/sh", "-c"] args: ["dnf install -y nc && sleep inf"]To create the
Podobject, enter the following command:$ oc apply -f sctp-client.yaml
Run an SCTP listener on the server.
To connect to the server pod, enter the following command:
$ oc rsh sctpserverTo start the SCTP listener, enter the following command:
$ nc -l 30102 --sctp
Connect to the SCTP listener on the server.
- Open a new terminal window or tab in your terminal program.
Obtain the IP address of the
sctpserviceservice. Enter the following command:$ oc get services sctpservice -o go-template='{{.spec.clusterIP}}{{"\n"}}'To connect to the client pod, enter the following command:
$ oc rsh sctpclientTo start the SCTP client, enter the following command. Replace
<cluster_IP>with the cluster IP address of thesctpserviceservice.# nc <cluster_IP> 30102 --sctp
Chapter 5. Associating secondary interfaces metrics to network attachments
To gain better visibility into cluster traffic, you can associate secondary interface metrics with specific network attachments. By using the pod_network_info metric to label interfaces based on their NetworkAttachmentDefinition resource, you can more easily monitor performance and troubleshoot connectivity issues across your network.
5.1. Extending secondary network metrics for monitoring
To monitor and manage network traffic effectively, you can extend secondary network metrics with identifying information. By using the pod_network_name_info metric to label interfaces based on their NetworkAttachmentDefinition resource, you can classify interface types to enable precise metric aggregation and alerting.
Secondary devices, or interfaces, are used for different purposes. Metrics from secondary network interfaces need to be classified to allow for effective aggregation and monitoring.
Exposed metrics contain the interface but do not specify where the interface originates. This is workable when there are no additional interfaces. However, relying on interface names alone becomes problematic when secondary interfaces are added because it is difficult to identify their purpose and use their metrics effectively..
When adding secondary interfaces, their names depend on the order in which they are added. Secondary interfaces can belong to distinct networks that can each serve a different purposes.
With pod_network_name_info it is possible to extend the current metrics with additional information that identifies the interface type. In this way, it is possible to aggregate the metrics and to add specific alarms to specific interface types.
The network type is generated from the name of the NetworkAttachmentDefinition resource, which distinguishes different secondary network classes. For example, different interfaces belonging to different networks or using different CNIs use different network attachment definition names.
5.2. Network Metrics Daemon
The Network Metrics Daemon collects and publishes network-related metrics to support performance management in complex pod environments. This component provides metadata for secondary interfaces, which is required for accurate traffic monitoring across distinct network attachments.
The kubelet is already publishing network related metrics you can observe. These metrics are:
-
container_network_receive_bytes_total -
container_network_receive_errors_total -
container_network_receive_packets_total -
container_network_receive_packets_dropped_total -
container_network_transmit_bytes_total -
container_network_transmit_errors_total -
container_network_transmit_packets_total -
container_network_transmit_packets_dropped_total
The labels in these metrics contain, among others:
- Pod name
- Pod namespace
-
Interface name (such as
eth0)
These metrics work well until new interfaces are added to the pod, for example via Multus, as it is not clear what the interface names refer to.
The interface label refers to the interface name, but it is not clear what that interface is meant for. In case of many different interfaces, it would be impossible to understand what network the metrics you are monitoring refer to.
This is addressed by introducing the new pod_network_name_info described in the following section.
5.3. Metrics with network name
To simplify the monitoring of secondary networks, you can use the pod_network_name_info metric to correlate network performance data with specific network names. By joining this metric with container network metrics, you can identify traffic patterns and errors across distinct network attachment definitions.
Example of pod_network_name_info
pod_network_name_info{interface="net0",namespace="namespacename",network_name="nadnamespace/firstNAD",pod="podname"} 0
The network name label is produced using the annotation added by Multus. It is the concatenation of the namespace the network attachment definition belongs to, plus the name of the network attachment definition. The Network Metrics daemonset publishes a pod_network_name_info gauge metric, with a fixed value of 0.
The new metric alone does not provide much value, but combined with the network related container_network_* metrics, it offers better support for monitoring secondary networks.
Using a promql query like the following ones, it is possible to get a new metric containing the value and the network name retrieved from the k8s.v1.cni.cncf.io/network-status annotation:
(container_network_receive_bytes_total) + on(namespace,pod,interface) group_left(network_name) ( pod_network_name_info )
(container_network_receive_errors_total) + on(namespace,pod,interface) group_left(network_name) ( pod_network_name_info )
(container_network_receive_packets_total) + on(namespace,pod,interface) group_left(network_name) ( pod_network_name_info )
(container_network_receive_packets_dropped_total) + on(namespace,pod,interface) group_left(network_name) ( pod_network_name_info )
(container_network_transmit_bytes_total) + on(namespace,pod,interface) group_left(network_name) ( pod_network_name_info )
(container_network_transmit_errors_total) + on(namespace,pod,interface) group_left(network_name) ( pod_network_name_info )
(container_network_transmit_packets_total) + on(namespace,pod,interface) group_left(network_name) ( pod_network_name_info )
(container_network_transmit_packets_dropped_total) + on(namespace,pod,interface) group_left(network_name)
Chapter 6. BGP routing
6.1. About BGP routing
This feature provides native Border Gateway Protocol (BGP) routing capabilities for the cluster.
If you are using the MetalLB Operator and there are existing FRRConfiguration CRs in the metallb-system namespace created by cluster administrators or third-party cluster components other than the MetalLB Operator, you must ensure that they are copied to the openshift-frr-k8s namespace or that those third-party cluster components use the new namespace. For more information, see Migrating FRR-K8s resources.
6.1.1. About Border Gateway Protocol (BGP) routing
OpenShift Container Platform supports BGP routing through FRRouting (FRR), a free, open source internet routing protocol suite for Linux, UNIX, and similar operating systems. FRR-K8s is a Kubernetes-based daemon set that exposes a subset of the FRR API in a Kubernetes-compliant manner. As a cluster administrator, you can use the FRRConfiguration custom resource (CR) to access FRR services.
6.1.1.1. Supported platforms
BGP routing is supported on the following infrastructure types:
- Bare metal
BGP routing requires that you have properly configured BGP for your network provider. Outages or misconfigurations of your network provider might cause disruptions to your cluster network.
6.1.1.2. Considerations for use with the MetalLB Operator
The MetalLB Operator is installed as an add-on to the cluster. Deployment of the MetalLB Operator automatically enables FRR-K8s as an additional routing capability provider and uses the FRR-K8s daemon installed by this feature.
Before upgrading to 4.18, any existing FRRConfiguration in the metallb-system namespace not managed by the MetalLB operator (added by a cluster administrator or any other component) needs to be copied to the openshift-frr-k8s namespace manually, creating the namespace if necessary.
If you are using the MetalLB Operator and there are existing FRRConfiguration CRs in the metallb-system namespace created by cluster administrators or third-party cluster components other than MetalLB Operator, you must:
-
Ensure that these existing
FRRConfigurationCRs are copied to theopenshift-frr-k8snamespace. -
Ensure that the third-party cluster components use the new namespace for the
FRRConfigurationCRs that they create.
6.1.1.3. Cluster Network Operator configuration
The Cluster Network Operator API exposes the following API field to configure BGP routing:
-
spec.additionalRoutingCapabilities: Enables deployment of the FRR-K8s daemon for the cluster, which can be used independently of route advertisements. When enabled, the FRR-K8s daemon is deployed on all nodes.
6.1.1.4. BGP routing custom resources
The following custom resources are used to configure BGP routing:
FRRConfiguration- This custom resource defines the FRR configuration for the BGP routing. This CR is namespaced.
6.1.2. Configuring the FRRConfiguration CRD
The following section provides reference examples that use the FRRConfiguration custom resource (CR).
6.1.2.1. The routers field
You can use the routers field to configure multiple routers, one for each Virtual Routing and Forwarding (VRF) resource. For each router, you must define the Autonomous System Number (ASN).
You can also define a list of Border Gateway Protocol (BGP) neighbors to connect to, as in the following example:
Example FRRConfiguration CR
apiVersion: frrk8s.metallb.io/v1beta1
kind: FRRConfiguration
metadata:
  name: test
  namespace: frr-k8s-system
spec:
  bgp:
    routers:
    - asn: 64512
      neighbors:
      - address: 172.30.0.3
        asn: 4200000000
        ebgpMultiHop: true
        port: 180
      - address: 172.18.0.6
        asn: 4200000000
        port: 179
6.1.2.2. The toAdvertise field
By default, FRR-K8s does not advertise the prefixes configured as part of a router configuration. In order to advertise them, you use the toAdvertise field.
You can advertise a subset of the prefixes, as in the following example:
Example FRRConfiguration CR
apiVersion: frrk8s.metallb.io/v1beta1
kind: FRRConfiguration
metadata:
  name: test
  namespace: frr-k8s-system
spec:
  bgp:
    routers:
    - asn: 64512
      neighbors:
      - address: 172.30.0.3
        asn: 4200000000
        ebgpMultiHop: true
        port: 180
        toAdvertise:
          allowed:
            prefixes:
            - 192.168.2.0/24
      prefixes:
        - 192.168.2.0/24
- 192.169.2.0/24- 1
- Advertises a subset of prefixes.
The following example shows you how to advertise all of the prefixes:
Example FRRConfiguration CR
apiVersion: frrk8s.metallb.io/v1beta1
kind: FRRConfiguration
metadata:
  name: test
  namespace: frr-k8s-system
spec:
  bgp:
    routers:
    - asn: 64512
      neighbors:
      - address: 172.30.0.3
        asn: 4200000000
        ebgpMultiHop: true
        port: 180
        toAdvertise:
          allowed:
            mode: all
      prefixes:
        - 192.168.2.0/24
- 192.169.2.0/24- 1
- Advertises all prefixes.
6.1.2.3. The toReceive field
By default, FRR-K8s does not process any prefixes advertised by a neighbor. You can use the toReceive field to process such addresses.
You can configure for a subset of the prefixes, as in this example:
Example FRRConfiguration CR
apiVersion: frrk8s.metallb.io/v1beta1
kind: FRRConfiguration
metadata:
  name: test
  namespace: frr-k8s-system
spec:
  bgp:
    routers:
    - asn: 64512
      neighbors:
      - address: 172.18.0.5
          asn: 64512
          port: 179
          toReceive:
            allowed:
              prefixes:
              - prefix: 192.168.1.0/24
              - prefix: 192.169.2.0/24
                ge: 25
le: 28 The following example configures FRR to handle all the prefixes announced:
Example FRRConfiguration CR
apiVersion: frrk8s.metallb.io/v1beta1
kind: FRRConfiguration
metadata:
  name: test
  namespace: frr-k8s-system
spec:
  bgp:
    routers:
    - asn: 64512
      neighbors:
      - address: 172.18.0.5
          asn: 64512
          port: 179
          toReceive:
            allowed:
              mode: all
6.1.2.4. The bgp field
You can use the bgp field to define various BFD profiles and associate them with a neighbor. In the following example, BFD backs up the BGP session and FRR can detect link failures:
Example FRRConfiguration CR
apiVersion: frrk8s.metallb.io/v1beta1
kind: FRRConfiguration
metadata:
  name: test
  namespace: frr-k8s-system
spec:
  bgp:
    routers:
    - asn: 64512
      neighbors:
      - address: 172.30.0.3
        asn: 64512
        port: 180
        bfdProfile: defaultprofile
    bfdProfiles:
      - name: defaultprofile
6.1.2.5. The nodeSelector field
By default, FRR-K8s applies the configuration to all nodes where the daemon is running. You can use the nodeSelector field to specify the nodes to which you want to apply the configuration. For example:
Example FRRConfiguration CR
apiVersion: frrk8s.metallb.io/v1beta1
kind: FRRConfiguration
metadata:
  name: test
  namespace: frr-k8s-system
spec:
  bgp:
    routers:
    - asn: 64512
  nodeSelector:
    labelSelector:
    foo: "bar"
6.1.2.6. The interface field
The spec.bgp.routers.neighbors.interface field is a Technology Preview feature only. Technology Preview features are not supported with Red Hat production service level agreements (SLAs) and might not be functionally complete. Red Hat does not recommend using them in production. These features provide early access to upcoming product features, enabling customers to test functionality and provide feedback during the development process.
For more information about the support scope of Red Hat Technology Preview features, see Technology Preview Features Support Scope.
You can use the interface field to configure unnumbered BGP peering by using the following example configuration:
Example FRRConfiguration CR
apiVersion: frrk8s.metallb.io/v1beta1
kind: FRRConfiguration
metadata:
  name: test
  namespace: frr-k8s-system
spec:
  bgp:
    bfdProfiles:
    - echoMode: false
      name: simple
      passiveMode: false
    routers:
    - asn: 64512
      neighbors:
      - asn: 64512
        bfdProfile: simple
        disableMP: false
        interface: net10
        port: 179
        toAdvertise:
          allowed:
            mode: filtered
            prefixes:
            - 5.5.5.5/32
        toReceive:
          allowed:
            mode: filtered
      prefixes:
- 5.5.5.5/32- 1
- Activates unnumbered BGP peering.
To use the interface field, you must establish a point-to-point, layer 2 connection between the two BGP peers. You can use unnumbered BGP peering with IPv4, IPv6, or dual-stack, but you must enable IPv6 RAs (Router Advertisements). Each interface is limited to one BGP connection.
If you use this field, you cannot specify a value in the spec.bgp.routers.neighbors.address field.
The fields for the FRRConfiguration custom resource are described in the following table:
| Field | Type | Description |
|---|---|---|
|
|
| Specifies the routers that FRR is to configure (one per VRF). |
|
|
| The Autonomous System Number (ASN) to use for the local end of the session. |
|
|
|
Specifies the ID of the |
|
|
| Specifies the host vrf used to establish sessions from this router. |
|
|
| Specifies the neighbors to establish BGP sessions with. |
|
|
|
Specifies the ASN to use for the remote end of the session. If you use this field, you cannot specify a value in the |
|
|
|
Detects the ASN to use for the remote end of the session without explicitly setting it. Specify |
|
|
|
Specifies the IP address to establish the session with. If you use this field, you cannot specify a value in the |
|
|
|
Specifies the interface name to use when establishing a session. Use this field to configure unnumbered BGP peering. There must be a point-to-point, layer 2 connection between the two BGP peers. You can use unnumbered BGP peering with IPv4, IPv6, or dual-stack, but you must enable IPv6 RAs (Router Advertisements). Each interface is limited to one BGP connection. The |
|
|
| Specifies the port to dial when establishing the session. Defaults to 179. |
|
|
|
Specifies the password to use for establishing the BGP session. |
|
|
|
Specifies the name of the authentication secret for the neighbor. The secret must be of type "kubernetes.io/basic-auth", and in the same namespace as the FRR-K8s daemon. The key "password" stores the password in the secret. |
|
|
| Specifies the requested BGP hold time, per RFC4271. Defaults to 180s. |
|
|
|
Specifies the requested BGP keepalive time, per RFC4271. Defaults to |
|
|
| Specifies how long BGP waits between connection attempts to a neighbor. |
|
|
| Indicates if the BGPPeer is multi-hops away. |
|
|
| Specifies the name of the BFD Profile to use for the BFD session associated with the BGP session. If not set, the BFD session is not set up. |
|
|
| Represents the list of prefixes to advertise to a neighbor, and the associated properties. |
|
|
| Specifies the list of prefixes to advertise to a neighbor. This list must match the prefixes that you define in the router. |
|
|
|
Specifies the mode to use when handling the prefixes. You can set to |
|
|
| Specifies the prefixes associated with an advertised local preference. You must specify the prefixes associated with a local preference in the prefixes allowed to be advertised. |
|
|
| Specifies the prefixes associated with the local preference. |
|
|
| Specifies the local preference associated with the prefixes. |
|
|
| Specifies the prefixes associated with an advertised BGP community. You must include the prefixes associated with a local preference in the list of prefixes that you want to advertise. |
|
|
| Specifies the prefixes associated with the community. |
|
|
| Specifies the community associated with the prefixes. |
|
|
| Specifies the prefixes to receive from a neighbor. |
|
|
| Specifies the information that you want to receive from a neighbor. |
|
|
| Specifies the prefixes allowed from a neighbor. |
|
|
|
Specifies the mode to use when handling the prefixes. When set to |
|
|
| Disables MP BGP to prevent it from separating IPv4 and IPv6 route exchanges into distinct BGP sessions. |
|
|
| Specifies all prefixes to advertise from this router instance. |
|
|
| Specifies the list of bfd profiles to use when configuring the neighbors. |
|
|
| The name of the BFD Profile to be referenced in other parts of the configuration. |
|
|
|
Specifies the minimum interval at which this system can receive control packets, in milliseconds. Defaults to |
|
|
|
Specifies the minimum transmission interval, excluding jitter, that this system wants to use to send BFD control packets, in milliseconds. Defaults to |
|
|
| Configures the detection multiplier to determine packet loss. To determine the connection loss-detection timer, multiply the remote transmission interval by this value. |
|
|
|
Configures the minimal echo receive transmission-interval that this system can handle, in milliseconds. Defaults to |
|
|
| Enables or disables the echo transmission mode. This mode is disabled by default, and not supported on multihop setups. |
|
|
| Mark session as passive. A passive session does not attempt to start the connection and waits for control packets from peers before it begins replying. |
|
|
| For multihop sessions only. Configures the minimum expected TTL for an incoming BFD control packet. |
|
|
| Limits the nodes that attempt to apply this configuration. If specified, only those nodes whose labels match the specified selectors attempt to apply the configuration. If it is not specified, all nodes attempt to apply this configuration. |
|
|
| Defines the observed state of FRRConfiguration. |
6.2. Enabling BGP routing
As a cluster administrator, you can enable OVN-Kubernetes Border Gateway Protocol (BGP) routing support for your cluster.
6.2.1. Enabling Border Gateway Protocol (BGP) routing
As a cluster administrator, you can enable Border Gateway Protocol (BGP) routing support for your cluster on bare-metal infrastructure.
If you are using BGP routing in conjunction with the MetalLB Operator, the necessary BGP routing support is enabled automatically. You do not need to manually enable BGP routing support.
6.2.1.1. Enabling BGP routing support
As a cluster administrator, you can enable BGP routing support for your cluster.
Prerequisites
-
You have installed the OpenShift CLI (
oc). -
You are logged in to the cluster as a user with the
cluster-adminrole. - The cluster is installed on compatible infrastructure.
Procedure
To enable a dynamic routing provider, enter the following command:
$ oc patch Network.operator.openshift.io/cluster --type=merge -p '{
  "spec": {
    "additionalRoutingCapabilities": {
      "providers": ["FRR"]
    }
  }
}'
6.3. Disabling BGP routing
As a cluster administrator, you can enable OVN-Kubernetes Border Gateway Protocol (BGP) routing support for your cluster.
6.3.1. Disabling Border Gateway Protocol (BGP) routing
As a cluster administrator, you can disable Border Gateway Protocol (BGP) routing support for your cluster on bare-metal infrastructure.
6.3.1.1. Disabling BGP routing support
As a cluster administrator, you can disable BGP routing support for your cluster.
Prerequisites
-
You have installed the OpenShift CLI (
oc). -
You are logged in to the cluster as a user with the
cluster-adminrole. - The cluster is installed on compatible infrastructure.
Procedure
To disable dynamic routing, enter the following command:
$ oc patch Network.operator.openshift.io/cluster --type=merge -p '{
  "spec": { "additionalRoutingCapabilities": null }
}'
6.4. Migrating FRR-K8s resources
All user-created FRR-K8s custom resources (CRs) in the metallb-system namespace under OpenShift Container Platform 4.17 and earlier releases must be migrated to the openshift-frr-k8s namespace. As a cluster administrator, complete the steps in this procedure to migrate your FRR-K8s custom resources.
6.4.1. Migrating FRR-K8s resources
You can migrate the FRR-K8s FRRConfiguration custom resources from the metallb-system namespace to the openshift-frr-k8s namespace.
Prerequisites
-
You have installed the OpenShift CLI (
oc). -
You are logged in to the cluster as a user with the
cluster-adminrole.
Procedure
When upgrading from an earlier version of OpenShift Container Platform with the Metal LB Operator deployed, you must manually migrate your custom FRRConfiguration configurations from the metallb-system namespace to the openshift-frr-k8s namespace. To move these CRs, enter the following commands:
To create the
openshift-frr-k8snamespace, enter the following command:$ oc create namespace openshift-frr-k8sTo automate the migration, create a shell script named
migrate.shwith the following contents:#!/bin/bash OLD_NAMESPACE="metallb-system" NEW_NAMESPACE="openshift-frr-k8s" FILTER_OUT="metallb-" oc get frrconfigurations.frrk8s.metallb.io -n "${OLD_NAMESPACE}" -o json |\ jq -r '.items[] | select(.metadata.name | test("'"${FILTER_OUT}"'") | not)' |\ jq -r '.metadata.namespace = "'"${NEW_NAMESPACE}"'"' |\ oc create -f -To execute the migration, run the following command:
$ bash migrate.sh
Verification
To confirm that the migration succeeded, run the following command:
$ oc get frrconfigurations.frrk8s.metallb.io -n openshift-frr-k8s
After the migration is complete, you can remove the FRRConfiguration custom resources from the metallb-system namespace.
Chapter 7. Route advertisements
7.1. About route advertisements
To simplify network management and improve failover visibility, you can use route advertisements to share pod and egress IP routes between your cluster and the provider network. This feature requires the OVN-Kubernetes plugin and a Border Gateway Protocol (BGP) provider.
For more information, see About BGP routing.
7.1.1. Advertise cluster network routes with Border Gateway Protocol
To simplify routing and improve failover visibility without manual route management, you can enable route advertisements. Route advertisements allow you to advertise default and user-defined network routes, including EgressIPs, between your cluster and the provider network.
With route advertisements enabled, you can advertise network routes for the default pod network and user-defined networks to the provider network, including EgressIPs, and importing routes from the provider network to the default pod network and CUDNs. This simplifies routing while improving failover visibility, and eliminates manual route management.
From the provider network, IP addresses advertised from the default pod network and user defined networks can be reached directly and vice versa.
For example, you can import routes to the default pod network so you no longer need to manually configure routes on each node. Previously, you might have been setting the routingViaHost parameter to true and manually configuring routes on each node to approximate a similar configuration. With route advertisements you can accomplish this task seamlessly with routingViaHost parameter set to false.
You could also set the routingViaHost parameter to true in the Network custom resource CR for your cluster, but you must then manually configure routes on each node to simulate a similar configuration. When you enable route advertisements, you can set routingViaHost=false in the Network CR without having to then manually configure routes one each node.
Route reflectors on the provider network are supported and can reduce the number of BGP connections required to advertise routes on large networks.
If you use EgressIPs with route advertisements enabled, the layer 3 provider network is aware of EgressIP failovers. This means that you can locate cluster nodes that host EgressIPs on different layer 2 segments whereas before only the layer 2 provider network was aware so that required all the egress nodes to be on the same layer 2 segment.
7.1.1.1. Supported platforms
Advertising routes with border gateway protocol (BGP) is supported on the bare-metal infrastructure type.
7.1.1.2. Infrastructure requirements
To use route advertisements, you must have configured BGP for your network infrastructure. Outages or misconfigurations of your network infrastructure might cause disruptions to your cluster network.
7.1.1.3. Compatibility with other networking features
Route advertisements support the following OpenShift Container Platform Networking features:
- Multiple external gateways (MEG)
- MEG is not supported with this feature.
- EgressIPs
Supports the use and advertisement of EgressIPs. The node where an egress IP address resides advertises the EgressIP. An egress IP address must be on the same layer 2 network subnet as the egress node. The following limitations apply:
- Advertising EgressIPs from a user-defined network (CUDN) operating in layer 2 mode are not supported.
- Advertising EgressIPs for a network that has both egress IP addresses assigned to the primary network interface and egress IP addresses assigned to additional network interfaces is impractical. All EgressIPs are advertised on all of the BGP sessions of the selected FRRConfiguration instances, regardless of whether these sessions are established over the same interface that the EgressIP is assigned to or not, potentially leading to unwanted advertisements.
- Services
- Works with the MetalLB Operator to advertise services to the provider network.
- Egress service
- Full support.
- Egress firewall
- Full support.
- Egress QoS
- Full support.
- Network policies
- Full support.
- Direct pod ingress
- Full support for the default cluster network and cluster user-defined (CUDN) networks.
7.1.1.4. Considerations for use with the MetalLB Operator
The MetalLB Operator is installed as an add-on to the cluster. Deployment of the MetalLB Operator automatically enables FRR-K8s as an additional routing capability provider. This feature and the MetalLB Operator use the same FRR-K8s deployment.
7.1.1.5. Considerations for naming cluster user-defined networks (CUDNs)
When referencing a VRF device in a FRRConfiguration CR, the VRF name is the same as the CUDN name for VRF names that are less than or equal to 15 characters. It is recommended to use a VRF name no longer than 15 characters so that the VRF name can be inferred from the CUDN name.
7.1.1.6. BGP routing custom resources
The following custom resources (CRs) are used to configure route advertisements with BGP:
RouteAdvertisements-
This CR defines the advertisements for the BGP routing. From this CR, the OVN-Kubernetes controller generates a
FRRConfigurationobject that configures the FRR daemon to advertise cluster network routes. This CR is cluster scoped. FRRConfiguration-
This CR is used to define BGP peers and to configure route imports from the provider network into the cluster network. Before applying
RouteAdvertisementsobjects, at least one FRRConfiguration object must be initially defined to configure the BGP peers. This CR is namespaced.
7.1.1.7. OVN-Kubernetes controller generation of FRRConfiguration objects
An FRRConfiguration object is generated for each network and node selected by a RouteAdvertisements CR with the appropriate advertised prefixes that apply to each node. The OVN-Kubernetes controller checks whether the RouteAdvertisements-CR-selected nodes are a subset of the nodes that are selected by the RouteAdvertisements-CR-selected FRR configurations.
Any filtering or selection of prefixes to receive are not considered in FRRConfiguration objects that are generated from the RouteAdvertisement CRs. Configure any prefixes to receive on other FRRConfiguration objects. OVN-Kubernetes imports routes from the VRF into the appropriate network.
7.1.1.8. Cluster Network Operator configuration
The Cluster Network Operator (CNO) API exposes several fields to configure route advertisements:
-
spec.additionalRoutingCapabilities.providers: Specifies an additional routing provider, which is required to advertise routes. The only supported value isFRR, which enables deployment of the FRR-K8S daemon for the cluster. When enabled, the FRR-K8S daemon is deployed on all nodes. -
spec.defaultNetwork.ovnKubernetesConfig.routeAdvertisements: Enables route advertisements for the default cluster network and CUDN networks. Thespec.additionalRoutingCapabilitiesfield must be set toFRRto enable this feature.
7.1.2. RouteAdvertisements object configuration
To control how cluster networks and egress IP addresses are advertised to external routers, configure the cluster-scoped RouteAdvertisements object to specify networks and select the appropriate nodes and routing targets for your environment.
You can define an RouteAdvertisements object, which is cluster scoped, with the following properties.
The fields for the RouteAdvertisements custom resource (CR) are described in the following table:
| Field | Type | Description |
|---|---|---|
|
|
|
Specifies the name of the |
|
|
|
Specifies an array that can contain a list of different types of networks to advertise. Supports only the |
|
|
|
Determines which |
|
|
| Specifies which networks to advertise among default cluster network and cluster user defined networks (CUDNs). |
|
|
|
Limits the advertisements to selected nodes. When |
|
|
|
Determines which router to advertise the routes in. Routes are advertised on the routers associated with this virtual routing and forwarding (VRF) target, as specified on the selected |
7.1.3. Examples advertising pod IP addresses with BGP
To implement Border Gateway Protocol (BGP) for your cluster, you can use these examples to configure route advertisements for pod IP addresses and egress IP addresses. Examples include configurations for default cluster networks, user-defined networks, and VRF-lite designs.
The following examples describe several configurations for advertising pod IP addresses and EgressIPs with Border Gateway Protocol (BGP). The external network border router has the 172.18.0.5 IP address. These configures assume that you have configured an external route reflector that can relay routes to all nodes on the cluster network.
7.1.3.1. Advertising the default cluster network
In this scenario, the default cluster network is exposed to the external network so that pod IP addresses and EgressIPs are advertised to the provider network.
This scenario relies upon the following FRRConfiguration object:
FRRConfiguration CR
apiVersion: k8s.ovn.org/v1
kind: RouteAdvertisements
metadata:
  name: default
spec:
  advertisements:
  - PodNetwork
  - EgressIP
  networkSelectors:
  - networkSelectionType: DefaultNetwork
  frrConfigurationSelector:
    matchLabels:
      routeAdvertisements: receive-all
  nodeSelector: {}
When the OVN-Kubernetes controller sees this RouteAdvertisements CR, it generates further FRRConfiguration objects based on the selected ones that configure the FRR daemon to advertise the routes for the default cluster network.
An example of a FRRConfiguration CR generated by OVN-Kubernetes
apiVersion: frrk8s.metallb.io/v1beta1
kind: FRRConfiguration
metadata:
  name: ovnk-generated-abcdef
  namespace: openshift-frr-k8s
spec:
  bgp:
    routers:
    - asn: 64512
      neighbors:
        - address: 172.18.0.5
          asn: 64512
          toReceive:
            allowed:
              mode: filtered
          toAdvertise:
            allowed:
              prefixes:
              - <default_network_host_subnet>
      prefixes:
      - <default_network_host_subnet>
  nodeSelector:
    matchLabels:
      kubernetes.io/hostname: ovn-worker
In the example generated FRRConfiguration object, <default_network_host_subnet> is the subnet of the default cluster network that is advertised to the provider network.
7.1.3.2. Advertising pod IPs from a cluster user-defined network over BGP
In this scenario, the blue cluster user-defined network (CUDN) is exposed to the external network so that the network’s pod IP addresses and EgressIPs are advertised to the provider network.
This scenario relies upon the following FRRConfiguration object:
FRRConfiguration CR
apiVersion: frrk8s.metallb.io/v1beta1
kind: FRRConfiguration
metadata:
  name: receive-all
  namespace: openshift-frr-k8s
  labels:
    routeAdvertisements: receive-all
spec:
  bgp:
    routers:
    - asn: 64512
      neighbors:
      - address: 172.18.0.5
        asn: 64512
        disableMP: true
        toReceive:
          allowed:
            mode: all
With this FRRConfiguration object, routes will be imported from neighbor 172.18.0.5 into the default VRF and are available to the default cluster network.
The CUDNs are advertised over the default VRF as illustrated in the following diagram:

- Red CUDN
-
A VRF named
redassociated with a CUDN namedred -
A subnet of
10.0.0.0/24
-
A VRF named
- Blue CUDN
-
A VRF named
blueassociated with a CUDN namedblue -
A subnet of
10.0.1.0/24
-
A VRF named
In this configuration, two separate CUDNs are defined. The red network covers the 10.0.0.0/24 subnet and the blue network covers the 10.0.1.0/24 subnet. The red and blue networks are labeled as export: true.
The following RouteAdvertisements CR describes the configuration for the red and blue tenants:
RouteAdvertisements CR for the red and blue tenants
apiVersion: k8s.ovn.org/v1
kind: RouteAdvertisements
metadata:
  name: advertise-cudns
spec:
  advertisements:
  - PodNetwork
  - EgressIP
  networkSelectors:
  - networkSelectionType: ClusterUserDefinedNetworks
    clusterUserDefinedNetworkSelector:
      networkSelector:
        matchLabels:
          export: "true"
  frrConfigurationSelector:
    matchLabels:
      routeAdvertisements: receive-all
  nodeSelector: {}
When the OVN-Kubernetes controller sees this RouteAdvertisements CR, it generates further FRRConfiguration objects based on the selected ones that configure the FRR daemon to advertise the routes. The following example is of one such configuration object, with the number of FRRConfiguration objects created depending on the node and networks selected.
An example of a FRRConfiguration CR generated by OVN-Kubernetes
apiVersion: frrk8s.metallb.io/v1beta1
kind: FRRConfiguration
metadata:
  name: ovnk-generated-abcdef
  namespace: openshift-frr-k8s
spec:
  bgp:
    routers:
    - asn: 64512
      vrf: blue
      imports:
      - vrf: default
    - asn: 64512
      neighbors:
        - address: 172.18.0.5
          asn: 64512
          toReceive:
            allowed:
              mode: filtered
          toAdvertise:
            allowed:
              prefixes:
              - 10.0.1.0/24
      prefixes:
      - 10.0.1.0/24
      imports:
      - vrf: blue
  nodeSelector:
    matchLabels:
      kubernetes.io/hostname: ovn-worker
The generated FRRConfiguration object configures the subnet 10.0.1.0/24, which belongs to network blue, to be imported into the default VRF and advertised to the 172.18.0.5 neighbor. An FRRConfiguration object is generated for each network and nodes selected by a RouteAdvertisements CR with the appropriate prefixes that apply to each node.
When the targetVRF field is omitted, the routes are leaked and advertised over the default VRF. Additionally, routes that were imported to the default VRF after the definition of the initial FRRConfiguration object are also imported into the blue VRF.
7.1.3.3. Advertising pod IPs from a cluster user-defined network over BGP with VPN
In this scenario, a VLAN interface is attached to the VRF device associated with the blue network. This setup provides a VRF lite design, where FRR-K8S is used to advertise the blue network only over the corresponding BGP session on the blue network VRF/VLAN link to the next hop Provide Edge (PE) router. The red tenant uses the same configuration. The blue and red networks are labeled as export: true.
This scenario does not support the use of EgressIPs.
The following diagram illustrates this configuration:
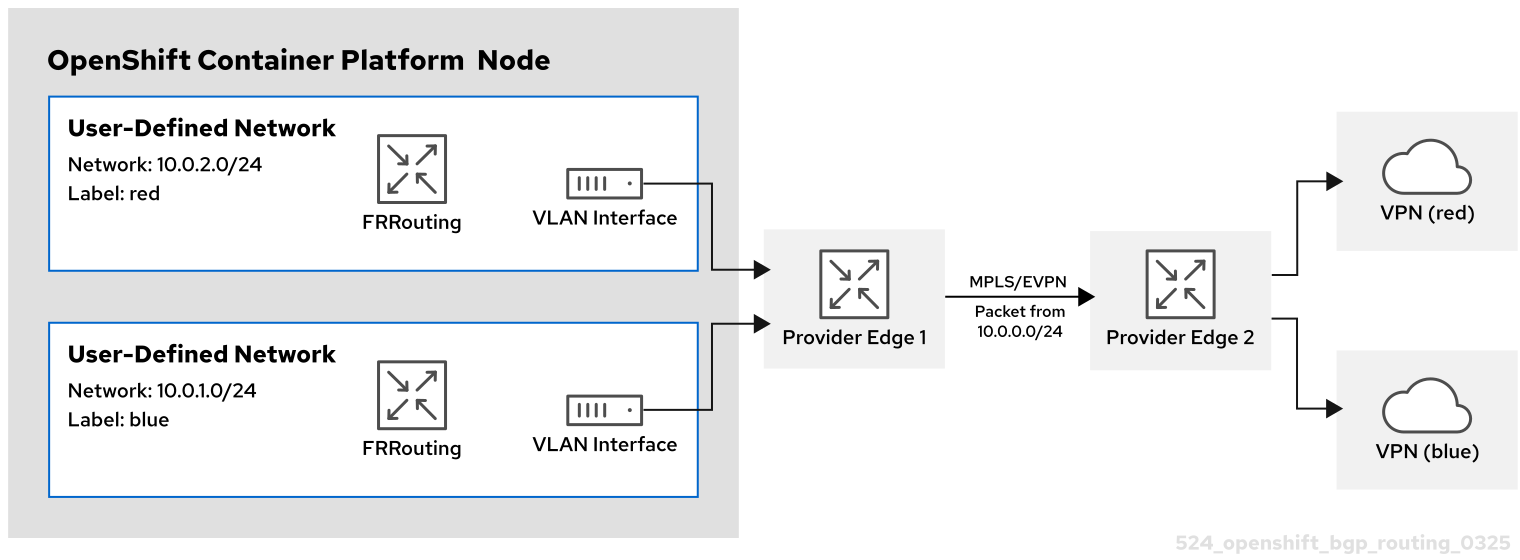
- Red CUDN
-
A VRF named
redassociated with a CUDN namedred - A VLAN interface attached to the VRF device and connected to the external PE router
-
An assigned subnet of
10.0.2.0/24
-
A VRF named
- Blue CUDN
-
A VRF named
blueassociated with a CUDN namedblue - A VLAN interface attached to the VRF device and connected to the external PE router
-
An assigned subnet of
10.0.1.0/24
-
A VRF named
This approach is available only when you set routingViaHost=true in the ovnKubernetesConfig.gatewayConfig specification of the OVN-Kubernetes network plugin.
In the following configuration, an additional FRRConfiguration CR configures peering with the PE router on the blue and red VLANs:
FRRConfiguration CR manually configured for BGP VPN setup
apiVersion: frrk8s.metallb.io/v1beta1
kind: FRRConfiguration
metadata:
  name: vpn-blue-red
  namespace: openshift-frr-k8s
  labels:
    routeAdvertisements: vpn-blue-red
spec:
  bgp:
    routers:
    - asn: 64512
      vrf: blue
      neighbors:
      - address: 182.18.0.5
        asn: 64512
        toReceive:
          allowed:
            mode: filtered
    - asn: 64512
      vrf: red
      neighbors:
      - address: 192.18.0.5
        asn: 64512
        toReceive:
          allowed:
            mode: filtered
The following RouteAdvertisements CR describes the configuration for the blue and red tenants:
RouteAdvertisements CR for the blue and red tenants
apiVersion: k8s.ovn.org/v1
kind: RouteAdvertisements
metadata:
  name: advertise-vrf-lite
spec:
  targetVRF: auto
  advertisements:
  - "PodNetwork"
  nodeSelector: {}
  frrConfigurationSelector:
    matchLabels:
      routeAdvertisements: vpn-blue-red
  networkSelectors:
  - networkSelectionType: ClusterUserDefinedNetworks
    clusterUserDefinedNetworkSelector:
      networkSelector:
        matchLabels:
          export: "true"
In the RouteAdvertisements CR, the targetVRF is set to auto so that advertisements occur within the VRF device that corresponds to the individual networks that are selected. In this scenario, the pod subnet for blue is advertised over the blue VRF device, and the pod subnet for red is advertised over the red VRF device. Additionally, each BGP session imports routes to only the corresponding CUDN VRF as defined by the initial FRRConfiguration object.
When the OVN-Kubernetes controller sees this RouteAdvertisements CR, it generates further FRRConfiguration objects based on the selected ones that configure the FRR daemon to advertise the routes for the blue and red tenants.
FRRConfiguration CR generated by OVN-Kubernetes for blue and red tenants
apiVersion: frrk8s.metallb.io/v1beta1
kind: FRRConfiguration
metadata:
  name: ovnk-generated-abcde
  namespace: openshift-frr-k8s
spec:
  bgp:
    routers:
    - asn: 64512
      neighbors:
      - address: 182.18.0.5
        asn: 64512
        toReceive:
          allowed:
            mode: filtered
        toAdvertise:
          allowed:
            prefixes:
            - 10.0.1.0/24
      vrf: blue
      prefixes:
        - 10.0.1.0/24
    - asn: 64512
      neighbors:
      - address: 192.18.0.5
        asn: 64512
        toReceive:
          allowed:
            mode: filtered
        toAdvertise:
          allowed:
            prefixes:
            - 10.0.2.0/24
      vrf: red
      prefixes:
         - 10.0.2.0/24
  nodeSelector:
     matchLabels:
        kubernetes.io/hostname: ovn-worker
In this scenario, any filtering or selection of routes to receive must be done in the FRRConfiguration CR that defines peering relationships.
7.2. Enabling route advertisements
To improve network reachability and failover visibility for your cluster, you can enable route advertisements for pod and egress IP addresses. This configuration requires the OVN-Kubernetes network plugin and allows your cluster to share routes with an external provider network.
As a cluster administrator, you can configure additional route advertisements for your cluster. You must use the OVN-Kubernetes network plugin.
7.2.1. Enabling route advertisements
To improve network reachability and failover visibility, you can enable additional routing support for your cluster. You can enable route advertisements to manage network traffic within your environment.
Prerequisites
-
You have installed the OpenShift CLI (
oc). -
You are logged in to the cluster as a user with the
cluster-adminrole. - The cluster is installed on compatible infrastructure.
Procedure
To enable a routing provider and additional route advertisements, enter the following command:
$ oc patch Network.operator.openshift.io cluster --type=merge \
  -p='{
    "spec": {
      "additionalRoutingCapabilities": {
        "providers": ["FRR"]
        },
        "defaultNetwork": {
          "ovnKubernetesConfig": {
            "routeAdvertisements": "Enabled"
    }}}}'
7.3. Disabling route advertisements
To stop the broadcast of cluster network routes and egress IP addresses to your provider network, you can disable route advertisements. Disabling this feature removes the automatically generated routing configurations while maintaining your existing network infrastructure.
7.3.1. Disabling route advertisements
To prevent your cluster from advertising additional routes to the network, you must disable the route advertisements feature in the network operator configuration. You can disable route advertisements to manage network traffic and maintain security within your environment.
Prerequisites
-
You have installed the OpenShift CLI (
oc). -
You are logged in to the cluster as a user with the
cluster-adminrole. - The cluster is installed on compatible infrastructure.
Procedure
To disable additional routing support, enter the following command:
$ oc patch network.operator cluster -p '{
  "spec": {
    "defaultNetwork": {
      "ovnKubernetesConfig": {
        "routeAdvertisements": "Disabled"
      }
    }
  }
}'
7.4. Example route advertisements setup
To learn how to implement a route reflection setup on bare-metal infrastructure, you can follow this sample configuration. This example demonstrates how to enable the necessary feature gates and configure objects to advertise pod and egress IP routes.
As a cluster administrator, you can configure the following example route advertisements setup for your cluster. This configuration is intended as a sample that demonstrates how to configure route advertisements.
7.4.1. Sample route advertisements setup
You can implement Border Gateway Protocol (BGP) routing by using a sample configuration to set up route advertisements for your cluster. This configuration demonstrates how to configure route reflection on bare-metal infrastructure to share pod and egress IP routes.
As a cluster administrator, you can enable Border Gateway Protocol (BGP) routing support for your cluster. The configuration uses route reflection rather than a full mesh setup.
BGP routing is supported only on bare-metal infrastructure.
Prerequisites
-
You installed the OpenShift CLI (
oc). -
You are logged in to the cluster as a user with
cluster-adminprivileges. - The cluster is installed on bare-metal infrastructure.
- You have a bare-metal system with access to the cluster where you plan to run the FRR daemon container.
Procedure
Confirm that the
RouteAdvertisementsfeature gate is enabled by running the following command:$ oc get featuregate -oyaml | grep -i routeadvertisementExample output
- name: RouteAdvertisementsConfigure the Cluster Network Operator (CNO) by running the following command:
$ oc patch Network.operator.openshift.io cluster --type=merge \
  -p='
    {"spec":{
      "additionalRoutingCapabilities": {
        "providers": ["FRR"]},
        "defaultNetwork":{"ovnKubernetesConfig"{
          "routeAdvertisements":"Enabled"
          }}}}'
It might take a few minutes for the CNO to restart all nodes.
Get the IP addresses of the nodes by running the following command:
$ oc get node -owideExample output
NAME                                       STATUS   ROLES                  AGE   VERSION   INTERNAL-IP      EXTERNAL-IP   OS-IMAGE                                                KERNEL-VERSION                 CONTAINER-RUNTIME
master-0                                   Ready    control-plane,master   27h   v1.31.3   192.168.111.20   <none>        Red Hat Enterprise Linux CoreOS 418.94.202501062026-0   5.14.0-427.50.1.el9_4.x86_64   cri-o://1.31.4-2.rhaos4.18.git33d7598.el9
master-1                                   Ready    control-plane,master   27h   v1.31.3   192.168.111.21   <none>        Red Hat Enterprise Linux CoreOS 418.94.202501062026-0   5.14.0-427.50.1.el9_4.x86_64   cri-o://1.31.4-2.rhaos4.18.git33d7598.el9
master-2                                   Ready    control-plane,master   27h   v1.31.3   192.168.111.22   <none>        Red Hat Enterprise Linux CoreOS 418.94.202501062026-0   5.14.0-427.50.1.el9_4.x86_64   cri-o://1.31.4-2.rhaos4.18.git33d7598.el9
worker-0                                   Ready    worker                 27h   v1.31.3   192.168.111.23   <none>        Red Hat Enterprise Linux CoreOS 418.94.202501062026-0   5.14.0-427.50.1.el9_4.x86_64   cri-o://1.31.4-2.rhaos4.18.git33d7598.el9
worker-1                                   Ready    worker                 27h   v1.31.3   192.168.111.24   <none>        Red Hat Enterprise Linux CoreOS 418.94.202501062026-0   5.14.0-427.50.1.el9_4.x86_64   cri-o://1.31.4-2.rhaos4.18.git33d7598.el9
worker-2                                   Ready    worker                 27h   v1.31.3   192.168.111.25   <none>        Red Hat Enterprise Linux CoreOS 418.94.202501062026-0   5.14.0-427.50.1.el9_4.x86_64   cri-o://1.31.4-2.rhaos4.18.git33d7598.el9
Get the default pod network of each node by running the following command:
$ oc get node <node_name> -o=jsonpath={.metadata.annotations.k8s\\.ovn\\.org/node-subnets}Example output
{"default":["10.129.0.0/23"],"ns1.udn-network-primary-layer3":["10.150.6.0/24"]}On the bare-metal hypervisor, get the IP address for the external FRR container to use by running the following command:
$ ip -j -d route get <a cluster node's IP> | jq -r '.[] | .dev' | xargs ip -d -j address show | jq -r '.[] | .addr_info[0].local'Create a
frr.conffile for FRR that includes each node’s IP address, as shown in the following example:Example
frr.confconfiguration filerouter bgp 64512 no bgp default ipv4-unicast no bgp default ipv6-unicast no bgp network import-check neighbor 192.168.111.20 remote-as 64512 neighbor 192.168.111.20 route-reflector-client neighbor 192.168.111.21 remote-as 64512 neighbor 192.168.111.21 route-reflector-client neighbor 192.168.111.22 remote-as 64512 neighbor 192.168.111.22 route-reflector-client neighbor 192.168.111.40 remote-as 64512 neighbor 192.168.111.40 route-reflector-client neighbor 192.168.111.47 remote-as 64512 neighbor 192.168.111.47 route-reflector-client neighbor 192.168.111.23 remote-as 64512 neighbor 192.168.111.23 route-reflector-client neighbor 192.168.111.24 remote-as 64512 neighbor 192.168.111.24 route-reflector-client neighbor 192.168.111.25 remote-as 64512 neighbor 192.168.111.25 route-reflector-client address-family ipv4 unicast network 192.168.1.0/24 network 192.169.1.1/32 exit-address-family address-family ipv4 unicast neighbor 192.168.111.20 activate neighbor 192.168.111.20 next-hop-self neighbor 192.168.111.21 activate neighbor 192.168.111.21 next-hop-self neighbor 192.168.111.22 activate neighbor 192.168.111.22 next-hop-self neighbor 192.168.111.40 activate neighbor 192.168.111.40 next-hop-self neighbor 192.168.111.47 activate neighbor 192.168.111.47 next-hop-self neighbor 192.168.111.23 activate neighbor 192.168.111.23 next-hop-self neighbor 192.168.111.24 activate neighbor 192.168.111.24 next-hop-self neighbor 192.168.111.25 activate neighbor 192.168.111.25 next-hop-self exit-address-family neighbor remote-as 64512 neighbor route-reflector-client address-family ipv6 unicast network 2001:db8::/128 exit-address-family address-family ipv6 unicast neighbor activate neighbor next-hop-self exit-address-familyCreate a file named
daemonsthat includes the following content:Example
daemonsconfiguration file# This file tells the frr package which daemons to start. # # Sample configurations for these daemons can be found in # /usr/share/doc/frr/examples/. # # ATTENTION: # # When activating a daemon for the first time, a config file, even if it is # empty, has to be present *and* be owned by the user and group "frr", else # the daemon will not be started by /etc/init.d/frr. The permissions should # be u=rw,g=r,o=. # When using "vtysh" such a config file is also needed. It should be owned by # group "frrvty" and set to ug=rw,o= though. Check /etc/pam.d/frr, too. # # The watchfrr and zebra daemons are always started. # bgpd=yes ospfd=no ospf6d=no ripd=no ripngd=no isisd=no pimd=no ldpd=no nhrpd=no eigrpd=no babeld=no sharpd=no pbrd=no bfdd=yes fabricd=no vrrpd=no # # If this option is set the /etc/init.d/frr script automatically loads # the config via "vtysh -b" when the servers are started. # Check /etc/pam.d/frr if you intend to use "vtysh"! # vtysh_enable=yes zebra_options=" -A 127.0.0.1 -s 90000000" bgpd_options=" -A 127.0.0.1" ospfd_options=" -A 127.0.0.1" ospf6d_options=" -A ::1" ripd_options=" -A 127.0.0.1" ripngd_options=" -A ::1" isisd_options=" -A 127.0.0.1" pimd_options=" -A 127.0.0.1" ldpd_options=" -A 127.0.0.1" nhrpd_options=" -A 127.0.0.1" eigrpd_options=" -A 127.0.0.1" babeld_options=" -A 127.0.0.1" sharpd_options=" -A 127.0.0.1" pbrd_options=" -A 127.0.0.1" staticd_options="-A 127.0.0.1" bfdd_options=" -A 127.0.0.1" fabricd_options="-A 127.0.0.1" vrrpd_options=" -A 127.0.0.1" # configuration profile # #frr_profile="traditional" #frr_profile="datacenter" # # This is the maximum number of FD's that will be available. # Upon startup this is read by the control files and ulimit # is called. Uncomment and use a reasonable value for your # setup if you are expecting a large number of peers in # say BGP. #MAX_FDS=1024 # The list of daemons to watch is automatically generated by the init script. #watchfrr_options="" # for debugging purposes, you can specify a "wrap" command to start instead # of starting the daemon directly, e.g. to use valgrind on ospfd: # ospfd_wrap="/usr/bin/valgrind" # or you can use "all_wrap" for all daemons, e.g. to use perf record: # all_wrap="/usr/bin/perf record --call-graph -" # the normal daemon command is added to this at the end.-
Save both the
frr.confanddaemonsfiles in the same directory, such as/tmp/frr. Create an external FRR container by running the following command:
$ sudo podman run -d --privileged --network host --rm --ulimit core=-1 --name frr --volume /tmp/frr:/etc/frr quay.io/frrouting/frr:9.1.0Create the following
FRRConfigurationandRouteAdvertisementsconfigurations:Create a
receive_all.yamlfile that includes the following content:Example
receive_all.yamlconfiguration fileapiVersion: frrk8s.metallb.io/v1beta1 kind: FRRConfiguration metadata: name: receive-all namespace: openshift-frr-k8s spec: bgp: routers: - asn: 64512 neighbors: - address: 192.168.111.1 asn: 64512 toReceive: allowed: mode: allCreate a
ra.yamlfile that includes the following content:Example
ra.yamlconfiguration fileapiVersion: k8s.ovn.org/v1 kind: RouteAdvertisements metadata: name: default spec: nodeSelector: {} frrConfigurationSelector: {} networkSelectors: - networkSelectionType: DefaultNetwork advertisements: - "PodNetwork" - "EgressIP"
Apply the
receive_all.yamlandra.yamlfiles by running the following command:$ for f in receive_all.yaml ra.yaml; do oc apply -f $f; done
Verification
Verify that the configurations were applied:
Verify that the
FRRConfigurationconfigurations were created by running the following command:$ oc get frrconfiguration -AExample output
NAMESPACE           NAME                   AGE
openshift-frr-k8s   ovnk-generated-6lmfb   4h47m
openshift-frr-k8s   ovnk-generated-bhmnm   4h47m
openshift-frr-k8s   ovnk-generated-d2rf5   4h47m
openshift-frr-k8s   ovnk-generated-f958l   4h47m
openshift-frr-k8s   ovnk-generated-gmsmw   4h47m
openshift-frr-k8s   ovnk-generated-kmnqg   4h47m
openshift-frr-k8s   ovnk-generated-wpvgb   4h47m
openshift-frr-k8s   ovnk-generated-xq7v6   4h47m
openshift-frr-k8s   receive-all            4h47m
Verify that the
RouteAdvertisementsconfigurations were created by running the following command:$ oc get ra -AExample output
NAME      STATUS
default   Accepted
Get the external FRR container ID by running the following command:
$ sudo podman ps | grep frrExample output
22cfc713890e quay.io/frrouting/frr:9.1.0 /usr/lib/frr/dock... 5 hours ago Up 5 hours ago frrUse the container ID that you obtained in the previous step to check the BGP neighbor and routes in the external FRR container’s
vtyshsession. Run the following command:$ sudo podman exec -it <container_id> vtysh -c "show ip bgp"Example output
BGP table version is 10, local router ID is 192.168.111.1, vrf id 0
Default local pref 100, local AS 64512
Status codes:  s suppressed, d damped, h history, * valid, > best, = multipath,
               i internal, r RIB-failure, S Stale, R Removed
Nexthop codes: @NNN nexthop's vrf id, < announce-nh-self
Origin codes:  i - IGP, e - EGP, ? - incomplete
RPKI validation codes: V valid, I invalid, N Not found

    Network          Next Hop            Metric LocPrf Weight Path
 *>i10.128.0.0/23    192.168.111.22           0    100      0 i
 *>i10.128.2.0/23    192.168.111.23           0    100      0 i
 *>i10.129.0.0/23    192.168.111.20           0    100      0 i
 *>i10.129.2.0/23    192.168.111.24           0    100      0 i
 *>i10.130.0.0/23    192.168.111.21           0    100      0 i
 *>i10.130.2.0/23    192.168.111.40           0    100      0 i
 *>i10.131.0.0/23    192.168.111.25           0    100      0 i
 *>i10.131.2.0/23    192.168.111.47           0    100      0 i
 *> 192.168.1.0/24   0.0.0.0                  0         32768 i
 *> 192.169.1.1/32   0.0.0.0                  0         32768 i
Find the
frr-k8spod for each cluster node by running the following command:$ oc -n openshift-frr-k8s get pod -owideExample output
NAME                                      READY   STATUS    RESTARTS   AGE   IP               NODE                                       NOMINATED NODE   READINESS GATES
frr-k8s-86wmq                             6/6     Running   0          25h   192.168.111.20   master-0                                   <none>           <none>
frr-k8s-h2wl6                             6/6     Running   0          25h   192.168.111.21   master-1                                   <none>           <none>
frr-k8s-jlbgs                             6/6     Running   0          25h   192.168.111.40   node1.example.com   <none>           <none>
frr-k8s-qc6l5                             6/6     Running   0          25h   192.168.111.25   worker-2                                   <none>           <none>
frr-k8s-qtxdc                             6/6     Running   0          25h   192.168.111.47   node2.example.com   <none>           <none>
frr-k8s-s5bxh                             6/6     Running   0          25h   192.168.111.24   worker-1                                   <none>           <none>
frr-k8s-szgj9                             6/6     Running   0          25h   192.168.111.22   master-2                                   <none>           <none>
frr-k8s-webhook-server-6cd8b8d769-kmctw   1/1     Running   0          25h   10.131.2.9       node3.example.com   <none>           <none>
frr-k8s-zwmgh                             6/6     Running   0          25h   192.168.111.23   worker-0                                   <none>           <none>
From the OpenShift Container Platform cluster, check BGP routes on the cluster node’s
frr-k8spod in the FRR container by running the following command:$ oc -n openshift-frr-k8s -c frr rsh frr-k8s-86wmqCheck the IP routes from the cluster node by running the following command:
sh-5.1# vtyshExample output
Hello, this is FRRouting (version 8.5.3).
Copyright 1996-2005 Kunihiro Ishiguro, et al.
Check the IP routes by running the following command:
worker-2# show ip bgpExample output
BGP table version is 10, local router ID is 192.168.111.25, vrf id 0
Default local pref 100, local AS 64512
Status codes:  s suppressed, d damped, h history, * valid, > best, = multipath,
               i internal, r RIB-failure, S Stale, R Removed
Nexthop codes: @NNN nexthop's vrf id, < announce-nh-self
Origin codes:  i - IGP, e - EGP, ? - incomplete
RPKI validation codes: V valid, I invalid, N Not found

    Network          Next Hop            Metric LocPrf Weight Path
 *>i10.128.0.0/23    192.168.111.22           0    100      0 i
 *>i10.128.2.0/23    192.168.111.23           0    100      0 i
 *>i10.129.0.0/23    192.168.111.20           0    100      0 i
 *>i10.129.2.0/23    192.168.111.24           0    100      0 i
 *>i10.130.0.0/23    192.168.111.21           0    100      0 i
 *>i10.130.2.0/23    192.168.111.40           0    100      0 i
 *> 10.131.0.0/23    0.0.0.0                  0         32768 i
 *>i10.131.2.0/23    192.168.111.47           0    100      0 i
 *>i192.168.1.0/24   192.168.111.1            0    100      0 i
 *>i192.169.1.1/32   192.168.111.1            0    100      0 i

Displayed  10 routes and 10 total paths
From the OpenShift Container Platform cluster, debug the node by running the following command:
$ oc debug node/<node_name>Example output
Temporary namespace openshift-debug-lbtgh is created for debugging node...
Starting pod/worker-2-debug-zrg4v ...
To use host binaries, run `chroot /host`
Pod IP: 192.168.111.25
If you don't see a command prompt, try pressing enter.
Confirm that the BGP routes are being advertised by running the following command:
sh-5.1# ip route show | grep bgpExample output
10.128.0.0/23 nhid 268 via 192.168.111.22 dev br-ex proto bgp metric 20
10.128.2.0/23 nhid 259 via 192.168.111.23 dev br-ex proto bgp metric 20
10.129.0.0/23 nhid 260 via 192.168.111.20 dev br-ex proto bgp metric 20
10.129.2.0/23 nhid 261 via 192.168.111.24 dev br-ex proto bgp metric 20
10.130.0.0/23 nhid 266 via 192.168.111.21 dev br-ex proto bgp metric 20
10.130.2.0/23 nhid 262 via 192.168.111.40 dev br-ex proto bgp metric 20
10.131.2.0/23 nhid 263 via 192.168.111.47 dev br-ex proto bgp metric 20
192.168.1.0/24 nhid 264 via 192.168.111.1 dev br-ex proto bgp metric 20
192.169.1.1 nhid 264 via 192.168.111.1 dev br-ex proto bgp metric 20
Chapter 8. Using PTP hardware
8.1. About PTP in OpenShift cluster nodes
Precision Time Protocol (PTP) is used to synchronize clocks in a network. When used in conjunction with hardware support, PTP is capable of sub-microsecond accuracy, and is more accurate than Network Time Protocol (NTP).
If your openshift-sdn cluster with PTP uses the User Datagram Protocol (UDP) for hardware time stamping and you migrate to the OVN-Kubernetes plugin, the hardware time stamping cannot be applied to primary interface devices, such as an Open vSwitch (OVS) bridge. As a result, UDP version 4 configurations cannot work with a br-ex interface.
You can configure linuxptp services and use PTP-capable hardware in OpenShift Container Platform cluster nodes.
Use the OpenShift Container Platform web console or OpenShift CLI (oc) to install PTP by deploying the PTP Operator. The PTP Operator creates and manages the linuxptp services and provides the following features:
- Discovery of the PTP-capable devices in the cluster.
-
Management of the configuration of
linuxptpservices. -
Notification of PTP clock events that negatively affect the performance and reliability of your application with the PTP Operator
cloud-event-proxysidecar.
The PTP Operator works with PTP-capable devices on clusters provisioned only on bare-metal infrastructure.
8.1.1. Elements of a PTP domain
PTP uses a leader-follower hierarchy of grandmaster, boundary, and ordinary clocks to synchronize time with high precision across network nodes.
The clocks synchronized by PTP are organized in a leader-follower hierarchy. The hierarchy is created and updated automatically by the best master clock (BMC) algorithm, which runs on every clock. Follower clocks are synchronized to leader clocks, and follower clocks can themselves be the source for other downstream clocks.
Figure 8.1. PTP nodes in the network

The three primary types of PTP clocks are described in the following sections.
- Grandmaster clock
- The grandmaster clock provides standard time information to other clocks across the network and ensures accurate and stable synchronization. It writes time stamps and responds to time requests from other clocks. Grandmaster clocks synchronize to a global navigation satellite system (GNSS) time source. The grandmaster clock is the authoritative source of time in the network and is responsible for providing time synchronization to all other devices.
- Boundary clock
- The boundary clock has ports in two or more communication paths and can be a source and a destination to other destination clocks at the same time. The boundary clock works as a destination clock upstream. The destination clock receives the timing message, adjusts for delay, and then creates a new source time signal to pass down the network. The boundary clock produces a new timing packet that is still correctly synced with the source clock and can reduce the number of connected devices reporting directly to the source clock.
- Ordinary clock
- The ordinary clock has a single port connection that can play the role of source or destination clock, depending on its position in the network. The ordinary clock can read and write timestamps.
8.1.1.1. Advantages of PTP over NTP
One of the main advantages that PTP has over NTP is the hardware support present in various network interface controllers (NIC) and network switches. The specialized hardware allows PTP to account for delays in message transfer and improves the accuracy of time synchronization. To achieve the best possible accuracy, it is recommended that all networking components between PTP clocks are PTP hardware enabled.
Hardware-based PTP provides optimal accuracy, since the NIC can timestamp the PTP packets at the exact moment they are sent and received. Compare this to software-based PTP, which requires additional processing of the PTP packets by the operating system.
Before enabling PTP, ensure that NTP is disabled for the required nodes. You can disable the chrony time service (chronyd) using a MachineConfig custom resource.
Although PTP provides superior accuracy over NTP, you can configure NTP as a backup time source for PTP Grandmaster (T-GM) clocks. In GNSS-to-NTP failover configurations, the system uses GNSS as the primary time source through PTP, but automatically fails over to NTP (chronyd) if the GNSS signal is lost or degraded. This provides resilient timekeeping even when the primary GNSS time source is temporarily unavailable. For more information about configuring GNSS-to-NTP failover, see Configuring GNSS/NTP failover.
8.1.2. Overview of linuxptp and gpsd in OpenShift Container Platform nodes
OpenShift Container Platform uses the PTP Operator with linuxptp and gpsd packages for high precision network synchronization. The linuxptp package provides tools and daemons for PTP timing in networks. Cluster hosts with Global Navigation Satellite System (GNSS) capable NICs use gpsd to interface with GNSS clock sources.
The linuxptp package includes the ts2phc, pmc, ptp4l, and phc2sys programs for system clock synchronization.
- ts2phc
ts2phcsynchronizes the PTP hardware clock (PHC) across PTP devices with a high degree of precision.ts2phcis used in grandmaster clock configurations. It receives the precision timing signal a high precision clock source such as Global Navigation Satellite System (GNSS). GNSS provides an accurate and reliable source of synchronized time for use in large distributed networks. GNSS clocks typically provide time information with a precision of a few nanoseconds.The
ts2phcsystem daemon sends timing information from the grandmaster clock to other PTP devices in the network by reading time information from the grandmaster clock and converting it to PHC format. PHC time is used by other devices in the network to synchronize their clocks with the grandmaster clock.- pmc
-
pmcimplements a PTP management client (pmc) according to IEEE standard 1588.1588.pmcprovides basic management access for theptp4lsystem daemon.pmcreads from standard input and sends the output over the selected transport, printing any replies it receives. - ptp4l
ptp4limplements the PTP boundary clock and ordinary clock and runs as a system daemon.ptp4ldoes the following:- Synchronizes the PHC to the source clock with hardware time stamping
- Synchronizes the system clock to the source clock with software time stamping
- phc2sys
-
phc2syssynchronizes the system clock to the PHC on the network interface controller (NIC). Thephc2syssystem daemon continuously monitors the PHC for timing information. When it detects a timing error, the PHC corrects the system clock.
The gpsd package includes the ubxtool, gspipe, gpsd, programs for GNSS clock synchronization with the host clock.
- ubxtool
-
ubxtoolCLI allows you to communicate with a u-blox GPS system. TheubxtoolCLI uses the u-blox binary protocol to communicate with the GPS. - gpspipe
-
gpspipeconnects togpsdoutput and pipes it tostdout. - gpsd
-
gpsdis a service daemon that monitors one or more GPS or AIS receivers connected to the host.
8.1.3. Overview of GNSS timing for PTP grandmaster clocks
OpenShift Container Platform supports receiving precision PTP timing from Global Navigation Satellite System (GNSS) sources and grandmaster clocks (T-GM) in the cluster.
OpenShift Container Platform supports PTP timing from GNSS sources with Intel E810 Westport Channel NICs only.
Figure 8.2. Overview of Synchronization with GNSS and T-GM

- Global Navigation Satellite System (GNSS)
GNSS is a satellite-based system used to provide positioning, navigation, and timing information to receivers around the globe. In PTP, GNSS receivers are often used as a highly accurate and stable reference clock source. These receivers receive signals from multiple GNSS satellites, allowing them to calculate precise time information. The timing information obtained from GNSS is used as a reference by the PTP grandmaster clock.
By using GNSS as a reference, the grandmaster clock in the PTP network can provide highly accurate timestamps to other devices, enabling precise synchronization across the entire network.
- Digital Phase-Locked Loop (DPLL)
- DPLL provides clock synchronization between different PTP nodes in the network. DPLL compares the phase of the local system clock signal with the phase of the incoming synchronization signal, for example, PTP messages from the PTP grandmaster clock. The DPLL continuously adjusts the local clock frequency and phase to minimize the phase difference between the local clock and the reference clock.
8.1.3.1. Handling leap second events in GNSS-synced PTP grandmaster clocks
A leap second is a one-second adjustment that is occasionally applied to Coordinated Universal Time (UTC) to keep it synchronized with International Atomic Time (TAI). UTC leap seconds are unpredictable. Internationally agreed leap seconds are listed in leap-seconds.list. This file is regularly updated by the International Earth Rotation and Reference Systems Service (IERS). An unhandled leap second can have a significant impact on far edge RAN networks. It can cause the far edge RAN application to immediately disconnect voice calls and data sessions.
8.1.4. About PTP and clock synchronization error events
Cloud native applications such as virtual RAN (vRAN) require access to notifications about hardware timing events that are critical to the functioning of the overall network. PTP clock synchronization errors can negatively affect the performance and reliability of your low-latency application, for example, a vRAN application running in a distributed unit (DU).
Loss of PTP synchronization is a critical error for a RAN network. If synchronization is lost on a node, the radio might be shut down and the network Over the Air (OTA) traffic might be shifted to another node in the wireless network. Fast event notifications mitigate against workload errors by allowing cluster nodes to communicate PTP clock sync status to the vRAN application running in the DU.
Event notifications are available to vRAN applications running on the same DU node. A publish/subscribe REST API passes events notifications to the messaging bus. Publish/subscribe messaging, or pub-sub messaging, is an asynchronous service-to-service communication architecture where any message published to a topic is immediately received by all of the subscribers to the topic.
The PTP Operator generates fast event notifications for every PTP-capable network interface. The consumer application can subscribe to PTP events by using the PTP events REST API v2.
PTP fast event notifications are available for network interfaces configured to use PTP ordinary clocks, PTP grandmaster clocks, or PTP boundary clocks.
8.1.5. 2-card E810 NIC configuration reference
OpenShift Container Platform supports single and dual-NIC Intel E810 hardware for PTP timing in grandmaster clocks (T-GM) and boundary clocks (T-BC).
- Dual NIC grandmaster clock
You can use a cluster host that has dual-NIC hardware as PTP grandmaster clock. One NIC receives timing information from the global navigation satellite system (GNSS). The second NIC receives the timing information from the first using the SMA1 Tx/Rx connections on the E810 NIC faceplate. The system clock on the cluster host is synchronized from the NIC that is connected to the GNSS satellite.
Dual NIC grandmaster clocks are a feature of distributed RAN (D-RAN) configurations where the Remote Radio Unit (RRU) and Baseband Unit (BBU) are located at the same radio cell site. D-RAN distributes radio functions across multiple sites, with backhaul connections linking them to the core network.
Figure 8.3. Dual NIC grandmaster clock
 Note
NoteIn a dual-NIC T-GM configuration, a single
ts2phcprogram operate on two PTP hardware clocks (PHCs), one for each NIC.- Dual NIC boundary clock
For 5G telco networks that deliver mid-band spectrum coverage, each virtual distributed unit (vDU) requires connections to 6 radio units (RUs). To make these connections, each vDU host requires 2 NICs configured as boundary clocks.
Dual NIC hardware allows you to connect each NIC to the same upstream leader clock with separate
ptp4linstances for each NIC feeding the downstream clocks.- Highly available system clock with dual-NIC boundary clocks
You can configure Intel E810-XXVDA4 Salem channel dual-NIC hardware as dual PTP boundary clocks that provide timing for a highly available system clock. This configuration is useful when you have multiple time sources on different NICs. High availability ensures that the node does not lose timing synchronization if one of the two timing sources is lost or disconnected.
Each NIC is connected to the same upstream leader clock. Highly available boundary clocks use multiple PTP domains to synchronize with the target system clock. When a T-BC is highly available, the host system clock can maintain the correct offset even if one or more
ptp4linstances syncing the NIC PHC clock fails. If any single SFP port or cable failure occurs, the boundary clock stays in sync with the leader clock.Boundary clock leader source selection is done using the A-BMCA algorithm. For more information, see ITU-T recommendation G.8275.1.
8.1.6. Using dual-port NICs to improve redundancy for PTP ordinary clocks
OpenShift Container Platform supports single-port networking interface cards (NICs) as ordinary clocks for PTP timing. To improve redundancy, you can configure a dual-port NIC with one port as active and the other as standby.
In this configuration, the ports in a dual-port NIC operate as follows:
-
The active port functions as an ordinary clock in the
Followingport state. -
The standby port remains in the
Listeningport state. - If the active port fails, the standby port transitions to active to ensure continued PTP timing synchronization.
-
If both ports become faulty, the clock state moves to the
HOLDOVERstate, then theFREERUNstate when the holdover timeout expires, before resyncing to a leader clock.
You can configure PTP ordinary clocks with added redundancy on x86 architecture nodes with dual-port NICs only.
8.1.7. 3-card Intel E810 PTP grandmaster clock
OpenShift Container Platform supports cluster hosts with 3 Intel E810 NICs as PTP grandmaster clocks (T-GM).
- 3-card grandmaster clock
You can use a cluster host that has 3 NICs as PTP grandmaster clock. One NIC receives timing information from the global navigation satellite system (GNSS). The second and third NICs receive the timing information from the first by using the SMA1 Tx/Rx connections on the E810 NIC faceplate. The system clock on the cluster host is synchronized from the NIC that is connected to the GNSS satellite.
3-card NIC grandmaster clocks can be used for distributed RAN (D-RAN) configurations where the Radio Unit (RU) is connected directly to the distributed unit (DU) without a front haul switch, for example, if the RU and DU are located in the same radio cell site. D-RAN distributes radio functions across multiple sites, with backhaul connections linking them to the core network.
Figure 8.4. 3-card Intel E810 PTP grandmaster clock
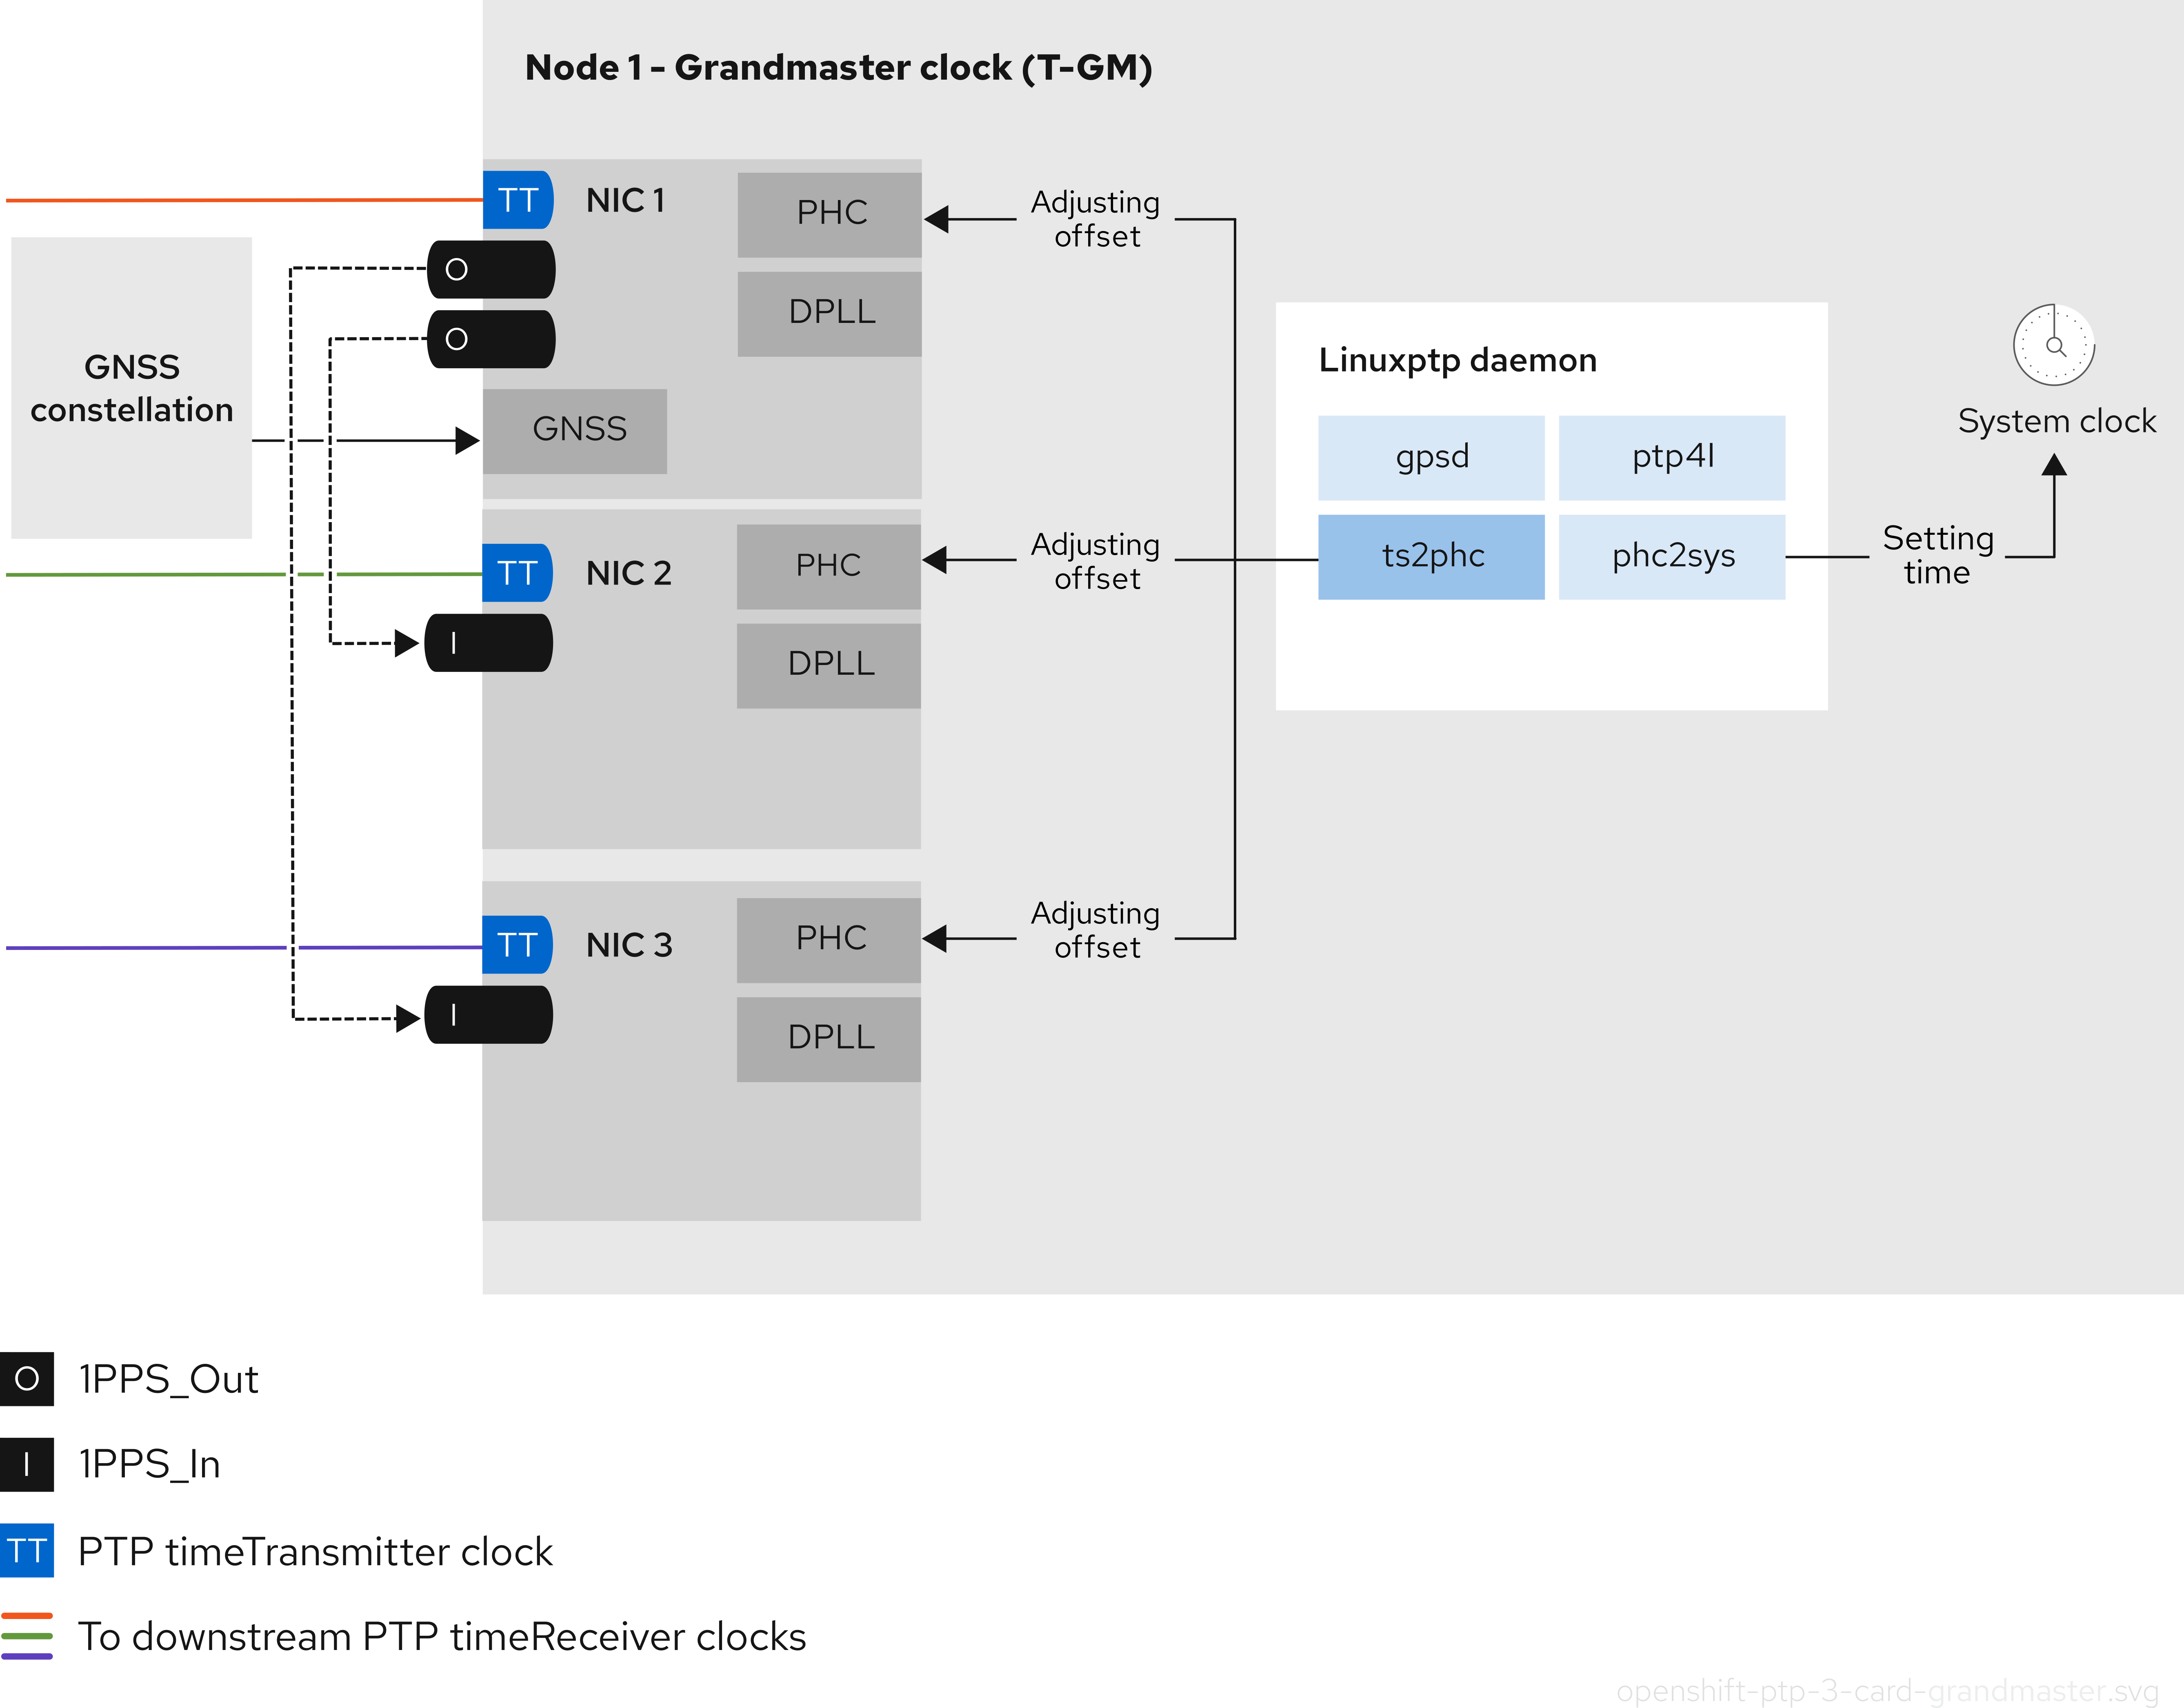 Note
NoteIn a 3-card T-GM configuration, a single
ts2phcprocess reports as 3ts2phcinstances in the system.
8.2. Configuring PTP devices
The PTP Operator adds the NodePtpDevice.ptp.openshift.io custom resource definition (CRD) to OpenShift Container Platform.
When installed, the PTP Operator searches your cluster for Precision Time Protocol (PTP) capable network devices on each node. The Operator creates and updates a NodePtpDevice custom resource (CR) object for each node that provides a compatible PTP-capable network device.
Network interface controller (NIC) hardware with built-in PTP capabilities sometimes require a device-specific configuration. You can use hardware-specific NIC features for supported hardware with the PTP Operator by configuring a plugin in the PtpConfig custom resource (CR). The linuxptp-daemon service uses the named parameters in the plugin stanza to start linuxptp processes, ptp4l and phc2sys, based on the specific hardware configuration.
In OpenShift Container Platform 4.19, the Intel E810 NIC is supported with a PtpConfig plugin.
8.2.1. Installing the PTP Operator using the CLI
As a cluster administrator, you can install the Operator by using the CLI.
Prerequisites
- A cluster installed on bare-metal hardware with nodes that have hardware that supports PTP.
-
Install the OpenShift CLI (
oc). -
Log in as a user with
cluster-adminprivileges.
Procedure
Create a namespace for the PTP Operator.
Save the following YAML in the
ptp-namespace.yamlfile:apiVersion: v1 kind: Namespace metadata: name: openshift-ptp annotations: workload.openshift.io/allowed: management labels: name: openshift-ptp openshift.io/cluster-monitoring: "true"Create the
NamespaceCR:$ oc create -f ptp-namespace.yaml
Create an Operator group for the PTP Operator.
Save the following YAML in the
ptp-operatorgroup.yamlfile:apiVersion: operators.coreos.com/v1 kind: OperatorGroup metadata: name: ptp-operators namespace: openshift-ptp spec: targetNamespaces: - openshift-ptpCreate the
OperatorGroupCR:$ oc create -f ptp-operatorgroup.yaml
Subscribe to the PTP Operator.
Save the following YAML in the
ptp-sub.yamlfile:apiVersion: operators.coreos.com/v1alpha1 kind: Subscription metadata: name: ptp-operator-subscription namespace: openshift-ptp spec: channel: "stable" name: ptp-operator source: redhat-operators sourceNamespace: openshift-marketplaceCreate the
SubscriptionCR:$ oc create -f ptp-sub.yaml
To verify that the Operator is installed, enter the following command:
$ oc get csv -n openshift-ptp -o custom-columns=Name:.metadata.name,Phase:.status.phaseExample output
Name                         Phase
4.19.0-202301261535          Succeeded
8.2.2. Installing the PTP Operator by using the web console
As a cluster administrator, you can install the PTP Operator by using the web console.
You have to create the namespace and Operator group as mentioned in the previous section.
Procedure
Install the PTP Operator using the OpenShift Container Platform web console:
- In the OpenShift Container Platform web console, click Operators → OperatorHub.
- Choose PTP Operator from the list of available Operators, and then click Install.
- On the Install Operator page, under A specific namespace on the cluster select openshift-ptp. Then, click Install.
Optional: Verify that the PTP Operator installed successfully:
- Switch to the Operators → Installed Operators page.
Ensure that PTP Operator is listed in the openshift-ptp project with a Status of InstallSucceeded.
NoteDuring installation an Operator might display a Failed status. If the installation later succeeds with an InstallSucceeded message, you can ignore the Failed message.
If the Operator does not appear as installed, to troubleshoot further:
- Go to the Operators → Installed Operators page and inspect the Operator Subscriptions and Install Plans tabs for any failure or errors under Status.
-
Go to the Workloads → Pods page and check the logs for pods in the
openshift-ptpproject.
8.2.3. Discovering PTP-capable network devices in your cluster
Identify PTP-capable network devices that exist in your cluster so that you can configure them
Prerequisites
- You installed the PTP Operator.
Procedure
To return a complete list of PTP capable network devices in your cluster, run the following command:
$ oc get NodePtpDevice -n openshift-ptp -o yamlExample output
apiVersion: v1
items:
- apiVersion: ptp.openshift.io/v1
  kind: NodePtpDevice
  metadata:
    creationTimestamp: "2022-01-27T15:16:28Z"
    generation: 1
    name: dev-worker-0
    namespace: openshift-ptp
    resourceVersion: "6538103"
    uid: d42fc9ad-bcbf-4590-b6d8-b676c642781a
  spec: {}
  status:
    devices:
    - name: eno1
    - name: eno2
    - name: eno3
    - name: eno4
    - name: enp5s0f0
    - name: enp5s0f1
...
where:
-worker-0-
The value for the
nameparameter is the same as the name of the parent node. devices-
The
devicescollection includes a list of the PTP capable devices that the PTP Operator discovers for the node.
8.2.4. Configuring linuxptp services as a grandmaster clock
You can configure the linuxptp services (ptp4l, phc2sys, ts2phc) as grandmaster clock (T-GM) by creating a PtpConfig custom resource (CR) that configures the host NIC.
The ts2phc utility allows you to synchronize the system clock with the PTP grandmaster clock so that the node can stream precision clock signal to downstream PTP ordinary clocks and boundary clocks.
Use the following example PtpConfig CR as the basis to configure linuxptp services as T-GM for an Intel Westport Channel E810-XXVDA4T network interface.
To configure PTP fast events, set appropriate values for ptp4lOpts, ptp4lConf, and ptpClockThreshold. ptpClockThreshold is used only when events are enabled. See "Configuring the PTP fast event notifications publisher" for more information.
Prerequisites
- For T-GM clocks in production environments, install an Intel E810 Westport Channel NIC in the bare-metal cluster host.
-
Install the OpenShift CLI (
oc). -
Log in as a user with
cluster-adminprivileges. - Install the PTP Operator.
Procedure
Create the
PtpConfigCR. For example:Depending on your requirements, use one of the following T-GM configurations for your deployment. Save the YAML in the
grandmaster-clock-ptp-config.yamlfile:apiVersion: ptp.openshift.io/v1 kind: PtpConfig metadata: name: grandmaster namespace: openshift-ptp annotations: {} spec: profile: - name: "grandmaster" ptp4lOpts: "-2 --summary_interval -4" phc2sysOpts: -r -u 0 -m -N 8 -R 16 -s $iface_master -n 24 ptpSchedulingPolicy: SCHED_FIFO ptpSchedulingPriority: 10 ptpSettings: logReduce: "true" plugins: e810: enableDefaultConfig: false settings: LocalMaxHoldoverOffSet: 1500 LocalHoldoverTimeout: 14400 MaxInSpecOffset: 1500 pins: $e810_pins # "$iface_master": # "U.FL2": "0 2" # "U.FL1": "0 1" # "SMA2": "0 2" # "SMA1": "0 1" ublxCmds: - args: #ubxtool -P 29.20 -z CFG-HW-ANT_CFG_VOLTCTRL,1 - "-P" - "29.20" - "-z" - "CFG-HW-ANT_CFG_VOLTCTRL,1" reportOutput: false - args: #ubxtool -P 29.20 -e GPS - "-P" - "29.20" - "-e" - "GPS" reportOutput: false - args: #ubxtool -P 29.20 -d Galileo - "-P" - "29.20" - "-d" - "Galileo" reportOutput: false - args: #ubxtool -P 29.20 -d GLONASS - "-P" - "29.20" - "-d" - "GLONASS" reportOutput: false - args: #ubxtool -P 29.20 -d BeiDou - "-P" - "29.20" - "-d" - "BeiDou" reportOutput: false - args: #ubxtool -P 29.20 -d SBAS - "-P" - "29.20" - "-d" - "SBAS" reportOutput: false - args: #ubxtool -P 29.20 -t -w 5 -v 1 -e SURVEYIN,600,50000 - "-P" - "29.20" - "-t" - "-w" - "5" - "-v" - "1" - "-e" - "SURVEYIN,600,50000" reportOutput: true - args: #ubxtool -P 29.20 -p MON-HW - "-P" - "29.20" - "-p" - "MON-HW" reportOutput: true - args: #ubxtool -P 29.20 -p CFG-MSG,1,38,248 - "-P" - "29.20" - "-p" - "CFG-MSG,1,38,248" reportOutput: true ts2phcOpts: " " ts2phcConf: | [nmea] ts2phc.master 1 [global] use_syslog 0 verbose 1 logging_level 7 ts2phc.pulsewidth 100000000 #cat /dev/GNSS to find available serial port #example value of gnss_serialport is /dev/ttyGNSS_1700_0 ts2phc.nmea_serialport $gnss_serialport [$iface_master] ts2phc.extts_polarity rising ts2phc.extts_correction 0 ptp4lConf: | [$iface_master] masterOnly 1 [$iface_master_1] masterOnly 1 [$iface_master_2] masterOnly 1 [$iface_master_3] masterOnly 1 [global] # # Default Data Set # twoStepFlag 1 priority1 128 priority2 128 domainNumber 24 #utc_offset 37 clockClass 6 clockAccuracy 0x27 offsetScaledLogVariance 0xFFFF free_running 0 freq_est_interval 1 dscp_event 0 dscp_general 0 dataset_comparison G.8275.x G.8275.defaultDS.localPriority 128 # # Port Data Set # logAnnounceInterval -3 logSyncInterval -4 logMinDelayReqInterval -4 logMinPdelayReqInterval 0 announceReceiptTimeout 3 syncReceiptTimeout 0 delayAsymmetry 0 fault_reset_interval -4 neighborPropDelayThresh 20000000 masterOnly 0 G.8275.portDS.localPriority 128 # # Run time options # assume_two_step 0 logging_level 6 path_trace_enabled 0 follow_up_info 0 hybrid_e2e 0 inhibit_multicast_service 0 net_sync_monitor 0 tc_spanning_tree 0 tx_timestamp_timeout 50 unicast_listen 0 unicast_master_table 0 unicast_req_duration 3600 use_syslog 1 verbose 0 summary_interval -4 kernel_leap 1 check_fup_sync 0 clock_class_threshold 7 # # Servo Options # pi_proportional_const 0.0 pi_integral_const 0.0 pi_proportional_scale 0.0 pi_proportional_exponent -0.3 pi_proportional_norm_max 0.7 pi_integral_scale 0.0 pi_integral_exponent 0.4 pi_integral_norm_max 0.3 step_threshold 2.0 first_step_threshold 0.00002 clock_servo pi sanity_freq_limit 200000000 ntpshm_segment 0 # # Transport options # transportSpecific 0x0 ptp_dst_mac 01:1B:19:00:00:00 p2p_dst_mac 01:80:C2:00:00:0E udp_ttl 1 udp6_scope 0x0E uds_address /var/run/ptp4l # # Default interface options # clock_type BC network_transport L2 delay_mechanism E2E time_stamping hardware tsproc_mode filter delay_filter moving_median delay_filter_length 10 egressLatency 0 ingressLatency 0 boundary_clock_jbod 0 # # Clock description # productDescription ;; revisionData ;; manufacturerIdentity 00:00:00 userDescription ; timeSource 0x20 recommend: - profile: "grandmaster" priority: 4 match: - nodeLabel: "node-role.kubernetes.io/$mcp"NoteFor E810 Westport Channel NICs, set the value for
ts2phc.nmea_serialportto/dev/gnss0.Create the CR by running the following command:
$ oc create -f grandmaster-clock-ptp-config.yaml
Verification
Check that the
PtpConfigprofile is applied to the node.Get the list of pods in the
openshift-ptpnamespace by running the following command:$ oc get pods -n openshift-ptp -o wideExample output
NAME                          READY   STATUS    RESTARTS   AGE     IP             NODE
linuxptp-daemon-74m2g         3/3     Running   3          4d15h   10.16.230.7    compute-1.example.com
ptp-operator-5f4f48d7c-x7zkf  1/1     Running   1          4d15h   10.128.1.145   compute-1.example.com
Check that the profile is correct. Examine the logs of the
linuxptpdaemon that corresponds to the node you specified in thePtpConfigprofile. Run the following command:$ oc logs linuxptp-daemon-74m2g -n openshift-ptp -c linuxptp-daemon-containerExample output
ts2phc[94980.334]: [ts2phc.0.config] nmea delay: 98690975 ns
ts2phc[94980.334]: [ts2phc.0.config] ens3f0 extts index 0 at 1676577329.999999999 corr 0 src 1676577330.901342528 diff -1
ts2phc[94980.334]: [ts2phc.0.config] ens3f0 master offset         -1 s2 freq      -1
ts2phc[94980.441]: [ts2phc.0.config] nmea sentence: GNRMC,195453.00,A,4233.24427,N,07126.64420,W,0.008,,160223,,,A,V
phc2sys[94980.450]: [ptp4l.0.config] CLOCK_REALTIME phc offset       943 s2 freq  -89604 delay    504
phc2sys[94980.512]: [ptp4l.0.config] CLOCK_REALTIME phc offset      1000 s2 freq  -89264 delay    474
8.2.4.1. Configuring linuxptp services as a grandmaster clock for 2 E810 NICs
You can configure the linuxptp services (ptp4l, phc2sys, ts2phc) as a grandmaster clock (T-GM) for 2 E810 NICs by creating a PtpConfig custom resource (CR) that configures the NICs.
You can configure the linuxptp services as a T-GM for the following E810 NICs:
- Intel E810-XXVDA4T Westport Channel NIC
- Intel E810-CQDA2T Logan Beach NIC
For distributed RAN (D-RAN) use cases, you can configure PTP for 2 NICs as follows:
- NIC 1 is synced to the global navigation satellite system (GNSS) time source.
-
NIC 2 is synced to the 1PPS timing output provided by NIC one. This configuration is provided by the PTP hardware plugin in the
PtpConfigCR.
The 2-card PTP T-GM configuration uses one instance of ptp4l and one instance of ts2phc. The ptp4l and ts2phc programs are each configured to operate on two PTP hardware clocks (PHCs), one for each NIC. The host system clock is synchronized from the NIC that is connected to the GNSS time source.
Use the following example PtpConfig CR as the basis to configure linuxptp services as T-GM for dual Intel E810 network interfaces.
To configure PTP fast events, set appropriate values for ptp4lOpts, ptp4lConf, and ptpClockThreshold. ptpClockThreshold is used only when events are enabled. See "Configuring the PTP fast event notifications publisher" for more information.
Prerequisites
- For T-GM clocks in production environments, install two Intel E810 NICs in the bare-metal cluster host.
-
Install the OpenShift CLI (
oc). -
Log in as a user with
cluster-adminprivileges. - Install the PTP Operator.
Procedure
Create the
PtpConfigCR. For example:Save the following YAML in the
grandmaster-clock-ptp-config-dual-nics.yamlfile:# In this example two cards $iface_nic1 and $iface_nic2 are connected via # SMA1 ports by a cable and $iface_nic2 receives 1PPS signals from $iface_nic1 apiVersion: ptp.openshift.io/v1 kind: PtpConfig metadata: name: grandmaster namespace: openshift-ptp annotations: {} spec: profile: - name: "grandmaster" ptp4lOpts: "-2 --summary_interval -4" phc2sysOpts: -r -u 0 -m -N 8 -R 16 -s $iface_nic1 -n 24 ptpSchedulingPolicy: SCHED_FIFO ptpSchedulingPriority: 10 ptpSettings: logReduce: "true" plugins: e810: enableDefaultConfig: false settings: LocalMaxHoldoverOffSet: 1500 LocalHoldoverTimeout: 14400 MaxInSpecOffset: 1500 pins: $e810_pins # "$iface_nic1": # "U.FL2": "0 2" # "U.FL1": "0 1" # "SMA2": "0 2" # "SMA1": "2 1" # "$iface_nic2": # "U.FL2": "0 2" # "U.FL1": "0 1" # "SMA2": "0 2" # "SMA1": "1 1" ublxCmds: - args: #ubxtool -P 29.20 -z CFG-HW-ANT_CFG_VOLTCTRL,1 - "-P" - "29.20" - "-z" - "CFG-HW-ANT_CFG_VOLTCTRL,1" reportOutput: false - args: #ubxtool -P 29.20 -e GPS - "-P" - "29.20" - "-e" - "GPS" reportOutput: false - args: #ubxtool -P 29.20 -d Galileo - "-P" - "29.20" - "-d" - "Galileo" reportOutput: false - args: #ubxtool -P 29.20 -d GLONASS - "-P" - "29.20" - "-d" - "GLONASS" reportOutput: false - args: #ubxtool -P 29.20 -d BeiDou - "-P" - "29.20" - "-d" - "BeiDou" reportOutput: false - args: #ubxtool -P 29.20 -d SBAS - "-P" - "29.20" - "-d" - "SBAS" reportOutput: false - args: #ubxtool -P 29.20 -t -w 5 -v 1 -e SURVEYIN,600,50000 - "-P" - "29.20" - "-t" - "-w" - "5" - "-v" - "1" - "-e" - "SURVEYIN,600,50000" reportOutput: true - args: #ubxtool -P 29.20 -p MON-HW - "-P" - "29.20" - "-p" - "MON-HW" reportOutput: true - args: #ubxtool -P 29.20 -p CFG-MSG,1,38,248 - "-P" - "29.20" - "-p" - "CFG-MSG,1,38,248" reportOutput: true ts2phcOpts: " " ts2phcConf: | [nmea] ts2phc.master 1 [global] use_syslog 0 verbose 1 logging_level 7 ts2phc.pulsewidth 100000000 #cat /dev/GNSS to find available serial port #example value of gnss_serialport is /dev/ttyGNSS_1700_0 ts2phc.nmea_serialport $gnss_serialport [$iface_nic1] ts2phc.extts_polarity rising ts2phc.extts_correction 0 [$iface_nic2] ts2phc.master 0 ts2phc.extts_polarity rising #this is a measured value in nanoseconds to compensate for SMA cable delay ts2phc.extts_correction -10 ptp4lConf: | [$iface_nic1] masterOnly 1 [$iface_nic1_1] masterOnly 1 [$iface_nic1_2] masterOnly 1 [$iface_nic1_3] masterOnly 1 [$iface_nic2] masterOnly 1 [$iface_nic2_1] masterOnly 1 [$iface_nic2_2] masterOnly 1 [$iface_nic2_3] masterOnly 1 [global] # # Default Data Set # twoStepFlag 1 priority1 128 priority2 128 domainNumber 24 #utc_offset 37 clockClass 6 clockAccuracy 0x27 offsetScaledLogVariance 0xFFFF free_running 0 freq_est_interval 1 dscp_event 0 dscp_general 0 dataset_comparison G.8275.x G.8275.defaultDS.localPriority 128 # # Port Data Set # logAnnounceInterval -3 logSyncInterval -4 logMinDelayReqInterval -4 logMinPdelayReqInterval 0 announceReceiptTimeout 3 syncReceiptTimeout 0 delayAsymmetry 0 fault_reset_interval -4 neighborPropDelayThresh 20000000 masterOnly 0 G.8275.portDS.localPriority 128 # # Run time options # assume_two_step 0 logging_level 6 path_trace_enabled 0 follow_up_info 0 hybrid_e2e 0 inhibit_multicast_service 0 net_sync_monitor 0 tc_spanning_tree 0 tx_timestamp_timeout 50 unicast_listen 0 unicast_master_table 0 unicast_req_duration 3600 use_syslog 1 verbose 0 summary_interval -4 kernel_leap 1 check_fup_sync 0 clock_class_threshold 7 # # Servo Options # pi_proportional_const 0.0 pi_integral_const 0.0 pi_proportional_scale 0.0 pi_proportional_exponent -0.3 pi_proportional_norm_max 0.7 pi_integral_scale 0.0 pi_integral_exponent 0.4 pi_integral_norm_max 0.3 step_threshold 2.0 first_step_threshold 0.00002 clock_servo pi sanity_freq_limit 200000000 ntpshm_segment 0 # # Transport options # transportSpecific 0x0 ptp_dst_mac 01:1B:19:00:00:00 p2p_dst_mac 01:80:C2:00:00:0E udp_ttl 1 udp6_scope 0x0E uds_address /var/run/ptp4l # # Default interface options # clock_type BC network_transport L2 delay_mechanism E2E time_stamping hardware tsproc_mode filter delay_filter moving_median delay_filter_length 10 egressLatency 0 ingressLatency 0 boundary_clock_jbod 1 # # Clock description # productDescription ;; revisionData ;; manufacturerIdentity 00:00:00 userDescription ; timeSource 0x20 recommend: - profile: "grandmaster" priority: 4 match: - nodeLabel: "node-role.kubernetes.io/$mcp"NoteSet the value for
ts2phc.nmea_serialportto/dev/gnss0.Create the CR by running the following command:
$ oc create -f grandmaster-clock-ptp-config-dual-nics.yaml
Verification
Check that the
PtpConfigprofile is applied to the node.Get the list of pods in the
openshift-ptpnamespace by running the following command:$ oc get pods -n openshift-ptp -o wideExample output
NAME                          READY   STATUS    RESTARTS   AGE     IP             NODE
linuxptp-daemon-74m2g         3/3     Running   3          4d15h   10.16.230.7    compute-1.example.com
ptp-operator-5f4f48d7c-x7zkf  1/1     Running   1          4d15h   10.128.1.145   compute-1.example.com
Check that the profile is correct. Examine the logs of the
linuxptpdaemon that corresponds to the node you specified in thePtpConfigprofile. Run the following command:$ oc logs linuxptp-daemon-74m2g -n openshift-ptp -c linuxptp-daemon-containerExample output
ts2phc[509863.660]: [ts2phc.0.config] nmea delay: 347527248 ns
ts2phc[509863.660]: [ts2phc.0.config] ens2f0 extts index 0 at 1705516553.000000000 corr 0 src 1705516553.652499081 diff 0
ts2phc[509863.660]: [ts2phc.0.config] ens2f0 master offset          0 s2 freq      -0
I0117 18:35:16.000146 1633226 stats.go:57] state updated for ts2phc =s2
I0117 18:35:16.000163 1633226 event.go:417] dpll State s2, gnss State s2, tsphc state s2, gm state s2,
ts2phc[1705516516]:[ts2phc.0.config] ens2f0 nmea_status 1 offset 0 s2
GM[1705516516]:[ts2phc.0.config] ens2f0 T-GM-STATUS s2
ts2phc[509863.677]: [ts2phc.0.config] ens7f0 extts index 0 at 1705516553.000000010 corr -10 src 1705516553.652499081 diff 0
ts2phc[509863.677]: [ts2phc.0.config] ens7f0 master offset          0 s2 freq      -0
I0117 18:35:16.016597 1633226 stats.go:57] state updated for ts2phc =s2
phc2sys[509863.719]: [ptp4l.0.config] CLOCK_REALTIME phc offset        -6 s2 freq  +15441 delay    510
phc2sys[509863.782]: [ptp4l.0.config] CLOCK_REALTIME phc offset        -7 s2 freq  +15438 delay    502
8.2.4.2. Configuring linuxptp services as a grandmaster clock for 3 E810 NICs
You can configure the linuxptp services (ptp4l, phc2sys, ts2phc) as a grandmaster clock (T-GM) for 3 E810 NICs by creating a PtpConfig custom resource (CR) that configures the NICs.
You can configure the linuxptp services as a T-GM with 3 NICs for the following E810 NICs:
- Intel E810-XXVDA4T Westport Channel NIC
- Intel E810-CQDA2T Logan Beach NIC
For distributed RAN (D-RAN) use cases, you can configure PTP for 3 NICs as follows:
- NIC 1 is synced to the Global Navigation Satellite System (GNSS)
- NICs 2 and 3 are synced to NIC 1 with 1PPS faceplate connections
Use the following example PtpConfig CRs as the basis to configure linuxptp services as a 3-card Intel E810 T-GM.
Prerequisites
- For T-GM clocks in production environments, install 3 Intel E810 NICs in the bare-metal cluster host.
-
Install the OpenShift CLI (
oc). -
Log in as a user with
cluster-adminprivileges. - Install the PTP Operator.
Procedure
Create the
PtpConfigCR. For example:Save the following YAML in the
three-nic-grandmaster-clock-ptp-config.yamlfile:# In this example, the three cards are connected via SMA cables: # - $iface_timeTx1 has the GNSS signal input # - $iface_timeTx2 SMA1 is connected to $iface_timeTx1 SMA1 # - $iface_timeTx3 SMA1 is connected to $iface_timeTx1 SMA2 apiVersion: ptp.openshift.io/v1 kind: PtpConfig metadata: name: gm-3card namespace: openshift-ptp annotations: ran.openshift.io/ztp-deploy-wave: "10" spec: profile: - name: grandmaster ptp4lOpts: -2 --summary_interval -4 phc2sysOpts: -r -u 0 -m -N 8 -R 16 -s $iface_timeTx1 -n 24 ptpSchedulingPolicy: SCHED_FIFO ptpSchedulingPriority: 10 ptpSettings: logReduce: "true" plugins: e810: enableDefaultConfig: false settings: LocalHoldoverTimeout: 14400 LocalMaxHoldoverOffSet: 1500 MaxInSpecOffset: 1500 pins: # Syntax guide: # - The 1st number in each pair must be one of: # 0 - Disabled # 1 - RX # 2 - TX # - The 2nd number in each pair must match the channel number $iface_timeTx1: SMA1: 2 1 SMA2: 2 2 U.FL1: 0 1 U.FL2: 0 2 $iface_timeTx2: SMA1: 1 1 SMA2: 0 2 U.FL1: 0 1 U.FL2: 0 2 $iface_timeTx3: SMA1: 1 1 SMA2: 0 2 U.FL1: 0 1 U.FL2: 0 2 ublxCmds: - args: #ubxtool -P 29.20 -z CFG-HW-ANT_CFG_VOLTCTRL,1 - "-P" - "29.20" - "-z" - "CFG-HW-ANT_CFG_VOLTCTRL,1" reportOutput: false - args: #ubxtool -P 29.20 -e GPS - "-P" - "29.20" - "-e" - "GPS" reportOutput: false - args: #ubxtool -P 29.20 -d Galileo - "-P" - "29.20" - "-d" - "Galileo" reportOutput: false - args: #ubxtool -P 29.20 -d GLONASS - "-P" - "29.20" - "-d" - "GLONASS" reportOutput: false - args: #ubxtool -P 29.20 -d BeiDou - "-P" - "29.20" - "-d" - "BeiDou" reportOutput: false - args: #ubxtool -P 29.20 -d SBAS - "-P" - "29.20" - "-d" - "SBAS" reportOutput: false - args: #ubxtool -P 29.20 -t -w 5 -v 1 -e SURVEYIN,600,50000 - "-P" - "29.20" - "-t" - "-w" - "5" - "-v" - "1" - "-e" - "SURVEYIN,600,50000" reportOutput: true - args: #ubxtool -P 29.20 -p MON-HW - "-P" - "29.20" - "-p" - "MON-HW" reportOutput: true - args: #ubxtool -P 29.20 -p CFG-MSG,1,38,248 - "-P" - "29.20" - "-p" - "CFG-MSG,1,38,248" reportOutput: true ts2phcOpts: " " ts2phcConf: | [nmea] ts2phc.master 1 [global] use_syslog 0 verbose 1 logging_level 7 ts2phc.pulsewidth 100000000 #example value of nmea_serialport is /dev/gnss0 ts2phc.nmea_serialport (?<gnss_serialport>[/\w\s/]+) leapfile /usr/share/zoneinfo/leap-seconds.list [$iface_timeTx1] ts2phc.extts_polarity rising ts2phc.extts_correction 0 [$iface_timeTx2] ts2phc.master 0 ts2phc.extts_polarity rising #this is a measured value in nanoseconds to compensate for SMA cable delay ts2phc.extts_correction -10 [$iface_timeTx3] ts2phc.master 0 ts2phc.extts_polarity rising #this is a measured value in nanoseconds to compensate for SMA cable delay ts2phc.extts_correction -10 ptp4lConf: | [$iface_timeTx1] masterOnly 1 [$iface_timeTx1_1] masterOnly 1 [$iface_timeTx1_2] masterOnly 1 [$iface_timeTx1_3] masterOnly 1 [$iface_timeTx2] masterOnly 1 [$iface_timeTx2_1] masterOnly 1 [$iface_timeTx2_2] masterOnly 1 [$iface_timeTx2_3] masterOnly 1 [$iface_timeTx3] masterOnly 1 [$iface_timeTx3_1] masterOnly 1 [$iface_timeTx3_2] masterOnly 1 [$iface_timeTx3_3] masterOnly 1 [global] # # Default Data Set # twoStepFlag 1 priority1 128 priority2 128 domainNumber 24 #utc_offset 37 clockClass 6 clockAccuracy 0x27 offsetScaledLogVariance 0xFFFF free_running 0 freq_est_interval 1 dscp_event 0 dscp_general 0 dataset_comparison G.8275.x G.8275.defaultDS.localPriority 128 # # Port Data Set # logAnnounceInterval -3 logSyncInterval -4 logMinDelayReqInterval -4 logMinPdelayReqInterval 0 announceReceiptTimeout 3 syncReceiptTimeout 0 delayAsymmetry 0 fault_reset_interval -4 neighborPropDelayThresh 20000000 masterOnly 0 G.8275.portDS.localPriority 128 # # Run time options # assume_two_step 0 logging_level 6 path_trace_enabled 0 follow_up_info 0 hybrid_e2e 0 inhibit_multicast_service 0 net_sync_monitor 0 tc_spanning_tree 0 tx_timestamp_timeout 50 unicast_listen 0 unicast_master_table 0 unicast_req_duration 3600 use_syslog 1 verbose 0 summary_interval -4 kernel_leap 1 check_fup_sync 0 clock_class_threshold 7 # # Servo Options # pi_proportional_const 0.0 pi_integral_const 0.0 pi_proportional_scale 0.0 pi_proportional_exponent -0.3 pi_proportional_norm_max 0.7 pi_integral_scale 0.0 pi_integral_exponent 0.4 pi_integral_norm_max 0.3 step_threshold 2.0 first_step_threshold 0.00002 clock_servo pi sanity_freq_limit 200000000 ntpshm_segment 0 # # Transport options # transportSpecific 0x0 ptp_dst_mac 01:1B:19:00:00:00 p2p_dst_mac 01:80:C2:00:00:0E udp_ttl 1 udp6_scope 0x0E uds_address /var/run/ptp4l # # Default interface options # clock_type BC network_transport L2 delay_mechanism E2E time_stamping hardware tsproc_mode filter delay_filter moving_median delay_filter_length 10 egressLatency 0 ingressLatency 0 boundary_clock_jbod 1 # # Clock description # productDescription ;; revisionData ;; manufacturerIdentity 00:00:00 userDescription ; timeSource 0x20 ptpClockThreshold: holdOverTimeout: 5 maxOffsetThreshold: 1500 minOffsetThreshold: -1500 recommend: - profile: grandmaster priority: 4 match: - nodeLabel: node-role.kubernetes.io/$mcpNoteSet the value for
ts2phc.nmea_serialportto/dev/gnss0.Create the CR by running the following command:
$ oc create -f three-nic-grandmaster-clock-ptp-config.yaml
Verification
Check that the
PtpConfigprofile is applied to the node.Get the list of pods in the
openshift-ptpnamespace by running the following command:$ oc get pods -n openshift-ptp -o wideExample output
NAME                          READY   STATUS    RESTARTS   AGE     IP             NODE
linuxptp-daemon-74m3q         3/3     Running   3          4d15h   10.16.230.7    compute-1.example.com
ptp-operator-5f4f48d7c-x6zkn  1/1     Running   1          4d15h   10.128.1.145   compute-1.example.com
Check that the profile is correct. Run the following command, and examine the logs of the
linuxptpdaemon that corresponds to the node you specified in thePtpConfigprofile:$ oc logs linuxptp-daemon-74m3q -n openshift-ptp -c linuxptp-daemon-containerExample output
ts2phc[2527.586]: [ts2phc.0.config:7] adding tstamp 1742826342.000000000 to clock /dev/ptp11
ts2phc[2527.586]: [ts2phc.0.config:7] adding tstamp 1742826342.000000000 to clock /dev/ptp7
ts2phc[2527.586]: [ts2phc.0.config:7] adding tstamp 1742826342.000000000 to clock /dev/ptp14
ts2phc[2527.586]: [ts2phc.0.config:7] nmea delay: 56308811 ns
ts2phc[2527.586]: [ts2phc.0.config:6] /dev/ptp14 offset          0 s2 freq      +0
ts2phc[2527.587]: [ts2phc.0.config:6] /dev/ptp7 offset          0 s2 freq      +0
ts2phc[2527.587]: [ts2phc.0.config:6] /dev/ptp11 offset          0 s2 freq      -0
I0324 14:25:05.000439  106907 stats.go:61] state updated for ts2phc =s2
I0324 14:25:05.000504  106907 event.go:419] dpll State s2, gnss State s2, tsphc state s2, gm state s2,
I0324 14:25:05.000906  106907 stats.go:61] state updated for ts2phc =s2
I0324 14:25:05.001059  106907 stats.go:61] state updated for ts2phc =s2
ts2phc[1742826305]:[ts2phc.0.config] ens4f0 nmea_status 1 offset 0 s2
GM[1742826305]:[ts2phc.0.config] ens4f0 T-GM-STATUS s2
where:
adding tstamp <timestamp> to clock /dev/ptp<N>-
Indicates
ts2phcis actively synchronizing the PTP hardware clock (PHC) by applying a specific timestamp. /dev/ptp<N> offset 0 s2 freq +0-
Displays the estimated offset between the PTP device and the reference; an offset of 0 and state
s2signifies full synchronization. T-GM-STATUS s2-
Confirms the Telecom Grandmaster (T-GM) is in a locked state (
s2), providing a stable time reference for the network.
8.2.5. Grandmaster clock PtpConfig configuration reference
The following reference information describes the configuration options for the PtpConfig custom resource (CR) that configures the linuxptp services (ptp4l, phc2sys, ts2phc) as a grandmaster clock.
| PtpConfig CR field | Description |
|---|---|
|
|
Specify an array of
The plugin mechanism allows the PTP Operator to do automated hardware configuration. For the Intel Westport Channel NIC or the Intel Logan Beach NIC, when the |
|
|
Specify system configuration options for the |
|
|
Specify the required configuration to start |
|
| Specify the maximum amount of time to wait for the transmit (TX) timestamp from the sender before discarding the data. |
|
| Specify the JBOD boundary clock time delay value. This value is used to correct the time values that are passed between the network time devices. |
|
|
Specify system config options for the Note
Ensure that the network interface listed here is configured as grandmaster and is referenced as required in the |
|
|
Configure the scheduling policy for |
|
|
Set an integer value from 1-65 to configure FIFO priority for |
|
|
Optional. If |
|
|
Sets the configuration for the
|
|
|
Set options for the |
|
|
Specify an array of one or more |
|
|
Specify the |
|
|
Specify the |
|
|
Specify |
|
|
Set |
|
|
Set |
8.2.5.1. Grandmaster clock class sync state reference
The following table describes the PTP grandmaster clock (T-GM) gm.ClockClass states.
Clock class states categorize T-GM clocks based on their accuracy and stability with regard to the Primary Reference Time Clock (PRTC) or other timing source.
Holdover specification is the amount of time a PTP clock can maintain synchronization without receiving updates from the primary time source.
| Clock class state | Description |
|---|---|
|
|
T-GM clock is connected to a PRTC in |
|
|
T-GM clock is in |
|
|
T-GM clock is in |
For more information, see "Phase/time traceability information", ITU-T G.8275.1/Y.1369.1 Recommendations.
8.2.5.2. Intel E810 NIC hardware configuration reference
Use this information to understand how to use the Intel E810 hardware plugin to configure the E810 network interface as PTP grandmaster clock.
Hardware pin configuration determines how the network interface interacts with other components and devices in the system. The Intel E810 NIC has four connectors for external 1PPS signals: SMA1, SMA2, U.FL1, and U.FL2.
| Hardware pin | Recommended setting | Description |
|---|---|---|
|
|
|
Disables the |
|
|
|
Disables the |
|
|
|
Disables the |
|
|
|
Disables the |
You can set the pin configuration on the Intel E810 NIC by using the spec.profile.plugins.e810.pins parameters as shown in the following example:
pins:
      <interface_name>:
        <connector_name>: <function> <channel_number>
Where:
<function>: Specifies the role of the pin. The following values are associated with the pin role:
-
0: Disabled -
1: Rx (Receive timestamping) -
2: Tx (Transmit timestamping)
<channel number>: A number associated with the physical connector. The following channel numbers are associated with the physical connectors:
-
1:SMA1orU.FL1 -
2:SMA2orU.FL2
Examples:
-
0 1: Disables the pin mapped toSMA1orU.FL1. -
1 2: Assigns the Rx function toSMA2orU.FL2.
SMA1 and U.FL1 connectors share channel one. SMA2 and U.FL2 connectors share channel two.
Set spec.profile.plugins.e810.ublxCmds parameters to configure the GNSS clock in the PtpConfig custom resource (CR).
You must configure an offset value to compensate for T-GM GPS antenna cable signal delay. To configure the optimal T-GM antenna offset value, make precise measurements of the GNSS antenna cable signal delay. Red Hat cannot assist in this measurement or provide any values for the required delay offsets.
Each of these ublxCmds stanzas correspond to a configuration that is applied to the host NIC by using ubxtool commands. For example:
ublxCmds:
  - args:
      - "-P"
      - "29.20"
      - "-z"
      - "CFG-HW-ANT_CFG_VOLTCTRL,1"
      - "-z"
      - "CFG-TP-ANT_CABLEDELAY,<antenna_delay_offset>"
    reportOutput: false
where:
"CFG-TP-ANT_CABLEDELAY,<antenna_delay_offset>"- Measured T-GM antenna delay offset in nanoseconds. To get the required delay offset value, you must measure the cable delay using external test equipment.
The following table describes the equivalent ubxtool commands:
| ubxtool command | Description |
|---|---|
|
|
Enables antenna voltage control, allows antenna status to be reported in the |
|
| Enables the antenna to receive GPS signals. |
|
| Configures the antenna to receive signal from the Galileo GPS satellite. |
|
| Disables the antenna from receiving signal from the GLONASS GPS satellite. |
|
| Disables the antenna from receiving signal from the BeiDou GPS satellite. |
|
| Disables the antenna from receiving signal from the SBAS GPS satellite. |
|
| Configures the GNSS receiver survey-in process to improve its initial position estimate. This can take up to 24 hours to achieve an optimal result. |
|
| Runs a single automated scan of the hardware and reports on the NIC state and configuration settings. |
8.2.5.3. Dual E810 NIC configuration reference
Use this information to understand how to use the Intel E810 hardware plugin to configure a pair of E810 network interfaces as PTP grandmaster clock (T-GM).
Before you configure the dual-NIC cluster host, you must connect the two NICs with an SMA1 cable using the 1PPS faceplace connections.
When you configure a dual-NIC T-GM, you need to compensate for the 1PPS signal delay that occurs when you connect the NICs using the SMA1 connection ports. Various factors such as cable length, ambient temperature, and component and manufacturing tolerances can affect the signal delay. To compensate for the delay, you must calculate the specific value that you use to offset the signal delay.
| PtpConfig field | Description |
|---|---|
|
| Configure the E810 hardware pins using the PTP Operator E810 hardware plugin.
|
|
|
Use the |
|
|
Set the value of |
Each value in the spec.profile.plugins.e810.pins list follows the <function> <channel_number> format.
Where:
<function>: Specifies the pin role. The following values are associated with the pin role:
-
0: Disabled -
1: Receive (Rx) – for 1PPS IN -
2: Transmit (Tx) – for 1PPS OUT
<channel_number>: A number associated with the physical connector. The following channel numbers are associated with the physical connectors:
-
1:SMA1orU.FL1 -
2:SMA2orU.FL2
Examples:
-
2 1: Enables1PPS OUT(Tx) onSMA1. -
1 1: Enables1PPS IN(Rx) onSMA1.
The PTP Operator passes these values to the Intel E810 hardware plugin and writes them to the sysfs pin configuration interface on each NIC.
8.2.5.4. 3-card E810 NIC configuration reference
Use this information to understand how to configure 3 E810 NICs as PTP grandmaster clock (T-GM).
Before you configure the 3-card cluster host, you must connect the 3 NICs by using the 1PPS faceplate connections. The primary NIC 1PPS_out outputs feed the other 2 NICs.
When you configure a 3-card T-GM, you need to compensate for the 1PPS signal delay that occurs when you connect the NICs by using the SMA1 connection ports. Various factors such as cable length, ambient temperature, and component and manufacturing tolerances can affect the signal delay. To compensate for the delay, you must calculate the specific value that you use to offset the signal delay.
| PtpConfig field | Description |
|---|---|
|
| Configure the E810 hardware pins with the PTP Operator E810 hardware plugin.
|
|
|
Use the |
|
|
Set the value of |
8.2.6. Holdover in a grandmaster clock with GNSS as the source
Holdover allows the grandmaster (T-GM) clock to maintain synchronization performance when the global navigation satellite system (GNSS) source is unavailable. During this period, the T-GM clock relies on its internal oscillator and holdover parameters to reduce timing disruptions.
You can define the holdover behavior by configuring the following holdover parameters in the PTPConfig custom resource (CR):
MaxInSpecOffset-
Specifies the maximum allowed offset in nanoseconds. If the T-GM clock exceeds the
MaxInSpecOffsetvalue, it transitions to theFREERUNstate (clock class stategm.ClockClass 248). LocalHoldoverTimeout-
Specifies the maximum duration, in seconds, for which the T-GM clock remains in the holdover state before transitioning to the
FREERUNstate. LocalMaxHoldoverOffSet- Specifies the maximum offset that the T-GM clock can reach during the holdover state in nanoseconds.
If the MaxInSpecOffset value is less than the LocalMaxHoldoverOffset value, and the T-GM clock exceeds the maximum offset value, the T-GM clock transitions from the holdover state to the FREERUN state.
If the LocalMaxHoldoverOffSet value is less than the MaxInSpecOffset value, the holdover timeout occurs before the clock reaches the maximum offset. To resolve this issue, set the MaxInSpecOffset field and the LocalMaxHoldoverOffset field to the same value.
For information about clock class states, see "Grandmaster clock class sync state reference" document.
The T-GM clock uses the holdover parameters LocalMaxHoldoverOffSet and LocalHoldoverTimeout to calculate the slope. Slope is the rate at which the phase offset changes over time. It is measured in nanoseconds per second, where the set value indicates how much the offset increases over a given time period.
The T-GM clock uses the slope value to predict and compensate for time drift, so reducing timing disruptions during holdover. The T-GM clock uses the following formula to calculate the slope:
Slope =
localMaxHoldoverOffSet/localHoldoverTimeoutFor example, if the
LocalHoldOverTimeoutparameter is set to 60 seconds, and theLocalMaxHoldoverOffsetparameter is set to 3000 nanoseconds, the slope is calculated as follows:Slope = 3000 nanoseconds / 60 seconds = 50 nanoseconds per second
The T-GM clock reaches the maximum offset in 60 seconds.
The phase offset is converted from picoseconds to nanoseconds. As a result, the calculated phase offset during holdover is expressed in nanoseconds, and the resulting slope is expressed in nanoseconds per second.
The following figure illustrates the holdover behavior in a T-GM clock with GNSS as the source:
Figure 8.5. Holdover in a T-GM clock with GNSS as the source
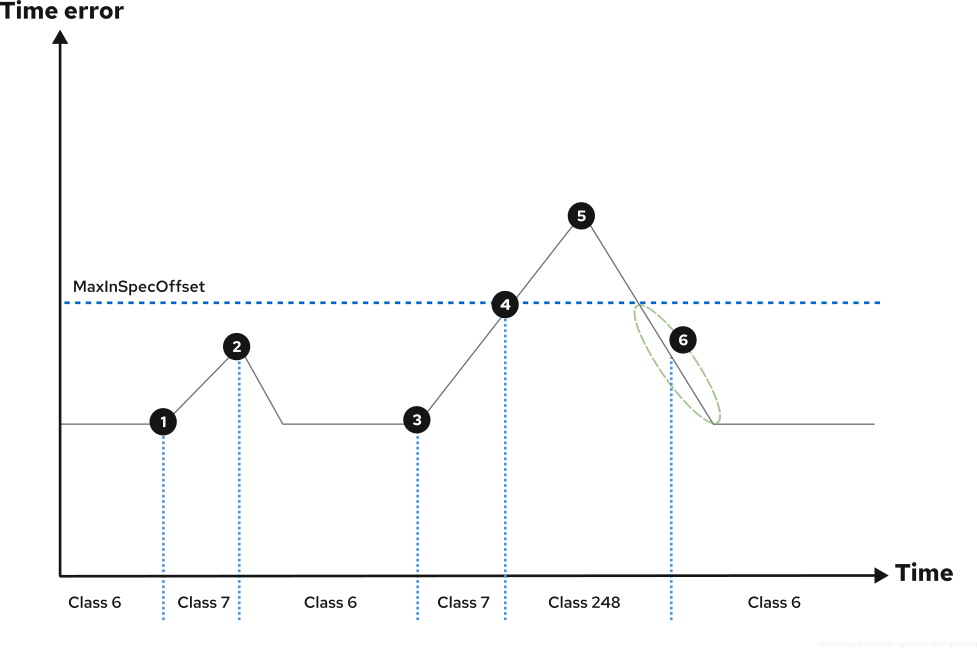
![]() The GNSS signal is lost, causing the T-GM clock to enter the
The GNSS signal is lost, causing the T-GM clock to enter the HOLDOVER mode. The T-GM clock maintains time accuracy by using its internal clock.
![]() The GNSS signal is restored and the T-GM clock re-enters the
The GNSS signal is restored and the T-GM clock re-enters the LOCKED mode. When the GNSS signal is restored, the T-GM clock re-enters the LOCKED mode only after all dependent components in the synchronization chain, such as ts2phc offset, digital phase-locked loop (DPLL) phase offset, and GNSS offset, reach a stable LOCKED mode.
![]() The GNSS signal is lost again, and the T-GM clock re-enters the
The GNSS signal is lost again, and the T-GM clock re-enters the HOLDOVER mode. The time error begins to increase.
![]() The time error exceeds the
The time error exceeds the MaxInSpecOffset threshold due to prolonged loss of traceability.
![]() The GNSS signal is restored, and the T-GM clock resumes synchronization. The time error starts to decrease.
The GNSS signal is restored, and the T-GM clock resumes synchronization. The time error starts to decrease.
![]() The time error decreases and falls back within the
The time error decreases and falls back within the MaxInSpecOffset threshold.
8.2.7. Configuring dynamic leap seconds handling for PTP grandmaster clocks
The PTP Operator container image includes the latest leap-seconds.list file that is available at the time of release.
You can configure the PTP Operator to automatically update the leap second file by using Global Positioning System (GPS) announcements.
Leap second information is stored in an automatically generated ConfigMap resource named leap-configmap in the openshift-ptp namespace. The PTP Operator mounts the leap-configmap resource as a volume in the linuxptp-daemon pod that is accessible by the ts2phc process.
If the GPS satellite broadcasts new leap second data, the PTP Operator updates the leap-configmap resource with the new data. The ts2phc process picks up the changes automatically.
The following procedure is provided as reference. The 4.19 version of the PTP Operator enables automatic leap second management by default.
Prerequisites
-
You have installed the OpenShift CLI (
oc). -
You have logged in as a user with
cluster-adminprivileges. - You have installed the PTP Operator and configured a PTP grandmaster clock (T-GM) in the cluster.
Procedure
Configure automatic leap second handling in the
phc2sysOptssection of thePtpConfigCR. Set the following options:phc2sysOpts: -r -u 0 -m -N 8 -R 16 -S 2 -s ens2f0 -n 24NotePreviously, the T-GM required an offset adjustment in the
phc2sysconfiguration (-O -37) to account for historical leap seconds. This is no longer needed.Configure the Intel e810 NIC to enable periodical reporting of
NAV-TIMELSmessages by the GPS receiver in thespec.profile.plugins.e810.ublxCmdssection of thePtpConfigCR. For example:- args: #ubxtool -P 29.20 -p CFG-MSG,1,38,248 - "-P" - "29.20" - "-p" - "CFG-MSG,1,38,248"
Verification
Validate that the configured T-GM is receiving
NAV-TIMELSmessages from the connected GPS. Run the following command:$ oc -n openshift-ptp -c linuxptp-daemon-container exec -it $(oc -n openshift-ptp get pods -o name | grep daemon) -- ubxtool -t -p NAV-TIMELS -P 29.20Example output
1722509534.4417
UBX-NAV-STATUS:
  iTOW 384752000 gpsFix 5 flags 0xdd fixStat 0x0 flags2 0x8
  ttff 18261, msss 1367642864

1722509534.4419
UBX-NAV-TIMELS:
  iTOW 384752000 version 0 reserved2 0 0 0 srcOfCurrLs 2
  currLs 18 srcOfLsChange 2 lsChange 0 timeToLsEvent 70376866
  dateOfLsGpsWn 2441 dateOfLsGpsDn 7 reserved2 0 0 0
  valid x3

1722509534.4421
UBX-NAV-CLOCK:
  iTOW 384752000 clkB 784281 clkD 435 tAcc 3 fAcc 215

1722509535.4477
UBX-NAV-STATUS:
  iTOW 384753000 gpsFix 5 flags 0xdd fixStat 0x0 flags2 0x8
  ttff 18261, msss 1367643864

1722509535.4479
UBX-NAV-CLOCK:
  iTOW 384753000 clkB 784716 clkD 435 tAcc 3 fAcc 218
Validate that the
leap-configmapresource has been successfully generated by the PTP Operator and is up to date with the latest version of the leap-seconds.list. Run the following command:$ oc -n openshift-ptp get configmap leap-configmap -o jsonpath='{.data.<node_name>}'Replace
<node_name>with the node where you have installed and configured the PTP T-GM clock with automatic leap second management. Escape special characters in the node name. For example,node-1\.example\.com.Example output
# Do not edit
# This file is generated automatically by linuxptp-daemon
#$  3913697179
#@  4291747200
2272060800     10    # 1 Jan 1972
2287785600     11    # 1 Jul 1972
2303683200     12    # 1 Jan 1973
2335219200     13    # 1 Jan 1974
2366755200     14    # 1 Jan 1975
2398291200     15    # 1 Jan 1976
2429913600     16    # 1 Jan 1977
2461449600     17    # 1 Jan 1978
2492985600     18    # 1 Jan 1979
2524521600     19    # 1 Jan 1980
2571782400     20    # 1 Jul 1981
2603318400     21    # 1 Jul 1982
2634854400     22    # 1 Jul 1983
2698012800     23    # 1 Jul 1985
2776982400     24    # 1 Jan 1988
2840140800     25    # 1 Jan 1990
2871676800     26    # 1 Jan 1991
2918937600     27    # 1 Jul 1992
2950473600     28    # 1 Jul 1993
2982009600     29    # 1 Jul 1994
3029443200     30    # 1 Jan 1996
3076704000     31    # 1 Jul 1997
3124137600     32    # 1 Jan 1999
3345062400     33    # 1 Jan 2006
3439756800     34    # 1 Jan 2009
3550089600     35    # 1 Jul 2012
3644697600     36    # 1 Jul 2015
3692217600     37    # 1 Jan 2017

#h  e65754d4 8f39962b aa854a61 661ef546 d2af0bfa
8.2.8. Configuring linuxptp services as a boundary clock
You can configure the linuxptp services (ptp4l, phc2sys) as boundary clock by creating a PtpConfig custom resource (CR) object.
Use the following example PtpConfig CR as the basis to configure linuxptp services as the boundary clock for your particular hardware and environment. This example CR does not configure PTP fast events. To configure PTP fast events, set appropriate values for ptp4lOpts, ptp4lConf, and ptpClockThreshold. ptpClockThreshold is used only when events are enabled. See "Configuring the PTP fast event notifications publisher" for more information.
Prerequisites
-
Install the OpenShift CLI (
oc). -
Log in as a user with
cluster-adminprivileges. - Install the PTP Operator.
Procedure
Create the following
PtpConfigCR, and then save the YAML in theboundary-clock-ptp-config.yamlfile.Example PTP boundary clock configuration
apiVersion: ptp.openshift.io/v1
kind: PtpConfig
metadata:
  name: boundary-clock
  namespace: openshift-ptp
  annotations: {}
spec:
  profile:
    - name: boundary-clock
      ptp4lOpts: "-2"
      phc2sysOpts: "-a -r -n 24"
      ptpSchedulingPolicy: SCHED_FIFO
      ptpSchedulingPriority: 10
      ptpSettings:
        logReduce: "true"
      ptp4lConf: |
        # The interface name is hardware-specific
        [$iface_slave]
        masterOnly 0
        [$iface_master_1]
        masterOnly 1
        [$iface_master_2]
        masterOnly 1
        [$iface_master_3]
        masterOnly 1
        [global]
        #
        # Default Data Set
        #
        twoStepFlag 1
        slaveOnly 0
        priority1 128
        priority2 128
        domainNumber 24
        #utc_offset 37
        clockClass 248
        clockAccuracy 0xFE
        offsetScaledLogVariance 0xFFFF
        free_running 0
        freq_est_interval 1
        dscp_event 0
        dscp_general 0
        dataset_comparison G.8275.x
        G.8275.defaultDS.localPriority 128
        #
        # Port Data Set
        #
        logAnnounceInterval -3
        logSyncInterval -4
        logMinDelayReqInterval -4
        logMinPdelayReqInterval -4
        announceReceiptTimeout 3
        syncReceiptTimeout 0
        delayAsymmetry 0
        fault_reset_interval -4
        neighborPropDelayThresh 20000000
        masterOnly 0
        G.8275.portDS.localPriority 128
        #
        # Run time options
        #
        assume_two_step 0
        logging_level 6
        path_trace_enabled 0
        follow_up_info 0
        hybrid_e2e 0
        inhibit_multicast_service 0
        net_sync_monitor 0
        tc_spanning_tree 0
        tx_timestamp_timeout 50
        unicast_listen 0
        unicast_master_table 0
        unicast_req_duration 3600
        use_syslog 1
        verbose 0
        summary_interval 0
        kernel_leap 1
        check_fup_sync 0
        clock_class_threshold 135
        #
        # Servo Options
        #
        pi_proportional_const 0.0
        pi_integral_const 0.0
        pi_proportional_scale 0.0
        pi_proportional_exponent -0.3
        pi_proportional_norm_max 0.7
        pi_integral_scale 0.0
        pi_integral_exponent 0.4
        pi_integral_norm_max 0.3
        step_threshold 2.0
        first_step_threshold 0.00002
        max_frequency 900000000
        clock_servo pi
        sanity_freq_limit 200000000
        ntpshm_segment 0
        #
        # Transport options
        #
        transportSpecific 0x0
        ptp_dst_mac 01:1B:19:00:00:00
        p2p_dst_mac 01:80:C2:00:00:0E
        udp_ttl 1
        udp6_scope 0x0E
        uds_address /var/run/ptp4l
        #
        # Default interface options
        #
        clock_type BC
        network_transport L2
        delay_mechanism E2E
        time_stamping hardware
        tsproc_mode filter
        delay_filter moving_median
        delay_filter_length 10
        egressLatency 0
        ingressLatency 0
        boundary_clock_jbod 0
        #
        # Clock description
        #
        productDescription ;;
        revisionData ;;
        manufacturerIdentity 00:00:00
        userDescription ;
        timeSource 0xA0
  recommend:
    - profile: boundary-clock
      priority: 4
      match:
        - nodeLabel: "node-role.kubernetes.io/$mcp"
Expand Table 8.7. PTP boundary clock CR configuration options CR field Description nameThe name of the
PtpConfigCR.profileSpecify an array of one or more
profileobjects.nameSpecify the name of a profile object which uniquely identifies a profile object.
ptp4lOptsSpecify system config options for the
ptp4lservice. The options should not include the network interface name-i <interface>and service config file-f /etc/ptp4l.confbecause the network interface name and the service config file are automatically appended.ptp4lConfSpecify the required configuration to start
ptp4las boundary clock. For example,ens1f0synchronizes from a grandmaster clock andens1f3synchronizes connected devices.<interface_1>The interface that receives the synchronization clock.
<interface_2>The interface that sends the synchronization clock.
tx_timestamp_timeoutFor Intel Columbiaville 800 Series NICs, set
tx_timestamp_timeoutto50.boundary_clock_jbodFor Intel Columbiaville 800 Series NICs, ensure
boundary_clock_jbodis set to0. For Intel Fortville X710 Series NICs, ensureboundary_clock_jbodis set to1.phc2sysOptsSpecify system config options for the
phc2sysservice. If this field is empty, the PTP Operator does not start thephc2sysservice.ptpSchedulingPolicyScheduling policy for ptp4l and phc2sys processes. Default value is
SCHED_OTHER. UseSCHED_FIFOon systems that support FIFO scheduling.ptpSchedulingPriorityInteger value from 1-65 used to set FIFO priority for
ptp4landphc2sysprocesses whenptpSchedulingPolicyis set toSCHED_FIFO. TheptpSchedulingPriorityfield is not used whenptpSchedulingPolicyis set toSCHED_OTHER.ptpClockThresholdOptional. If
ptpClockThresholdis not present, default values are used for theptpClockThresholdfields.ptpClockThresholdconfigures how long after the PTP master clock is disconnected before PTP events are triggered.holdOverTimeoutis the time value in seconds before the PTP clock event state changes toFREERUNwhen the PTP master clock is disconnected. ThemaxOffsetThresholdandminOffsetThresholdsettings configure offset values in nanoseconds that compare against the values forCLOCK_REALTIME(phc2sys) or master offset (ptp4l). When theptp4lorphc2sysoffset value is outside this range, the PTP clock state is set toFREERUN. When the offset value is within this range, the PTP clock state is set toLOCKED.recommendSpecify an array of one or more
recommendobjects that define rules on how theprofileshould be applied to nodes..recommend.profileSpecify the
.recommend.profileobject name defined in theprofilesection..recommend.prioritySpecify the
prioritywith an integer value between0and99. A larger number gets lower priority, so a priority of99is lower than a priority of10. If a node can be matched with multiple profiles according to rules defined in thematchfield, the profile with the higher priority is applied to that node..recommend.matchSpecify
.recommend.matchrules withnodeLabelornodeNamevalues..recommend.match.nodeLabelSet
nodeLabelwith thekeyof thenode.Labelsfield from the node object by using theoc get nodes --show-labelscommand. For example,node-role.kubernetes.io/worker..recommend.match.nodeNameSet
nodeNamewith the value of thenode.Namefield from the node object by using theoc get nodescommand. For example,compute-1.example.com.Create the CR by running the following command:
$ oc create -f boundary-clock-ptp-config.yaml
Verification
Check that the
PtpConfigprofile is applied to the node.Get the list of pods in the
openshift-ptpnamespace by running the following command:$ oc get pods -n openshift-ptp -o wideExample output
NAME                            READY   STATUS    RESTARTS   AGE   IP               NODE
linuxptp-daemon-4xkbb           1/1     Running   0          43m   10.1.196.24      compute-0.example.com
linuxptp-daemon-tdspf           1/1     Running   0          43m   10.1.196.25      compute-1.example.com
ptp-operator-657bbb64c8-2f8sj   1/1     Running   0          43m   10.129.0.61      control-plane-1.example.com
Check that the profile is correct. Examine the logs of the
linuxptpdaemon that corresponds to the node you specified in thePtpConfigprofile. Run the following command:$ oc logs linuxptp-daemon-4xkbb -n openshift-ptp -c linuxptp-daemon-containerExample output
I1115 09:41:17.117596 4143292 daemon.go:107] in applyNodePTPProfile
I1115 09:41:17.117604 4143292 daemon.go:109] updating NodePTPProfile to:
I1115 09:41:17.117607 4143292 daemon.go:110] ------------------------------------
I1115 09:41:17.117612 4143292 daemon.go:102] Profile Name: profile1
I1115 09:41:17.117616 4143292 daemon.go:102] Interface:
I1115 09:41:17.117620 4143292 daemon.go:102] Ptp4lOpts: -2
I1115 09:41:17.117623 4143292 daemon.go:102] Phc2sysOpts: -a -r -n 24
I1115 09:41:17.117626 4143292 daemon.go:116] ------------------------------------
8.2.8.1. Configuring linuxptp services as boundary clocks for dual-NIC hardware
You can configure the linuxptp services (ptp4l, phc2sys) as boundary clocks for dual-NIC hardware by creating a PtpConfig custom resource (CR) object for each NIC.
Dual NIC hardware allows you to connect each NIC to the same upstream leader clock with separate ptp4l instances for each NIC feeding the downstream clocks.
Prerequisites
-
Install the OpenShift CLI (
oc). -
Log in as a user with
cluster-adminprivileges. - Install the PTP Operator.
Procedure
Create two separate
PtpConfigCRs, one for each NIC, using the reference CR in "Configuring linuxptp services as a boundary clock" as the basis for each CR. For example:Create
boundary-clock-ptp-config-nic1.yaml, specifying values forphc2sysOpts:apiVersion: ptp.openshift.io/v1 kind: PtpConfig metadata: name: boundary-clock-ptp-config-nic1 namespace: openshift-ptp spec: profile: - name: "profile1" ptp4lOpts: "-2 --summary_interval -4" ptp4lConf: | [ens5f1] masterOnly 1 [ens5f0] masterOnly 0 ... phc2sysOpts: "-a -r -m -n 24 -N 8 -R 16"where:
ptp4lConf-
Specifies the required interfaces to start
ptp4las a boundary clock. For example,ens5f0synchronizes from a grandmaster clock andens5f1synchronizes connected devices. phc2sysOpts: "-a -r -m -n 24 -N 8 -R 16"-
Sets the required
phc2sysOptsvalues.-mprints messages tostdout. Thelinuxptp-daemonDaemonSetparses the logs and generates Prometheus metrics.
Create
boundary-clock-ptp-config-nic2.yaml, removing thephc2sysOptsfield altogether to disable thephc2sysservice for the second NIC:apiVersion: ptp.openshift.io/v1 kind: PtpConfig metadata: name: boundary-clock-ptp-config-nic2 namespace: openshift-ptp spec: profile: - name: "profile2" ptp4lOpts: "-2 --summary_interval -4" ptp4lConf: | [ens7f1] masterOnly 1 [ens7f0] masterOnly 0 ...Specify the required interfaces to start
ptp4las a boundary clock on the second NIC.NoteYou must completely remove the
phc2sysOptsfield from the secondPtpConfigCR to disable thephc2sysservice on the second NIC.
Create the dual-NIC
PtpConfigCRs by running the following commands:Create the CR that configures PTP for the first NIC:
$ oc create -f boundary-clock-ptp-config-nic1.yamlCreate the CR that configures PTP for the second NIC:
$ oc create -f boundary-clock-ptp-config-nic2.yaml
Verification
Check that the PTP Operator has applied the
PtpConfigCRs for both NICs. Examine the logs for thelinuxptpdaemon corresponding to the node that has the dual-NIC hardware installed. For example, run the following command:$ oc logs linuxptp-daemon-cvgr6 -n openshift-ptp -c linuxptp-daemon-containerExample output
ptp4l[80828.335]: [ptp4l.1.config] master offset          5 s2 freq   -5727 path delay       519
ptp4l[80828.343]: [ptp4l.0.config] master offset         -5 s2 freq  -10607 path delay       533
phc2sys[80828.390]: [ptp4l.0.config] CLOCK_REALTIME phc offset         1 s2 freq  -87239 delay    539
8.2.8.2. Configuring linuxptp as a highly available system clock for dual-NIC Intel E810 PTP boundary clocks
You can configure the linuxptp services ptp4l and phc2sys as a highly available (HA) system clock for dual PTP boundary clocks (T-BC).
The highly available system clock uses multiple time sources from dual-NIC Intel E810 Salem channel hardware configured as two boundary clocks. Two boundary clocks instances participate in the HA setup, each with its own configuration profile. You connect each NIC to the same upstream leader clock with separate ptp4l instances for each NIC feeding the downstream clocks.
Create two PtpConfig custom resource (CR) objects that configure the NICs as T-BC and a third PtpConfig CR that configures high availability between the two NICs.
You set phc2SysOpts options once in the PtpConfig CR that configures HA. Set the phc2sysOpts field to an empty string in the PtpConfig CRs that configure the two NICs. This prevents individual phc2sys processes from being set up for the two profiles.
The third PtpConfig CR configures a highly available system clock service. The CR sets the ptp4lOpts field to an empty string to prevent the ptp4l process from running. The CR adds profiles for the ptp4l configurations under the spec.profile.ptpSettings.haProfiles key and passes the kernel socket path of those profiles to the phc2sys service. When a ptp4l failure occurs, the phc2sys service switches to the backup ptp4l configuration. When the primary profile becomes active again, the phc2sys service reverts to the original state.
Ensure that you set spec.recommend.priority to the same value for all three PtpConfig CRs that you use to configure HA.
Prerequisites
-
Install the OpenShift CLI (
oc). -
Log in as a user with
cluster-adminprivileges. - Install the PTP Operator.
- Configure a cluster node with Intel E810 Salem channel dual-NIC.
Procedure
Create two separate
PtpConfigCRs, one for each NIC, using the CRs in "Configuring linuxptp services as boundary clocks for dual-NIC hardware" as a reference for each CR.Create the
ha-ptp-config-nic1.yamlfile, specifying an empty string for thephc2sysOptsfield. For example:apiVersion: ptp.openshift.io/v1 kind: PtpConfig metadata: name: ha-ptp-config-nic1 namespace: openshift-ptp spec: profile: - name: "ha-ptp-config-profile1" ptp4lOpts: "-2 --summary_interval -4" ptp4lConf: | [ens5f1] masterOnly 1 [ens5f0] masterOnly 0 #... phc2sysOpts: ""where:
ptp4lConf-
Specifies the required interfaces to start
ptp4las a boundary clock. For example,ens5f0synchronizes from a grandmaster clock andens5f1synchronizes connected devices. phc2sysOpts: ""-
Sets
phc2sysOptswith an empty string. These values are populated from thespec.profile.ptpSettings.haProfilesfield of thePtpConfigCR that configures high availability.
Apply the
PtpConfigCR for NIC 1 by running the following command:$ oc create -f ha-ptp-config-nic1.yamlCreate the
ha-ptp-config-nic2.yamlfile, specifying an empty string for thephc2sysOptsfield. For example:apiVersion: ptp.openshift.io/v1 kind: PtpConfig metadata: name: ha-ptp-config-nic2 namespace: openshift-ptp spec: profile: - name: "ha-ptp-config-profile2" ptp4lOpts: "-2 --summary_interval -4" ptp4lConf: | [ens7f1] masterOnly 1 [ens7f0] masterOnly 0 #... phc2sysOpts: ""Apply the
PtpConfigCR for NIC 2 by running the following command:$ oc create -f ha-ptp-config-nic2.yaml
Create the
PtpConfigCR that configures the HA system clock. For example:Create the
ptp-config-for-ha.yamlfile. SethaProfilesto match themetadata.namefields that are set in thePtpConfigCRs that configure the two NICs. For example:haProfiles: ha-ptp-config-nic1,ha-ptp-config-nic2apiVersion: ptp.openshift.io/v1 kind: PtpConfig metadata: name: boundary-ha namespace: openshift-ptp annotations: {} spec: profile: - name: "boundary-ha" ptp4lOpts: "" phc2sysOpts: "-a -r -n 24" ptpSchedulingPolicy: SCHED_FIFO ptpSchedulingPriority: 10 ptpSettings: logReduce: "true" haProfiles: "$profile1,$profile2" recommend: - profile: "boundary-ha" priority: 4 match: - nodeLabel: "node-role.kubernetes.io/$mcp"Set the
ptp4lOptsfield to an empty string. If it is not empty, thep4ptlprocess starts with a critical error.ImportantDo not apply the high availability
PtpConfigCR before thePtpConfigCRs that configure the individual NICs.Apply the HA
PtpConfigCR by running the following command:$ oc create -f ptp-config-for-ha.yaml
Verification
Verify that the PTP Operator has applied the
PtpConfigCRs correctly. Perform the following steps:Get the list of pods in the
openshift-ptpnamespace by running the following command:$ oc get pods -n openshift-ptp -o wideExample output
NAME READY STATUS RESTARTS AGE IP NODE linuxptp-daemon-4xkrb 1/1 Running 0 43m 10.1.196.24 compute-0.example.com ptp-operator-657bbq64c8-2f8sj 1/1 Running 0 43m 10.129.0.61 control-plane-1.example.comNoteThere should be only one
linuxptp-daemonpod.Check that the profile is correct by running the following command. Examine the logs of the
linuxptpdaemon that corresponds to the node you specified in thePtpConfigprofile.$ oc logs linuxptp-daemon-4xkrb -n openshift-ptp -c linuxptp-daemon-containerExample output
I1115 09:41:17.117596 4143292 daemon.go:107] in applyNodePTPProfile
I1115 09:41:17.117604 4143292 daemon.go:109] updating NodePTPProfile to:
I1115 09:41:17.117607 4143292 daemon.go:110] ------------------------------------
I1115 09:41:17.117612 4143292 daemon.go:102] Profile Name: ha-ptp-config-profile1
I1115 09:41:17.117616 4143292 daemon.go:102] Interface:
I1115 09:41:17.117620 4143292 daemon.go:102] Ptp4lOpts: -2
I1115 09:41:17.117623 4143292 daemon.go:102] Phc2sysOpts: -a -r -n 24
I1115 09:41:17.117626 4143292 daemon.go:116] ------------------------------------
8.2.9. Configuring linuxptp services as an ordinary clock
You can configure linuxptp services (ptp4l, phc2sys) as ordinary clock by creating a PtpConfig custom resource (CR) object.
Use the following example PtpConfig CR as the basis to configure linuxptp services as an ordinary clock for your particular hardware and environment. This example CR does not configure PTP fast events. To configure PTP fast events, set appropriate values for ptp4lOpts, ptp4lConf, and ptpClockThreshold. ptpClockThreshold is required only when events are enabled. See "Configuring the PTP fast event notifications publisher" for more information.
Prerequisites
-
Install the OpenShift CLI (
oc). -
Log in as a user with
cluster-adminprivileges. - Install the PTP Operator.
Procedure
Create the following
PtpConfigCR, and then save the YAML in theordinary-clock-ptp-config.yamlfile.Example PTP ordinary clock configuration
apiVersion: ptp.openshift.io/v1
kind: PtpConfig
metadata:
  name: ordinary-clock
  namespace: openshift-ptp
  annotations: {}
spec:
  profile:
    - name: ordinary-clock
      # The interface name is hardware-specific
      interface: $interface
      ptp4lOpts: "-2 -s"
      phc2sysOpts: "-a -r -n 24"
      ptpSchedulingPolicy: SCHED_FIFO
      ptpSchedulingPriority: 10
      ptpSettings:
        logReduce: "true"
      ptp4lConf: |
        [global]
        #
        # Default Data Set
        #
        twoStepFlag 1
        slaveOnly 1
        priority1 128
        priority2 128
        domainNumber 24
        #utc_offset 37
        clockClass 255
        clockAccuracy 0xFE
        offsetScaledLogVariance 0xFFFF
        free_running 0
        freq_est_interval 1
        dscp_event 0
        dscp_general 0
        dataset_comparison G.8275.x
        G.8275.defaultDS.localPriority 128
        #
        # Port Data Set
        #
        logAnnounceInterval -3
        logSyncInterval -4
        logMinDelayReqInterval -4
        logMinPdelayReqInterval -4
        announceReceiptTimeout 3
        syncReceiptTimeout 0
        delayAsymmetry 0
        fault_reset_interval -4
        neighborPropDelayThresh 20000000
        masterOnly 0
        G.8275.portDS.localPriority 128
        #
        # Run time options
        #
        assume_two_step 0
        logging_level 6
        path_trace_enabled 0
        follow_up_info 0
        hybrid_e2e 0
        inhibit_multicast_service 0
        net_sync_monitor 0
        tc_spanning_tree 0
        tx_timestamp_timeout 50
        unicast_listen 0
        unicast_master_table 0
        unicast_req_duration 3600
        use_syslog 1
        verbose 0
        summary_interval 0
        kernel_leap 1
        check_fup_sync 0
        clock_class_threshold 7
        #
        # Servo Options
        #
        pi_proportional_const 0.0
        pi_integral_const 0.0
        pi_proportional_scale 0.0
        pi_proportional_exponent -0.3
        pi_proportional_norm_max 0.7
        pi_integral_scale 0.0
        pi_integral_exponent 0.4
        pi_integral_norm_max 0.3
        step_threshold 2.0
        first_step_threshold 0.00002
        max_frequency 900000000
        clock_servo pi
        sanity_freq_limit 200000000
        ntpshm_segment 0
        #
        # Transport options
        #
        transportSpecific 0x0
        ptp_dst_mac 01:1B:19:00:00:00
        p2p_dst_mac 01:80:C2:00:00:0E
        udp_ttl 1
        udp6_scope 0x0E
        uds_address /var/run/ptp4l
        #
        # Default interface options
        #
        clock_type OC
        network_transport L2
        delay_mechanism E2E
        time_stamping hardware
        tsproc_mode filter
        delay_filter moving_median
        delay_filter_length 10
        egressLatency 0
        ingressLatency 0
        boundary_clock_jbod 0
        #
        # Clock description
        #
        productDescription ;;
        revisionData ;;
        manufacturerIdentity 00:00:00
        userDescription ;
        timeSource 0xA0
  recommend:
    - profile: ordinary-clock
      priority: 4
      match:
        - nodeLabel: "node-role.kubernetes.io/$mcp"
Expand Table 8.8. PTP ordinary clock CR configuration options CR field Description nameThe name of the
PtpConfigCR.profileSpecify an array of one or more
profileobjects. Each profile must be uniquely named.interfaceSpecify the network interface to be used by the
ptp4lservice, for exampleens787f1.ptp4lOptsSpecify system config options for the
ptp4lservice, for example-2to select the IEEE 802.3 network transport. The options should not include the network interface name-i <interface>and service config file-f /etc/ptp4l.confbecause the network interface name and the service config file are automatically appended. Append--summary_interval -4to use PTP fast events with this interface.phc2sysOptsSpecify system config options for the
phc2sysservice. If this field is empty, the PTP Operator does not start thephc2sysservice. For Intel Columbiaville 800 Series NICs, setphc2sysOptsoptions to-a -r -m -n 24 -N 8 -R 16.-mprints messages tostdout. Thelinuxptp-daemonDaemonSetparses the logs and generates Prometheus metrics.ptp4lConfSpecify a string that contains the configuration to replace the default
/etc/ptp4l.conffile. To use the default configuration, leave the field empty.tx_timestamp_timeoutFor Intel Columbiaville 800 Series NICs, set
tx_timestamp_timeoutto50.boundary_clock_jbodFor Intel Columbiaville 800 Series NICs, set
boundary_clock_jbodto0.ptpSchedulingPolicyScheduling policy for
ptp4landphc2sysprocesses. Default value isSCHED_OTHER. UseSCHED_FIFOon systems that support FIFO scheduling.ptpSchedulingPriorityInteger value from 1-65 used to set FIFO priority for
ptp4landphc2sysprocesses whenptpSchedulingPolicyis set toSCHED_FIFO. TheptpSchedulingPriorityfield is not used whenptpSchedulingPolicyis set toSCHED_OTHER.ptpClockThresholdOptional. If
ptpClockThresholdis not present, default values are used for theptpClockThresholdfields.ptpClockThresholdconfigures how long after the PTP master clock is disconnected before PTP events are triggered.holdOverTimeoutis the time value in seconds before the PTP clock event state changes toFREERUNwhen the PTP master clock is disconnected. ThemaxOffsetThresholdandminOffsetThresholdsettings configure offset values in nanoseconds that compare against the values forCLOCK_REALTIME(phc2sys) or master offset (ptp4l). When theptp4lorphc2sysoffset value is outside this range, the PTP clock state is set toFREERUN. When the offset value is within this range, the PTP clock state is set toLOCKED.recommendSpecify an array of one or more
recommendobjects that define rules on how theprofileshould be applied to nodes..recommend.profileSpecify the
.recommend.profileobject name defined in theprofilesection..recommend.prioritySet
.recommend.priorityto0for ordinary clock..recommend.matchSpecify
.recommend.matchrules withnodeLabelornodeNamevalues..recommend.match.nodeLabelSet
nodeLabelwith thekeyof thenode.Labelsfield from the node object by using theoc get nodes --show-labelscommand. For example,node-role.kubernetes.io/worker..recommend.match.nodeNameSet
nodeNamewith the value of thenode.Namefield from the node object by using theoc get nodescommand. For example,compute-1.example.com.Create the
PtpConfigCR by running the following command:$ oc create -f ordinary-clock-ptp-config.yaml
Verification
Check that the
PtpConfigprofile is applied to the node.Get the list of pods in the
openshift-ptpnamespace by running the following command:$ oc get pods -n openshift-ptp -o wideExample output
NAME                            READY   STATUS    RESTARTS   AGE   IP               NODE
linuxptp-daemon-4xkbb           1/1     Running   0          43m   10.1.196.24      compute-0.example.com
linuxptp-daemon-tdspf           1/1     Running   0          43m   10.1.196.25      compute-1.example.com
ptp-operator-657bbb64c8-2f8sj   1/1     Running   0          43m   10.129.0.61      control-plane-1.example.com
Check that the profile is correct. Examine the logs of the
linuxptpdaemon that corresponds to the node you specified in thePtpConfigprofile. Run the following command:$ oc logs linuxptp-daemon-4xkbb -n openshift-ptp -c linuxptp-daemon-containerExample output
I1115 09:41:17.117596 4143292 daemon.go:107] in applyNodePTPProfile
I1115 09:41:17.117604 4143292 daemon.go:109] updating NodePTPProfile to:
I1115 09:41:17.117607 4143292 daemon.go:110] ------------------------------------
I1115 09:41:17.117612 4143292 daemon.go:102] Profile Name: profile1
I1115 09:41:17.117616 4143292 daemon.go:102] Interface: ens787f1
I1115 09:41:17.117620 4143292 daemon.go:102] Ptp4lOpts: -2 -s
I1115 09:41:17.117623 4143292 daemon.go:102] Phc2sysOpts: -a -r -n 24
I1115 09:41:17.117626 4143292 daemon.go:116] ------------------------------------
8.2.9.1. Intel Columbiaville E800 series NIC as PTP ordinary clock reference
The following table describes the changes that you must make to the reference PTP configuration to use Intel Columbiaville E800 series NICs as ordinary clocks. Make the changes in a PtpConfig custom resource (CR) that you apply to the cluster.
| PTP configuration | Recommended setting |
|---|---|
|
|
|
|
|
|
|
|
|
For phc2sysOpts, -m prints messages to stdout. The linuxptp-daemon DaemonSet parses the logs and generates Prometheus metrics.
8.2.9.2. Configuring linuxptp services as an ordinary clock with dual-port NIC redundancy
You can configure linuxptp services (ptp4l, phc2sys) as an ordinary clock with dual-port NIC redundancy by creating a PtpConfig custom resource (CR) object.
In a dual-port NIC configuration for an ordinary clock, if one port fails, the standby port takes over, maintaining PTP timing synchronization.
Configuring linuxptp services as an ordinary clock with dual-port NIC redundancy is a Technology Preview feature only. Technology Preview features are not supported with Red Hat production service level agreements (SLAs) and might not be functionally complete. Red Hat does not recommend using them in production. These features provide early access to upcoming product features, enabling customers to test functionality and provide feedback during the development process.
For more information about the support scope of Red Hat Technology Preview features, see Technology Preview Features Support Scope.
Prerequisites
-
Install the OpenShift CLI (
oc). -
Log in as a user with
cluster-adminprivileges. - Install the PTP Operator.
- The node uses an x86_64 architecture with a dual-port NIC.
Procedure
Create the following
PtpConfigCR, and then save the YAML in theoc-dual-port-ptp-config.yamlfile.Example PTP ordinary clock dual-port configuration
apiVersion: ptp.openshift.io/v1
kind: PtpConfig
metadata:
  name: ordinary-clock-1
  namespace: openshift-ptp
spec:
  profile:
  - name: oc-dual-port
    phc2sysOpts: -a -r -n 24 -N 8 -R 16 -u 0
    ptp4lConf: |-
      [ens3f2]
      masterOnly 0
      [ens3f3]
      masterOnly 0

      [global]
      #
      # Default Data Set
      #
      slaveOnly 1
#...
where:
phc2sysOpts: -a -r -n 24 -N 8 -R 16 -u 0-
Specifies the system config options for the
phc2sysservice. ptp4lConf-
Specifies the interface configuration for the
ptp4lservice. In this example, settingmasterOnly 0for theens3f2andens3f3interfaces enables both ports on theens3interface to run as leader or follower clocks. In combination with theslaveOnly 1specification, this configuration ensures one port operates as the active ordinary clock, and the other port operates as a standby ordinary clock in theListeningport state. slaveOnly 1-
Configures
ptp4lto run as an ordinary clock only.
Create the
PtpConfigCR by running the following command:$ oc create -f oc-dual-port-ptp-config.yaml
Verification
Check that the
PtpConfigprofile is applied to the node.Get the list of pods in the
openshift-ptpnamespace by running the following command:$ oc get pods -n openshift-ptp -o wideExample output
NAME                            READY   STATUS    RESTARTS   AGE   IP               NODE
linuxptp-daemon-4xkbb           1/1     Running   0          43m   10.1.196.24      compute-0.example.com
linuxptp-daemon-tdspf           1/1     Running   0          43m   10.1.196.25      compute-1.example.com
ptp-operator-657bbb64c8-2f8sj   1/1     Running   0          43m   10.129.0.61      control-plane-1.example.com
Check that the profile is correct. Examine the logs of the
linuxptpdaemon that corresponds to the node you specified in thePtpConfigprofile. Run the following command:$ oc logs linuxptp-daemon-4xkbb -n openshift-ptp -c linuxptp-daemon-containerExample output
I1115 09:41:17.117596 4143292 daemon.go:107] in applyNodePTPProfile
I1115 09:41:17.117604 4143292 daemon.go:109] updating NodePTPProfile to:
I1115 09:41:17.117607 4143292 daemon.go:110] ------------------------------------
I1115 09:41:17.117612 4143292 daemon.go:102] Profile Name: oc-dual-port
I1115 09:41:17.117616 4143292 daemon.go:102] Interface: ens787f1
I1115 09:41:17.117620 4143292 daemon.go:102] Ptp4lOpts: -2 --summary_interval -4
I1115 09:41:17.117623 4143292 daemon.go:102] Phc2sysOpts: -a -r -n 24 -N 8 -R 16 -u 0
I1115 09:41:17.117626 4143292 daemon.go:116] ------------------------------------
8.2.10. Configuring FIFO priority scheduling for PTP hardware
In telco or other deployment types that require low latency performance, PTP daemon threads run in a constrained CPU footprint alongside the rest of the infrastructure components. By default, PTP threads run with the SCHED_OTHER policy. Under high load, these threads might not get the scheduling latency they require for error-free operation.
To mitigate against potential scheduling latency errors, you can configure the PTP Operator linuxptp services to allow threads to run with a SCHED_FIFO policy. If SCHED_FIFO is set for a PtpConfig CR, then ptp4l and phc2sys will run in the parent container under chrt with a priority set by the ptpSchedulingPriority field of the PtpConfig CR.
Setting ptpSchedulingPolicy is optional, and is only required if you are experiencing latency errors.
Procedure
Edit the
PtpConfigCR profile:$ oc edit PtpConfig -n openshift-ptpChange the
ptpSchedulingPolicyandptpSchedulingPriorityfields:apiVersion: ptp.openshift.io/v1 kind: PtpConfig metadata: name: <ptp_config_name> namespace: openshift-ptp ... spec: profile: - name: "profile1" ... ptpSchedulingPolicy: SCHED_FIFO ptpSchedulingPriority: 10where:
ptpSchedulingPolicy: SCHED_FIFO-
Sets the scheduling policy for
ptp4landphc2sysprocesses. UseSCHED_FIFOon systems that support FIFO scheduling. ptpSchedulingPriority: 10-
Sets the integer value 1-65 used to configure FIFO priority for
ptp4landphc2sysprocesses.
-
Save and exit to apply the changes to the
PtpConfigCR.
Verification
Get the name of the
linuxptp-daemonpod and corresponding node where thePtpConfigCR has been applied:$ oc get pods -n openshift-ptp -o wideExample output
NAME                            READY   STATUS    RESTARTS   AGE     IP            NODE
linuxptp-daemon-gmv2n           3/3     Running   0          1d17h   10.1.196.24   compute-0.example.com
linuxptp-daemon-lgm55           3/3     Running   0          1d17h   10.1.196.25   compute-1.example.com
ptp-operator-3r4dcvf7f4-zndk7   1/1     Running   0          1d7h    10.129.0.61   control-plane-1.example.com
Check that the
ptp4lprocess is running with the updatedchrtFIFO priority:$ oc -n openshift-ptp logs linuxptp-daemon-lgm55 -c linuxptp-daemon-container|grep chrtExample output
I1216 19:24:57.091872 1600715 daemon.go:285] /bin/chrt -f 65 /usr/sbin/ptp4l -f /var/run/ptp4l.0.config -2 --summary_interval -4 -m
8.2.11. Configuring log filtering for linuxptp services
Modify the PtpConfig custom resource (CR) to configure basic log filtering and exclude log messages that report the master offset value.
Prerequisites
-
Install the OpenShift CLI (
oc). -
Log in as a user with
cluster-adminprivileges. - Install the PTP Operator.
Procedure
Edit the
PtpConfigCR:$ oc edit PtpConfig -n openshift-ptpIn
spec.profile, add theptpSettings.logReducespecification and set the value totrue:apiVersion: ptp.openshift.io/v1 kind: PtpConfig metadata: name: <ptp_config_name> namespace: openshift-ptp ... spec: profile: - name: "profile1" ... ptpSettings: logReduce: "true"NoteFor debugging purposes, you can revert this specification to
Falseto include the master offset messages.-
Save and exit to apply the changes to the
PtpConfigCR.
Verification
Get the name of the
linuxptp-daemonpod and corresponding node where thePtpConfigCR has been applied:$ oc get pods -n openshift-ptp -o wideExample output
NAME                            READY   STATUS    RESTARTS   AGE     IP            NODE
linuxptp-daemon-gmv2n           3/3     Running   0          1d17h   10.1.196.24   compute-0.example.com
linuxptp-daemon-lgm55           3/3     Running   0          1d17h   10.1.196.25   compute-1.example.com
ptp-operator-3r4dcvf7f4-zndk7   1/1     Running   0          1d7h    10.129.0.61   control-plane-1.example.com
Verify that master offset messages are excluded from the logs by running the following command:
$ oc -n openshift-ptp logs <linux_daemon_container> -c linuxptp-daemon-container | grep "master offset"<linux_daemon_container>is the name of thelinuxptp-daemonpod, for examplelinuxptp-daemon-gmv2n.When you configure the
logReducespecification, this command does not report any instances ofmaster offsetin the logs of thelinuxptpdaemon.
8.2.12. Configuring GNSS failover to NTP for time synchronization continuity
Automatic failover from global navigation satellite system (GNSS) to Network Time Protocol (NTP) maintains time synchronization continuity when the primary signal is lost, ensuring system stability for telco operations.
Telco operators require time source redundancy to ensure time synchronization continuity and system stability.
OpenShift Container Platform provides automatic failover capabilities to maintain synchronization. The system utilizes GNSS (delivered by phc2sys) as the primary time source. To protect against primary signal loss, such as jamming or antenna failure, the system automatically transitions to the secondary time source, NTP delivered by chronyd. Upon signal recovery, the system automatically switches back to and resumes synchronization with phc2sys.
You can control the resilience of the time synchronization by setting the ts2phc.holdover parameter in seconds. This value dictates the maximum time the internal control algorithm can continue synchronizing the PHC after the main time of day (ToD) source such as a GNSS receiver is lost. The algorithm can only continue if it remains in a stable state (SERVO_LOCKED_STABLE). When the process exits this configured holdover period, it signifies an unrecoverable primary signal loss. The system then allows failover to a secondary source such as NTP.
8.2.12.1. Creating a PTP Grandmaster configuration with GNSS failover
Configure a Precision Time Protocol (PTP) Telecom Grandmaster clock with automatic failover from global navigation satellite system (GNSS) to Network Time Protocol (NTP) when satellite signals are unavailable.
This procedure configures a T-GM (Telecom Grandmaster) clock that uses an Intel E810 Westport Channel NIC as the PTP grandmaster clock with GNSS to NTP failover capabilities.
Prerequisites
- For T-GM clocks in production environments, install an Intel E810 Westport Channel NIC in the bare-metal cluster host.
-
Install the OpenShift CLI (
oc). -
Log in as a user with
cluster-adminprivileges. - Install the PTP Operator.
Procedure
Verify the PTP Operator installation by running the following command:
$ oc get pods -n openshift-ptp -o wideThe output is similar to the following listing the PTP Operator pod and the
linuxptp-daemonpods:NAME READY STATUS RESTARTS AGE IP NODE NOMINATED NODE READINESS GATES linuxptp-daemon-4xk9m 2/2 Running 0 15m 192.168.1.101 worker-0.cluster.local <none> <none> linuxptp-daemon-7bv2n 2/2 Running 0 15m 192.168.1.102 worker-1.cluster.local <none> <none> linuxptp-daemon-9cp4r 2/2 Running 0 15m 192.168.1.103 worker-2.cluster.local <none> <none> linuxptp-daemon-kw8h5 2/2 Running 0 15m 192.168.1.104 worker-3.cluster.local <none> <none> linuxptp-daemon-m3j7t 2/2 Running 0 15m 192.168.1.105 worker-4.cluster.local <none> <none> ptp-operator-75c77dbf86-xm9kl 1/1 Running 0 20m 10.129.0.45 master-1.cluster.local <none> <none>-
ptp-operator-*: The PTP Operator pod (one instance in the cluster) linuxptp-daemon-*: The linuxptp daemon pods. A daemon pod runs on each node that matches the PtpConfig profile. Each daemon pod should show2/2in the READY column, indicating both containers (linuxptp-daemon-containerandkube-rbac-proxy) are running.NoteThe number of
linuxptp-daemonpods is determined by the node labels defined in thePtpOperatorConfigwhich controls the DaemonSet deployment. The PtpConfig profile matching, as shown in Step 4, only determines which specific PTP settings are applied on the running daemons. In this example, the operator configuration targets all 5 worker nodes. For single-node OpenShift clusters, you will see only onelinuxptp-daemonpod, as the configuration targets only the control plane node which acts as the worker.
-
Check which network interfaces support hardware timestamping by running the following command:
$ oc get NodePtpDevice -n openshift-ptp -o yamlThe output is similar to the following showing NodePtpDevice resources for nodes with PTP-capable network interfaces:
apiVersion: v1
items:
- apiVersion: ptp.openshift.io/v1
  kind: NodePtpDevice
  metadata:
    name: worker-0.cluster.local
    namespace: openshift-ptp
  spec: {}
  status:
    devices:
    - name: ens7f0
      hwConfig:
        phcIndex: 0
    - name: ens7f1
      hwConfig:
        phcIndex: 1
- apiVersion: ptp.openshift.io/v1
  kind: NodePtpDevice
  metadata:
    name: worker-1.cluster.local
    namespace: openshift-ptp
  spec: {}
  status:
    devices:
    - name: ens7f0
      hwConfig:
        phcIndex: 0
    - name: ens7f1
      hwConfig:
        phcIndex: 1
kind: List
metadata:
  resourceVersion: ""
In this example output:
-
ens7f0andens7f1are PTP-capable interfaces (Intel E810 NIC ports). phcIndexindicates the PTP Hardware Clock number (maps to/dev/ptp0,/dev/ptp1, and so on).NoteThe output shows one NodePtpDevice resource for each node with PTP-capable interfaces. In this example, five worker nodes have Intel E810 NICs. For single-node OpenShift clusters, you would see only one NodePtpDevice resource.
-
The PTP profile uses node labels for matching. Check your machine config pool (MCP) to find the node labels by running the following command:
$ oc get mcpThe output is similar to the following:
NAME CONFIG UPDATED UPDATING DEGRADED MACHINECOUNT READYMACHINECOUNT UPDATEDMACHINECOUNT DEGRADEDMACHINECOUNT AGE master rendered-master-a1b1** True False False 3 3 3 0 45d worker rendered-worker-f6e5** True False False 5 5 5 0 45dNoteThe CONFIG column shows a truncated hash of the rendered MachineConfig. In actual output, this will be a full 64-character hash such as
rendered-master-a1b2c3d4e5f6a7b8c9d0e1f2a3b4c5d6.-
In this example, the
<MCP-name>isworkerfor worker nodes andmasterfor control plane nodes. Most T-GM deployments use worker nodes, so you would useworkeras the<MCP-name>. -
For single-node OpenShift clusters, the
<MCP-name>ismaster(the worker MCP will showMACHINECOUNTof 0).
-
In this example, the
Create a
PtpConfigcustom resource (CR) that configures the T-GM clock with GNSS to NTP failover. Save the following YAML configuration to a file namedptp-config-gnss-ntp-failover.yaml, replacing<MCP-name>with the name of your machine config pool from the previous step.# The grandmaster profile is provided for testing only # It is not installed on production clusters apiVersion: ptp.openshift.io/v1 kind: PtpConfig metadata: name: grandmaster namespace: openshift-ptp annotations: ran.openshift.io/ztp-deploy-wave: "10" spec: profile: - name: "grandmaster" ptp4lOpts: "-2 --summary_interval -4" phc2sysOpts: -r -u 0 -m -N 8 -R 16 -s ens7f0 -n 24 ptpSchedulingPolicy: SCHED_FIFO ptpSchedulingPriority: 10 ptpSettings: logReduce: "true" # --- FAILOVER CONFIGURATION --- # Holdover time: 14400 seconds (4 hours) before switching to NTP ts2phcOpts: "--ts2phc.holdover 14400" # Configure Chronyd (Secondary Time Source) chronydOpts: "-d" chronydConf: | server time.nist.gov iburst makestep 1.0 -1 pidfile /var/run/chronyd.pid plugins: # E810 Hardware-Specific Configuration e810: enableDefaultConfig: false settings: LocalHoldoverTimeout: 14400 LocalMaxHoldoverOffSet: 1500 MaxInSpecOffset: 1500 pins: # Syntax guide: # - The 1st number in each pair must be one of: # 0 - Disabled # 1 - RX # 2 - TX # - The 2nd number in each pair must match the channel number ens7f0: SMA1: 0 1 SMA2: 0 2 U.FL1: 0 1 U.FL2: 0 2 ublxCmds: - args: #ubxtool -P 29.20 -z CFG-HW-ANT_CFG_VOLTCTRL,1 - "-P" - "29.20" - "-z" - "CFG-HW-ANT_CFG_VOLTCTRL,1" reportOutput: false - args: #ubxtool -P 29.20 -e GPS - "-P" - "29.20" - "-e" - "GPS" reportOutput: false - args: #ubxtool -P 29.20 -d Galileo - "-P" - "29.20" - "-d" - "Galileo" reportOutput: false - args: #ubxtool -P 29.20 -d GLONASS - "-P" - "29.20" - "-d" - "GLONASS" reportOutput: false - args: #ubxtool -P 29.20 -d BeiDou - "-P" - "29.20" - "-d" - "BeiDou" reportOutput: false - args: #ubxtool -P 29.20 -d SBAS - "-P" - "29.20" - "-d" - "SBAS" reportOutput: false - args: #ubxtool -P 29.20 -t -w 5 -v 1 -e SURVEYIN,600,50000 - "-P" - "29.20" - "-t" - "-w" - "5" - "-v" - "1" - "-e" - "SURVEYIN,600,50000" reportOutput: true - args: #ubxtool -P 29.20 -p MON-HW - "-P" - "29.20" - "-p" - "MON-HW" reportOutput: true - args: #ubxtool -P 29.20 -p CFG-MSG,1,38,248 - "-P" - "29.20" - "-p" - "CFG-MSG,1,38,248" reportOutput: true # NTP Failover Plugin ntpfailover: gnssFailover: true # --- GNSS (ts2phc) CONFIGURATION (Primary Source) --- ts2phcConf: | [nmea] ts2phc.master 1 [global] use_syslog 0 verbose 1 logging_level 7 ts2phc.pulsewidth 100000000 ts2phc.nmea_serialport /dev/ttyGNSS_1700_0 leapfile /usr/share/zoneinfo/leap-seconds.list [ens7f0] ts2phc.extts_polarity rising ts2phc.extts_correction 0 # --- PTP4L CONFIGURATION (Grandmaster Role) --- ptp4lConf: | [ens7f0] masterOnly 1 [ens7f1] masterOnly 1 [global] # # Default Data Set # twoStepFlag 1 priority1 128 priority2 128 domainNumber 24 #utc_offset 37 clockClass 6 clockAccuracy 0x27 offsetScaledLogVariance 0xFFFF free_running 0 freq_est_interval 1 dscp_event 0 dscp_general 0 dataset_comparison G.8275.x G.8275.defaultDS.localPriority 128 # # Port Data Set # logAnnounceInterval -3 logSyncInterval -4 logMinDelayReqInterval -4 logMinPdelayReqInterval 0 announceReceiptTimeout 3 syncReceiptTimeout 0 delayAsymmetry 0 fault_reset_interval -4 neighborPropDelayThresh 20000000 masterOnly 0 G.8275.portDS.localPriority 128 # # Run time options # assume_two_step 0 logging_level 6 path_trace_enabled 0 follow_up_info 0 hybrid_e2e 0 inhibit_multicast_service 0 net_sync_monitor 0 tc_spanning_tree 0 tx_timestamp_timeout 50 unicast_listen 0 unicast_master_table 0 unicast_req_duration 3600 use_syslog 1 verbose 0 summary_interval -4 kernel_leap 1 check_fup_sync 0 clock_class_threshold 7 # # Servo Options # pi_proportional_const 0.0 pi_integral_const 0.0 pi_proportional_scale 0.0 pi_proportional_exponent -0.3 pi_proportional_norm_max 0.7 pi_integral_scale 0.0 pi_integral_exponent 0.4 pi_integral_norm_max 0.3 step_threshold 2.0 first_step_threshold 0.00002 clock_servo pi sanity_freq_limit 200000000 ntpshm_segment 0 # # Transport options # transportSpecific 0x0 ptp_dst_mac 01:1B:19:00:00:00 p2p_dst_mac 01:80:C2:00:00:0E udp_ttl 1 udp6_scope 0x0E uds_address /var/run/ptp4l # # Default interface options # clock_type BC network_transport L2 delay_mechanism E2E time_stamping hardware tsproc_mode filter delay_filter moving_median delay_filter_length 10 egressLatency 0 ingressLatency 0 boundary_clock_jbod 0 # # Clock description # productDescription ;; revisionData ;; manufacturerIdentity 00:00:00 userDescription ; timeSource 0x20 ptpClockThreshold: holdOverTimeout: 5 maxOffsetThreshold: 100 minOffsetThreshold: -100 recommend: - profile: "grandmaster" priority: 4 match: - nodeLabel: node-role.kubernetes.io/<MCP-name>ImportantReplace the example interface names (
ens7f0,ens7f1) with your actual E810 NIC interface names found in step 2. Common E810 interface naming patterns includeens7f0,ens8f0,eth0,enp2s0f0, and so on. The exact name depends on your system firmware settings and Linux network device naming conventions. Also replace/dev/ttyGNSS_1700_0with your actual GNSS serial port device path. For single-node OpenShift clusters, replace<MCP-name>withmasterin the nodeLabel match. For multi-node clusters using worker nodes as T-GM, useworker.The configuration includes the following components:
PTP4L options:
-
-2: Use PTP version 2 -
--summary_interval -4: Log summary every 2^(-4) = 0.0625 seconds
-
PHC2SYS options:
-
-r: Synchronize system clock from PTP hardware clock -
-u 0: Update rate multiplier -
-m: Print messages to stdout -
-N 8: Domain number for ptp4l -
-R 16: Update rate -
-s ens7f0: Source interface (replace with your E810 interface name) -
-n 24: Domain number
-
Failover configuration:
-
ts2phcOpts --ts2phc.holdover 14400: 4-hour holdover before switching to NTP -
chronydConf: NTP server configuration for failover replacetime.nist.govwith your preferred NTP server -
ntpfailover plugin: Enables automatic GNSS-to-NTP switching withgnssFailover: true
-
E810 plugin configuration:
-
LocalHoldoverTimeout: 14400: E810 hardware holdover timeout (4 hours) -
pins: Configuration for 1PPS input on E810 physical pins (U.FL2, SMA1, SMA2, U.FL1) -
ublxCmds: Commands to configure u-blox GNSS receiver (enable GPS, disable other constellations, set survey-in mode)
-
GNSS (ts2phc) configuration:
-
ts2phc.nmea_serialport /dev/ttyGNSS_1700_0: GNSS serial port device path (replace with your actual GNSS device) -
ts2phc.extts_polarity rising: 1PPS signal on rising edge -
ts2phc.pulsewidth 100000000: 1PPS pulse width in nanoseconds
-
PTP4L configuration:
-
masterOnly 1: Interface acts only as PTP master -
clockClass 6: GPS-synchronized quality level -
domainNumber 24: PTP domain -
clock_type BC: Boundary Clock mode -
time_stamping hardware: Use hardware timestamps from E810 NIC
-
Apply the
PtpConfigCR by running the following command:$ oc apply -f ptp-config-gnss-ntp-failover.yamlThe output is similar to the following:
ptpconfig.ptp.openshift.io/grandmaster created
Verification
The PTP daemon checks for profile updates every 30 seconds. Wait approximately 30 seconds, then verify by running the following command:
$ oc get ptpconfig -n openshift-ptpThe output is similar to the following:
NAME           AGE
grandmaster    2m
Check the NodePtpDevice to see if the profile is applied by running the following command, replacing
<node_name>with your node hostname:$ oc describe nodeptpdevice <node_name> -n openshift-ptpFor example, on a multi-node cluster with worker nodes:
worker-0.cluster.localFor single-node OpenShift clusters, use the control plane node name, which you can find by running:
$ oc get nodesCheck if the profile is being loaded by monitoring the daemon logs:
$ oc get pods -n openshift-ptp | grep linuxptp-daemonThen check the logs, replacing
<linuxptp-daemon-pod>with the actual pod name from the previous command:$ oc logs -n openshift-ptp <linuxptp-daemon-pod> -c linuxptp-daemon-container --tail=100Success indicators in the logs are:
-
load profiles- Profile is being loaded -
in applyNodePTPProfiles- Profile is being applied -
No
ptp profile doesn’t exist for nodeerrors
-
Check
chronydstatus to verify NTP is running as the secondary time source by running the following command:$ oc logs -n openshift-ptp <linuxptp-daemon-pod> -c linuxptp-daemon-container | grep chronydThe output is similar to the following:
chronyd version 4.5 starting
Added source ID#0000000001 (time.nist.gov)
Check GNSS/gpsd by running the following command:
$ oc logs -n openshift-ptp <linuxptp-daemon-pod> -c linuxptp-daemon-container | grep gpsdThe output shows the following when GNSS is functioning correctly:
-
gpsdstarting successfully -
No
No such file or directoryerrors exist
-
Check
ts2phc(GNSS synchronization) status by running the following command:$ oc logs -n openshift-ptp <linuxptp-daemon-pod> -c linuxptp-daemon-container | grep ts2phcCheck
phc2sys(system clock sync) status by running the following command:$ oc logs -n openshift-ptp <linuxptp-daemon-pod> -c linuxptp-daemon-container | grep phc2sysThe output shows synchronization status messages for
phc2sys.phc2sys[xxx]: CLOCK_REALTIME phc offset -17 s2 freq -13865 delay 2305
8.2.12.2. Creating a PTP Grandmaster configuration with GNSS failover on Single Node OpenShift
This procedure configures a T-GM (Telecom Grandmaster) clock on single-node OpenShift that uses an Intel E810 Westport Channel NIC as the PTP grandmaster clock with GNSS to NTP failover capabilities.
Prerequisites
- For T-GM clocks in production environments, install an Intel E810 Westport Channel NIC in the bare metal single-node OpenShift host.
-
Install the OpenShift CLI (
oc). -
Log in as a user with
cluster-adminprivileges. - Install the PTP Operator.
Procedure
Verify the PTP Operator installation by running the following command:
$ oc get pods -n openshift-ptp -o wideThe output is similar to the following listing the PTP Operator pod and the single
linuxptp-daemonpod:NAME READY STATUS RESTARTS AGE IP NODE NOMINATED NODE READINESS GATES linuxptp-daemon-xz8km 2/2 Running 0 15m 192.168.1.50 mysno-sno.demo.lab <none> <none> ptp-operator-75c77dbf86-xm9kl 1/1 Running 0 20m 10.129.0.45 mysno-sno.demo.lab <none> <none>-
ptp-operator-*: The PTP Operator pod (one instance in the cluster). -
linuxptp-daemon-*: The linuxptp daemon pod. On single-node OpenShift, there is only one daemon pod running on the master node. The daemon pod should show2/2in the READY column, indicating both containers (linuxptp-daemon-containerandkube-rbac-proxy) are running.
-
Check which network interfaces support hardware timestamping by running the following command:
$ oc get NodePtpDevice -n openshift-ptp -o yamlThe output is similar to the following one, showing the NodePtpDevice resource for the single-node OpenShift node with PTP-capable network interfaces:
apiVersion: v1
items:
- apiVersion: ptp.openshift.io/v1
  kind: NodePtpDevice
  metadata:
    name: mysno-sno.demo.lab
    namespace: openshift-ptp
  spec: {}
  status:
    devices:
    - name: ens7f0
      hwConfig:
        phcIndex: 0
    - name: ens7f1
      hwConfig:
        phcIndex: 1
kind: List
metadata:
  resourceVersion: ""
In this example output:
-
ens7f0andens7f1are PTP-capable interfaces (Intel E810 NIC ports). phcIndexindicates the PTP Hardware Clock number (maps to/dev/ptp0,/dev/ptp1, etc.)NoteOn single-node OpenShift clusters, you will see only one NodePtpDevice resource for the single master node.
-
The PTP profile uses node labels for matching. Check your machine config pool (MCP) to verify the master MCP by running the following command:
$ oc get mcpThe output is similar to the following:
NAME CONFIG UPDATED UPDATING DEGRADED MACHINECOUNT READYMACHINECOUNT UPDATEDMACHINECOUNT DEGRADEDMACHINECOUNT AGE master rendered-master-a1b1* True False False 1 1 1 0 45d worker rendered-worker-f6e5* True False False 0 0 0 0 45dNoteThe CONFIG column shows a truncated hash of the rendered MachineConfig. In actual output, this will be a full 64-character hash like
rendered-master-a1b2c3d4e5f6a7b8c9d0e1f2a3b4c5d6.On single-node OpenShift clusters, the master MCP shows
MACHINECOUNTof 1 (the single node), and the worker MCP showsMACHINECOUNTof 0. The PTP profile must target themasternode label.Create a
PtpConfigcustom resource (CR) that configures the T-GM clock with GNSS to NTP failover. Save the following YAML configuration to a file namedptp-config-gnss-ntp-failover-sno.yaml.# The grandmaster profile is provided for testing only # It is not installed on production clusters apiVersion: ptp.openshift.io/v1 kind: PtpConfig metadata: name: grandmaster namespace: openshift-ptp annotations: ran.openshift.io/ztp-deploy-wave: "10" spec: profile: - name: "grandmaster" ptp4lOpts: "-2 --summary_interval -4" phc2sysOpts: -r -u 0 -m -N 8 -R 16 -s ens7f0 -n 24 ptpSchedulingPolicy: SCHED_FIFO ptpSchedulingPriority: 10 ptpSettings: logReduce: "true" # --- FAILOVER CONFIGURATION --- # Holdover time: 14400 seconds (4 hours) before switching to NTP ts2phcOpts: "--ts2phc.holdover 14400" # Configure Chronyd (Secondary Time Source) chronydOpts: "-d" chronydConf: | server time.nist.gov iburst makestep 1.0 -1 pidfile /var/run/chronyd.pid plugins: # E810 Hardware-Specific Configuration e810: enableDefaultConfig: false settings: LocalHoldoverTimeout: 14400 LocalMaxHoldoverOffSet: 1500 MaxInSpecOffset: 1500 pins: # Syntax guide: # - The 1st number in each pair must be one of: # 0 - Disabled # 1 - RX # 2 - TX # - The 2nd number in each pair must match the channel number ens7f0: SMA1: 0 1 SMA2: 0 2 U.FL1: 0 1 U.FL2: 0 2 ublxCmds: - args: #ubxtool -P 29.20 -z CFG-HW-ANT_CFG_VOLTCTRL,1 - "-P" - "29.20" - "-z" - "CFG-HW-ANT_CFG_VOLTCTRL,1" reportOutput: false - args: #ubxtool -P 29.20 -e GPS - "-P" - "29.20" - "-e" - "GPS" reportOutput: false - args: #ubxtool -P 29.20 -d Galileo - "-P" - "29.20" - "-d" - "Galileo" reportOutput: false - args: #ubxtool -P 29.20 -d GLONASS - "-P" - "29.20" - "-d" - "GLONASS" reportOutput: false - args: #ubxtool -P 29.20 -d BeiDou - "-P" - "29.20" - "-d" - "BeiDou" reportOutput: false - args: #ubxtool -P 29.20 -d SBAS - "-P" - "29.20" - "-d" - "SBAS" reportOutput: false - args: #ubxtool -P 29.20 -t -w 5 -v 1 -e SURVEYIN,600,50000 - "-P" - "29.20" - "-t" - "-w" - "5" - "-v" - "1" - "-e" - "SURVEYIN,600,50000" reportOutput: true - args: #ubxtool -P 29.20 -p MON-HW - "-P" - "29.20" - "-p" - "MON-HW" reportOutput: true - args: #ubxtool -P 29.20 -p CFG-MSG,1,38,248 - "-P" - "29.20" - "-p" - "CFG-MSG,1,38,248" reportOutput: true # NTP Failover Plugin ntpfailover: gnssFailover: true # --- GNSS (ts2phc) CONFIGURATION (Primary Source) --- ts2phcConf: | [nmea] ts2phc.master 1 [global] use_syslog 0 verbose 1 logging_level 7 ts2phc.pulsewidth 100000000 ts2phc.nmea_serialport /dev/ttyGNSS_1700_0 leapfile /usr/share/zoneinfo/leap-seconds.list [ens7f0] ts2phc.extts_polarity rising ts2phc.extts_correction 0 # --- PTP4L CONFIGURATION (Grandmaster Role) --- ptp4lConf: | [ens7f0] masterOnly 1 [ens7f1] masterOnly 1 [global] # # Default Data Set # twoStepFlag 1 priority1 128 priority2 128 domainNumber 24 #utc_offset 37 clockClass 6 clockAccuracy 0x27 offsetScaledLogVariance 0xFFFF free_running 0 freq_est_interval 1 dscp_event 0 dscp_general 0 dataset_comparison G.8275.x G.8275.defaultDS.localPriority 128 # # Port Data Set # logAnnounceInterval -3 logSyncInterval -4 logMinDelayReqInterval -4 logMinPdelayReqInterval 0 announceReceiptTimeout 3 syncReceiptTimeout 0 delayAsymmetry 0 fault_reset_interval -4 neighborPropDelayThresh 20000000 masterOnly 0 G.8275.portDS.localPriority 128 # # Run time options # assume_two_step 0 logging_level 6 path_trace_enabled 0 follow_up_info 0 hybrid_e2e 0 inhibit_multicast_service 0 net_sync_monitor 0 tc_spanning_tree 0 tx_timestamp_timeout 50 unicast_listen 0 unicast_master_table 0 unicast_req_duration 3600 use_syslog 1 verbose 0 summary_interval -4 kernel_leap 1 check_fup_sync 0 clock_class_threshold 7 # # Servo Options # pi_proportional_const 0.0 pi_integral_const 0.0 pi_proportional_scale 0.0 pi_proportional_exponent -0.3 pi_proportional_norm_max 0.7 pi_integral_scale 0.0 pi_integral_exponent 0.4 pi_integral_norm_max 0.3 step_threshold 2.0 first_step_threshold 0.00002 clock_servo pi sanity_freq_limit 200000000 ntpshm_segment 0 # # Transport options # transportSpecific 0x0 ptp_dst_mac 01:1B:19:00:00:00 p2p_dst_mac 01:80:C2:00:00:0E udp_ttl 1 udp6_scope 0x0E uds_address /var/run/ptp4l # # Default interface options # clock_type BC network_transport L2 delay_mechanism E2E time_stamping hardware tsproc_mode filter delay_filter moving_median delay_filter_length 10 egressLatency 0 ingressLatency 0 boundary_clock_jbod 0 # # Clock description # productDescription ;; revisionData ;; manufacturerIdentity 00:00:00 userDescription ; timeSource 0x20 ptpClockThreshold: holdOverTimeout: 5 maxOffsetThreshold: 100 minOffsetThreshold: -100 recommend: - profile: "grandmaster" priority: 4 match: - nodeLabel: node-role.kubernetes.io/masterImportantReplace the example interface names (
ens7f0,ens7f1) with your actual E810 NIC interface names found in step 2. Common E810 interface naming patterns includeens7f0,ens8f0,eth0,enp2s0f0, and so on. The exact name depends on your system BIOS settings and Linux network device naming conventions. Also, replace/dev/ttyGNSS_1700_0with your actual GNSS serial port device path. ThenodeLabelis set tonode-role.kubernetes.io/masterto target the single-node OpenShift master node which serves all roles.The configuration includes the following components:
PTP4L options:
-
-2: Use PTP version 2 -
--summary_interval -4: Log summary every 2^(-4) = 0.0625 seconds
-
PHC2SYS options:
-
-r: Synchronize system clock from PTP hardware clock -
-u 0: Update rate multiplier -
-m: Print messages to stdout -
-N 8: Domain number for ptp4l -
-R 16: Update rate -
-s ens7f0: Source interface (replace with your E810 interface name) -
-n 24: Domain number
-
Failover configuration:
-
ts2phcOpts --ts2phc.holdover 14400: 4-hour holdover before switching to NTP -
chronydConf: NTP server configuration for failover replacetime.nist.govwith your preferred NTP server -
ntpfailover plugin: Enables automatic GNSS-to-NTP switching withgnssFailover: true.
-
E810 plugin configuration:
-
LocalHoldoverTimeout: 14400: E810 hardware holdover timeout (4 hours) -
pins: Configuration for 1PPS input on E810 physical pins (U.FL2, SMA1, SMA2, U.FL1) -
ublxCmds: Commands to configure u-blox GNSS receiver (enable GPS, disable other constellations, set survey-in mode)
-
GNSS (ts2phc) configuration:
-
ts2phc.nmea_serialport /dev/ttyGNSS_1700_0: GNSS serial port device path (replace with your actual GNSS device) -
ts2phc.extts_polarity rising: 1PPS signal on rising edge -
ts2phc.pulsewidth 100000000: 1PPS pulse width in nanoseconds
-
PTP4L configuration:
-
masterOnly 1: Interface acts only as PTP master -
clockClass 6: GPS-synchronized quality level -
domainNumber 24: PTP domain -
clock_type BC: Boundary Clock mode -
time_stamping hardware: Use hardware timestamps from E810 NIC
-
Apply the
PtpConfigCR by running the following command:$ oc apply -f ptp-config-gnss-ntp-failover-sno.yamlThe output is similar to the following:
ptpconfig.ptp.openshift.io/grandmaster created
Verification
The PTP daemon checks for profile updates every 30 seconds. Wait approximately 30 seconds, then verify by running the following command:
$ oc get ptpconfig -n openshift-ptpThe output is similar to the following:
NAME           AGE
grandmaster    2m
Check the NodePtpDevice to see if the profile is applied. First, get your single-node OpenShift node name:
$ oc get nodesThe output is similar to the following:
NAME                 STATUS   ROLES                         AGE     VERSION
mysno-sno.demo.lab   Ready    control-plane,master,worker   4h19m   v1.34.1
Then describe the NodePtpDevice using your node name:
$ oc describe nodeptpdevice mysno-sno.demo.lab -n openshift-ptpCheck if the profile is being loaded by monitoring the daemon logs. First, get the daemon pod name:
$ oc get pods -n openshift-ptp | grep linuxptp-daemonThe output shows the single linuxptp-daemon pod:
linuxptp-daemon-xz8km 2/2 Running 0 15mThen check the logs using the pod name:
$ oc logs -n openshift-ptp linuxptp-daemon-xz8km -c linuxptp-daemon-container --tail=100Success indicators in the logs are:
-
load profiles- Profile is being loaded -
in applyNodePTPProfiles- Profile is being applied -
No
ptp profile doesn’t exist for nodeerrors
-
Check
chronydstatus to verify NTP is running as the secondary time source by running the following command:$ oc logs -n openshift-ptp linuxptp-daemon-xz8km -c linuxptp-daemon-container | grep chronydThe output is similar to the following:
chronyd version 4.5 starting
Added source ID#0000000001 (time.nist.gov)
Check GNSS/gpsd by running the following command:
$ oc logs -n openshift-ptp linuxptp-daemon-xz8km -c linuxptp-daemon-container | grep gpsdThe output shows the following when GNSS is functioning correctly:
-
gpsdstarting successfully -
No
No such file or directoryerrors exist
-
Check
ts2phc(GNSS synchronization) status by running the following command:$ oc logs -n openshift-ptp linuxptp-daemon-xz8km -c linuxptp-daemon-container | grep ts2phcCheck
phc2sys(system clock sync) status by running the following command:$ oc logs -n openshift-ptp linuxptp-daemon-xz8km -c linuxptp-daemon-container | grep phc2sysThe output shows synchronization status messages for
phc2sys.phc2sys[xxx]: CLOCK_REALTIME phc offset -17 s2 freq -13865 delay 2305
8.2.13. Troubleshooting common PTP Operator issues
Troubleshoot common problems with the PTP Operator by performing the following steps.
Prerequisites
-
Install the OpenShift Container Platform CLI (
oc). -
Log in as a user with
cluster-adminprivileges. - Install the PTP Operator on a bare-metal cluster with hosts that support PTP.
Procedure
Check the Operator and operands are successfully deployed in the cluster for the configured nodes.
$ oc get pods -n openshift-ptp -o wideExample output
NAME READY STATUS RESTARTS AGE IP NODE linuxptp-daemon-lmvgn 3/3 Running 0 4d17h 10.1.196.24 compute-0.example.com linuxptp-daemon-qhfg7 3/3 Running 0 4d17h 10.1.196.25 compute-1.example.com ptp-operator-6b8dcbf7f4-zndk7 1/1 Running 0 5d7h 10.129.0.61 control-plane-1.example.comNoteWhen the PTP fast event bus is enabled, the number of ready
linuxptp-daemonpods is3/3. If the PTP fast event bus is not enabled,2/2is displayed.Check that supported hardware is found in the cluster.
$ oc -n openshift-ptp get nodeptpdevices.ptp.openshift.ioExample output
NAME                                  AGE
control-plane-0.example.com           10d
control-plane-1.example.com           10d
compute-0.example.com                 10d
compute-1.example.com                 10d
compute-2.example.com                 10d
Check the available PTP network interfaces for a node:
$ oc -n openshift-ptp get nodeptpdevices.ptp.openshift.io <node_name> -o yamlwhere:
- <node_name>
Specifies the node you want to query, for example,
compute-0.example.com.Example output
apiVersion: ptp.openshift.io/v1
kind: NodePtpDevice
metadata:
  creationTimestamp: "2021-09-14T16:52:33Z"
  generation: 1
  name: compute-0.example.com
  namespace: openshift-ptp
  resourceVersion: "177400"
  uid: 30413db0-4d8d-46da-9bef-737bacd548fd
spec: {}
status:
  devices:
  - name: eno1
  - name: eno2
  - name: eno3
  - name: eno4
  - name: enp5s0f0
  - name: enp5s0f1
Check that the PTP interface is successfully synchronized to the primary clock by accessing the
linuxptp-daemonpod for the corresponding node.Get the name of the
linuxptp-daemonpod and corresponding node you want to troubleshoot by running the following command:$ oc get pods -n openshift-ptp -o wideExample output
NAME                            READY   STATUS    RESTARTS   AGE     IP            NODE
linuxptp-daemon-lmvgn           3/3     Running   0          4d17h   10.1.196.24   compute-0.example.com
linuxptp-daemon-qhfg7           3/3     Running   0          4d17h   10.1.196.25   compute-1.example.com
ptp-operator-6b8dcbf7f4-zndk7   1/1     Running   0          5d7h    10.129.0.61   control-plane-1.example.com
Remote shell into the required
linuxptp-daemoncontainer:$ oc rsh -n openshift-ptp -c linuxptp-daemon-container <linux_daemon_container>where:
- <linux_daemon_container>
-
is the container you want to diagnose, for example
linuxptp-daemon-lmvgn.
In the remote shell connection to the
linuxptp-daemoncontainer, use the PTP Management Client (pmc) tool to diagnose the network interface. Run the followingpmccommand to check the sync status of the PTP device, for exampleptp4l.# pmc -u -f /var/run/ptp4l.0.config -b 0 'GET PORT_DATA_SET'Example output when the node is successfully synced to the primary clock
sending: GET PORT_DATA_SET
    40a6b7.fffe.166ef0-1 seq 0 RESPONSE MANAGEMENT PORT_DATA_SET
        portIdentity            40a6b7.fffe.166ef0-1
        portState               SLAVE
        logMinDelayReqInterval  -4
        peerMeanPathDelay       0
        logAnnounceInterval     -3
        announceReceiptTimeout  3
        logSyncInterval         -4
        delayMechanism          1
        logMinPdelayReqInterval -4
        versionNumber           2
For GNSS-sourced grandmaster clocks, verify that the in-tree NIC ice driver is correct by running the following command, for example:
$ oc rsh -n openshift-ptp -c linuxptp-daemon-container linuxptp-daemon-74m2g ethtool -i ens7f0Example output
driver: ice
version: 5.14.0-356.bz2232515.el9.x86_64
firmware-version: 4.20 0x8001778b 1.3346.0
For GNSS-sourced grandmaster clocks, verify that the
linuxptp-daemoncontainer is receiving signal from the GNSS antenna. If the container is not receiving the GNSS signal, the/dev/gnss0file is not populated. To verify, run the following command:$ oc rsh -n openshift-ptp -c linuxptp-daemon-container linuxptp-daemon-jnz6r cat /dev/gnss0Example output
$GNRMC,125223.00,A,4233.24463,N,07126.64561,W,0.000,,300823,,,A,V*0A
$GNVTG,,T,,M,0.000,N,0.000,K,A*3D
$GNGGA,125223.00,4233.24463,N,07126.64561,W,1,12,99.99,98.6,M,-33.1,M,,*7E
$GNGSA,A,3,25,17,19,11,12,06,05,04,09,20,,,99.99,99.99,99.99,1*37
$GPGSV,3,1,10,04,12,039,41,05,31,222,46,06,50,064,48,09,28,064,42,1*62
8.2.14. Getting the DPLL firmware version for the CGU in an Intel 800 series NIC
You can get the digital phase-locked loop (DPLL) firmware version for the Clock Generation Unit (CGU) in an Intel 800 series NIC by opening a debug shell to the cluster node and querying the NIC hardware.
Prerequisites
-
You have installed the OpenShift CLI (
oc). -
You have logged in as a user with
cluster-adminprivileges. - You have installed an Intel 800 series NIC in the cluster host.
- You have installed the PTP Operator on a bare-metal cluster with hosts that support PTP.
Procedure
Start a debug pod by running the following command:
$ oc debug node/<node_name>where:
- <node_name>
- Is the node where you have installed the Intel 800 series NIC.
Check the CGU firmware version in the NIC by using the
devlinktool and the bus and device name where the NIC is installed. For example, run the following command:sh-4.4# devlink dev info <bus_name>/<device_name> | grep cguwhere:
- <bus_name>
-
Is the bus where the NIC is installed. For example,
pci. - <device_name>
-
Is the NIC device name. For example,
0000:51:00.0.
Example output
cgu.id 36
fw.cgu 8032.16973825.6021
where:
cgu.id 36- CGU hardware revision number.
fw.cgu 8032.16973825.6021-
DPLL firmware version running in the CGU, where the DPLL firmware version is
6201, and the DPLL model is8032. The string16973825is a shorthand representation of the binary version of the DPLL firmware version (1.3.0.1).
NoteThe firmware version has a leading nibble and 3 octets for each part of the version number. The number
16973825in binary is0001 0000 0011 0000 0000 0000 0001. Use the binary value to decode the firmware version. For example:Expand Table 8.10. DPLL firmware version Binary part Decimal value 00011
0000 00113
0000 00000
0000 00011
8.2.15. Collecting PTP Operator data
You can use the oc adm must-gather command to collect information about your cluster, including features and objects associated with PTP Operator.
Prerequisites
-
You have access to the cluster as a user with the
cluster-adminrole. -
You have installed the OpenShift CLI (
oc). - You have installed the PTP Operator.
Procedure
To collect PTP Operator data with
must-gather, you must specify the PTP Operatormust-gatherimage.$ oc adm must-gather --image=registry.redhat.io/openshift4/ptp-must-gather-rhel9:v4.19
8.3. Developing PTP events consumer applications with the REST API v2
When developing consumer applications that make use of Precision Time Protocol (PTP) events on a bare-metal cluster node, you deploy your consumer application in a separate application pod. The consumer application subscribes to PTP events by using the PTP events REST API v2.
The following information provides general guidance for developing consumer applications that use PTP events. A complete events consumer application example is outside the scope of this information.
8.3.1. About the PTP fast event notifications framework
Use the Precision Time Protocol (PTP) fast event REST API v2 to subscribe cluster applications to PTP events that the bare-metal cluster node generates.
The fast events notifications framework uses a REST API for communication. The PTP events REST API v2 is based on the O-RAN O-Cloud Notification API Specification for Event Consumers 4.0 that is available from O-RAN ALLIANCE Specifications.
8.3.2. Retrieving PTP events with the PTP events REST API v2
Applications subscribe to PTP events by using an O-RAN v4 compatible REST API in the producer-side cloud event proxy sidecar. The cloud-event-proxy sidecar container can access the same resources as the primary application container without using any of the resources of the primary application and with no significant latency.
Figure 8.6. Overview of consuming PTP fast events from the PTP event producer REST API v2
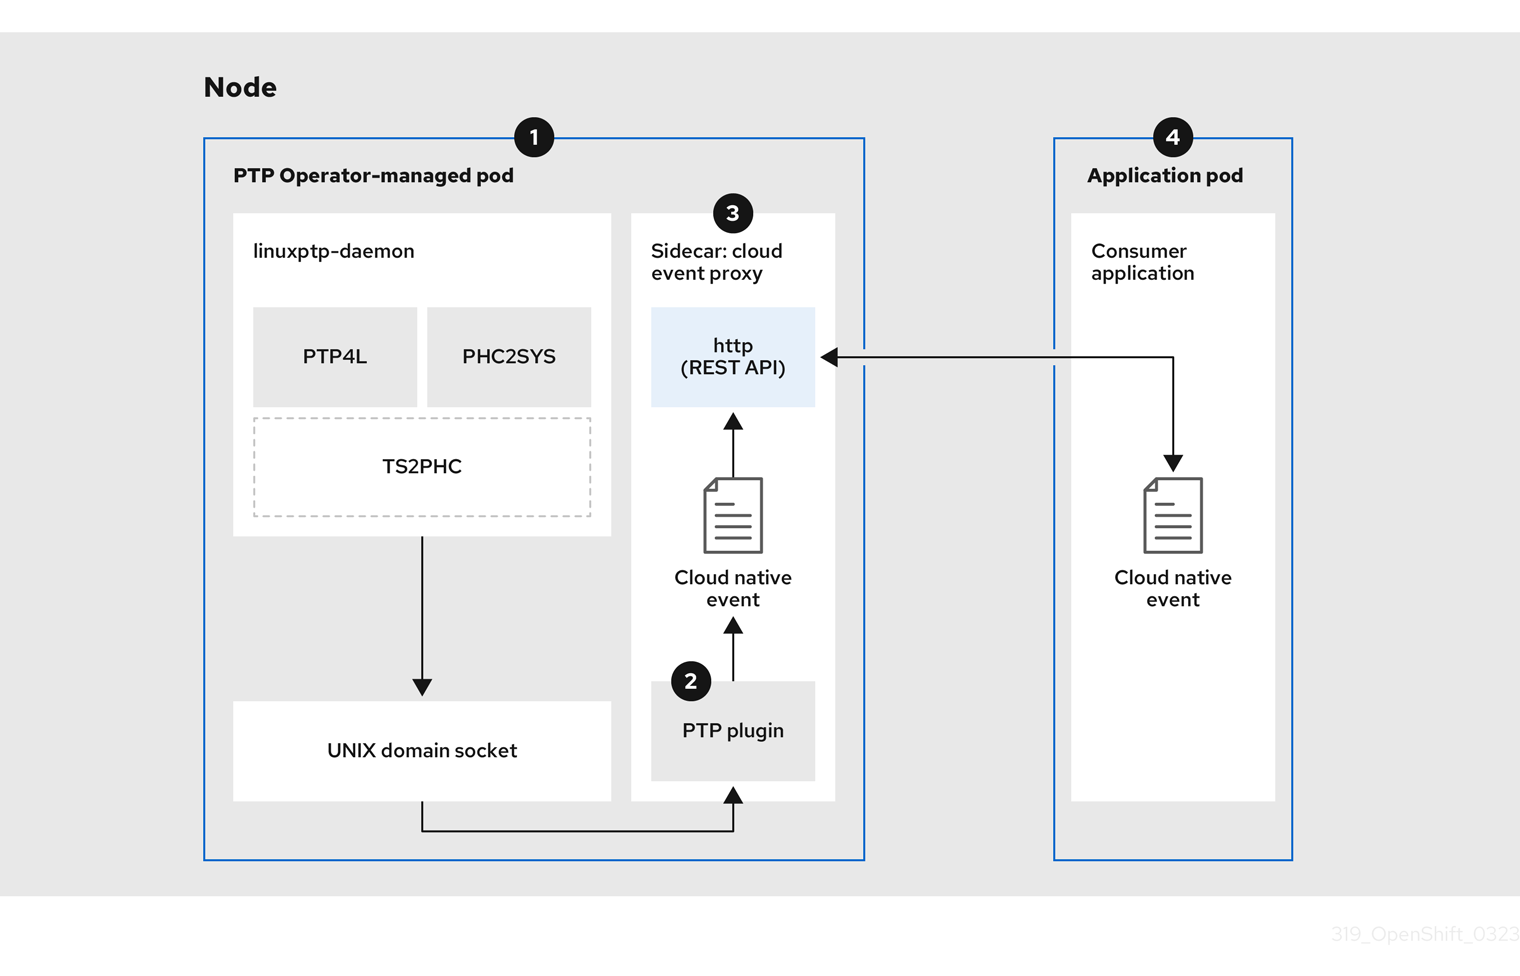
-
 Event is generated on the cluster host
 -
The
linuxptp-daemonprocess in the PTP Operator-managed pod runs as a KubernetesDaemonSetand manages the variouslinuxptpprocesses (ptp4l,phc2sys, and optionally for grandmaster clocks,ts2phc). Thelinuxptp-daemonpasses the event to the UNIX domain socket. -
 Event is passed to the cloud-event-proxy sidecar
 -
The PTP plugin reads the event from the UNIX domain socket and passes it to the
cloud-event-proxysidecar in the PTP Operator-managed pod.cloud-event-proxydelivers the event from the Kubernetes infrastructure to Cloud-Native Network Functions (CNFs) with low latency. -
 Event is published
 -
The
cloud-event-proxysidecar in the PTP Operator-managed pod processes the event and publishes the event by using the PTP events REST API v2. -
 Consumer application requests a subscription and receives the subscribed event
 -
The consumer application sends an API request to the producer
cloud-event-proxysidecar to create a PTP events subscription. Once subscribed, the consumer application listens to the address specified in the resource qualifier and receives and processes the PTP events.
8.3.3. Configuring the PTP fast event notifications publisher
To start using PTP fast event notifications for a network interface in your cluster, you must enable the fast event publisher in the PTP Operator PtpOperatorConfig custom resource (CR) and configure ptpClockThreshold values in a PtpConfig CR that you create.
Prerequisites
-
You have installed the OpenShift Container Platform CLI (
oc). -
You have logged in as a user with
cluster-adminprivileges. - You have installed the PTP Operator.
Procedure
Modify the default PTP Operator config to enable PTP fast events.
Save the following YAML in the
ptp-operatorconfig.yamlfile:apiVersion: ptp.openshift.io/v1 kind: PtpOperatorConfig metadata: name: default namespace: openshift-ptp spec: daemonNodeSelector: node-role.kubernetes.io/worker: "" ptpEventConfig: enableEventPublisher: true1 - 1
- Enable PTP fast event notifications by setting
enableEventPublishertotrue.
Update the
PtpOperatorConfigCR:$ oc apply -f ptp-operatorconfig.yaml
Create a
PtpConfigcustom resource (CR) for the PTP enabled interface, and set the required values forptpClockThresholdandptp4lOpts. The following YAML illustrates the required values that you must set in thePtpConfigCR:spec: profile: - name: "profile1" interface: "enp5s0f0" ptp4lOpts: "-2 -s --summary_interval -4"1 phc2sysOpts: "-a -r -m -n 24 -N 8 -R 16"2 ptp4lConf: ""3 ptpClockThreshold:4 holdOverTimeout: 5 maxOffsetThreshold: 100 minOffsetThreshold: -100- 1
- Append
--summary_interval -4to use PTP fast events. - 2
- Required
phc2sysOptsvalues.-mprints messages tostdout. Thelinuxptp-daemonDaemonSetparses the logs and generates Prometheus metrics. - 3
- Specify a string that contains the configuration to replace the default
/etc/ptp4l.conffile. To use the default configuration, leave the field empty. - 4
- Optional. If the
ptpClockThresholdstanza is not present, default values are used for theptpClockThresholdfields. The stanza shows defaultptpClockThresholdvalues. TheptpClockThresholdvalues configure how long after the PTP master clock is disconnected before PTP events are triggered.holdOverTimeoutis the time value in seconds before the PTP clock event state changes toFREERUNwhen the PTP master clock is disconnected. ThemaxOffsetThresholdandminOffsetThresholdsettings configure offset values in nanoseconds that compare against the values forCLOCK_REALTIME(phc2sys) or master offset (ptp4l). When theptp4lorphc2sysoffset value is outside this range, the PTP clock state is set toFREERUN. When the offset value is within this range, the PTP clock state is set toLOCKED.
8.3.4. PTP events REST API v2 consumer application reference
PTP event consumer applications require the following features:
-
A web service running with a
POSThandler to receive the cloud native PTP events JSON payload -
A
createSubscriptionfunction to subscribe to the PTP events producer -
A
getCurrentStatefunction to poll the current state of the PTP events producer
The following example Go snippets illustrate these requirements:
Example PTP events consumer server function in Go
func server() {
  http.HandleFunc("/event", getEvent)
  http.ListenAndServe(":9043", nil)
}

func getEvent(w http.ResponseWriter, req *http.Request) {
  defer req.Body.Close()
  bodyBytes, err := io.ReadAll(req.Body)
  if err != nil {
    log.Errorf("error reading event %v", err)
  }
  e := string(bodyBytes)
  if e != "" {
    processEvent(bodyBytes)
    log.Infof("received event %s", string(bodyBytes))
  }
  w.WriteHeader(http.StatusNoContent)
}
Example PTP events createSubscription function in Go
import (
"github.com/redhat-cne/sdk-go/pkg/pubsub"
"github.com/redhat-cne/sdk-go/pkg/types"
v1pubsub "github.com/redhat-cne/sdk-go/v1/pubsub"
)

// Subscribe to PTP events using v2 REST API
s1,_:=createsubscription("/cluster/node/<node_name>/sync/sync-status/sync-state")
s2,_:=createsubscription("/cluster/node/<node_name>/sync/ptp-status/lock-state")
s3,_:=createsubscription("/cluster/node/<node_name>/sync/gnss-status/gnss-sync-status")
s4,_:=createsubscription("/cluster/node/<node_name>/sync/sync-status/os-clock-sync-state")
s5,_:=createsubscription("/cluster/node/<node_name>/sync/ptp-status/clock-class")

// Create PTP event subscriptions POST
func createSubscription(resourceAddress string) (sub pubsub.PubSub, err error) {
  var status int
  apiPath := "/api/ocloudNotifications/v2/"
  localAPIAddr := "consumer-events-subscription-service.cloud-events.svc.cluster.local:9043" // vDU service API address
  apiAddr := "ptp-event-publisher-service-<node_name>.openshift-ptp.svc.cluster.local:9043"
  apiVersion := "2.0"

  subURL := &types.URI{URL: url.URL{Scheme: "http",
    Host: apiAddr
    Path: fmt.Sprintf("%s%s", apiPath, "subscriptions")}}
  endpointURL := &types.URI{URL: url.URL{Scheme: "http",
    Host: localAPIAddr,
    Path: "event"}}

  sub = v1pubsub.NewPubSub(endpointURL, resourceAddress, apiVersion)
  var subB []byte

  if subB, err = json.Marshal(&sub); err == nil {
    rc := restclient.New()
    if status, subB = rc.PostWithReturn(subURL, subB); status != http.StatusCreated {
      err = fmt.Errorf("error in subscription creation api at %s, returned status %d", subURL, status)
    } else {
      err = json.Unmarshal(subB, &sub)
    }
  } else {
    err = fmt.Errorf("failed to marshal subscription for %s", resourceAddress)
  }
  return
}- 1
- Replace
<node_name>with the FQDN of the node that is generating the PTP events. For example,compute-1.example.com.
Example PTP events consumer getCurrentState function in Go
//Get PTP event state for the resource
func getCurrentState(resource string) {
  //Create publisher
  url := &types.URI{URL: url.URL{Scheme: "http",
    Host: "ptp-event-publisher-service-<node_name>.openshift-ptp.svc.cluster.local:9043",
    Path: fmt.SPrintf("/api/ocloudNotifications/v2/%s/CurrentState",resource}}
  rc := restclient.New()
  status, event := rc.Get(url)
  if status != http.StatusOK {
    log.Errorf("CurrentState:error %d from url %s, %s", status, url.String(), event)
  } else {
    log.Debugf("Got CurrentState: %s ", event)
  }
}- 1
- Replace
<node_name>with the FQDN of the node that is generating the PTP events. For example,compute-1.example.com.
8.3.5. Reference event consumer deployment and service CRs using PTP events REST API v2
Use the following example PTP event consumer custom resources (CRs) as a reference when deploying your PTP events consumer application for use with the PTP events REST API v2.
Reference cloud event consumer namespace
apiVersion: v1
kind: Namespace
metadata:
  name: cloud-events
  labels:
    security.openshift.io/scc.podSecurityLabelSync: "false"
    pod-security.kubernetes.io/audit: "privileged"
    pod-security.kubernetes.io/enforce: "privileged"
    pod-security.kubernetes.io/warn: "privileged"
    name: cloud-events
    openshift.io/cluster-monitoring: "true"
  annotations:
    workload.openshift.io/allowed: management
Reference cloud event consumer deployment
apiVersion: apps/v1
kind: Deployment
metadata:
  name: cloud-consumer-deployment
  namespace: cloud-events
  labels:
    app: consumer
spec:
  replicas: 1
  selector:
    matchLabels:
      app: consumer
  template:
    metadata:
      annotations:
        target.workload.openshift.io/management: '{"effect": "PreferredDuringScheduling"}'
      labels:
        app: consumer
    spec:
      nodeSelector:
        node-role.kubernetes.io/worker: ""
      serviceAccountName: consumer-sa
      containers:
        - name: cloud-event-consumer
          image: cloud-event-consumer
          imagePullPolicy: Always
          args:
            - "--local-api-addr=consumer-events-subscription-service.cloud-events.svc.cluster.local:9043"
            - "--api-path=/api/ocloudNotifications/v2/"
            - "--http-event-publishers=ptp-event-publisher-service-NODE_NAME.openshift-ptp.svc.cluster.local:9043"
          env:
            - name: NODE_NAME
              valueFrom:
                fieldRef:
                  fieldPath: spec.nodeName
            - name: CONSUMER_TYPE
              value: "PTP"
            - name: ENABLE_STATUS_CHECK
              value: "true"
      volumes:
        - name: pubsubstore
          emptyDir: {}
Reference cloud event consumer service account
apiVersion: v1
kind: ServiceAccount
metadata:
  name: consumer-sa
  namespace: cloud-events
Reference cloud event consumer service
apiVersion: v1
kind: Service
metadata:
  annotations:
    prometheus.io/scrape: "true"
  name: consumer-events-subscription-service
  namespace: cloud-events
  labels:
    app: consumer-service
spec:
  ports:
    - name: sub-port
      port: 9043
  selector:
    app: consumer
  sessionAffinity: None
  type: ClusterIP
8.3.6. Subscribing to PTP events with the REST API v2
Deploy your cloud-event-consumer application container and subscribe the cloud-event-consumer application to PTP events posted by the cloud-event-proxy container in the pod managed by the PTP Operator.
Subscribe consumer applications to PTP events by sending a POST request to http://ptp-event-publisher-service-NODE_NAME.openshift-ptp.svc.cluster.local:9043/api/ocloudNotifications/v2/subscriptions passing the appropriate subscription request payload.
9043 is the default port for the cloud-event-proxy container deployed in the PTP event producer pod. You can configure a different port for your application as required.
8.3.7. Verifying that the PTP events REST API v2 consumer application is receiving events
Verify that the cloud-event-consumer container in the application pod is receiving Precision Time Protocol (PTP) events.
Prerequisites
-
You have installed the OpenShift CLI (
oc). -
You have logged in as a user with
cluster-adminprivileges. - You have installed and configured the PTP Operator.
- You have deployed a cloud events application pod and PTP events consumer application.
Procedure
Check the logs for the deployed events consumer application. For example, run the following command:
$ oc -n cloud-events logs -f deployment/cloud-consumer-deploymentExample output
time = "2024-09-02T13:49:01Z"
level = info msg = "transport host path is set to  ptp-event-publisher-service-compute-1.openshift-ptp.svc.cluster.local:9043"
time = "2024-09-02T13:49:01Z"
level = info msg = "apiVersion=2.0, updated apiAddr=ptp-event-publisher-service-compute-1.openshift-ptp.svc.cluster.local:9043, apiPath=/api/ocloudNotifications/v2/"
time = "2024-09-02T13:49:01Z"
level = info msg = "Starting local API listening to :9043"
time = "2024-09-02T13:49:06Z"
level = info msg = "transport host path is set to  ptp-event-publisher-service-compute-1.openshift-ptp.svc.cluster.local:9043"
time = "2024-09-02T13:49:06Z"
level = info msg = "checking for rest service health"
time = "2024-09-02T13:49:06Z"
level = info msg = "health check http://ptp-event-publisher-service-compute-1.openshift-ptp.svc.cluster.local:9043/api/ocloudNotifications/v2/health"
time = "2024-09-02T13:49:07Z"
level = info msg = "rest service returned healthy status"
time = "2024-09-02T13:49:07Z"
level = info msg = "healthy publisher; subscribing to events"
time = "2024-09-02T13:49:07Z"
level = info msg = "received event {\"specversion\":\"1.0\",\"id\":\"ab423275-f65d-4760-97af-5b0b846605e4\",\"source\":\"/sync/ptp-status/clock-class\",\"type\":\"event.sync.ptp-status.ptp-clock-class-change\",\"time\":\"2024-09-02T13:49:07.226494483Z\",\"data\":{\"version\":\"1.0\",\"values\":[{\"ResourceAddress\":\"/cluster/node/compute-1.example.com/ptp-not-set\",\"data_type\":\"metric\",\"value_type\":\"decimal64.3\",\"value\":\"0\"}]}}"
Optional. Test the REST API by using
ocand port-forwarding port9043from thelinuxptp-daemondeployment. For example, run the following command:$ oc port-forward -n openshift-ptp ds/linuxptp-daemon 9043:9043Example output
Forwarding from 127.0.0.1:9043 -> 9043
Forwarding from [::1]:9043 -> 9043
Handling connection for 9043
Open a new shell prompt and test the REST API v2 endpoints:
$ curl -X GET http://localhost:9043/api/ocloudNotifications/v2/healthExample output
OK
8.3.8. Monitoring PTP fast event metrics
You can monitor PTP fast events metrics from cluster nodes where the linuxptp-daemon is running. You can also monitor PTP fast event metrics in the OpenShift Container Platform web console by using the preconfigured and self-updating Prometheus monitoring stack.
Prerequisites
-
Install the OpenShift Container Platform CLI
oc. -
Log in as a user with
cluster-adminprivileges. - Install and configure the PTP Operator on a node with PTP-capable hardware.
Procedure
Start a debug pod for the node by running the following command:
$ oc debug node/<node_name>Check for PTP metrics exposed by the
linuxptp-daemoncontainer. For example, run the following command:sh-4.4# curl http://localhost:9091/metricsExample output
# HELP cne_api_events_published Metric to get number of events published by the rest api
# TYPE cne_api_events_published gauge
cne_api_events_published{address="/cluster/node/compute-1.example.com/sync/gnss-status/gnss-sync-status",status="success"} 1
cne_api_events_published{address="/cluster/node/compute-1.example.com/sync/ptp-status/lock-state",status="success"} 94
cne_api_events_published{address="/cluster/node/compute-1.example.com/sync/ptp-status/class-change",status="success"} 18
cne_api_events_published{address="/cluster/node/compute-1.example.com/sync/sync-status/os-clock-sync-state",status="success"} 27
Optional. You can also find PTP events in the logs for the
cloud-event-proxycontainer. For example, run the following command:$ oc logs -f linuxptp-daemon-cvgr6 -n openshift-ptp -c cloud-event-proxy-
To view the PTP event in the OpenShift Container Platform web console, copy the name of the PTP metric you want to query, for example,
openshift_ptp_offset_ns. - In the OpenShift Container Platform web console, click Observe → Metrics.
- Paste the PTP metric name into the Expression field, and click Run queries.
8.3.9. PTP fast event metrics reference
The following table describes the PTP fast events metrics that are available from cluster nodes where the linuxptp-daemon service is running.
| Metric | Description | Example |
|---|---|---|
|
|
Returns the PTP clock class for the interface. Possible values for PTP clock class are 6 ( |
|
|
|
Returns the current PTP clock state for the interface. Possible values for PTP clock state are |
|
|
| Returns the delay in nanoseconds between the primary clock sending the timing packet and the secondary clock receiving the timing packet. |
|
|
|
Returns the current status of the highly available system clock when there are multiple time sources on different NICs. Possible values are 0 ( |
|
|
|
Returns the frequency adjustment in nanoseconds between 2 PTP clocks. For example, between the upstream clock and the NIC, between the system clock and the NIC, or between the PTP hardware clock ( |
|
|
|
Returns the configured PTP clock role for the interface. Possible values are 0 ( |
|
|
|
Returns the maximum offset in nanoseconds between 2 clocks or interfaces. For example, between the upstream GNSS clock and the NIC ( |
|
|
| Returns the offset in nanoseconds between the DPLL clock or the GNSS clock source and the NIC hardware clock. |
|
|
|
Returns a count of the number of times the |
|
|
| Returns a status code that shows whether the PTP processes are running or not. |
|
|
|
Returns values for
|
|
8.3.9.1. PTP fast event metrics only when T-GM is enabled
The following table describes the PTP fast event metrics that are available only when PTP grandmaster clock (T-GM) is enabled.
| Metric | Description | Example |
|---|---|---|
|
|
Returns the current status of the digital phase-locked loop (DPLL) frequency for the NIC. Possible values are -1 ( |
|
|
|
Returns the current status of the NMEA connection. NMEA is the protocol that is used for 1PPS NIC connections. Possible values are 0 ( |
|
|
|
Returns the status of the DPLL phase for the NIC. Possible values are -1 ( |
|
|
|
Returns the current status of the NIC 1PPS connection. You use the 1PPS connection to synchronize timing between connected NICs. Possible values are 0 ( |
|
|
|
Returns the current status of the global navigation satellite system (GNSS) connection. GNSS provides satellite-based positioning, navigation, and timing services globally. Possible values are 0 ( |
|
8.4. PTP events REST API v2 reference
Use the following REST API v2 endpoints to subscribe the cloud-event-consumer application to Precision Time Protocol (PTP) events posted at http://ptp-event-publisher-service-NODE_NAME.openshift-ptp.svc.cluster.local:9043/api/ocloudNotifications/v2 in the PTP events producer pod.
api/ocloudNotifications/v2/subscriptions-
POST: Creates a new subscription -
GET: Retrieves a list of subscriptions -
DELETE: Deletes all subscriptions
-
api/ocloudNotifications/v2/subscriptions/{subscription_id}-
GET: Returns details for the specified subscription ID -
DELETE: Deletes the subscription associated with the specified subscription ID
-
api/ocloudNotifications/v2/health-
GET: Returns the health status ofocloudNotificationsAPI
-
api/ocloudNotifications/v2/publishers-
GET: Returns a list of PTP event publishers for the cluster node
-
api/ocloudnotifications/v2/{resource_address}/CurrentState-
GET: Returns the current state of the event type specified by the{resouce_address}.
-
8.4.1. PTP events REST API v2 endpoints
8.4.1.1. api/ocloudNotifications/v2/subscriptions
HTTP method
GET api/ocloudNotifications/v2/subscriptions
Description
Returns a list of subscriptions. If subscriptions exist, a 200 OK status code is returned along with the list of subscriptions.
Example API response
[
 {
  "ResourceAddress": "/cluster/node/compute-1.example.com/sync/sync-status/os-clock-sync-state",
  "EndpointUri": "http://consumer-events-subscription-service.cloud-events.svc.cluster.local:9043/event",
  "SubscriptionId": "ccedbf08-3f96-4839-a0b6-2eb0401855ed",
  "UriLocation": "http://ptp-event-publisher-service-compute-1.openshift-ptp.svc.cluster.local:9043/api/ocloudNotifications/v2/subscriptions/ccedbf08-3f96-4839-a0b6-2eb0401855ed"
 },
 {
  "ResourceAddress": "/cluster/node/compute-1.example.com/sync/ptp-status/clock-class",
  "EndpointUri": "http://consumer-events-subscription-service.cloud-events.svc.cluster.local:9043/event",
  "SubscriptionId": "a939a656-1b7d-4071-8cf1-f99af6e931f2",
  "UriLocation": "http://ptp-event-publisher-service-compute-1.openshift-ptp.svc.cluster.local:9043/api/ocloudNotifications/v2/subscriptions/a939a656-1b7d-4071-8cf1-f99af6e931f2"
 },
 {
  "ResourceAddress": "/cluster/node/compute-1.example.com/sync/ptp-status/lock-state",
  "EndpointUri": "http://consumer-events-subscription-service.cloud-events.svc.cluster.local:9043/event",
  "SubscriptionId": "ba4564a3-4d9e-46c5-b118-591d3105473c",
  "UriLocation": "http://ptp-event-publisher-service-compute-1.openshift-ptp.svc.cluster.local:9043/api/ocloudNotifications/v2/subscriptions/ba4564a3-4d9e-46c5-b118-591d3105473c"
 },
 {
  "ResourceAddress": "/cluster/node/compute-1.example.com/sync/gnss-status/gnss-sync-status",
  "EndpointUri": "http://consumer-events-subscription-service.cloud-events.svc.cluster.local:9043/event",
  "SubscriptionId": "ea0d772e-f00a-4889-98be-51635559b4fb",
  "UriLocation": "http://ptp-event-publisher-service-compute-1.openshift-ptp.svc.cluster.local:9043/api/ocloudNotifications/v2/subscriptions/ea0d772e-f00a-4889-98be-51635559b4fb"
 },
 {
  "ResourceAddress": "/cluster/node/compute-1.example.com/sync/sync-status/sync-state",
  "EndpointUri": "http://consumer-events-subscription-service.cloud-events.svc.cluster.local:9043/event",
  "SubscriptionId": "762999bf-b4a0-4bad-abe8-66e646b65754",
  "UriLocation": "http://ptp-event-publisher-service-compute-1.openshift-ptp.svc.cluster.local:9043/api/ocloudNotifications/v2/subscriptions/762999bf-b4a0-4bad-abe8-66e646b65754"
 }
]
HTTP method
POST api/ocloudNotifications/v2/subscriptions
Description
Creates a new subscription for the required event by passing the appropriate payload.
You can subscribe to the following PTP events:
-
sync-stateevents -
lock-stateevents -
gnss-sync-status eventsevents -
os-clock-sync-stateevents -
clock-classevents
| Parameter | Type |
|---|---|
| subscription | data |
Example sync-state subscription payload
{
"EndpointUri": "http://consumer-events-subscription-service.cloud-events.svc.cluster.local:9043/event",
"ResourceAddress": "/cluster/node/{node_name}/sync/sync-status/sync-state"
}
Example PTP lock-state events subscription payload
{
"EndpointUri": "http://consumer-events-subscription-service.cloud-events.svc.cluster.local:9043/event",
"ResourceAddress": "/cluster/node/{node_name}/sync/ptp-status/lock-state"
}
Example PTP gnss-sync-status events subscription payload
{
"EndpointUri": "http://consumer-events-subscription-service.cloud-events.svc.cluster.local:9043/event",
"ResourceAddress": "/cluster/node/{node_name}/sync/gnss-status/gnss-sync-status"
}
Example PTP os-clock-sync-state events subscription payload
{
"EndpointUri": "http://consumer-events-subscription-service.cloud-events.svc.cluster.local:9043/event",
"ResourceAddress": "/cluster/node/{node_name}/sync/sync-status/os-clock-sync-state"
}
Example PTP clock-class events subscription payload
{
"EndpointUri": "http://consumer-events-subscription-service.cloud-events.svc.cluster.local:9043/event",
"ResourceAddress": "/cluster/node/{node_name}/sync/ptp-status/clock-class"
}
Example API response
{
    "ResourceAddress": "/cluster/node/compute-1.example.com/sync/ptp-status/lock-state",
    "EndpointUri": "http://consumer-events-subscription-service.cloud-events.svc.cluster.local:9043/event",
    "SubscriptionId": "620283f3-26cd-4a6d-b80a-bdc4b614a96a",
    "UriLocation": "http://ptp-event-publisher-service-compute-1.openshift-ptp.svc.cluster.local:9043/api/ocloudNotifications/v2/subscriptions/620283f3-26cd-4a6d-b80a-bdc4b614a96a"
}
The following subscription status events are possible:
| Status code | Description |
|---|---|
|
| Indicates that the subscription is created |
|
| Indicates that the server could not process the request because it was malformed or invalid |
|
| Indicates that the subscription resource is not available |
|
| Indicates that the subscription already exists |
HTTP method
DELETE api/ocloudNotifications/v2/subscriptions
Description
Deletes all subscriptions.
Example API response
{
"status": "deleted all subscriptions"
}
8.4.1.2. api/ocloudNotifications/v2/subscriptions/{subscription_id}
HTTP method
GET api/ocloudNotifications/v2/subscriptions/{subscription_id}
Description
Returns details for the subscription with ID subscription_id.
| Parameter | Type |
|---|---|
|
| string |
Example API response
{
    "ResourceAddress": "/cluster/node/compute-1.example.com/sync/ptp-status/lock-state",
    "EndpointUri": "http://consumer-events-subscription-service.cloud-events.svc.cluster.local:9043/event",
    "SubscriptionId": "620283f3-26cd-4a6d-b80a-bdc4b614a96a",
    "UriLocation": "http://ptp-event-publisher-service-compute-1.openshift-ptp.svc.cluster.local:9043/api/ocloudNotifications/v2/subscriptions/620283f3-26cd-4a6d-b80a-bdc4b614a96a"
}
HTTP method
DELETE api/ocloudNotifications/v2/subscriptions/{subscription_id}
Description
Deletes the subscription with ID subscription_id.
| Parameter | Type |
|---|---|
|
| string |
| HTTP response | Description |
|---|---|
| 204 No Content | Success |
8.4.1.3. api/ocloudNotifications/v2/health
HTTP method
GET api/ocloudNotifications/v2/health/
Description
Returns the health status for the ocloudNotifications REST API.
| HTTP response | Description |
|---|---|
| 200 OK | Success |
8.4.1.4. api/ocloudNotifications/v2/publishers
HTTP method
GET api/ocloudNotifications/v2/publishers
Description
Returns a list of publisher details for the cluster node. The system generates notifications when the relevant equipment state changes.
You can use equipment synchronization status subscriptions together to deliver a detailed view of the overall synchronization health of the system.
Example API response
[
  {
    "ResourceAddress": "/cluster/node/compute-1.example.com/sync/sync-status/sync-state",
    "EndpointUri": "http://localhost:9043/api/ocloudNotifications/v2/dummy",
    "SubscriptionId": "4ea72bfa-185c-4703-9694-cdd0434cd570",
    "UriLocation": "http://localhost:9043/api/ocloudNotifications/v2/publishers/4ea72bfa-185c-4703-9694-cdd0434cd570"
  },
  {
    "ResourceAddress": "/cluster/node/compute-1.example.com/sync/sync-status/os-clock-sync-state",
    "EndpointUri": "http://localhost:9043/api/ocloudNotifications/v2/dummy",
    "SubscriptionId": "71fbb38e-a65d-41fc-823b-d76407901087",
    "UriLocation": "http://localhost:9043/api/ocloudNotifications/v2/publishers/71fbb38e-a65d-41fc-823b-d76407901087"
  },
  {
    "ResourceAddress": "/cluster/node/compute-1.example.com/sync/ptp-status/clock-class",
    "EndpointUri": "http://localhost:9043/api/ocloudNotifications/v2/dummy",
    "SubscriptionId": "7bc27cad-03f4-44a9-8060-a029566e7926",
    "UriLocation": "http://localhost:9043/api/ocloudNotifications/v2/publishers/7bc27cad-03f4-44a9-8060-a029566e7926"
  },
  {
    "ResourceAddress": "/cluster/node/compute-1.example.com/sync/ptp-status/lock-state",
    "EndpointUri": "http://localhost:9043/api/ocloudNotifications/v2/dummy",
    "SubscriptionId": "6e7b6736-f359-46b9-991c-fbaed25eb554",
    "UriLocation": "http://localhost:9043/api/ocloudNotifications/v2/publishers/6e7b6736-f359-46b9-991c-fbaed25eb554"
  },
  {
    "ResourceAddress": "/cluster/node/compute-1.example.com/sync/gnss-status/gnss-sync-status",
    "EndpointUri": "http://localhost:9043/api/ocloudNotifications/v2/dummy",
    "SubscriptionId": "31bb0a45-7892-45d4-91dd-13035b13ed18",
    "UriLocation": "http://localhost:9043/api/ocloudNotifications/v2/publishers/31bb0a45-7892-45d4-91dd-13035b13ed18"
  }
]| HTTP response | Description |
|---|---|
| 200 OK | Success |
8.4.1.5. api/ocloudNotifications/v2/{resource_address}/CurrentState
HTTP method
GET api/ocloudNotifications/v2/cluster/node/{node_name}/sync/ptp-status/lock-state/CurrentState
GET api/ocloudNotifications/v2/cluster/node/{node_name}/sync/sync-status/os-clock-sync-state/CurrentState
GET api/ocloudNotifications/v2/cluster/node/{node_name}/sync/ptp-status/clock-class/CurrentState
GET api/ocloudNotifications/v2/cluster/node/{node_name}/sync/sync-status/sync-state/CurrentState
GET api/ocloudNotifications/v2/cluster/node/{node_name}/sync/gnss-status/gnss-sync-state/CurrentState
Description
Returns the current state of the os-clock-sync-state, clock-class, lock-state, gnss-sync-status, or sync-state events for the cluster node.
-
os-clock-sync-statenotifications describe the host operating system clock synchronization state. Can be inLOCKEDorFREERUNstate. -
clock-classnotifications describe the current state of the PTP clock class. -
lock-statenotifications describe the current status of the PTP equipment lock state. Can be inLOCKED,HOLDOVERorFREERUNstate. -
sync-statenotifications describe the current status of the least synchronized of the PTP clocklock-stateandos-clock-sync-statestates. -
gnss-sync-statusnotifications describe the GNSS clock synchronization state.
| Parameter | Type |
|---|---|
|
| string |
Example lock-state API response
{
  "id": "c1ac3aa5-1195-4786-84f8-da0ea4462921",
  "type": "event.sync.ptp-status.ptp-state-change",
  "source": "/cluster/node/compute-1.example.com/sync/ptp-status/lock-state",
  "dataContentType": "application/json",
  "time": "2023-01-10T02:41:57.094981478Z",
  "data": {
    "version": "1.0",
    "values": [
      {
        "ResourceAddress": "/cluster/node/compute-1.example.com/ens5fx/master",
        "data_type": "notification",
        "value_type": "enumeration",
        "value": "LOCKED"
      },
      {
        "ResourceAddress": "/cluster/node/compute-1.example.com/ens5fx/master",
        "data_type": "metric",
        "value_type": "decimal64.3",
        "value": "29"
      }
    ]
  }
}
Example os-clock-sync-state API response
{
  "specversion": "0.3",
  "id": "4f51fe99-feaa-4e66-9112-66c5c9b9afcb",
  "source": "/cluster/node/compute-1.example.com/sync/sync-status/os-clock-sync-state",
  "type": "event.sync.sync-status.os-clock-sync-state-change",
  "subject": "/cluster/node/compute-1.example.com/sync/sync-status/os-clock-sync-state",
  "datacontenttype": "application/json",
  "time": "2022-11-29T17:44:22.202Z",
  "data": {
    "version": "1.0",
    "values": [
      {
        "ResourceAddress": "/cluster/node/compute-1.example.com/CLOCK_REALTIME",
        "data_type": "notification",
        "value_type": "enumeration",
        "value": "LOCKED"
      },
      {
        "ResourceAddress": "/cluster/node/compute-1.example.com/CLOCK_REALTIME",
        "data_type": "metric",
        "value_type": "decimal64.3",
        "value": "27"
      }
    ]
  }
}
Example clock-class API response
{
  "id": "064c9e67-5ad4-4afb-98ff-189c6aa9c205",
  "type": "event.sync.ptp-status.ptp-clock-class-change",
  "source": "/cluster/node/compute-1.example.com/sync/ptp-status/clock-class",
  "dataContentType": "application/json",
  "time": "2023-01-10T02:41:56.785673989Z",
  "data": {
    "version": "1.0",
    "values": [
      {
        "ResourceAddress": "/cluster/node/compute-1.example.com/ens5fx/master",
        "data_type": "metric",
        "value_type": "decimal64.3",
        "value": "165"
      }
    ]
  }
}
Example sync-state API response
{
    "specversion": "0.3",
    "id": "8c9d6ecb-ae9f-4106-82c4-0a778a79838d",
    "source": "/sync/sync-status/sync-state",
    "type": "event.sync.sync-status.synchronization-state-change",
    "subject": "/cluster/node/compute-1.example.com/sync/sync-status/sync-state",
    "datacontenttype": "application/json",
    "time": "2024-08-28T14:50:57.327585316Z",
    "data":
    {
        "version": "1.0",
        "values": [
        {
            "ResourceAddress": "/cluster/node/compute-1.example.com/sync/sync-status/sync-state",
            "data_type": "notification",
            "value_type": "enumeration",
            "value": "LOCKED"
        }]
    }
}
Example gnss-sync-state API response
{
  "id": "435e1f2a-6854-4555-8520-767325c087d7",
  "type": "event.sync.gnss-status.gnss-state-change",
  "source": "/cluster/node/compute-1.example.com/sync/gnss-status/gnss-sync-status",
  "dataContentType": "application/json",
  "time": "2023-09-27T19:35:33.42347206Z",
  "data": {
    "version": "1.0",
    "values": [
      {
        "ResourceAddress": "/cluster/node/compute-1.example.com/ens2fx/master",
        "data_type": "notification",
        "value_type": "enumeration",
        "value": "SYNCHRONIZED"
      },
      {
        "ResourceAddress": "/cluster/node/compute-1.example.com/ens2fx/master",
        "data_type": "metric",
        "value_type": "decimal64.3",
        "value": "5"
      }
    ]
  }
}
Legal Notice
Copyright © Red Hat
OpenShift documentation is licensed under the Apache License 2.0 (https://www.apache.org/licenses/LICENSE-2.0).
Modified versions must remove all Red Hat trademarks.
Portions adapted from https://github.com/kubernetes-incubator/service-catalog/ with modifications by Red Hat.
Red Hat, Red Hat Enterprise Linux, the Red Hat logo, the Shadowman logo, JBoss, OpenShift, Fedora, the Infinity logo, and RHCE are trademarks of Red Hat, Inc., registered in the United States and other countries.
Linux® is the registered trademark of Linus Torvalds in the United States and other countries.
Java® is a registered trademark of Oracle and/or its affiliates.
XFS® is a trademark of Silicon Graphics International Corp. or its subsidiaries in the United States and/or other countries.
MySQL® is a registered trademark of MySQL AB in the United States, the European Union and other countries.
Node.js® is an official trademark of the OpenJS Foundation.
The OpenStack® Word Mark and OpenStack logo are either registered trademarks/service marks or trademarks/service marks of the OpenStack Foundation, in the United States and other countries and are used with the OpenStack Foundation’s permission. We are not affiliated with, endorsed or sponsored by the OpenStack Foundation, or the OpenStack community.
All other trademarks are the property of their respective owners.