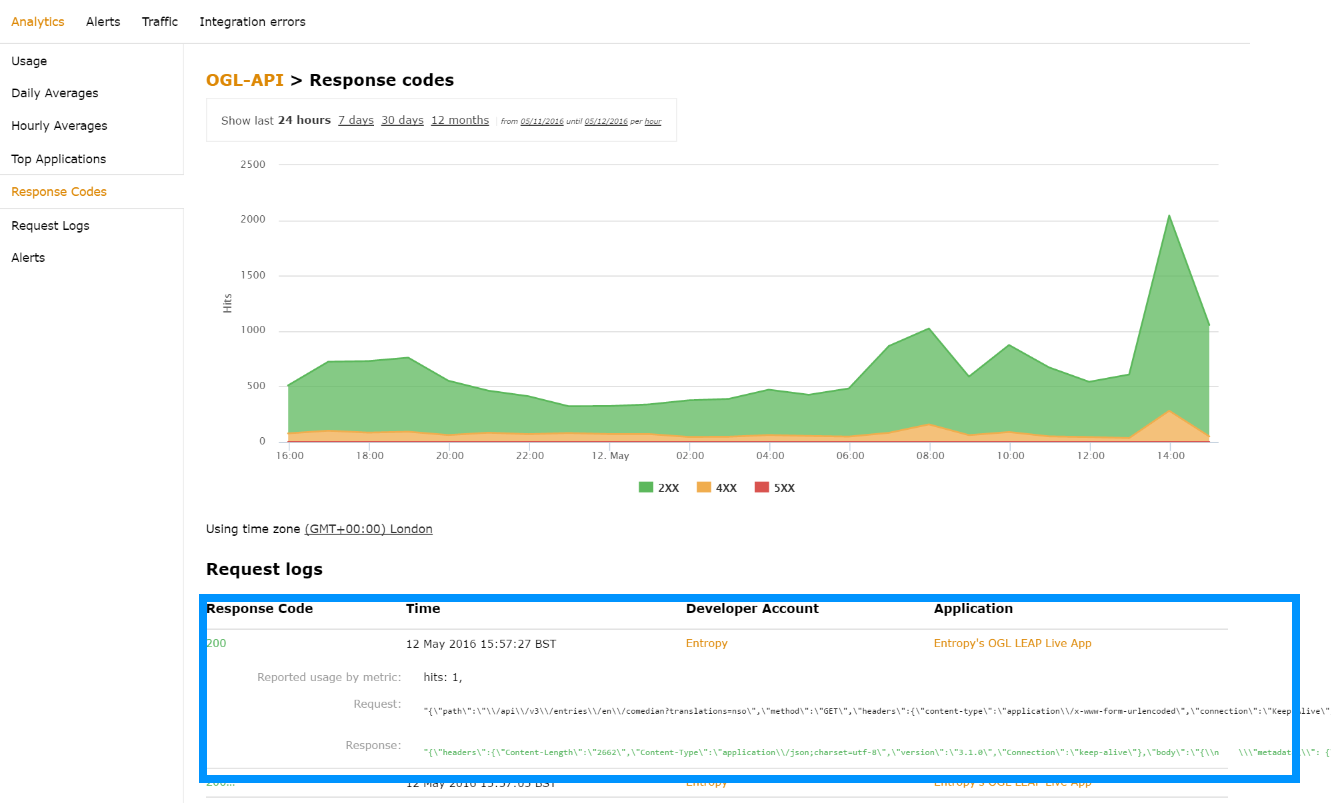
Chapter 3. Response Code Tracking
This tutorial shows how to set up and use the response codes log in the 3scale system. Walk through the configuration steps and see how to use this feature in the long run.
Tracking response codes from your API is a great way to see how your clients are using it and to see in real time whether everything is fine with your servers.
3.1. Setup
Setting up response code logging is really simple. To enable this feature, just set the APICAST_RESPONSE_CODESenvironment variable to 1 or True.
<!-- Integration screen download screen -->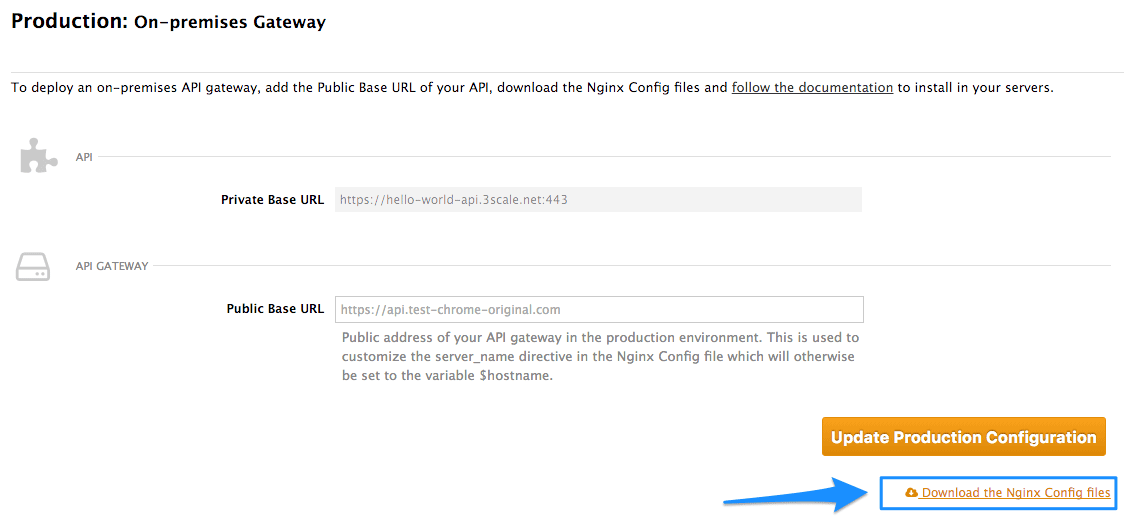
If you’ve integrated your API with 3scale using the plugin or API, you will have to add some additional code. You won’t be able to use the authrep call here ecause the response code is known after receiving a response from the API itself. Instead, you will have to split the authrep into two separate calls – authentication, to authenticate the request to the API; and report, to report the usage and log the response code into the 3scale system.
Since the code itself depends on the language, this example will show how the codes are logged in using the 3scale Service Management REST API. For the plugins, please refer to their respective GitHub repositories and adjust reporting accordingly to the RESTful example below.
In order implement the correct flow with response code reporting, you will have to split the authentication and reporting process into two steps. In the first step, you will authorize the call against some usage such as
curl -v -X GET "https://su1.3scale.net/transactions/authorize.xml?provider_key=PROVIDER_KEY&user_key=USER_KEY&usage%5Bhits%5D=1"-
The second step after receiving a successful authentication respose from 3scale will be processing the call in your API and then reporting the usage together with the response code value. For this example, assume it will be a successfull
200response. The call to your API will then look like this:
curl -v -X POST "https://su1.3scale.net/transactions.xml" -d 'provider_key=PROVIDER_KEY&transactions%5B0%5D%5Buser_key%5D=USER_KEY&transactions%5B0%5D%5Busage%5D%5Bhits%5D=1&transactions%5B0%5D%5Blog%5D%5Bcode%5D=200'
The part of the code responsible for registering the response codes is the last transaction part: transactions%5B0%5D%5Blog%5D%5Bcode%5D=200 reporting. In this case, a 200 response code. The code above is just a URL-encoded version of transactions[0][log][code]=200
In other words, you have to report an additional transaction element, a code value part of a request log. The transactions[0] means that this code value is a part of the first transaction in a batch (in this case we are reporting only one transaction). The latter part of the hash is referring to response code value of the request log.
3.2. Verify the integration
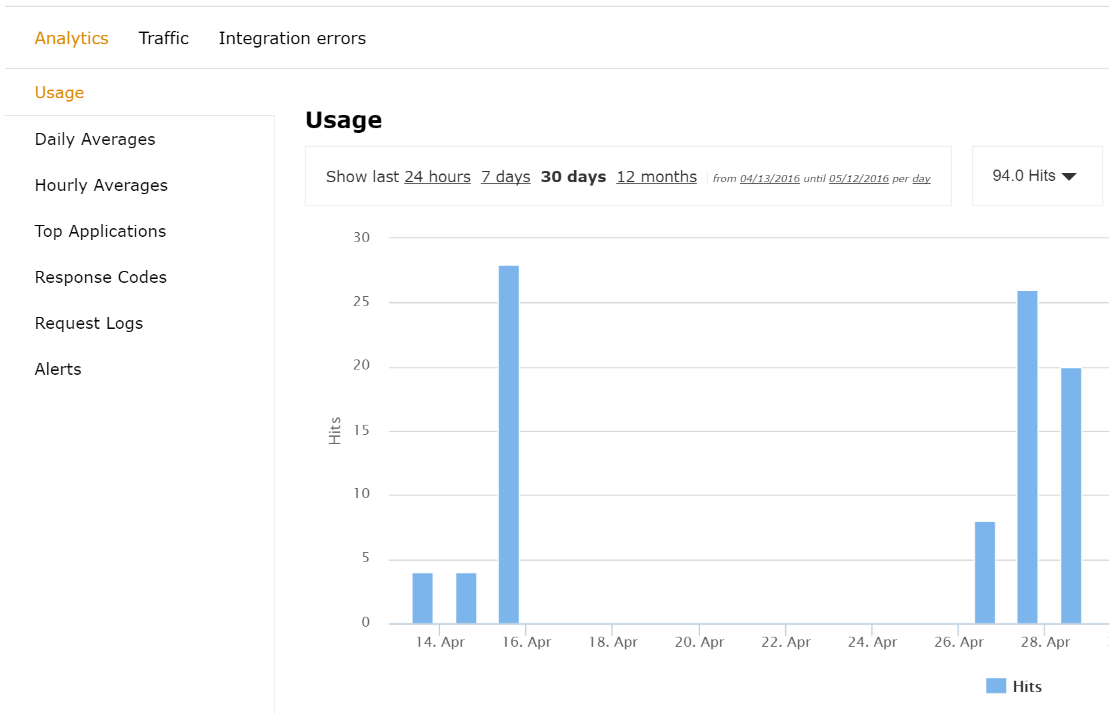
You have set up reporting response codes from your API to 3scale. How do you verify that it went well and monitor the responses? First you will have to call your API (through a 3scale traffic agent like NGINX proxy or plugin) with valid 3scale credentials. Then verify that the call was correctly reported on the Analytics > Usage page.
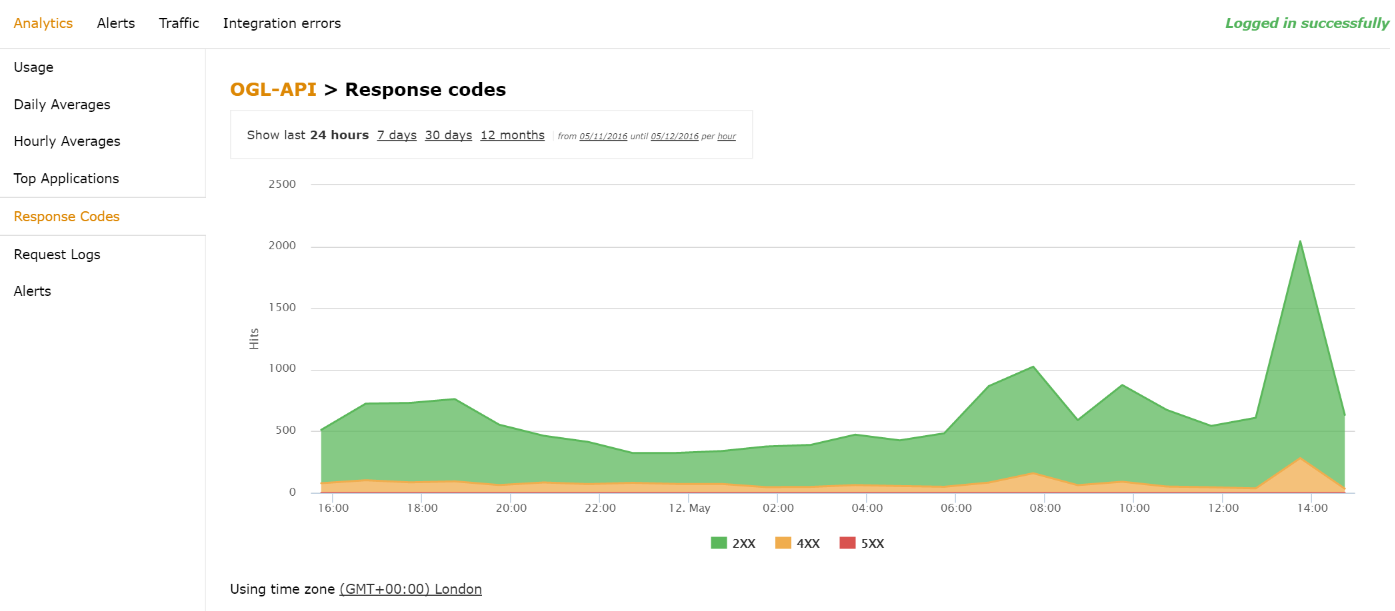
If everything is going well so far, go to the Analytics >Response codes page. You should be able to see a graph with your latest traffic divided by colors, depending if the response was 2xx, 4xx, or 5xx.
3.3. Monitoring response codes
The graph tool gives you the ability to view the history of response codes. You can also check the response code statistics for different periods of time and different levels of granularity. Simply click on the time selection bar and define the time period and granularity that will fit your needs.
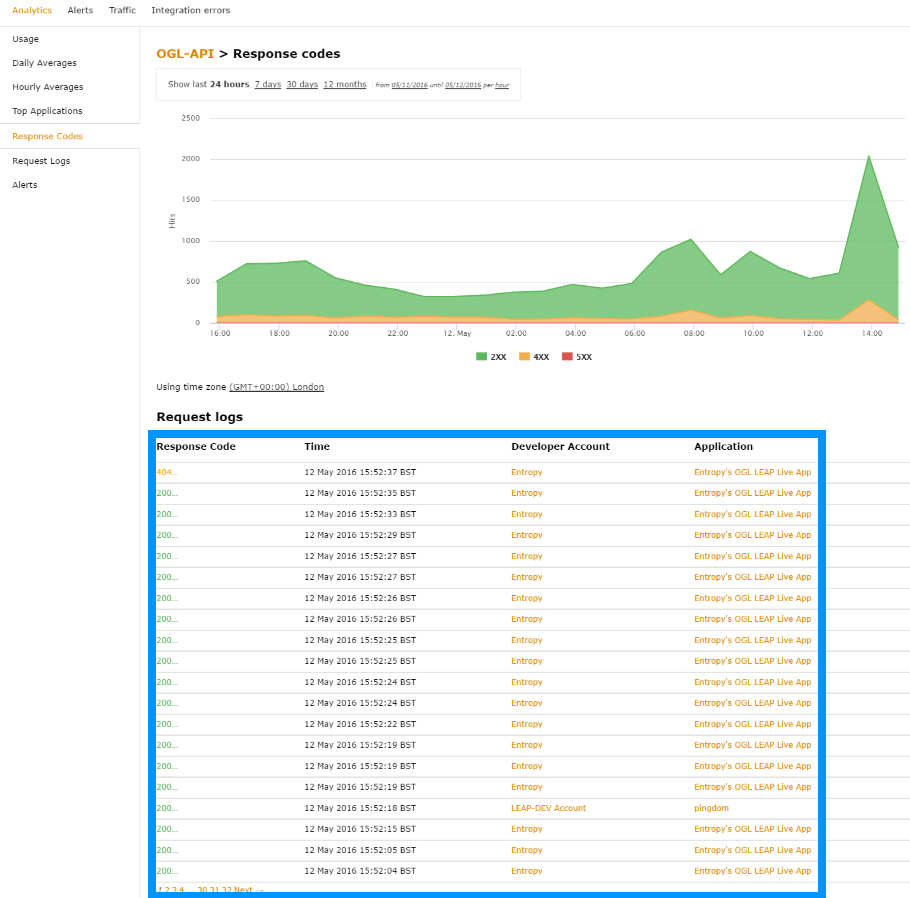
If you click on the response code itself, you will see the details of the call, which is very useful if you’re trying to debug the API or find out the exact details of a particular call.
