Chapter 7. Managing alerts on the Ceph dashboard
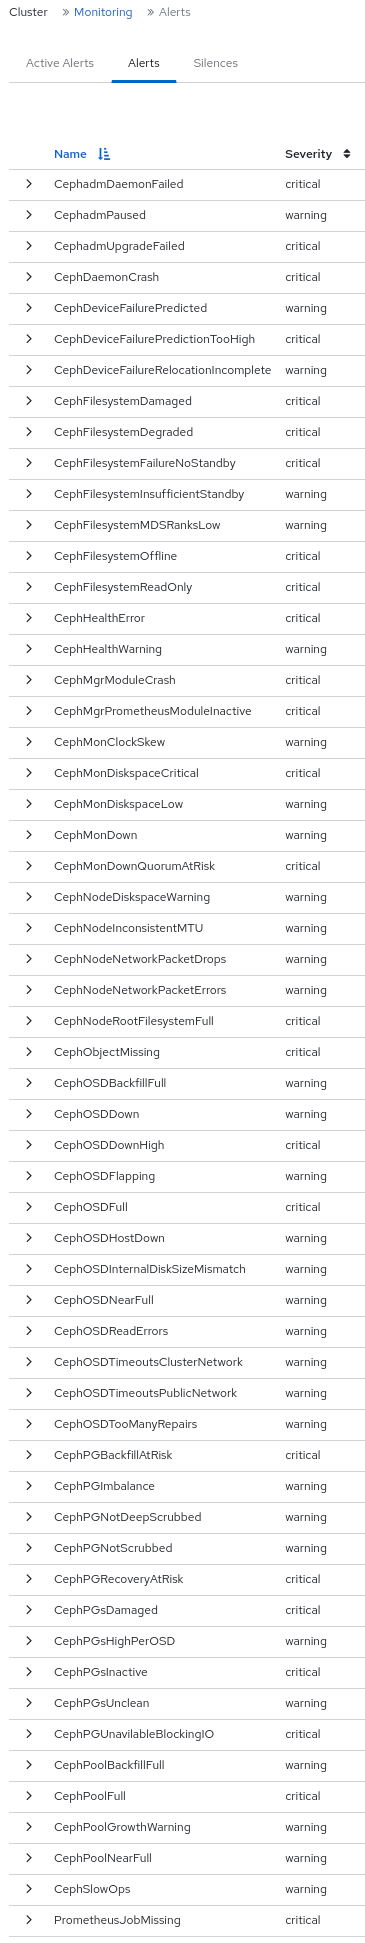
As a storage administrator, you can see the details of alerts and create silences for them on the Red Hat Ceph Storage dashboard. This includes the following pre-defined alerts:
- CephadmDaemonFailed
- CephadmPaused
- CephadmUpgradeFailed
- CephDaemonCrash
- CephDeviceFailurePredicted
- CephDeviceFailurePredictionTooHigh
- CephDeviceFailureRelocationIncomplete
- CephFilesystemDamaged
- CephFilesystemDegraded
- CephFilesystemFailureNoStandby
- CephFilesystemInsufficientStandby
- CephFilesystemMDSRanksLow
- CephFilesystemOffline
- CephFilesystemReadOnly
- CephHealthError
- CephHealthWarning
- CephMgrModuleCrash
- CephMgrPrometheusModuleInactive
- CephMonClockSkew
- CephMonDiskspaceCritical
- CephMonDiskspaceLow
- CephMonDown
- CephMonDownQuorumAtRisk
- CephNodeDiskspaceWarning
- CephNodeInconsistentMTU
- CephNodeNetworkPacketDrops
- CephNodeNetworkPacketErrors
- CephNodeRootFilesystemFull
- CephObjectMissing
- CephOSDBackfillFull
- CephOSDDown
- CephOSDDownHigh
- CephOSDFlapping
- CephOSDFull
- CephOSDHostDown
- CephOSDInternalDiskSizeMismatch
- CephOSDNearFull
- CephOSDReadErrors
- CephOSDTimeoutsClusterNetwork
- CephOSDTimeoutsPublicNetwork
- CephOSDTooManyRepairs
- CephPGBackfillAtRisk
- CephPGImbalance
- CephPGNotDeepScrubbed
- CephPGNotScrubbed
- CephPGRecoveryAtRisk
- CephPGsDamaged
- CephPGsHighPerOSD
- CephPGsInactive
- CephPGsUnclean
- CephPGUnavilableBlockingIO
- CephPoolBackfillFull
- CephPoolFull
- CephPoolGrowthWarning
- CephPoolNearFull
- CephSlowOps
- PrometheusJobMissing
Figure 7.1. Pre-defined alerts
You can also monitor alerts using simple network management protocol (SNMP) traps.
7.1. Enabling monitoring stack
You can manually enable the monitoring stack of the Red Hat Ceph Storage cluster, such as Prometheus, Alertmanager, and Grafana, using the command-line interface.
You can use the Prometheus and Alertmanager API to manage alerts and silences.
Prerequisite
- A running Red Hat Ceph Storage cluster.
- root-level access to all the hosts.
Procedure
Log into the
cephadmshell:Example
[root@host01 ~]# cephadm shellSet the APIs for the monitoring stack:
Specify the host and port of the Alertmanager server:
Syntax
ceph dashboard set-alertmanager-api-host ALERTMANAGER_API_HOST:PORTExample
[ceph: root@host01 /]# ceph dashboard set-alertmanager-api-host http://10.0.0.101:9093
Option ALERTMANAGER_API_HOST updated
To see the configured alerts, configure the URL to the Prometheus API. Using this API, the Ceph Dashboard UI verifies that a new silence matches a corresponding alert.
Syntax
ceph dashboard set-prometheus-api-host PROMETHEUS_API_HOST:PORTExample
[ceph: root@host01 /]# ceph dashboard set-prometheus-api-host http://10.0.0.101:9095
Option PROMETHEUS_API_HOST updated
After setting up the hosts, refresh your browser’s dashboard window.
Specify the host and port of the Grafana server:
Syntax
ceph dashboard set-grafana-api-url GRAFANA_API_URL:PORTExample
[ceph: root@host01 /]# ceph dashboard set-grafana-api-url https://10.0.0.101:3000
Option GRAFANA_API_URL updated
Get the Prometheus, Alertmanager, and Grafana API host details:
Example
[ceph: root@host01 /]# ceph dashboard get-alertmanager-api-host
http://10.0.0.101:9093
[ceph: root@host01 /]# ceph dashboard get-prometheus-api-host
http://10.0.0.101:9095
[ceph: root@host01 /]# ceph dashboard get-grafana-api-url
http://10.0.0.101:3000
Optional: If you are using a self-signed certificate in your Prometheus, Alertmanager, or Grafana setup, disable the certificate verification in the dashboard This avoids refused connections caused by certificates signed by an unknown Certificate Authority (CA) or that do not match the hostname.
For Prometheus:
Example
[ceph: root@host01 /]# ceph dashboard set-prometheus-api-ssl-verify FalseFor Alertmanager:
Example
[ceph: root@host01 /]# ceph dashboard set-alertmanager-api-ssl-verify FalseFor Grafana:
Example
[ceph: root@host01 /]# ceph dashboard set-grafana-api-ssl-verify False
Get the details of the self-signed certificate verification setting for Prometheus, Alertmanager, and Grafana:
Example
[ceph: root@host01 /]# ceph dashboard get-prometheus-api-ssl-verify
[ceph: root@host01 /]# ceph dashboard get-alertmanager-api-ssl-verify
[ceph: root@host01 /]# ceph dashboard get-grafana-api-ssl-verify
Optional: If the dashboard does not reflect the changes, you have to disable and then enable the dashboard:
Example
[ceph: root@host01 /]# ceph mgr module disable dashboard
[ceph: root@host01 /]# ceph mgr module enable dashboard
7.2. Configuring Grafana certificate
The cephadm deploys Grafana using the certificate defined in the ceph key/value store. If a certificate is not specified, cephadm generates a self-signed certificate during the deployment of the Grafana service.
You can configure a custom certificate with the ceph config-key set command.
Prerequisite
- A running Red Hat Ceph Storage cluster.
Procedure
Log into the
cephadmshell:Example
[root@host01 ~]# cephadm shellConfigure the custom certificate for Grafana:
Example
[ceph: root@host01 /]# ceph config-key set mgr/cephadm/grafana_key -i $PWD/key.pem
[ceph: root@host01 /]# ceph config-key set mgr/cephadm/grafana_crt -i $PWD/certificate.pem
If Grafana is already deployed, then run
reconfigto update the configuration:Example
[ceph: root@host01 /]# ceph orch reconfig grafanaEvery time a new certificate is added, follow the below steps:
Make a new directory
Example
[root@host01 ~]# mkdir /root/internalca
[root@host01 ~]# cd /root/internalca
Generate the key:
Example
[root@host01 internalca]# openssl ecparam -genkey -name secp384r1 -out $(date +%F).keyView the key:
Example
[root@host01 internalca]# openssl ec -text -in $(date +%F).key | lessMake a request:
Example
[root@host01 internalca]# umask 077; openssl req -config openssl-san.cnf -new -sha256 -key $(date +%F).key -out $(date +%F).csrReview the request prior to sending it for signature:
Example
[root@host01 internalca]# openssl req -text -in $(date +%F).csr | lessAs the CA sign:
Example
[root@host01 internalca]# openssl ca -extensions v3_req -in $(date +%F).csr -out $(date +%F).crt -extfile openssl-san.cnfCheck the signed certificate:
Example
[root@host01 internalca]# openssl x509 -text -in $(date +%F).crt -noout | less
7.3. Adding Alertmanager webhooks
You can add new webhooks to an existing Alertmanager configuration to receive real-time alerts about the health of the storage cluster. You have to enable incoming webhooks to allow asynchronous messages into third-party applications.
For example, if an OSD is down in a Red Hat Ceph Storage cluster, you can configure the Alertmanager to send notification on Google chat.
Prerequisite
- A running Red Hat Ceph Storage cluster with monitoring stack components enabled.
- Incoming webhooks configured on the receiving third-party application.
Procedure
Log into the
cephadmshell:Example
[root@host01 ~]# cephadm shellConfigure the Alertmanager to use the webhook for notification:
Syntax
service_type: alertmanager
spec:
  user_data:
    default_webhook_urls:
    - "_URLS_"
The
default_webhook_urlsis a list of additional URLs that are added to the default receivers'webhook_configsconfiguration.Example
service_type: alertmanager
spec:
  user_data:
    webhook_configs:
    - url: 'http:127.0.0.10:8080'
Update Alertmanager configuration:
Example
[ceph: root@host01 /]# ceph orch reconfig alertmanager
Verification
An example notification from Alertmanager to Gchat:
Example
using: https://chat.googleapis.com/v1/spaces/(xx- space identifyer -xx)/messages
posting: {'status': 'resolved', 'labels': {'alertname': 'PrometheusTargetMissing', 'instance': 'postgres-exporter.host03.chest
response: 200
response: {
"name": "spaces/(xx- space identifyer -xx)/messages/3PYDBOsIofE.3PYDBOsIofE",
"sender": {
"name": "users/114022495153014004089",
"displayName": "monitoring",
"avatarUrl": "",
"email": "",
"domainId": "",
"type": "BOT",
"isAnonymous": false,
"caaEnabled": false
},
"text": "Prometheus target missing (instance postgres-exporter.cluster.local:9187)\n\nA Prometheus target has disappeared. An e
"cards": [],
"annotations": [],
"thread": {
"name": "spaces/(xx- space identifyer -xx)/threads/3PYDBOsIofE"
},
"space": {
"name": "spaces/(xx- space identifyer -xx)",
"type": "ROOM",
"singleUserBotDm": false,
"threaded": false,
"displayName": "_privmon",
"legacyGroupChat": false
},
"fallbackText": "",
"argumentText": "Prometheus target missing (instance postgres-exporter.cluster.local:9187)\n\nA Prometheus target has disappea
"attachment": [],
"createTime": "2022-06-06T06:17:33.805375Z",
"lastUpdateTime": "2022-06-06T06:17:33.805375Z"
7.4. Viewing alerts on the Ceph dashboard
After an alert has fired, you can view it on the Red Hat Ceph Storage Dashboard. You can edit the Manager module settings to trigger a mail when an alert is fired.
Prerequisite
- A running Red Hat Ceph Storage cluster.
- Dashboard is installed.
- A running simple mail transfer protocol (SMTP) configured.
- An alert emitted.
Procedure
- From the dashboard navigation, go to Observability→Alerts.
- View active Prometheus alerts from the Active Alerts tab.
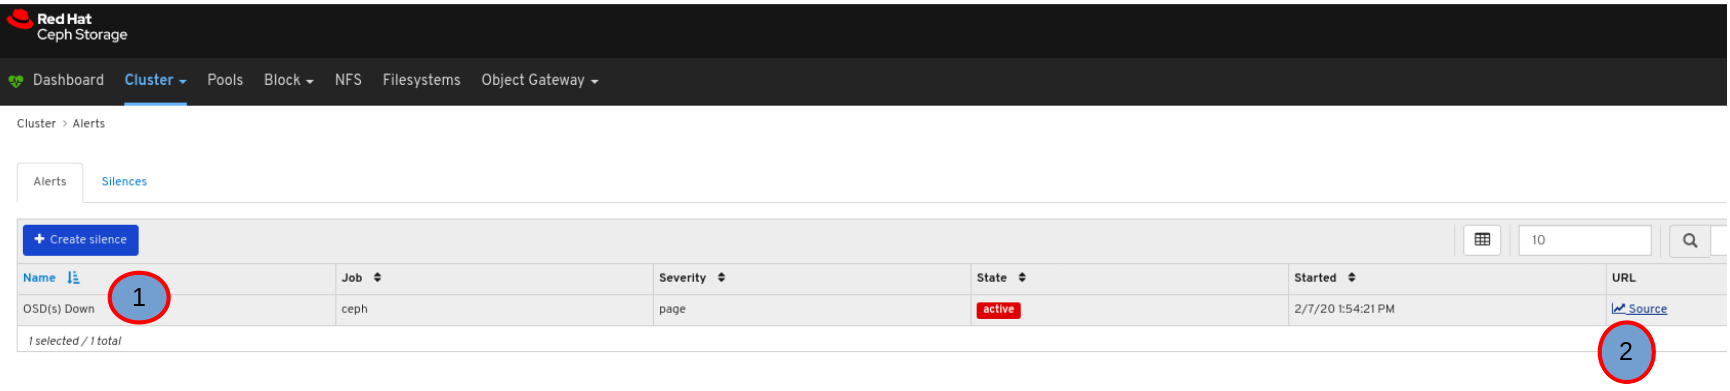
View all alerts from the Alerts tab.
To view alert details, expand the alert row.
To view the source of an alert, click on its row, and then click Source.
7.5. Creating a silence on the Ceph dashboard
You can create a silence for an alert for a specified amount of time on the Red Hat Ceph Storage Dashboard.
Prerequisite
- A running Red Hat Ceph Storage cluster.
- Dashboard is installed.
- An alert fired.
Procedure
- From the dashboard navigation, go to Observability→Alerts.
- On the Silences tab, click Create.
In the Create Silence form, fill in the required fields.
Use the Add matcher to add silence requirements.
Figure 7.2. Creating a silence
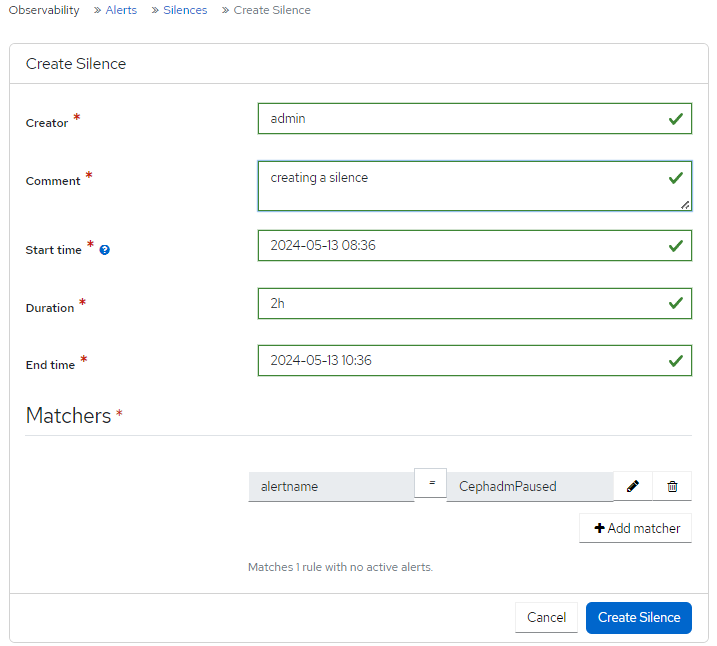
Click Create Silence.
A notification displays that the silence was created successfully and the Alerts Silenced updates in the Silences table.
7.6. Recreating a silence on the Ceph dashboard
You can recreate a silence from an expired silence on the Red Hat Ceph Storage Dashboard.
Prerequisite
- A running Red Hat Ceph Storage cluster.
- Dashboard is installed.
- An alert fired.
- A silence created for the alert.
Procedure
- From the dashboard navigation, go to Observability→Alerts.
- On the Silences tab, select the row with the alert that you want to recreate, and click Recreate from the action drop-down.
Edit any needed details, and click Recreate Silence button.
A notification displays indicating that the silence was edited successfully and the status of the silence is now active.
7.7. Editing a silence on the Ceph dashboard
You can edit an active silence, for example, to extend the time it is active on the Red Hat Ceph Storage Dashboard. If the silence has expired, you can either recreate a silence or create a new silence for the alert.
Prerequisite
- A running Red Hat Ceph Storage cluster.
- Dashboard is installed.
- An alert fired.
- A silence created for the alert.
Procedure
- Log in to the Dashboard.
- On the navigation menu, click Cluster.
- Select Monitoring from the drop-down menu.
- Click the Silences tab.
- To edit the silence, click it’s row.
- In the Edit drop-down menu, select Edit.
In the Edit Silence window, update the details and click Edit Silence.
Figure 7.3. Edit silence

- You get a notification that the silence was updated successfully.
7.8. Expiring a silence on the Ceph dashboard
You can expire a silence so any matched alerts will not be suppressed on the Red Hat Ceph Storage Dashboard.
Prerequisite
- A running Red Hat Ceph Storage cluster.
- Dashboard is installed.
- An alert fired.
- A silence created for the alert.
Procedure
- From the dashboard navigation, go to Observability→Alerts.
- On the Silences tab, select the row with the alert that you want to expire, and click Expire from the action drop-down.
In the Expire Silence notification, select Yes, I am sure and click Expire Silence.
A notification displays indicating that the silence was expired successfully and the Status of the alert is expired, in the Silences table.