Chapter 6. Tracing CodeReady Workspaces
Tracing helps gather timing data to troubleshoot latency problems in microservice architectures and helps to understand a complete transaction or workflow as it propagates through a distributed system. Every transaction may reflect performance anomalies in an early phase when new services are being introduced by independent teams.
Tracing the CodeReady Workspaces application may help analyze the execution of various operations, such as workspace creations, workspace startup, breaking down the duration of sub-operations executions, helping finding bottlenecks and improve the overall state of the platform.
Tracers live in applications. They record timing and metadata about operations that take place. They often instrument libraries, so that their use is indiscernible to users. For example, an instrumented web server records when it received a request and when it sent a response. The trace data collected is called a span. A span has a context that contains information such as trace and span identifiers and other kinds of data that can be propagated down the line.
6.1. Tracing API
CodeReady Workspaces utilizes OpenTracing API - a vendor-neutral framework for instrumentation. This means that if a developer wants to try a different tracing back end, then rather than repeating the whole instrumentation process for the new distributed tracing system, the developer can simply change the configuration of the tracer back end.
6.2. Tracing back end
By default, CodeReady Workspaces uses Jaeger as the tracing back end. Jaeger was inspired by Dapper and OpenZipkin, and it is a distributed tracing system released as open source by Uber Technologies. Jaeger extends a more complex architecture for a larger scale of requests and performance.
6.3. Installing the Jaeger tracing tool
The following sections describe the installation methods for the Jaeger tracing tool. Jaeger can then be used for gathering metrics in CodeReady Workspaces.
Installation methods available:
For tracing a CodeReady Workspaces instance using Jaeger, version 1.12.0 or above is required. For additional information about Jaeger, see the Jaeger website.
6.3.1. Installing Jaeger using OperatorHub on OpenShift 4
This section provide information about using Jaeger tracing tool for testing an evaluation purposes in production.
To install the Jaeger tracing tool from the OperatorHub interface in OpenShift Container Platform, follow the instructions below.
Prerequisites
- The user is logged in to the OpenShift Container Platform Web Console.
- A CodeReady Workspaces instance is available in a project.
Procedure
- Open the OpenShift Container Platform console.
-
From the left menu of the main OpenShift Container Platform screen, navigate to Operators
OperatorHub. -
In the Search by keyword search bar, type
Jaeger Operator. -
Click the
Jaeger Operatortile. -
Click the button in the
Jaeger Operatorpop-up window. -
Select the installation method:
A specific project on the clusterwhere the CodeReady Workspaces is deployed and leave the rest in its default values. - Click the Subscribe button.
-
From the left menu of the main OpenShift Container Platform screen, navigate to the Operators
Installed Operators section. - Red Hat CodeReady Workspaces is displayed as an Installed Operator, as indicated by the InstallSucceeded status.
- Click the Jaeger Operator name in the list of installed Operators.
- Navigate to the Overview tab.
-
In the Conditions sections at the bottom of the page, wait for this message:
install strategy completed with no errors. -
Jaeger Operatorand additionalElasticsearch Operatoris installed. -
Navigate to the Operators
Installed Operators section. - Click Jaeger Operator in the list of installed Operators.
- The Jaeger Cluster page is displayed.
- In the lower left corner of the window, click Create Instance
- Click Save.
-
OpenShift creates the Jaeger cluster
jaeger-all-in-one-inmemory. - Follow the steps in Enabling metrics collection to finish the procedure.
6.3.2. Installing Jaeger using CLI on OpenShift 4
This section provide information about using Jaeger tracing tool for testing an evaluation purposes.
To install the Jaeger tracing tool from a CodeReady Workspaces project in OpenShift Container Platform, follow the instructions in this section.
Prerequisites
- The user is logged in to the OpenShift Container Platform web console.
- A instance of CodeReady Workspaces in an OpenShift Container Platform cluster.
Procedure
In the CodeReady Workspaces installation project of the OpenShift Container Platform cluster, use the
occlient to create a new application for the Jaeger deployment.Copy to Clipboard Copied! Toggle word wrap Toggle overflow -
Using the Workloads
Deployments from the left menu of main OpenShift Container Platform screen, monitor the Jaeger deployment until it finishes successfully. -
Select Networking
Routes from the left menu of the main OpenShift Container Platform screen, and click the URL link to access the Jaeger dashboard. - Follow the steps in Enabling metrics collection to finish the procedure.
6.4. Enabling metrics collection
Prerequisites
- Installed Jaeger v1.12.0 or above. See instructions at Section 6.3, “Installing the Jaeger tracing tool”
Procedure
For Jaeger tracing to work, enable the following environment variables in your CodeReady Workspaces deployment:
To enable the following environment variables:
In the
yamlsource code of the CodeReady Workspaces deployment, add the following configuration variables underspec.server.customCheProperties.Copy to Clipboard Copied! Toggle word wrap Toggle overflow Edit the
JAEGER_ENDPOINTvalue to match the name of the Jaeger collector service in your deployment.From the left menu of the main OpenShift Container Platform screen, obtain the value of JAEGER_ENDPOINT by navigation to Networking
Services. Alternatively, execute the following occommand:oc get services
$ oc get servicesCopy to Clipboard Copied! Toggle word wrap Toggle overflow The requested value is included in the service name that contains the
collectorstring.
Additional resources
- For additional information about custom environment properties and how to define them in CheCluster Custom Resource, see Advanced configuration options for the CodeReady Workspaces server component.
- For custom configuration of Jaeger, see the list of Jaeger client environment variables.
6.5. Viewing CodeReady Workspaces traces in Jaeger UI
This section demonstrates how to use the Jaeger UI to overview traces of CodeReady Workspaces operations.
Procedure
In this example, the CodeReady Workspaces instance has been running for some time and one workspace start has occurred.
To inspect the trace of the workspace start:
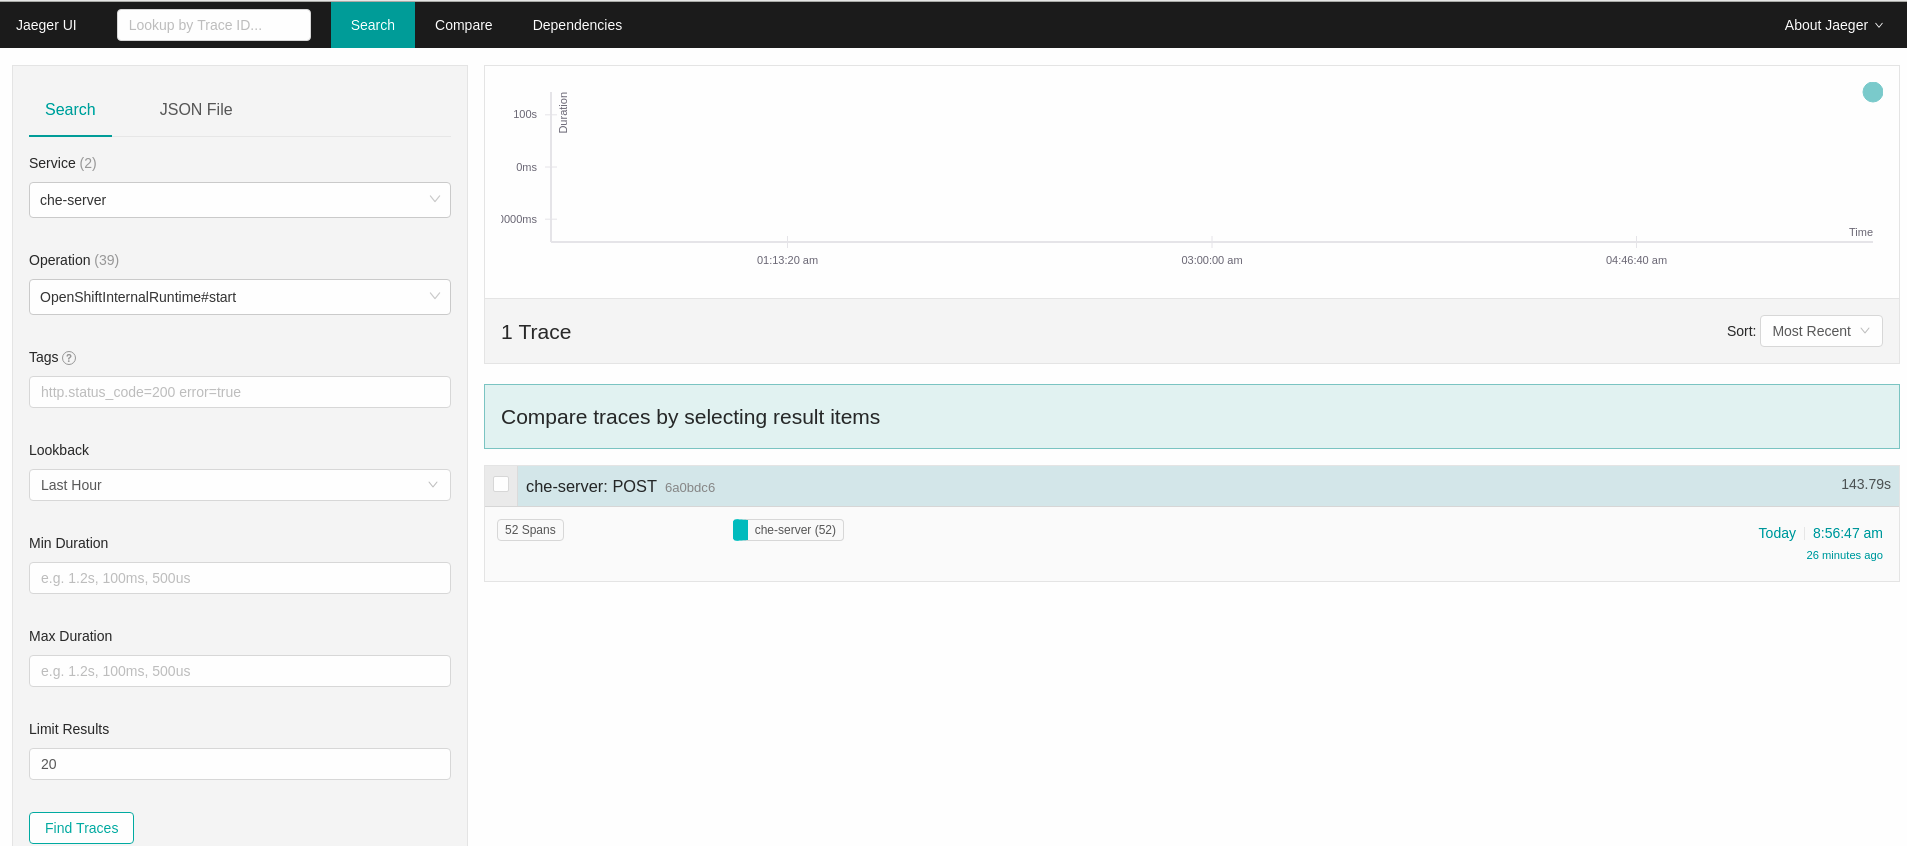
In the Search panel on the left, filter spans by the operation name (span name), tags, or time and duration.
Figure 6.1. Using Jaeger UI to trace CodeReady Workspaces
Select the trace to expand it and show the tree of nested spans and additional information about the highlighted span, such as tags or durations.
Figure 6.2. Expanded tracing tree

6.6. CodeReady Workspaces tracing codebase overview and extension guide
The core of the tracing implementation for CodeReady Workspaces is in the che-core-tracing-core and che-core-tracing-web modules.
All HTTP requests to the tracing API have their own trace. This is done by TracingFilter from the OpenTracing library, which is bound for the whole server application. Adding a @Traced annotation to methods causes the TracingInterceptor to add tracing spans for them.
6.6.1. Tagging
Spans may contain standard tags, such as operation name, span origin, error, and other tags that may help users with querying and filtering spans. Workspace-related operations (such as starting or stopping workspaces) have additional tags, including userId, workspaceID, and stackId. Spans created by TracingFilter also have an HTTP status code tag.
Declaring tags in a traced method is done statically by setting fields from the TracingTags class:
TracingTags.WORKSPACE_ID.set(workspace.getId());
TracingTags.WORKSPACE_ID.set(workspace.getId());
TracingTags is a class where all commonly used tags are declared, as respective AnnotationAware tag implementations.
Additional resources
For more information about how to use Jaeger UI, visit Jaeger documentation: Jaeger Getting Started Guide.