24.7. Cluster Administration


24.7.1. Cluster Nodes View
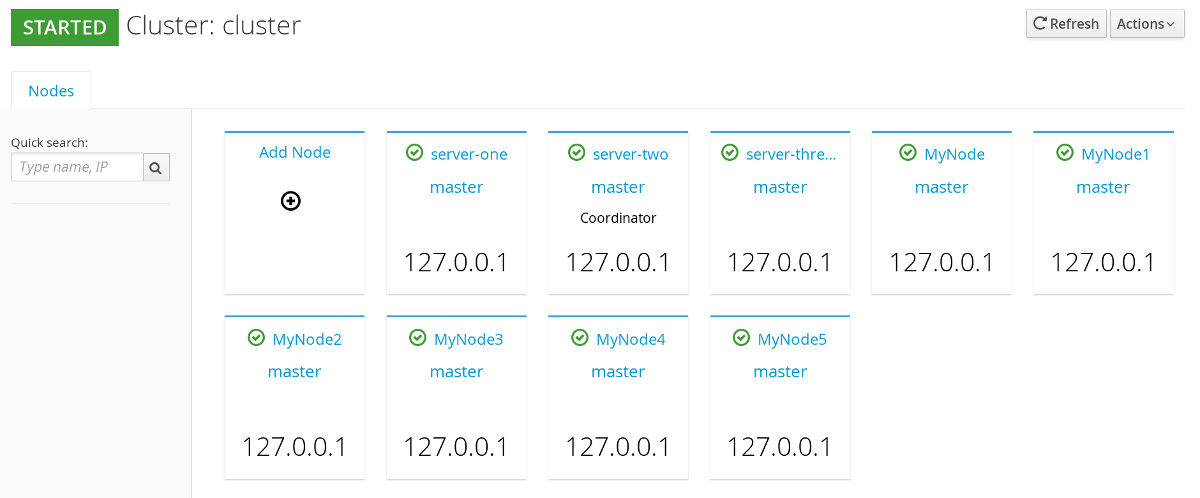
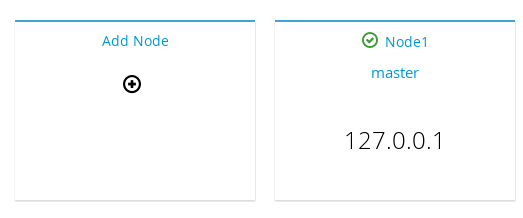
Clusters centric view allows to view the nodes created for each server group and the list of deployed servers can be viewed. In Clusters view, you can add new nodes to the cluster group and view performance metrics of the particular nodes.
To access the Clusters view, navigate to the Clusters tab from the Dashboard and click on the name of the cluster.
Description

Figure 24.72. Nodes View

24.7.2. Cluster Nodes Mismatch

The total number of server nodes on the JBoss Data Grid cluster should ideally match the number of nodes shown in the JBoss Data Grid Administration Console. If in case, due to some reason, the expected nodes in the console do not match with the exact number of nodes on the JBoss Data Grid physical cluster, the console issues a mismatch warning by displaying the number of nodes detected and the number of expected nodes. Knowing the expected number of server nodes helps in handling Network Partitions.
If nodes mismatch occurs, it can be viewed in the clusters view, above the list of nodes as a warning. To access the Clusters view, navigate to the Clusters tab from the Dashboard and click on the name of the cluster.
In the following screen, the Console alerts the user in the form of a warning. The expected number of server nodes are 5 but only 3 are detected by the console.
Description

Figure 24.73. Cluster Nodes Mismatch

24.7.3. Cluster Rebalancing

The Red Hat JBoss Data Grid Administration Console allows the user to enable and disable cluster rebalancing at the cache container and cache levels.

Note

Cluster rebalancing is enabled by default.
The following procedure outlines the steps to enable and disable cluster rebalancing at a cache container level :

Procedure 24.14. Enable and Disable Rebalancing

  1. From the cache container view, click on the name of the cache container.
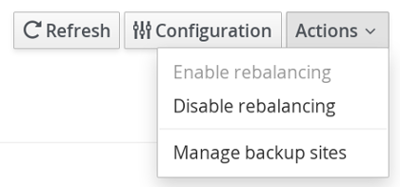
  2. In the caches view, at the right hand side, click on Actions.
    Description

    Figure 24.74. 

  3. A callout menu is opened. Click Disable Rebalancing.
    Description

    Figure 24.75. 

  4. A confirmation dialogue box appears. Click Accept.
    Description

    Figure 24.76. 

  5. Cluster rebalancing is successfully disabled.
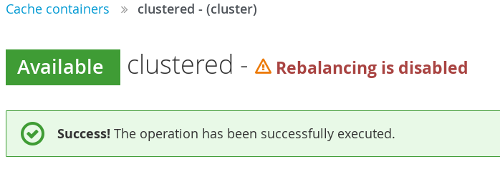
    Description

    Figure 24.77. 

  6. To enable rebalancing, click Actions > Enable Rebalancing.
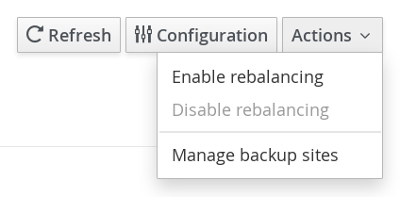
    Description

    Figure 24.78. 

  7. A confirmation dialogue box appears. Click Accept.
    Description

    Figure 24.79. 

Rebalancing is successfully enabled.
Description

Figure 24.80. 

The following procedure outlines the steps to enable and disable cluster rebalancing at a cache level :

Procedure 24.15. Enable and Disable Rebalancing

  1. From the cache container view, click on the name of the cache container.
  2. In the caches view, click on a specific cache.
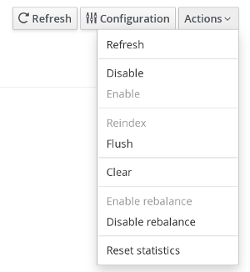
  3. The cache statistics page is displayed. At the right hand side, click Actions.
    Description

    Figure 24.81. 

  4. From the callout menu, click Disable Rebalance.
    Description

    Figure 24.82. 

  5. A confirmation dialogue box appears. Click Disable Rebalance.
    Description

    Figure 24.83. 

  6. The rebalancing for the cache is successfully disabled.
    Description

    Figure 24.84. 

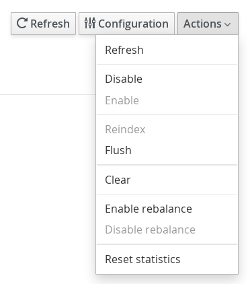
  7. To enable cache level rebalancing, click Enable rebalance from the Actions menu.
    Description

    Figure 24.85. 

  8. A confirmation dialogue box appears. Click Enable rebalance.
    Description

    Figure 24.86. 

The rebalancing for the cache is successfully enabled.
Description

Figure 24.87. 

24.7.4. Cluster Partition Handling

The JBoss Data Grid Console alerts the user with a visual warning when the cluster changes state to DEGRADED. The assumed causes for a DEGRADED cluster are occurence of a network partition, unreachable node(s) or unexpected extra nodes.
The visual warning is displayed in the Clusters view. To access the Clusters view, navigate to the Clusters tab from the Dashboard and click on the name of the cluster. In the following screen, the visual warning DEGRADED is displayed next to the cluster name JDG Cluster #1.
Description

Figure 24.88. Network Partition Warning

This visual warning for a DEGRADED cluster is shown at Cluster, Cache Container, and Cache levels of the console.

24.7.5. Cluster Events

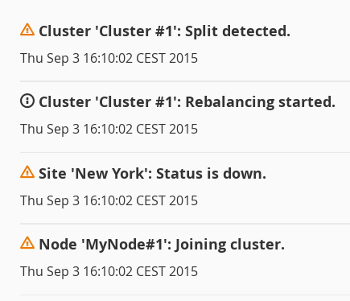
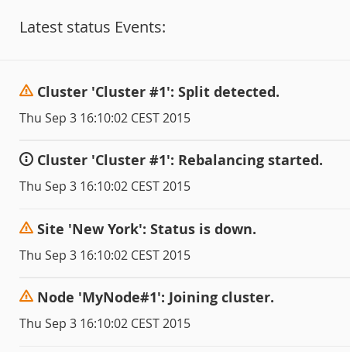
The JBoss Data Grid Console displays the cluster wide events such as cluster-split and cluster-merge events in a consolidated section. Along with the cluster events, the console displays the timestamp of the associated event. Cluster events can be viewed in the Cache containers page, the Clusters view page and also in the Status Events tab of the Dashboard.
To view cluster events on the cache containers page, navigate to the default cache containers view which is the default landing interface after logging into the console. The Cluster events is displayed at the right hand side in a consolidated section under the title Latest Grid Events
Description

Figure 24.89. 

To view the cluster events on the Clusters view page, navigate to the Clusters view by clicking on the Clusters tab. The Cluster events is displayed at the right hand side in a consolidated section under the title Latest status Events
Description

Figure 24.90. 

24.7.6. Adding Node

The JBoss Data Grid Administration Console allows administrators to configure new nodes.
The following procedure outlines the steps to add a new Node:

Procedure 24.16. Adding a New Node

  1. In the Dashboard view, click Cluster tab.
    Description

    Figure 24.91. Clusters Tab

  2. Click on the name of the cluster where the new node has to be added.
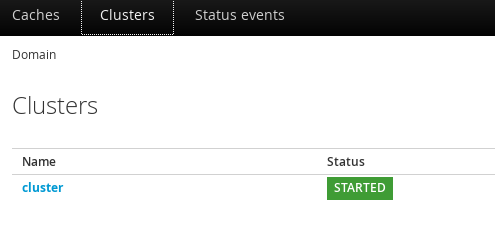
    Description

    Figure 24.92. Cluster Selection

  3. Click Add Node.
    Description

    Figure 24.93. Add Node Created

  4. The node configuration window is opened. Enter the node properties in the respective fields and click Create
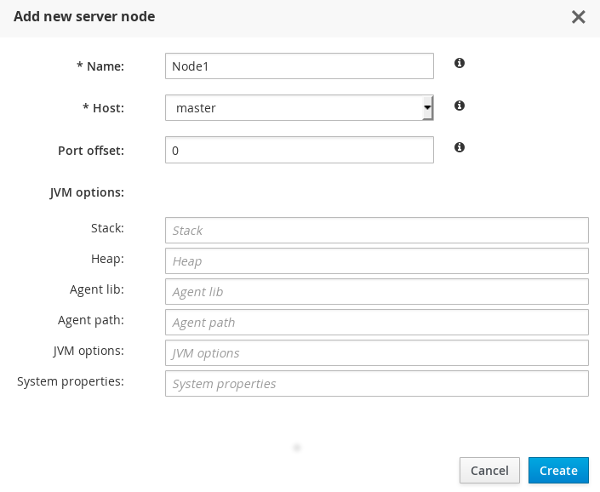
    Description

    Figure 24.94. Node Properties

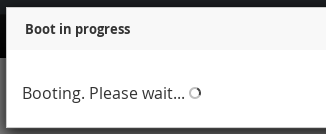
  5. The system boots up.
    Description

    Figure 24.95. System Boot

  6. The new node is successfully created.
    Description

    Figure 24.96. New Node

24.7.7. Node Statistics and Properties View
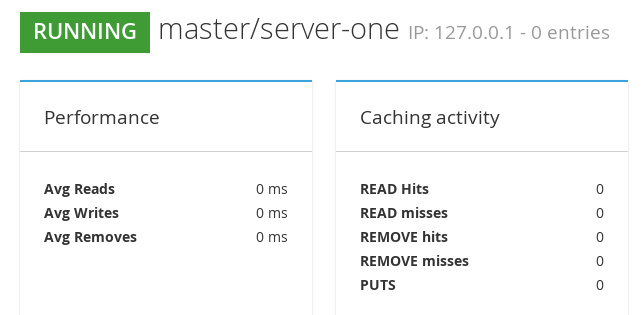
JBoss Data Grid Administration Console allows users to view the average time for reads, average times for writes, total number of entries, total number of reads, total number of failed reads, total number of writes and other data.
To view the Node statistics, click on the name of the Node in the Clusters tab on the JBoss Data Grid Administration Console.
Description

Figure 24.97. Nodes Statistics

24.7.8. Node Performance Metrics View
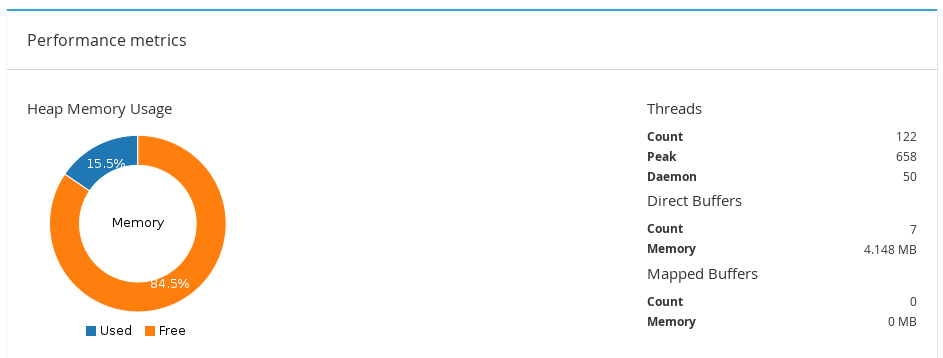
To view the Node performance metrics, click on the name of the node in the Clusters tab of the JBoss Data Grid Administration Console
Description

Figure 24.98. Node Performance Metrics

24.7.9. Disabling a Node

The JBoss Data Grid Administration Console allows administrators to disable nodes.
To disable a node of a cluster, follow these steps:

Procedure 24.17. Adding a New Node

  1. Click on the name of the cluster in the Cluster View of the JBoss Data Grid Administration Console.
  2. In the Nodes view, click on the node to be disabled.
    Description

    Figure 24.99. Nodes View

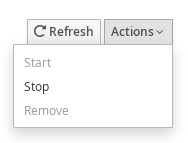
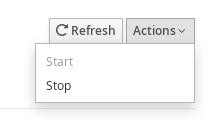
  3. The Node statistics view is opened. Click on the Actions tab located at the right hand side of the page and then click Stop.
    Description

    Figure 24.100. Nodes Stop

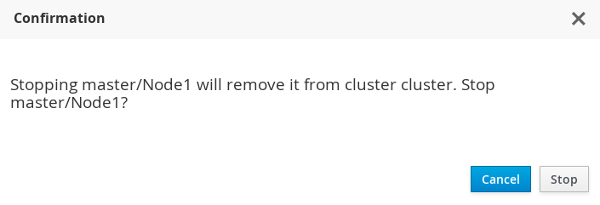
  4. A confirmation box appears. Click Stop to remove the node from the cluster.
    Description

    Figure 24.101. Confirmation Box

24.7.10. Cluster Shutdown and Restart

24.7.10.1. Cluster Shutdown

JBoss Data Grid Administration Console allows convenient and controlled shutdown of JBoss Data Grid clusters for maintenance purposes. For caches with a configured cache store, the data will be persisted without any data loss.For caches without a configured cache store, data will be lost after cluster shutdown.
To shut down or stop a cluster, follow these steps:

Procedure 24.18. Shutting Down Cluster

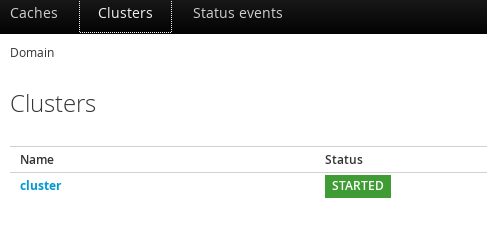
  1. Navigate to the Clusters view in the JBoss Data Grid Administration console and click on the name of the cluster.
    Description

    Figure 24.102. Clusters View

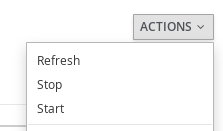
  2. On the Nodes view page, locate the Actions tab to the top right hand side of the interface. Click on Actions tab and then click Stop.
    Description

    Figure 24.103. Cluster Stop

  3. A confirmation box will appear. To confirm, click Stop.
    Description

    Figure 24.104. Confirmation Box

24.7.10.2. Cluster Start

JBoss Data Grid Administration Console allows restarting a stopped cluster. The cache data is preloaded without any data loss for caches with configured cache-store. Caches without a configured cache store, will initially contain no data.
Preloading will only happen if preload is enabled on the cache store. If the local cache state on one of the nodes is corrupt, the cache will not start and manual intervention will be required.
To a cluster, follow these steps:

Procedure 24.19. Starting Cluster

  1. Navigate to the Clusters view in the JBoss Data Grid Administration console and click on the name of the cluster.
  2. On the Nodes view page, locate the Actions tab to the top right hand side of the interface. Click on Actions tab and then click Start.
    Description

    Figure 24.105. Cluster Start

  3. A confirmation box will appear. Click Start to start the cluster.
Red Hat logoGithubRedditYoutubeTwitter

Learn

Try, buy, & sell

Communities

About Red Hat Documentation

We help Red Hat users innovate and achieve their goals with our products and services with content they can trust.

Making open source more inclusive

Red Hat is committed to replacing problematic language in our code, documentation, and web properties. For more details, see the Red Hat Blog.

About Red Hat

We deliver hardened solutions that make it easier for enterprises to work across platforms and environments, from the core datacenter to the network edge.

© 2024 Red Hat, Inc.