Chapter 1. Enabling observability for Red Hat Developer Hub on OpenShift Container Platform
In OpenShift Container Platform, metrics are exposed through an HTTP service endpoint under the /metrics canonical name. You can create a ServiceMonitor custom resource (CR) to scrape metrics from a service endpoint in a user-defined project.
1.1. Enabling metrics monitoring in a Red Hat Developer Hub Operator installation on an OpenShift Container Platform cluster
You can enable and view metrics for an Operator-installed Red Hat Developer Hub instance from the Developer perspective of the OpenShift Container Platform web console.
Prerequisites
- Your OpenShift Container Platform cluster has monitoring for user-defined projects enabled.
- You have installed Red Hat Developer Hub on OpenShift Container Platform using the Red Hat Developer Hub Operator.
-
You have installed the OpenShift CLI (
oc).
Procedure
Currently, the Red Hat Developer Hub Operator does not support creating a ServiceMonitor custom resource (CR) by default. You must complete the following steps to create a ServiceMonitor CR to scrape metrics from the endpoint.
Create the
ServiceMonitorCR as a YAML file:apiVersion: monitoring.coreos.com/v1 kind: ServiceMonitor metadata: name: <custom_resource_name>1 namespace: <project_name>2 labels: app.kubernetes.io/instance: <custom_resource_name> app.kubernetes.io/name: backstage spec: namespaceSelector: matchNames: - <project_name> selector: matchLabels: rhdh.redhat.com/app: backstage-<custom_resource_name> endpoints: - port: backend path: '/metrics'Apply the
ServiceMonitorCR by running the following command:oc apply -f <filename>
Verification
- From the Developer perspective in the OpenShift Container Platform web console, select the Observe view.
- Click the Metrics tab to view metrics for Red Hat Developer Hub pods.
1.2. Enabling metrics monitoring in a Helm chart installation on an OpenShift Container Platform cluster
You can enable and view metrics for a Red Hat Developer Hub Helm deployment from the Developer perspective of the OpenShift Container Platform web console.
Prerequisites
- Your OpenShift Container Platform cluster has monitoring for user-defined projects enabled.
- You have installed Red Hat Developer Hub on OpenShift Container Platform using the Helm chart.
Procedure
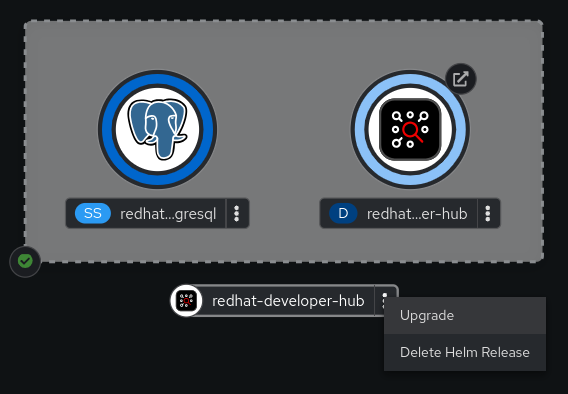
- From the Developer perspective in the OpenShift Container Platform web console, select the Topology view.
Click the overflow menu of the Red Hat Developer Hub Helm chart, and select Upgrade.

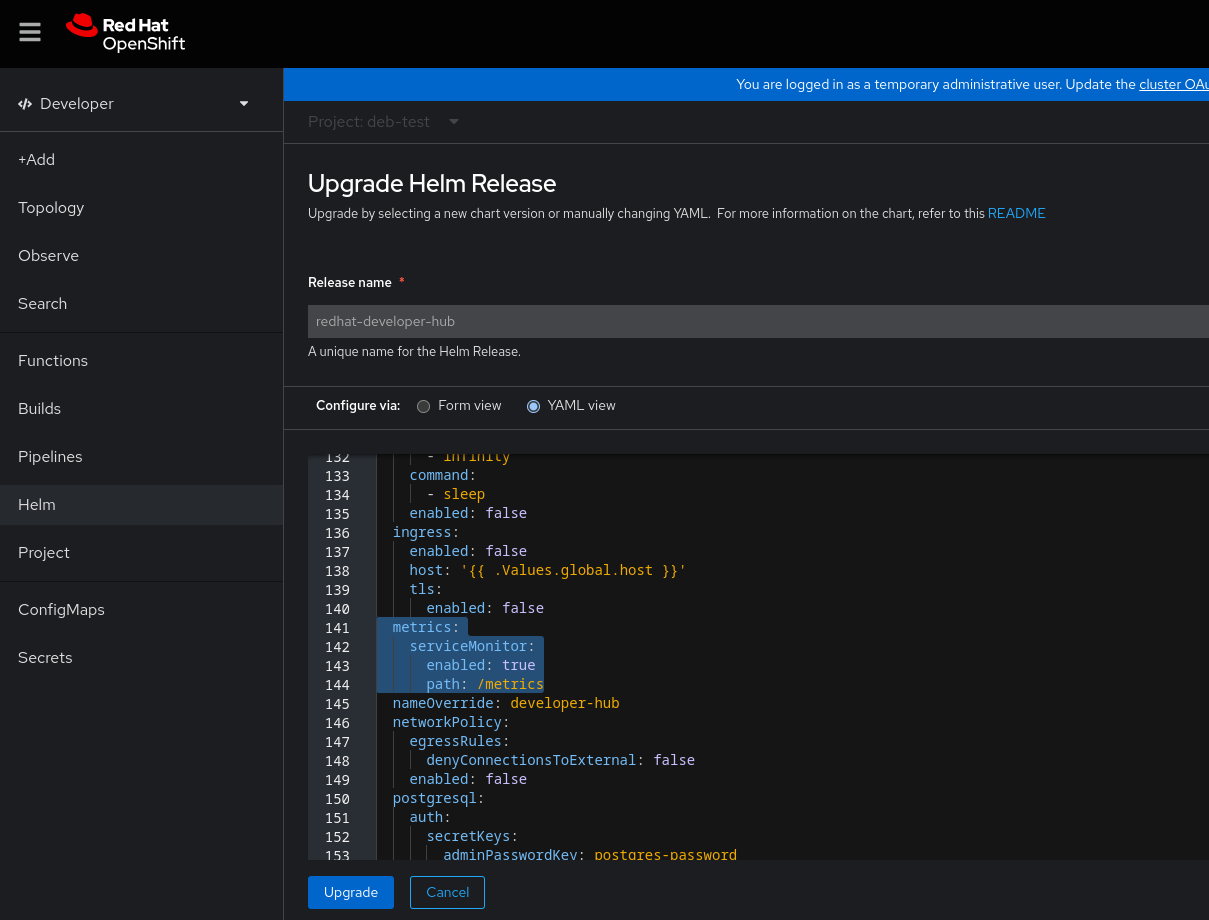
On the Upgrade Helm Release page, select the YAML view option in Configure via, then configure the
metricssection in the YAML, as shown in the following example:upstream: # ... metrics: serviceMonitor: enabled: true path: /metrics # ...
- Click Upgrade.
Verification
- From the Developer perspective in the OpenShift Container Platform web console, select the Observe view.
- Click the Metrics tab to view metrics for Red Hat Developer Hub pods.