Chapter 20. The Fuse Fabric perspective
The Fuse Fabric perspective, shown in Figure 20.1, is where you access the fabric development and debugging tools.
Figure 20.1. Fuse Fabric perspective
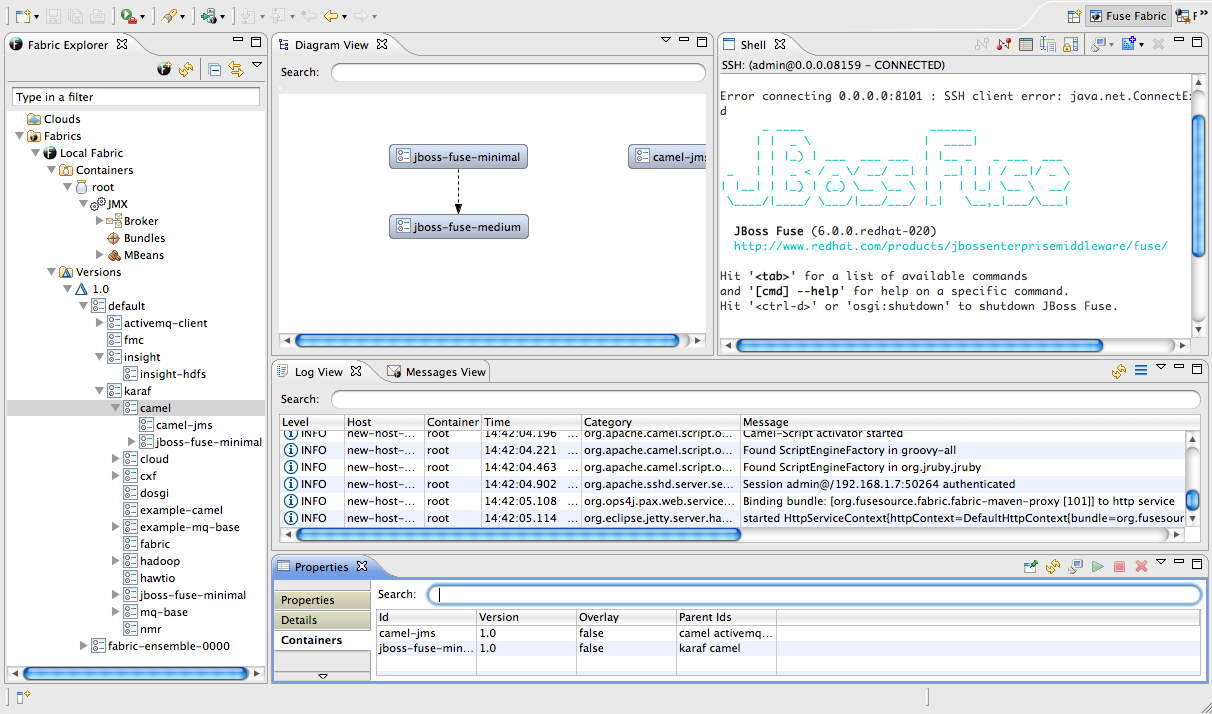
The Fuse Fabric perspective consists of six main areas:
- Fabric Navigator—lists the fabrics and the containers, profiles, and versions of which they consist.
- Diagram View—provides a graphical representation of a node selected in Fabric Navigator.
- Shell— provides console access to any container running on the fabric.
- Log view—lists the log entries of the selected container or the selected JMX process.
- Messages View—lists the message instances that passed through the nodes in a selected route, after tracing was enabled on the route.
- Properties view—displays the properties of an object selected in Fabric Navigator.
Fabric Navigator
Copy linkLink copied to clipboard!
Fabric Navigator provides access to your fabrics. Once the developer tools are connected to a fabric, Fabric Navigator provides access to all of the fabric's components (containers, profiles, and profile versions) enabling you to configure, run, and debug your project in the fabric environment.
Diagram view
Copy linkLink copied to clipboard!
Use Diagram View in conjunction with Messages View to track a message through the nodes of a route for which tracing has been activated. In Diagram View, the node which corresponds to the message instance selected in Messages View is highlighted. Messages View displays metrics for the selected message instance, including the time at which it exited the highlighted node.
Log view
Copy linkLink copied to clipboard!
Log view displays the log entries of the container selected in Fabric Navigator. This feature enables you to see the log messages of any container running in a fabric.
Double-clicking a process in a container's JMX tree opens the process in a jconsole-like viewer, where you can browse its attributes, operations, notifications, and other information, all of which are presented in tabular format.
Messages view
Copy linkLink copied to clipboard!
The Messages View is used for tracing messages through a route in a fabric environment.
When an Apache Camel route for which route tracing has been activated is selected in Fabric Navigator, Messages View lists all messages that pass through the route from the time tracing was activated. Messages View also provides metrics for each message instance, making it easier to debug routes.
Use the view's button periodically to update its display of message traces.
Properties view
Copy linkLink copied to clipboard!
For container nodes, the Properties view also provides the Profiles tab, for viewing the profiles assigned to the container, and the Profile Details tab, for viewing the details of each assigned profile.
The Profiles editor enables you to change the profiles associated with the selected container, and the Profile Details editor enables you to modify the configuration of the selected profile.
JMX viewer
Copy linkLink copied to clipboard!
Double-clicking a process in a container's JMX tree opens the process in a jconsole-like viewer, where you can browse its attributes, operations, notifications, and other information, all of which are presented in tabular format.