Chapter 10. Monitoring Cluster Metrics
10.1. Cluster Level Dashboard
This is the default dashboard of the Monitoring interface that shows the overview of the selected cluster.
10.1.1. Monitoring and Viewing Cluster Health
To monitor the Cluster health status and the metrics associated with it, view the panels in the Cluster Dashboard. For detailed panel descriptions and health indicators, see Table 7.1. Cluster Health Panel Descriptions.
10.1.1.1. Health and Snapshots
The Health panel displays the overall health of the selected cluster and the Snapshots panel shows the active number of snapshots.

10.1.1.2. Hosts, Volumes and Bricks
The Hosts, Volumes, and Bricks panels displays status information. The following is an example screen displaying the respective status information.
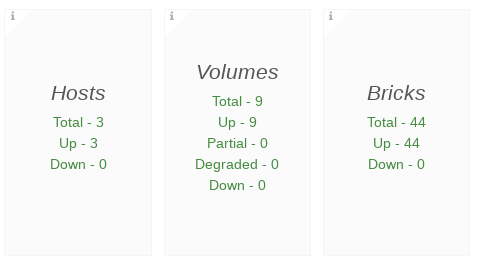
- Hosts: In total, there are 3 online Hosts
- Volumes: In total, there are 9 Volumes
- Bricks: In total, there are 44 Bricks
10.1.1.3. Geo-Replication Session
The Geo-Replication Session panel displays geo-replication session information from a given cluster, including the total number of geo-replication session and a count of geo-replication sessions by status.

10.1.1.4. Health Panel Descriptions
The following table lists the Panels and the descriptions.
| Panel | Description | Health Indicator |
|---|---|---|
| Health | The Health panel displays the overall health of the selected cluster, which is either Healthy or Unhealthy | Green: Healthy Red: Unhealthy Orange: Degraded |
| Snapshots | The Snapshots panel displays the count of the active snapshots | |
| Hosts | The Hosts panel displays host status information including the total number of hosts and a count of hosts by status | |
| Volume | The Volumes panel displays volume status information for the selected cluster, including the total number of volumes and a count of volumes by status | |
| Bricks | The Bricks panel displays brick status information for the selected cluster, including the total number of bricks in the cluster, and a count of bricks by status | |
| Geo-Replication Session | The Geo-Replication Session panel displays geo-replication session information from a given cluster, including the total number of geo-replication session and a count of geo-replication sessions by status |
10.1.2. Monitoring and Viewing Cluster Performance
Cluster performance metrics can be monitored by the data displayed in the following panels.
Connection Trend
The Connection Trend panel displays the total number of client connections to bricks in the volumes for the selected cluster over a period of time. Typical statistics may look like this:

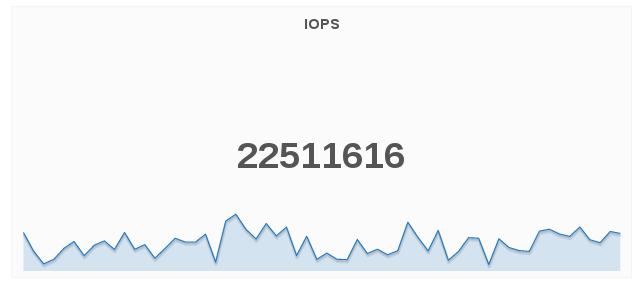
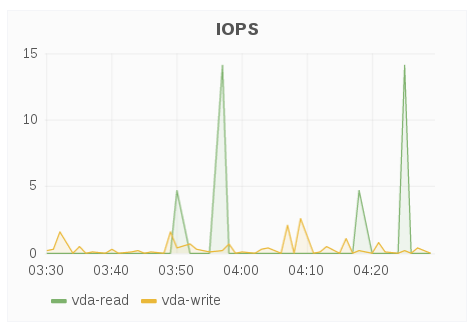
IOPS
The IOPS panel displays IOPS for the selected cluster over a period of time. IOPS is based on the aggregated brick level read and write operations collected using gluster volume profile info.
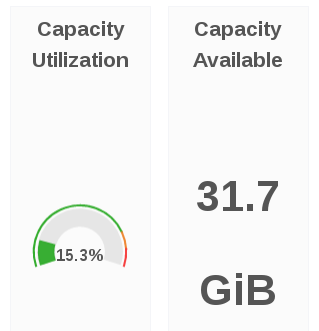
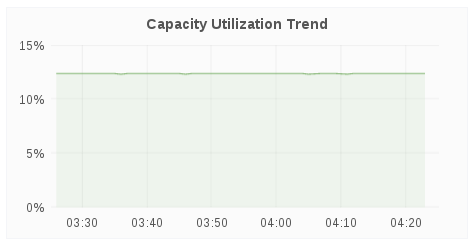
Capacity Utilization and Capacity Available
The Capacity Utilization panel displays the capacity utilized across all volumes for the selected cluster.
The Capacity Available panel displays the available capacity across all volumes for the selected cluster.
Weekly Growth Rate
The Weekly Growth Rate panel displays the forecasted weekly growth rate for capacity utilization computed based on daily capacity utilization.

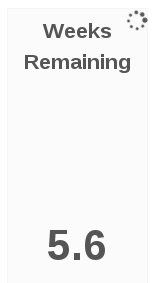
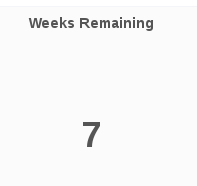
Weeks Remaining
The Weeks Remaining panel displays the estimated time remaining in weeks till volumes reach full capacity based on the forecasted Weekly Growth Rate.
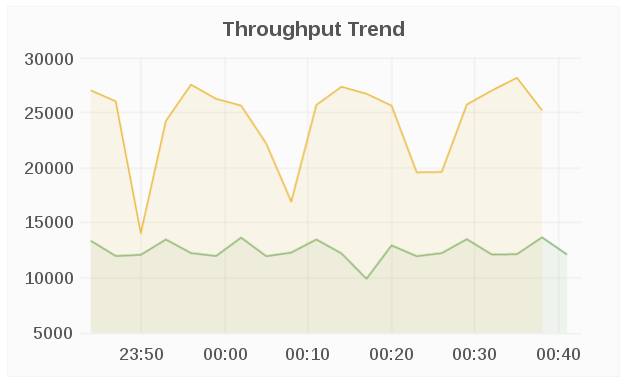
Throughput Trend
The Throughput Trend panel displays the network throughput for the selected cluster over a period of time.
10.1.3. Top Consumers
The Top Consumers panels displays the highest capacity utilization by the cluster resources.
To view the top consumers of the cluster:
In the Cluster level dashboard, at the bottom, click Top Consumers to expand the menu.
Top 5 Utilization By Bricks
The Top 5 Utilization By Bricks panel displays the bricks with the highest capacity utilization.

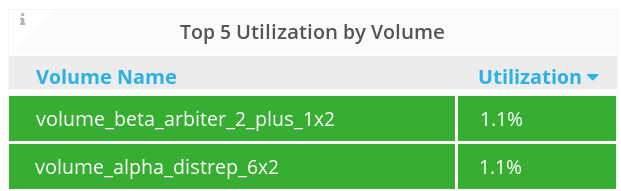
Top 5 Utilization by Volume
The Top 5 Utilization By Volumes panel displays the volumes with the highest capacity utilization.
CPU Utilization by Host
The CPU Utilization by Host panel displays the CPU utilization of each node in the cluster.

Memory Utilization By Host
The Memory Utilization by Hosts panel displays memory utilization of each node in the cluster.

Ping Latency Trend
The Ping Latency Trend panel displays the ping latency for each host in a given cluster.

10.1.4. Monitoring and Viewing Cluster Status
To view the status of the overall cluster:
In the Cluster level dashboard, at the bottom, click Status to expand the menu.
- The Volume, Host, and Brick status are displayed in the panels.

Volume Status
The Volume Status panel displays the status code of each volume for the selected cluster.

The volume status is displayed in numerals and colors. The following are the corresponding status of the numerals.
- 0 = Up
- 3 = Up (Degraded)
- 4 = Up (Partial)
- 5 = Unknown
- 8 = Down
Host Status
The Host Status panel displays the status code of each host for the selected cluster.
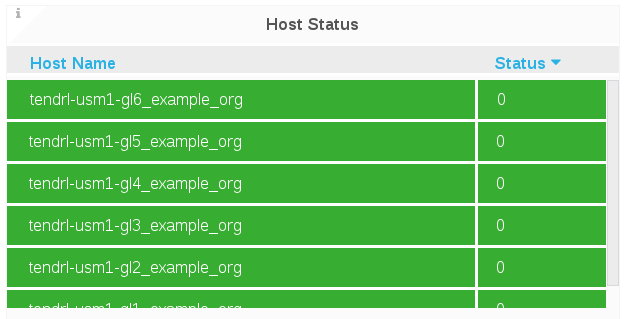
The Host status is displayed in numeric codes:
- 0 = Up
- 8 = Down
Brick Status
The Brick Status panel displays the status code of each brick for the selected cluster.
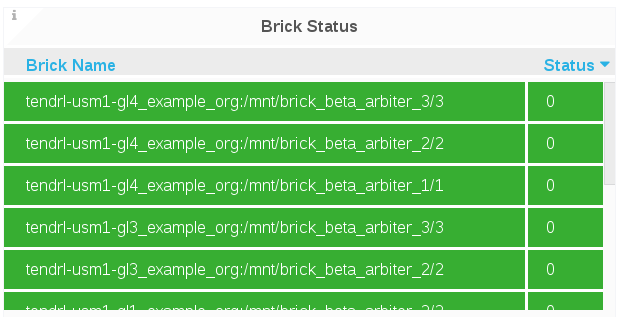
The Brick status is displayed in numeric codes:
- 1 = Started
- 10 = Stopped
10.2. Host Level Dashboard
10.2.1. Monitoring and Viewing Health and Status
To monitor the Cluster Hosts status and the metrics associated with it, navigate to the Hosts Level Dashboard and view the panels.
Health
The Health panel displays the overall health for a given host.

Bricks and Bricks Status
The Bricks panel displays brick status information for a given host, including the total number of bricks in the host, and a count of bricks by status.

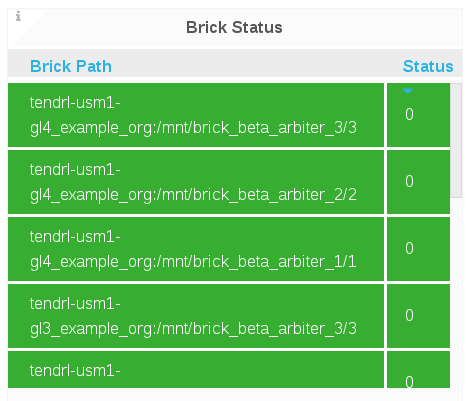
The Brick Status panel displays the status code of each brick for a given host.
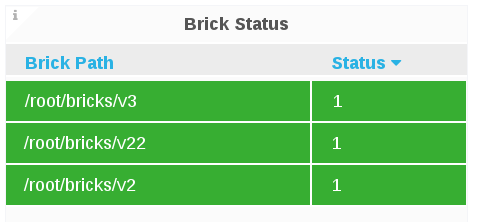
- 1 = Started
- 10 = Stopped
10.2.2. Monitoring and Viewing Performance
10.2.2.1. Memory and CPU Utilization
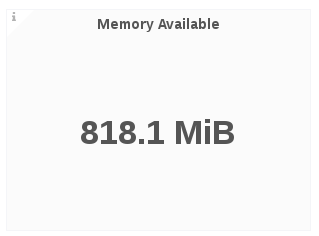
Memory Available
The Memory Available panel displays the sum of memory free and memory cached.
Memory Utilization
The Memory Utilization panel displays memory utilization percentage for a given host that includes buffers and caches used by the kernel over a period of time.

- Buffered: Amount of memory used for buffering, mostly for I/O operations
- Cached: Memory used for caching disk data for reads, memory-mapped files or tmpfs data
- Slab Rec: Amount of reclaimable memory used for slab kernel allocations
- Slab Unrecl: Amount of unreclaimable memory used for slab kernel allocations
- Used: Amount of memory used, calculated as Total - Free (Unused Memory) - Buffered - Cache
- Total: Total memory used
Swap Free
The Swap Free panel displays the available swap space in percent for a given host.

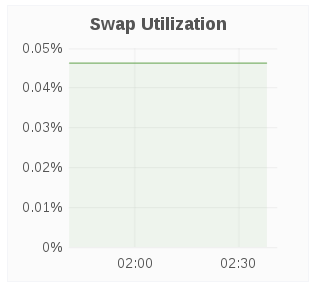
Swap Utilization
The Swap Utilization panel displays the used swap space in percent for a given host.
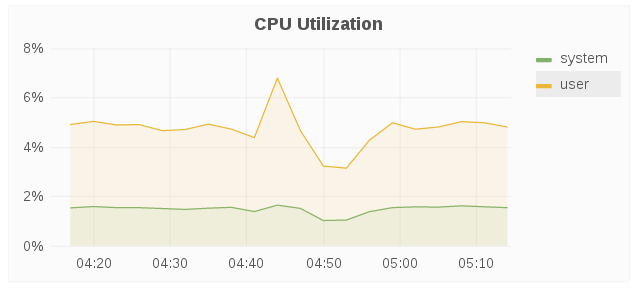
CPU Utilization
The CPU utilization panel displays the CPU utilization for a given host over a period of time.
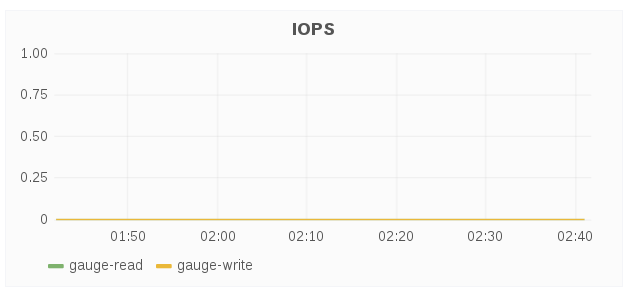
IOPS
The IOPS panel displays IOPS for a given host over a period of time. IOPS is based on the aggregated brick level read and write operations.
10.2.2.2. Capacity and Disk Load
Total Brick Capacity Utilization Trend
The Total Brick Capacity Utilization Trend panel displays the capacity utilization for all bricks on a given for a period of time.

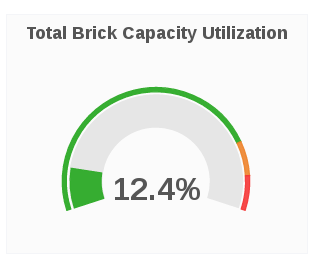
Total Brick Capacity Utilization
The Total Brick Capacity Utilization panel displays the current percent capacity utilization for a given host.
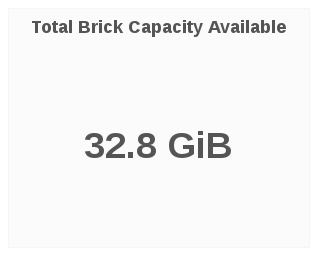
Total Brick Capacity Available
The Total Brick Capacity Available panel displays the current available capacity for a given host.
Weekly Growth Rate
The Weekly Growth Rate panel displays the forecasted weekly growth rate for capacity utilization computed based on daily capacity utilization.

Weeks Remaining
The Weeks Remaining panel displays the estimated time remaining in weeks till host capacity reaches full capacity based on the forecasted Weekly Growth Rate.
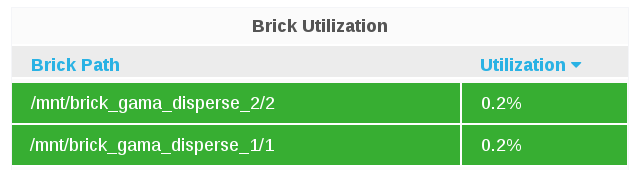
Brick Utilization
The Brick Utilization panel displays the utilization of each brick for a given host.
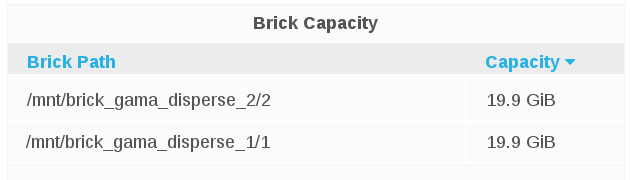
Brick Capacity
The Brick Capacity panel displays the total capacity of each brick for a given host.
Brick Capacity Used
The Brick Capacity Used panel displays the used capacity of each brick for a given host.

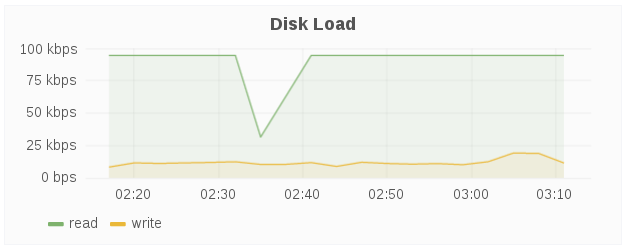
Disk Load
The Disk Load panel shows the host’s aggregated read and writes from/to disks over a period of time.
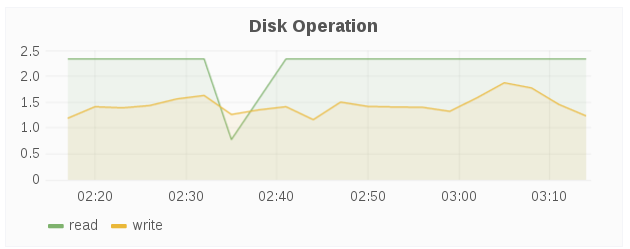
Disk Operation
The Disk Operations panel shows the host’s aggregated read and writes disk operations over a period of time.
Disk IO
The Disk IO panel shows the host’s aggregated I/O time over a period of time.

10.2.2.3. Network
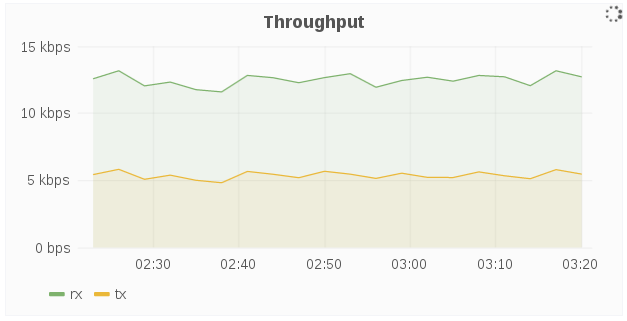
Throughput
The Throughput panel displays the network throughput for a given host over a period of time.
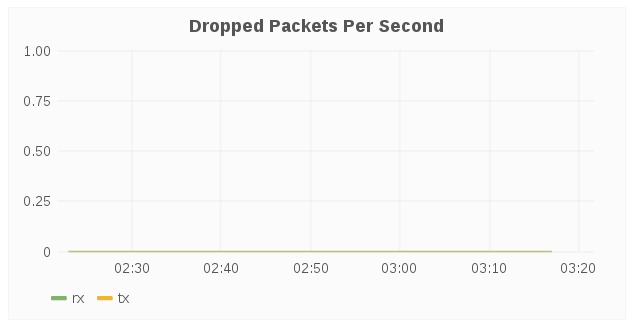
Dropped Packets Per Second
The Dropped Packets Per Second panel displays dropped network packets for the host over a period of time. Typically, dropped packets indicates network congestion, for example, the queue on the switch port your host is connected to is full and packets are dropped because it cannot transmit data fast enough.
Errors Per Second
The Errors Per Second panel displays network errors for a given host over a period of time. Typically, the errors indicate issues that occurred while transmitting packets due to carrier errors (duplex mismatch, faulty cable), fifo errors, heartbeat errors, and window errors, CRC errors too short frames, and/or too long frames. In short, errors typically result from faulty hardware, and/or speed mismatch.

10.2.3. Host Dashboard Metric Units
The following table shows the metrics and their corresponding measurement units.
| Metrics | Units |
|---|---|
| Memory Available | Megabyte/Gigabyte/Terabyte |
| Memory Utilization | Percentage % |
| Swap free | Percentage % |
| Swap Utilization | Percentage % |
| CPU Utilization | Percentage % |
| Total Brick Capacity Utilization | Percentage % |
| Total Brick Capacity | MB/GB/TB |
| Weekly Growth Rate | MB/GB/TB |
| Disk Load | kbps |
| Disk IO | millisecond ms |
| Network Throughput | kbps |
10.3. Volume Level Dashboard
The Volume view dashboard allows the Gluster Administrator to:
- View at-a-glance information about the Gluster volume that includes health and status information, key performance indicators such as IOPS, throughput, etc, and alerts that can highlight attention to potential issues in the volume, brick, and disk.
- Compare 1 or more metrics such as IOPS, CPU, Memory, Network Load across bricks within the volume.
- Compare utilization such as IOPS, capacity, etc, across bricks within a volume.
- View performance metrics by brick (within a volume) to address diagnosing of failure, rebuild, degradation, and poor performance on one brick.
When all the Gluster storage nodes are shut down or offline, Time to live (TTL) will delete the volume details from etcd as per the TTL value measured in seconds. The TTL value for volumes is set based on the number of volumes and bricks in the system. The formula to calculate the TTL value to delete volume details is:
Time to Live (seconds) = synchronization interval (60 seconds) + number of volumes * 20 + number of bricks * 10 + 160.
In Web Administration environment
- Cluster will show status as unhealthy and all hosts will be marked as down
- No display of Volumes and Bricks
- The Events view will reflect the relevant status
In Grafana Dashboard
- In Cluster level Dashboard, the Host, Volumes, and Bricks panels reflects the relevant updated counts with status.
- In Cluster, Volume, and Brick level dashboards, some panels will be marked as N/A, indicating no data is available.
10.3.1. Monitoring and Viewing Health
Health
The Health panel displays the overall health for a given volume.

Snapshots
The Snapshots panel displays the count of active snapshots for the selected cluster.

Brick Status
The Brick Status panel displays the status code of each brick for a given volume.
- 1 = Started
- 10 = Stopped
Bricks
The Bricks panel displays brick status information for a given volume, including the total number of bricks in the volume, and a count of bricks by status.
Subvolumes
The Subvolumes panel displays subvolume status information for a given volume.
Geo-Replication Sessions
The Geo-Replication Session panel displays geo-replication session information from a given volumes, including the total number of geo-replication session and a count of geo-replication sessions by status.
Rebalance
The Rebalance panel displays rebalance progress information for a given volume, which is applicable when rebalancing is underway.
Rebalance Status:
The Rebalance Status panel displays the status of rebalancing for a given volume, which is applicable when rebalancing is underway.
10.3.2. Monitoring and Viewing Performance
Capacity Utilization
The Capacity Utilization panel displays the used capacity for a given volume.

Capacity Available
The Capacity Available panel displays the available capacity for a given volume.

Weekly Growth Rate
The Weekly Growth Rate panel displays the forecasted weekly growth rate for capacity utilization computed based on daily capacity utilization.

Weeks Remaining
The Weeks Remaining panel displays the estimated time remaining in weeks till volume reaches full capacity based on the forecasted Weekly Growth Rate.
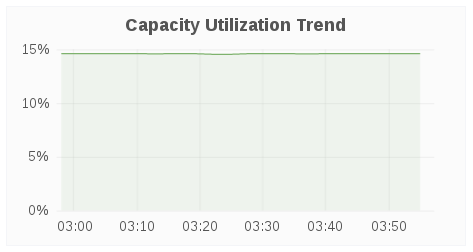
Capacity Utilization Trend
The Capacity Utilization Trend panel displays the volume capacity utilization over a period of time.
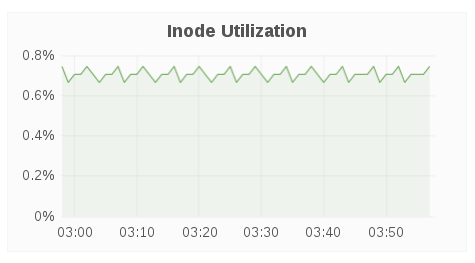
Inode Utilization
The Inode Utilization panel displays inodes used for bricks in the volume over a period of time.
Inode Available
The Inode Available panel displays inodes free for bricks in the volume.
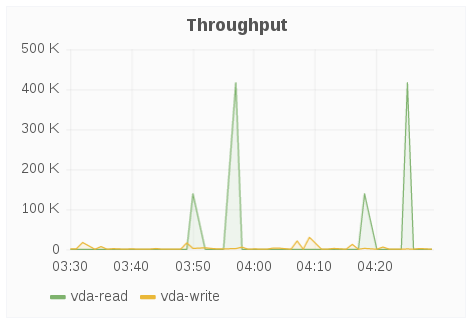
Throughput
The Throughput panel displays volume throughput based on brick-level read and write operations fetched using gluster volume profile.
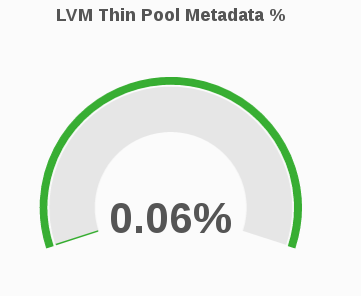
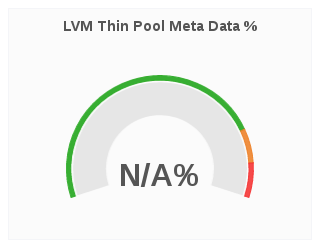
LVM Thin Pool Metadata %
The LVM Thin Pool Metadata % panel displays the utilization of LVM thin pool metadata for a given volume. Monitoring the utilization of LVM thin pool metadata and data usage is important to ensure they do not run out of space. If the data space is exhausted, I/O operations are either queued or failing based on the configuration. If metadata space is exhausted, you will observe error I/O’s until the LVM pool is taken offline and repair is performed to fix potential inconsistencies. Moreover, due to the metadata transaction being aborted and the pool doing caching there might be uncommitted (to disk) I/O operations that were acknowledged to the upper storage layers (file system) so those layers will need to have checks/repairs performed as well.
LVM Thin Pool Data Usage %
The LVM Thin Pool Data Usage % panel displays the LVM thin pool data usage for a given volume. Monitoring the utilization of LVM thin pool metadata and data usage is important to ensure they do not run out of space. If the data space is exhausted , I/O operations are either queued or failing based on the configuration. If metadata space is exhausted, you will observe error I/O’s until the LVM pool is taken offline and repair is performed to fix potential inconsistencies. Moreover, due to the metadata transaction being aborted and the pool doing caching there might be uncommitted (to disk) I/O operations that were acknowledged to the upper storage layers (file system) so those layers will need to have checks/repairs performed as well.

10.3.3. Monitoring File Operations
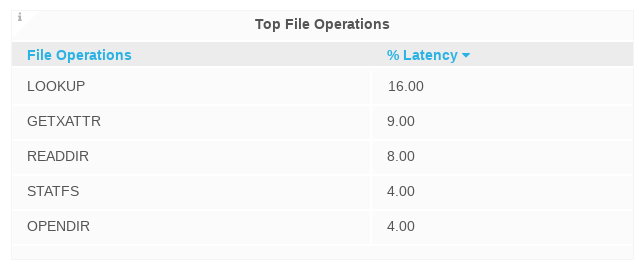
Top File Operations
The Top File Operations panel displays the top 5 FOP (file operations) with the highest % latency, wherein the % latency is the fraction of the FOP response time that is consumed by the FOP.
File Operations for Locks Trend
The File Operations for Locks Trend panel displays the average latency, maximum latency, call rate for each FOP for Locks over a period of time.
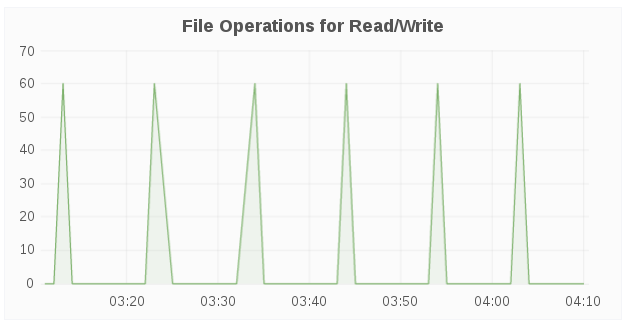
File Operations for Read/Write
The File Operations for Read/Write panel displays the average latency, maximum latency, call rate for each FOP for Read/Write Operations over a period of time.
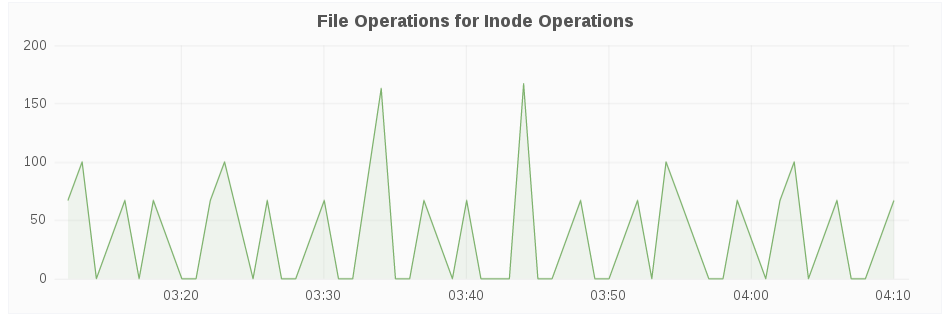
File Operations for Inode Operations
The File Operations for Inode Operations panel displays the average latency, maximum latency, call rate for each FOP for Inode Operations over a period of time.
File Operations for Entry Operations
The File Operations for Entry Operations panel displays the average latency, maximum latency, call rate for each FOP for Entry Operations over a period of time.

10.3.4. Volume Dashboard Metric Units
The following table shows the metrics and their corresponding measurement units.
| Metrics | Units |
|---|---|
| Capacity Utilization | Percentage % |
| Capacity Available | Megabyte/Gigabyte/Terabyte |
| Weekly Growth Rate | Megabyte/Gigabyte/Terabyte |
| Capacity Utilization Trend | Percentage % |
| Inode Utilization | Percentage % |
| Lvm Thin Pool Metadata | Percentage % |
| Lvm Thin Pool Data Usage | Percentage % |
| File Operations for Locks Trend | MB/GB/TB |
| File Operations for Read/Write | K |
| File Operations for Inode Operation Trend | K |
| File Operations for Entry Operations | K |
10.4. Brick Level Dashboard
10.4.1. Monitoring and Viewing Brick Status
The Status panel displays the status for a given brick.
10.4.2. Monitoring and Viewing Brick Performance
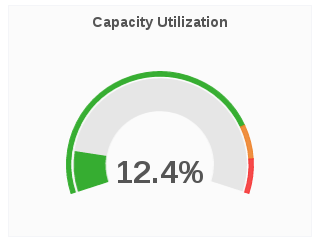
Capacity Utilization
The Capacity Utilization panel displays the percentage of capacity utilization for a given brick.
Capacity Available
The Capacity Available panel displays the available capacity for a given volume.
Capacity Utilization Trend
The Capacity Utilization Trend panel displays the brick capacity utilization over a period of time.
Weekly Growth Rate
The Weekly Growth Rate panel displays the forecasted weekly growth rate for capacity utilization computed based on daily capacity utilization.

Weeks Remaining
The Weeks Remaining panel displays the estimated time remaining in weeks till brick reaches full capacity based on the forecasted Weekly Growth Rate.
Healing
The Healing panel displays healing information for a given volume based on healinfo.

The Healing panel will not show any data for volumes without replica.
IOPS
The IOPS panel displays IOPS for a brick over a period of time. IOPS is based on brick level read and write operations.
LVM Thin Pool Metadata %
The LVM Thin Pool Metadata % panel displays the utilization of LVM thin pool metadata for a given brick. Monitoring the utilization of LVM thin pool metadata and data usage is important to ensure they don’t run out of space. If the data space is exhausted , I/O operations are either queued or failing based on the configuration. If metadata space is exhausted, you will observe error I/O’s until the LVM pool is taken offline and repair is performed to fix potential inconsistencies. Moreover, due to the metadata transaction being aborted and the pool doing caching there might be uncommitted (to disk) I/O operations that were acknowledged to the upper storage layers (file system) so those layers will need to have checks/repairs performed as well.
LVM Thin Pool Data Usage %
The LVM Thin Pool Data Usage % panel displays the LVM thin pool data usage for a given brick. Monitoring the utilization of LVM thin pool metadata and data usage is important to ensure they don’t run out of space. If the data space is exhausted , I/O operations are either queued or failing based on the configuration. If metadata space is exhausted, you will observe error I/O’s until the LVM pool is taken offline and repair is performed to fix potential inconsistencies. Moreover, due to the metadata transaction being aborted and the pool doing caching there might be uncommitted (to disk) I/O operations that were acknowledged to the upper storage layers (file system) so those layers will need to have repairs performed as well.
Throughput
The Throughput panel displays brick-level read and write operations fetched using “gluster volume profile.”
Latency
The Latency panel displays latency for a brick over a period of time. Latency is based on the average amount of time a brick spends doing a read or write operation.

10.4.3. Brick Dashboard Metric Units
The following table shows the metrics and their corresponding measurement units.
| Metrics | Units |
|---|---|
| Capacity Utilization | Percentage % |
| Capacity Available | Megabyte/Gigabyte/Terabyte |
| Weekly Growth Rate | Megabyte/Gigabyte/Terabyte |
| Capacity Utilization Trend | Percentage % |
| Inode Utilization | Percentage % |
| Lvm Thin Pool Metadata | Percentage % |
| Lvm Thin Pool Data Usage | Percentage % |
| Disk Throughput | Percentage % |