3. Monitoring Resources: Procedures
3.1. Viewing Monitoring Information
Copy linkLink copied to clipboard!
Every resource has a Monitoring tab which displays different charts, each displaying different information collected about the resource.
3.1.1. Metrics and Baseline Charts
Copy linkLink copied to clipboard!
The core of monitoring is the metric information that is collected for a resource. Each resource has different metrics (and these are listed in the Resource Reference: Monitoring, Operation, and Configuration Options). Three monitoring charts show the same information, but in different perspectives and different levels of detail:
- The resource-level Summary
- Graphs
- Tables
The Summary tab for resources, much like the Dashboard for the entire JBoss ON inventory, has portlets that show different resource information. Most resources have three portlets for measurements, events, and out-of-bound metrics. The Measurements portlet has small thumbnail charts that show the trend for the metric, along with the current reading.

Clicking any of the metrics will open the baseline chart for that metric. As is described in Section 2.2, “About Baseline Metrics”, baselines calculate an average reading for a given period of time, with the high and low measurements in that period creating upper and lower bounds. Baselines, by default, are calculated every three days using the data from the previous seven days for the calculation. Baseline measurements are essential for establishing operating norms so that administrators can effectively set alerts for resources.

The Graphs area in the Monitoring tab shows all of the metrics on line graphs, giving the trend for the past eight hours, and the time span is dynamically configurable. This provides more granular detail than the summary or baselines charts, showing the readings for each collection period and the precise readings.

The Tables chart has the same information as the metrics graphs, only it is displayed in text, with columns for the high, low, and current readings. There is also a column which shows the number of active alerts for each metric.

3.1.2. Trait Charts
Copy linkLink copied to clipboard!
The Traits tab simply shows a list of traits and values that have been detected for the resource. Traits are static, usually information like the software version number, the installation date, or the architecture or hardware settings. The traits that are collected are defined in the resource plug-in itself, so this information is viewable but not configurable through the UI. The list of traits for each resource type is covered in the Resource Reference: Monitoring, Operation, and Configuration Options.
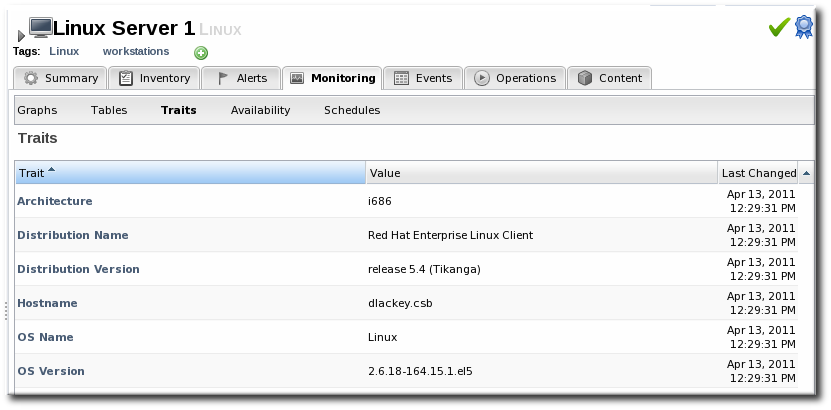
Figure 2. Trait Charts
3.1.3. Availability Charts
Copy linkLink copied to clipboard!
The Availability chart for a resource simply shows when that resource goes up and down. This includes timestamps of whenever the availability changes and total counts of how much time the resource spends in the up and down states.
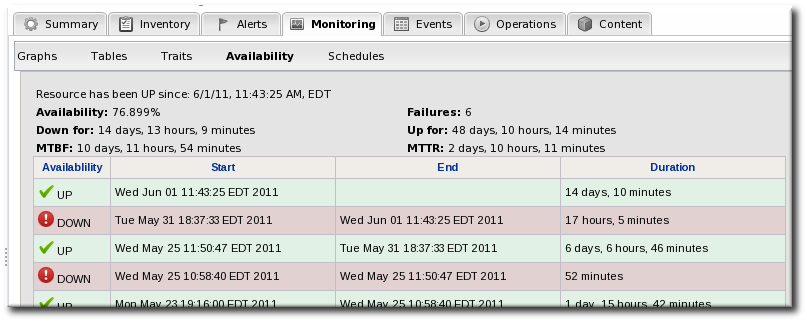
Figure 3. Availability Charts
3.1.4. Summary Timeline
Copy linkLink copied to clipboard!
The Timeline subtab in the Summary tab shows a line chart of all of the activity for the resource (with the exception of metrics collection, which is all under the Monitoring tab and charts). The Timeline aggregates all configuration changes, inventory changes, drift, events, content and bundle changes, operations, and alerts. Clicking any given point opens up the details for that specific action.
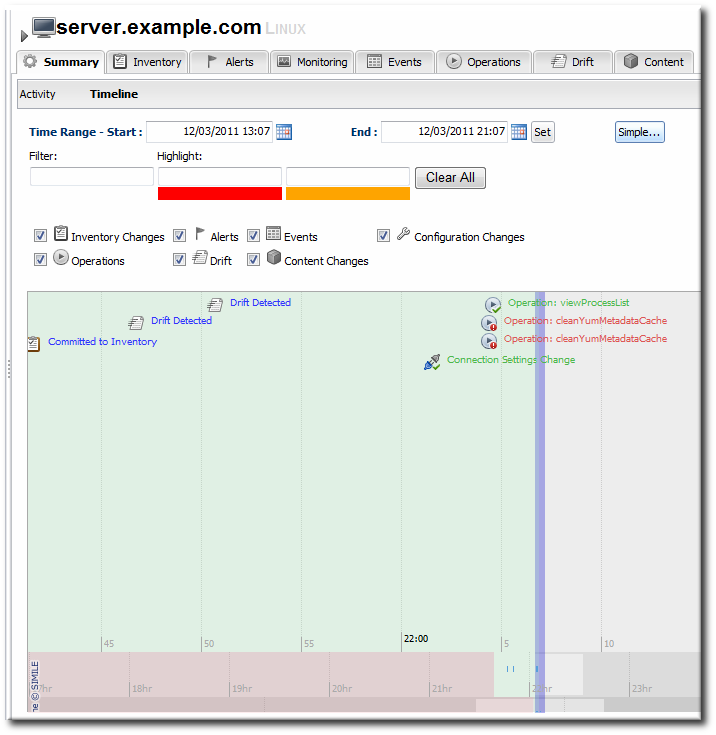
Figure 4. Summary Timeline
Because all information is on a single timeline, it becomes must easier to correlate incidents and events and to get a better understanding of the overall activity on that resource.
3.2. Adding Monitoring Metrics to the Dashboard
Copy linkLink copied to clipboard!
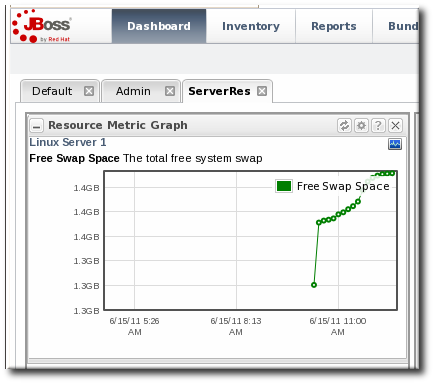
Charts for a specific metric for a resource can be added to the Dashboard. This makes it easier to see the current state of important readings for common or critical resources immediately, without having to configure alerts or check resource entries.
- Click the Inventory tab in the top menu.
- Select the resource type in the Resources menu table on the left, and then browse or search for the resource.

- In the resource hierarchy on the left, right-click the resource name.
- Scroll down to the menu item, select the metric from the list, and then select the dashboard to add the chart to.

A chart for that specific metric on that specific resource is automatically added to the Dashboard that was selected.
3.3. Configuring Monitoring Settings
Copy linkLink copied to clipboard!
3.3.1. Setting Baseline Calculation Properties
Copy linkLink copied to clipboard!
The monitoring baselines have two configuration properties that define how the automatic metric baselines are calculated. These properties don't set the value; they set the window of time used for the baseline averages.
- In the System Configuration menu, select the item.

- Scroll to the Automatic Baseline Configuration Properties section.
- Change the settings to define the window used for calculation.

- Baseline Frequency sets the interval, in days, for how often baselines are recalculated. The default is three days.
- Baseline Dataset sets the time interval, in days, used to calculate the baseline. The default is seven days.
3.3.2. Recalculating Baseline Values
Copy linkLink copied to clipboard!
Baselines measure the average operating value of metrics. JBoss ON also collects the highest and lowest recorded readings to set a normal operating range. Comparing live metrics with pre-calculated baselines makes it possible to detect when resources are running outside of expected ranges. JBoss ON automatically calculates baselines; however, they can be recalculated for specific time periods or simply if the load has changed and new baselines are required.
- Click the Inventory tab in the top menu.
- Select the resource type in the Resources menu table on the left, and then browse or search for the resource.
- In the summary tab, click the name of the metric to recalculate.
- Scroll to the bottom of the baseline chart, to the Metric Baseline & Expected Range area.
- Click the Change Value link next to the baseline figure.

- A new baseline is calculated using the baseline dataset property from the configuration properties, starting from the current time. Accept the new baseline value by clicking Save Value.

3.3.3. Setting Collection Intervals for a Specific Resource
Copy linkLink copied to clipboard!
Metrics are collected at the intervals specified by the collection schedule. Because not all metrics are mission critical or even likely to change, JBoss ON has different collection schedules for different metrics, with critical metrics collected more frequently.
For most environments, setting a daily collection schedule (once every 24 hours) is sufficient.
To change the collection interval for a specific metric:
- Click the Inventory tab in the top menu.
- Select the resource type in the Resources menu table on the left, and then browse or search for the resource.
- Click the Monitoring tab on the resource entry.
- Click the Schedules subtab.
- Select the the metric for which to change the monitoring frequency. Multiple metrics can be selected, if they will all be changed to the same frequency.

- Enter the desired collection period in the Collection Interval field, with the appropriate time unit (seconds, minutes, or hours).
- Click Set.
3.3.4. Enabling and Disabling Metrics for a Specific Resource
Copy linkLink copied to clipboard!
- Click the Inventory tab in the top menu.
- Select the resource type in the Resources menu table on the left, and then browse or search for the resource.
- Click the Monitoring tab on the resource entry.
- Click the Schedules sub tab.
- Select the metrics to enable or disable.

- Click the Enable or Disable button.
3.3.5. Changing Monitoring Default Templates
Copy linkLink copied to clipboard!
The metrics which are collected for a resource type are defined in the monitoring template for the resource type. Each resource type has some metrics disabled by default, and these must be manually enabled. Likewise, metrics which are enabled by default can be disabled.
- In the top navigation, open the Administration menu, and then the System Configuration menu.

- Select the Metric Collection Templates menu item. This opens a long list of resource types, both for platforms and server types.
- Locate the type of resource for which to create the template definition.

- Click the pencil icon to edit the metric collection schedule templates.
- Select the required metrics to enable or disable, and click the or button.
- To edit the frequency that a metric is collected, select the Update schedules for existing resources of marked type checkbox, and then enter the desired time frame into the Collection Interval for Selected: field.

3.3.6. Changing the Resource Availability Scan Period
Copy linkLink copied to clipboard!
JBoss ON periodically checks each resource's availability, which simply means whether the resource is available and running. After this scan by the agent, it sends the result to the server.
Note
The default scan interval is five minutes (300 seconds).
Since availability is processed on the server, large environments with hundreds of agents and tens of thousands of resources can stress the server and hurt performance. In that case, the default scan interval may be too short, and setting a longer scan interval will improve server performance. For smaller environments, this scan period can be too long.
The interval is configurable in the agent settings file.
- Open the agent configuration file.
vim agentRoot/rhq-agent/conf/agent-configuration.xml - Uncomment the lines in the XML file, and set the new scan time (in seconds). Do not enter a value lower than 60 seconds or the load on the agent, server, and resource will be too high and will hurt performance.
<entry key="rhq.agent.plugins.availability-scan.period-secs" value="120"/> - Restart the agent to load the new value. Use the
--cleanconfigoption to force the agent to read the new configuration from the configuration file.
3.4. Resources Which Require Special Configuration for Monitoring
Copy linkLink copied to clipboard!
Some resources have to have specific configuration to be detected by JBoss ON discovery or to allow JBoss ON enough access to perform the full range of management.
3.4.1. Configuring Tomcat/EWS Servers for Monitoring
Copy linkLink copied to clipboard!
For instructions on setting up Tomcat or Red Hat JBoss Web Server (JWS) for monitoring with JBoss Operations Network, see the JBoss Web Server Installation Guide chapter on Monitoring Red Hat JBoss Web Server with JBoss ON
Note
For more information on configuring Tomcat, see the Tomcat documentation.
3.4.2. Configuring the Apache SNMP Module
Copy linkLink copied to clipboard!
To discover an Apache server's virtual hosts and collect metrics for them, the SNMP module must be configured on that Apache server.
Apache 2.0 and 2.2 are supported on Red Hat Enterprise Linux. Only Apache 2.0 is supported on Windows.
Important
To use the Response Time module, the Apache server needs to have been compiled with shared object support. For Red Hat Enterprise Linux systems and EWS servers, this is enabled by default.
To verify that the Apache server was compiled with shared object support, use the
apachectl -l command to list the compiled modules and look for the mod_so.c module:
[root@server ~]# apachectl -l
Compiled in modules:
  core.c
  prefork.c
  http_core.c
  mod_so.c
When compiling Apache from source, on 2.0.x versions, use the
--enable-so option:
$ ./configure --enable-so
$ make install
For Apache 2.2.x versions, use the
--enable-module=so option:
$ ./configure --enable-module=so
$ make install- Download the Apache binaries from the JBoss ON UI.
- Log into the JBoss ON UI.
https://server.example.com:7080 - Click the Administration tab in the top menu.
- In the Configuration menu box on the left, select the item.
- Scroll to Connector Downloads, and click the
connector-apache.ziplink to download the Apache connectors.
- Unzip the Apache connectors in a directory that is accessible to the JBoss ON agent.
unzip connector-apache.zip - Each Apache version and platform has its own package that contains the Apache-SNMP connectors. Unzip the Apache connectors in a directory that is accessible to the JBoss ON agent. Binaries are available for Red Hat Enterprise Linux 32-bit and 64-bit and Windows.For example, on Red Hat Enterprise Linux 32-bit:
cd apacheModuleRoot/apache-snmp/binaries/
tar xjvf snmp_module-x86-linux-apache#.tar.bz2
# is the Apache server version number.Note
Apache connectors can be compiled for other platforms, like Solaris, from the source files inapacheRoot/apache-snmp/binaries/sources. For example:cd JON_AGENT_INSTALL_DIR/product_connectors/apache-snmp/sources ./build_apache_snmp.sh APACHE_VERSION APACHE_2.x_INSTALL_DIR/bin/apxs(To compile the Apache-SNMP connector,apxs,perl,make, andautomakemust all be installed and in userPATH.) - Install the module.For example, on Red Hat Enterprise Linux:
# cd apacheModuleRoot/apache-snmp/binaries/snmp_module_#

# cp module/* apache_install_directory/modules

# cp conf/* apache_install_directory/conf

# mkdir apache_install_directory/var
On Windows:> xcopy /e JON_AGENT_INSTALL_DIR\product_connectors\apache-snmp\binaries\x86-winnt-apache2.0\* APACHE_2.0_INSTALL_DIR - Open the
httpd.conffile for editing. For example, on Red Hat Enterprise Linux:vim apache_install_directory/conf/httpd.conf - Enable the module by adding these lines to the
httpd.confon both Red Hat Enterprise Linux and Windows:LoadModule snmpcommon_module modules/snmpcommon.so LoadModule snmpagt_module modules/snmpmonagt.so SNMPConf conf SNMPVar var - Make sure the main Apache configuration section, as well as each
<VirtualHost>configuration block, contains aServerNamedirective with a port. The SNMP module uses this directive to uniquely identify the main server and each virtual host, so eachServerNamedirective must contain a unique value. For example:ServerName main.example.com:80 ... <VirtualHost vhost1.example.com:80> ServerName vhost1.example.com:80 ... </VirtualHost> - If there is more than one Apache instance on the same machine, it is possible to use different SNMP files for each instance.
- Each Apache instance has its own
httpd.conffile. Set theSNMPConfdirectory in each file to its own SNMP configuration directory. For example, for instance1:vim instance1-httpd.conf SNMPConf /opt/apache-instance1/confThen, for instance2:vim instance2-httpd.conf SNMPConf /opt/apache-instance2/confEachsnmpd.conffile should be in the specified directory. - Edit the
agentaddressproperty in apache_install_directory/conf/snmpd.confso that each instance has a different value agent address and port, so there is no conflict between instances.See the snmpd.conf documentation for a description of this property's syntax.
- Restart the Apache server. For example:
apache_installation_dir/bin/Apache -k restart - Verify that the SNMP module was properly installed. If the module is loaded, then there will be lines referencing the SNMP module in the errors log:
grep SNMP apache_installation_dir/logs/error_log

[Wed Mar 19 09:54:34 2008] [notice] Apache/2.0.63 (Unix) CovalentSNMP/2.3.0 configured -- resuming normal operations
[Wed Mar 19 09:54:35 2008] [notice] SNMP: CovalentSNMP/2.3.0 started (user '1000' - SNMP address '1610' - pid '26738')
3.4.3. Metrics Collection Considerations with Apache and SNMP
Copy linkLink copied to clipboard!
Three metrics show values of zero when monitoring an Apache instance with the SNMP module:
- Bytes received for GET requests per minute
- Bytes received for POST requests per minute
- Total number of bytes received per minute
This is because of how SNMP interprets information from the request body. First, SNMP provides various length values for the request body and a GET request does not have a body, so GET responses are not calculated and, therefore, have a value of zero. Second, Apache does not calculate a request body size if there is request chunking.
3.5. Configuring Response Time Filters for Monitoring Web Servers
Copy linkLink copied to clipboard!
JBoss Operations Network supplies an extra, optional monitoring setting called response time filters which measures the performance of web servers by measuring the amount of time it takes for a URL to respond to a request. JBoss ON supports monitoring for Apache web servers and Tomcat servers (both standalone and embedded in applications like JBoss AS).
3.5.1. Configuring Apache Servers for Response Time Metrics
Copy linkLink copied to clipboard!
- To use the Response Time module, the Apache server needs to have been compiled with shared object support. For Red Hat Enterprise Linux systems and EWS servers, this is enabled by default.To verify that the Apache server was compiled with shared object support, use the
apachectl -lcommand to list the compiled modules and look for themod_so.cmodule:[root@server ~]# apachectl -l Compiled in modules: core.c prefork.c http_core.c mod_so.cWhen compiling Apache from source, on 2.0.x versions, use the--enable-sooption:$ ./configure --enable-so $ make installFor Apache 2.2.x versions, use the--enable-module=sooption:$ ./configure --enable-module=so $ make install - Download the Apache binaries from the JBoss ON UI.
- Log into the JBoss ON UI.
https://server.example.com:7080 - Click the Administration tab in the top menu.
- In the Configuration menu box on the left, select the item.
- Unzip the Apache connectors.
unzip connector-apache.zip - Compile the Response Time module.
Note
apxsmust be installed, andmakemust be installed and in the user PATH.cd apacheMOduleRoot/apache-rt/sources chmod +x build_apache_module.sh ./build_apache_module.sh 2.x apache_install_directory/bin/apxs - Then, install the Response Time module on the Apache server. On Red Hat Enterprise Linux:
cp apache2.x/.libs/mod_rt.so apache_install_directory/modulesFor Solaris:cp apache2.x/.libs/mod_rt.so APACHE_2.x_INSTALL_DIR/modulesFor Windows:xcopy /e JON_AGENT_INSTALL_DIR\product_connectors\apache-rt\binaries \x86-winnt-apache2.0\* apache_install_directory - Open the
httpd.conffile. For example, on Red Hat Enterprise Linux:vim apache_install_directory/conf/httpd.conf - Enable the module in the Apache's
httpd.conffile by appending this line to the end of the file:LoadModule rt_module modules/mod_rt.so LogFormat "%S" rt_logWhen setting the log format, the variable%Shas a capital S. - To configure response time logging for the main Apache server, add the following line at the top level of the file:
CustomLog logs/myhost.com80_rt.log rt_logTo configure response time logging for a virtual host, add the following line somewhere within the<VirtualHost>block:CustomLog logs/myhost.com8080_rt.log rt_logMake sure the response time log file name is different for the main server and each virtual host. Consider using the the host and port from theServerNamedirective be used to form the file name, such as host_port_rt.log. - Restart the Apache server:
apache_install_directory/bin/apachectl restart - To confirm that the Response Time module was installed successfully, check that the response time log files configured via the CustomLog directive now exist.
- Restart the Apache server.
3.5.2. Configuring Response Time Filters for Tomcat
Copy linkLink copied to clipboard!
- Download the Response Time packages for Tomcat from the JBoss ON UI.
- Click the Administration tab in the top menu.
- In the Configuration menu box on the left, select the item.
- Unzip the Response Time connectors.
unzip connector-rtfilter.zipThe package contains two JAR files,commons-logging-version.jarandrhq-rtfilter-version.jar. Tomcat 5 servers use only thecommons-logging-version.jarfile, while Tomcat 6 servers require both files. - Copy the appropriate JAR files into the Tomcat configuration directory. The directory location depends on the Tomcat or JBoss instance (for embedded Tomcat) being modified.For example, on a standalone Tomcat 5.5:
cp commons-logging-version.jar /var/lib/tomcat5/server/lib/On Tomcat 6:cp rhq-rtfilter-version.jar /var/lib/tomcat6/lib/ cp commons-logging-version.jar /var/lib/tomcat6/lib/For example, on an embedded Tomcat instance:cp rhq-rtfilter-version.jar JBoss_install_dir/server/default/deploy/jboss-web.deployer/ cp commons-logging-version.jar JBoss_install_dir/server/default/deploy/jboss-web.deployer/ - Open the
web.xmlfile to add the filter definition. The exact location of the file depends on the server instance and whether it is a standalone or embedded server; several common locations are listed in Table 1, “web.xml Configuration File Locations”. - Add either a
<filter>or a<filter-mapping>entry to configuration the Response Time filter in the Tomcat server. Either a<filter>or a<filter-mapping>entry can be used, but not both.The most basic filter definition references simply the Response Time filter name and class in the<filter>element. This loads the response time filter with all of the default settings.<filter> <filter-name>RhqRtFilter </filter-name> <filter-class>org.rhq.helpers.rtfilter.filter.RtFilter </filter-class> </filter>The filter definition can be expanded with user-defined configuration values by adding<init-paramelements. This loads the response time filter with all of the default settings.<filter> <filter-name>RhqRtFilter </filter-name> <filter-class>org.rhq.helpers.rtfilter.filter.RtFilter </filter-class> <init-param> <description>Name of vhost mapping file. This properties file must be in the Tomcat process classpath.</description> <param-name>vHostMappingFile</param-name> <param-value>vhost-mappings.properties</param-value> </init-param> ... </filter>The available parameters are listed in Table 2, “Parameters Available for User-Defined <filter> Settings”.Alternatively, set a<filter-map>entry which gives the name of the response time filter and pattern to use to match the URL which will be monitored.<filter-mapping> <filter-name>RhqRtFilter </filter-name> <url-pattern>/* </url-pattern> </filter-mapping>Note
Put the Response Time filter in front of any other configured filter so that the response time metrics will include all of the other response times, total, in the measurement. - Restart the Tomcat instance to load the new configuration.
| Tomcat Version | Embedded Server Type | File Location |
|---|---|---|
| Tomcat 6 | Standalone Server | /var/lib/tomcat6/webapps/project/WEB-INF/web.xml |
| Tomcat 5 | Standalone Server | /var/lib/tomcat5/webapps/project/WEB-INF/web.xml |
| Tomcat 6 | EAP 5 EAP 5.0.0 | JBOSS_HOME/server/config/deployers/jbossweb.deployer/web.xml |
| Tomcat 6 | JBoss 4.2, JBoss EAP4 | JBOSS_HOME/server/config/deploy/jboss-web.deployer/conf/web.xml |
| Tomcat 5.5 | JBoss 4.0.2 | JBOSS_HOME/server/config/deploy/jbossweb-tomcat55.sar/conf/web.xml |
| Tomcat 5.0 | JBoss 3.2.6 | JBOSS_HOME/server/config/deploy/jbossweb-tomcat50.sar/conf/web.xml |
| Tomcat 4.1 | JBoss 3.2.3 | JBOSS_HOME/server/config/deploy/jbossweb-tomcat41.sar/web.xml |
|
Parameter
|
Description
|
|---|---|
|
chopQueryString
|
Only the URI part of a query will be logged if this parameter is set to true. Otherwise the whole query line will be logged. Default is true.
|
|
logDirectory
|
The directory where the log files will be written to. Default setting is {
jboss.server.log.dir}/rt/ (usually server/xxx/log/rt). If this property is not defined, the fallback is {java.io.tmpdir}/rt/ (/tmp/ on UNIX®, and ~/Application Data/Local Settings/Temp – check the TEMP environment variable) is used. If you specify this init parameter, no directory rt/ will be created, but the directory you have provided will be taken literally.
|
|
logFilePrefix
|
A prefix that is put in front of the log file names. Default is the empty string.
|
|
dontLogRegEx
|
A regular expression that is applied to query strings. See java.util.regex.Pattern. If the parameter is not given or an empty string, no pattern is applied.
|
|
matchOnUriOnly
|
Should the dontLogRegEx be applied to the URI part of the query (true) or to the whole query string (false). Default is true.
|
|
timeBetweenFlushesInSec
|
Log lines are buffered by default. When the given number of seconds have passed and a new request is received, the buffered lines will be flushed to disk even if the number of lines to flush after (see next point) is not yet reached.. Default value is 60 seconds (1 Minute).
|
|
flushAfterLines
|
Log lines are buffered by default. When the given number of lines have been buffered, they are flushed to disk. Default value is 10 lines.
|
|
maxLogFileSize
|
The maximum allowed size, in bytes, of the log files; if a log file exceeds this limit, the filter will truncate it; the default value is 5242880 (5 MB).
|
|
vHostMappingFile
|
This properties file must exist on the Tomcat process classpath. For example, in the ../conf/vhost-mappings.properties. The file contains mappings from the 'incoming' vhost (server name) to the vhost that should be used as the prefix in the response time log file name. If no mapping is present (no file or no entry response times are set), then the incoming vhost (server name) is used. For example:
The first mapping states that if the incoming vhost is 'host1.users.acme.com', then the log file name should get a vhost of 'host1' as prefix, separated by a _ from the context root portion. The second mapping states that if the 'incoming' vhost is 'host1', then no prefix, and no _, should be used. The third mapping uses a special left-hand-side token, '%HOST%'. This mapping states that if the 'incoming' vhost is a representation of localhost then no prefix, and no _ , should be used.
%HOST% will match the host name, or canonical host name or IP address, as returned by the implementation of InetAddress.getLocalHost().
The second and third mappings are examples of empty right hand side, but could just as well have provided a vhost.
This is a one time replacement. There is no recursion in the form that the result of the first line would then be applied to the second one.
|
3.6. Configuring How Long Monitoring Data Are Stored
Copy linkLink copied to clipboard!
JBoss ON monitoring information reveals both current measurements and historical trends and averages. JBoss ON stores data in a kind of cascade, where raw data are aggregated and compressed on a schedule. This preserves the trends of data without inflating the size of the monitoring data. Raw monitoring data are handled like this:
- Raw metrics are collected every few minutes and are aggregated in a rolling average in one-hour windows to produce minimum, average and maximum values.
- One-hour values are combined and averaged in six-hour periods.
- Six-hour periods are combined and aggregated into 24-hour (1 day) windows.
The raw measurements, six-hour periods, and 24-hour periods are preserved in the JBoss ON database for a configurable amount of time, ranging from one week for raw measurements to one year for 24-hour aggregates.
To change the amount of time that monitoring data are stored:
- In the System Configuration menu, select the item.
- Scroll to the Data Manager Configuration Properties section.
- Change the storage times for the different types of monitoring data.
 There are four settings that relate directly to storing monitoring data:
- Response time data for web servers and EJB resources. This is kept for one month (31 days) by default.
- Events information, meaning all of the log files generated by the agent for the resource. The default storage time for event logs is two weeks.
- All measurement data, both metrics and traits. The default time is one year (365 days).
- Availability information. The default time is one year (365 days).