Chapter 2. Working with Red Hat OpenShift Pipelines in the web console
You can use the Administrator or Developer perspective to create and modify Pipeline, PipelineRun, and Repository objects from the Pipelines page in the OpenShift Container Platform web console. You can also use the +Add page in the Developer perspective of the web console to create CI/CD pipelines for your software delivery process.
2.1. Working with Red Hat OpenShift Pipelines in the Developer perspective
In the Developer perspective, you can access the following options for creating pipelines from the +Add page:
-
Use the +Add
Pipelines Pipeline builder option to create customized pipelines for your application. -
Use the +Add
From Git option to create pipelines using pipeline templates and resources while creating an application.
After you create the pipelines for your application, you can view and visually interact with the deployed pipelines in the Pipelines view. You can also use the Topology view to interact with the pipelines created using the From Git option. You must apply custom labels to pipelines created using the Pipeline builder to see them in the Topology view.
Prerequisites
- You have access to an OpenShift Container Platform cluster and have switched to the Developer perspective.
- You have the OpenShift Pipelines Operator installed in your cluster.
- You are a cluster administrator or a user with create and edit permissions.
- You have created a project.
2.1.1. Constructing pipelines using the Pipeline builder
In the Developer perspective of the console, you can use the +Add
- Configure pipelines using either the Pipeline builder or the YAML view.
- Construct a pipeline flow using existing tasks and cluster tasks. When you install the OpenShift Pipelines Operator, it adds reusable pipeline cluster tasks to your cluster.
In Red Hat OpenShift Pipelines 1.10, ClusterTask functionality is deprecated and is planned to be removed in a future release.
- Specify the type of resources required for the pipeline run, and if required, add additional parameters to the pipeline.
- Reference these pipeline resources in each of the tasks in the pipeline as input and output resources.
- If required, reference any additional parameters added to the pipeline in the task. The parameters for a task are prepopulated based on the specifications of the task.
- Use the Operator-installed, reusable snippets and samples to create detailed pipelines.
- Search and add tasks from your configured local Tekton Hub instance.
In the developer perspective, you can create a customized pipeline using your own set of curated tasks. To search, install, and upgrade your tasks directly from the developer console, your cluster administrator needs to install and deploy a local Tekton Hub instance and link that hub to the OpenShift Container Platform cluster. For more details, see Using Tekton Hub with OpenShift Pipelines in the Additional resources section. If you do not deploy any local Tekton Hub instance, by default, you can only access the cluster tasks, namespace tasks and public Tekton Hub tasks.
Procedure
- In the +Add view of the Developer perspective, click the Pipeline tile to see the Pipeline builder page.
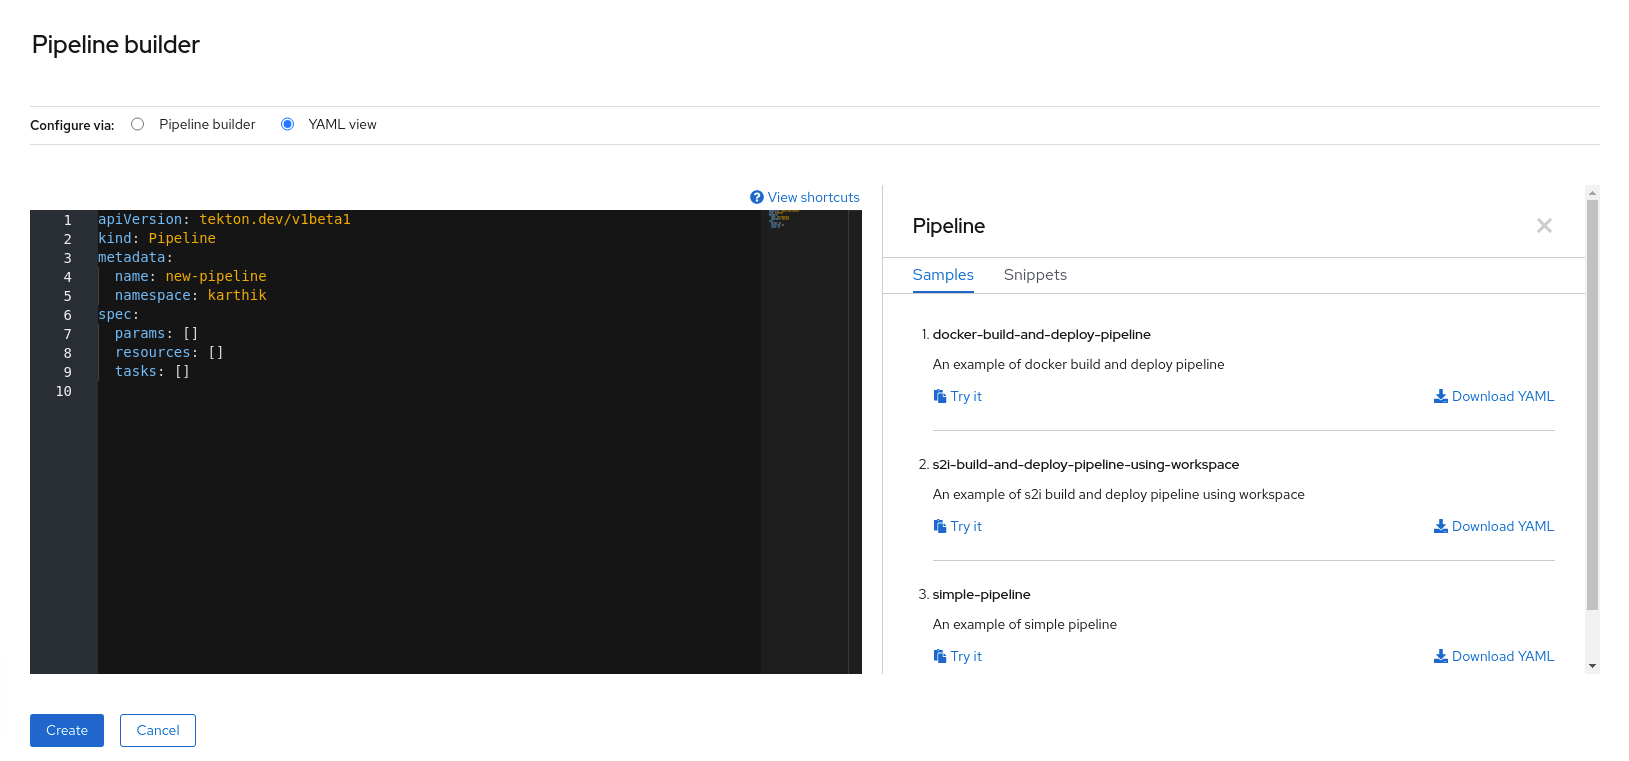
Configure the pipeline using either the Pipeline builder view or the YAML view.
NoteThe Pipeline builder view supports a limited number of fields whereas the YAML view supports all available fields. Optionally, you can also use the Operator-installed, reusable snippets and samples to create detailed pipelines.
Figure 2.1. YAML view
Configure your pipeline by using Pipeline builder:
- In the Name field, enter a unique name for the pipeline.
In the Tasks section:
- Click Add task.
- Search for a task using the quick search field and select the required task from the displayed list.
Click Add or Install and add. In this example, use the s2i-nodejs task.
NoteThe search list contains all the Tekton Hub tasks and tasks available in the cluster. Also, if a task is already installed it will show Add to add the task whereas it will show Install and add to install and add the task. It will show Update and add when you add the same task with an updated version.
To add sequential tasks to the pipeline:
-
Click the plus icon to the right or left of the task
click Add task. - Search for a task using the quick search field and select the required task from the displayed list.
Click Add or Install and add.
Figure 2.2. Pipeline builder

-
Click the plus icon to the right or left of the task
To add a final task:
-
Click the Add finally task
Click Add task. - Search for a task using the quick search field and select the required task from the displayed list.
- Click Add or Install and add.
-
Click the Add finally task
In the Resources section, click Add Resources to specify the name and type of resources for the pipeline run. These resources are then used by the tasks in the pipeline as inputs and outputs. For this example:
-
Add an input resource. In the Name field, enter
Source, and then from the Resource Type drop-down list, select Git. Add an output resource. In the Name field, enter
Img, and then from the Resource Type drop-down list, select Image.NoteA red icon appears next to the task if a resource is missing.
-
Add an input resource. In the Name field, enter
- Optional: The Parameters for a task are pre-populated based on the specifications of the task. If required, use the Add Parameters link in the Parameters section to add additional parameters.
- In the Workspaces section, click Add workspace and enter a unique workspace name in the Name field. You can add multiple workspaces to the pipeline.
In the Tasks section, click the s2i-nodejs task to see the side panel with details for the task. In the task side panel, specify the resources and parameters for the s2i-nodejs task:
- If required, in the Parameters section, add more parameters to the default ones, by using the $(params.<param-name>) syntax.
-
In the Image section, enter
Imgas specified in the Resources section. - Select a workspace from the source drop-down under Workspaces section.
- Add resources, parameters, and workspaces to the openshift-client task.
- Click Create to create and view the pipeline in the Pipeline Details page.
- Click the Actions drop-down menu then click Start, to see the Start Pipeline page.
- The Workspaces section lists the workspaces you created earlier. Use the respective drop-down to specify the volume source for your workspace. You have the following options: Empty Directory, Config Map, Secret, PersistentVolumeClaim, or VolumeClaimTemplate.
2.1.2. Creating OpenShift Pipelines along with applications
To create pipelines along with applications, use the From Git option in the Add+ view of the Developer perspective. You can view all of your available pipelines and select the pipelines you want to use to create applications while importing your code or deploying an image.
The Tekton Hub Integration is enabled by default and you can see tasks from the Tekton Hub that are supported by your cluster. Administrators can opt out of the Tekton Hub Integration and the Tekton Hub tasks will no longer be displayed. You can also check whether a webhook URL exists for a generated pipeline. Default webhooks are added for the pipelines that are created using the +Add flow and the URL is visible in the side panel of the selected resources in the Topology view.
2.1.3. Adding a GitHub repository containing pipelines
In the Developer perspective, you can add your GitHub repository containing pipelines to the OpenShift Container Platform cluster. This allows you to run pipelines and tasks from your GitHub repository on the cluster when relevant Git events, such as push or pull requests, are triggered.
You can add both public and private GitHub repositories.
Prerequisites
- Ensure that your cluster administrator has configured the required GitHub applications in the administrator perspective.
Procedure
- In the Developer perspective, choose the namespace or project in which you want to add your GitHub repository.
- Navigate to Pipelines using the left navigation pane.
-
Click Create
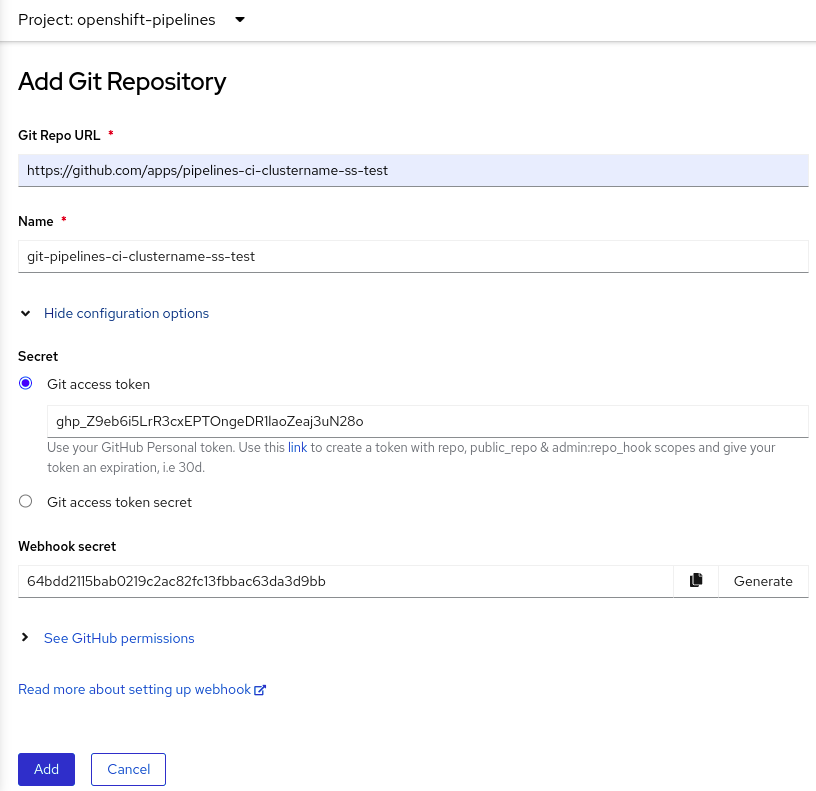
Repository on the right side of the Pipelines page. - Enter your Git Repo URL and the console automatically fetches the repository name.
Click Show configuration options. By default, you see only one option Setup a webhook. If you have a GitHub application configured, you see two options:
- Use GitHub App: Select this option to install your GitHub application in your repository.
- Setup a webhook: Select this option to add a webhook to your GitHub application.
Set up a webhook using one of the following options in the Secret section:
Setup a webhook using Git access token:
- Enter your personal access token.
Click Generate corresponding to the Webhook secret field to generate a new webhook secret.
 Note
NoteYou can click the link below the Git access token field if you do not have a personal access token and want to create a new one.
Setup a webhook using Git access token secret:
Select a secret in your namespace from the dropdown list. Depending on the secret you selected, a webhook secret is automatically generated.

Add the webhook secret details to your GitHub repository:
- Copy the webhook URL and navigate to your GitHub repository settings.
-
Click Webhooks
Add webhook. - Copy the Webhook URL from the developer console and paste it in the Payload URL field of the GitHub repository settings.
- Select the Content type.
- Copy the Webhook secret from the developer console and paste it in the Secret field of the GitHub repository settings.
- Select one of the SSL verification options.
- Select the events to trigger this webhook.
- Click Add webhook.
- Navigate back to the developer console and click Add.
- Read the details of the steps that you have to perform and click Close.
- View the details of the repository you just created.
When importing an application using Import from Git and the Git repository has a .tekton directory, you can configure pipelines-as-code for your application.
2.1.4. Interacting with pipelines using the Developer perspective
The Pipelines view in the Developer perspective lists all the pipelines in a project, along with the following details:
- The namespace in which the pipeline was created
- The last pipeline run
- The status of the tasks in the pipeline run
- The status of the pipeline run
- The creation time of the last pipeline run
Procedure
- In the Pipelines view of the Developer perspective, select a project from the Project drop-down list to see the pipelines in that project.
Click the required pipeline to see the Pipeline details page.
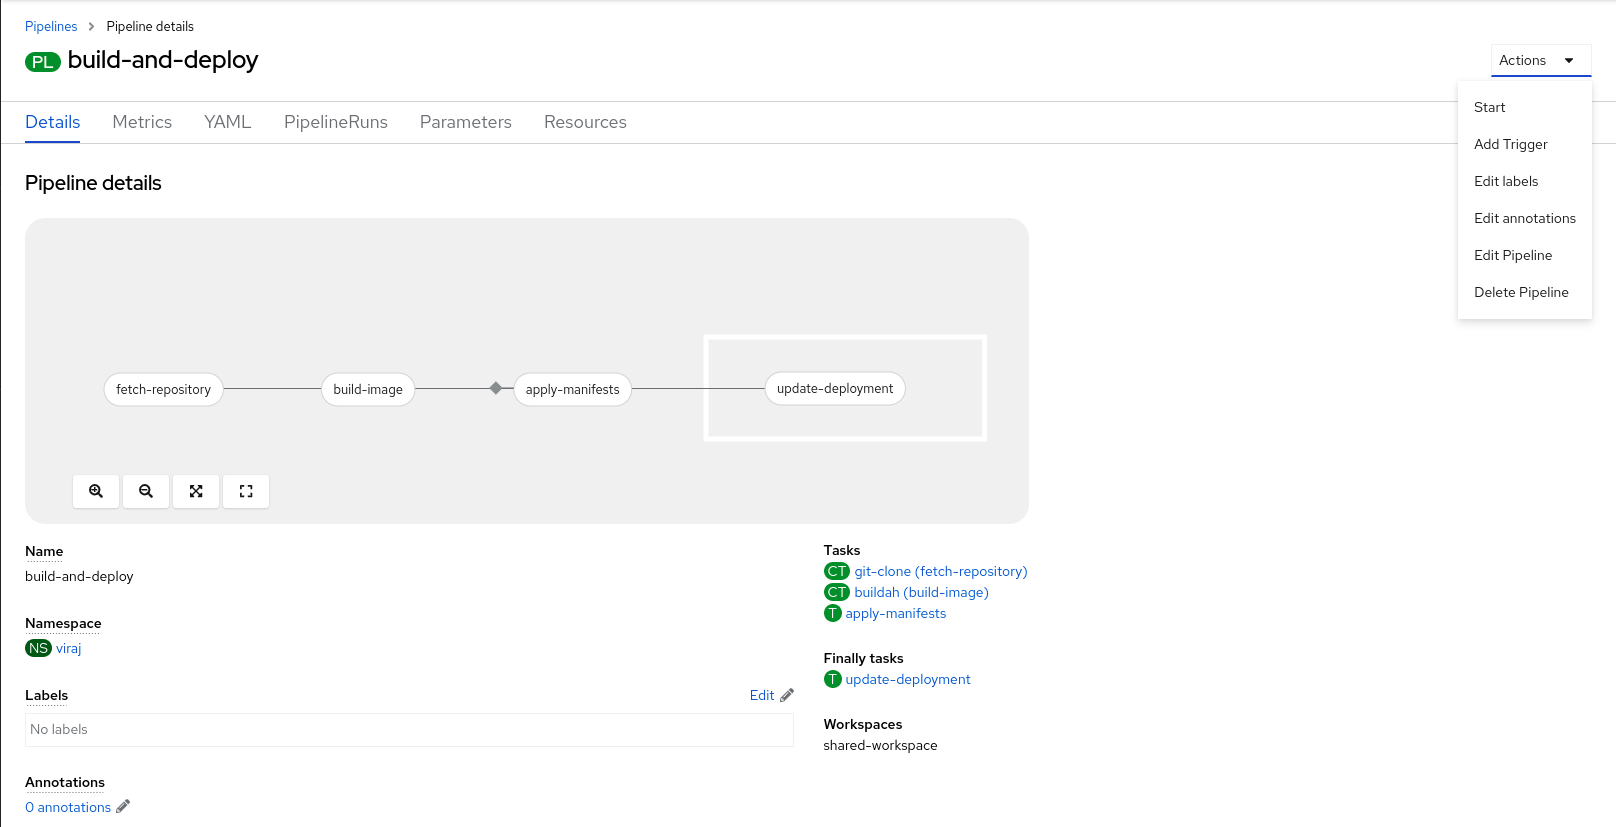
By default, the Details tab displays a visual representation of all the
serialtasks,paralleltasks,finallytasks, andwhenexpressions in the pipeline. The tasks and thefinallytasks are listed in the lower right portion of the page.To view the task details, click the listed Tasks and Finally tasks. In addition, you can do the following:
- Use the zoom in, zoom out, fit to screen, and reset view features using the standard icons displayed in the lower left corner of the Pipeline details visualization.
- Change the zoom factor of the pipeline visualization using the mouse wheel.
Hover over the tasks and see the task details.
Figure 2.3. Pipeline details
Optional: On the Pipeline details page, click the Metrics tab to see the following information about pipelines:
- Pipeline Success Ratio
- Number of Pipeline Runs
- Pipeline Run Duration
Task Run Duration
You can use this information to improve the pipeline workflow and eliminate issues early in the pipeline lifecycle.
- Optional: Click the YAML tab to edit the YAML file for the pipeline.
Optional: Click the Pipeline Runs tab to see the completed, running, or failed runs for the pipeline.
The Pipeline Runs tab provides details about the pipeline run, the status of the task, and a link to debug failed pipeline runs. Use the Options menu
 to stop a running pipeline, to rerun a pipeline using the same parameters and resources as that of the previous pipeline execution, or to delete a pipeline run.
Click the required pipeline run to see the Pipeline Run details page. By default, the Details tab displays a visual representation of all the serial tasks, parallel tasks,
finallytasks, and when expressions in the pipeline run. The results for successful runs are displayed under the Pipeline Run results pane at the bottom of the page. Additionally, you would only be able to see tasks from Tekton Hub which are supported by the cluster. While looking at a task, you can click the link beside it to jump to the task documentation.NoteThe Details section of the Pipeline Run Details page displays a Log Snippet of the failed pipeline run. Log Snippet provides a general error message and a snippet of the log. A link to the Logs section provides quick access to the details about the failed run.
On the Pipeline Run details page, click the Task Runs tab to see the completed, running, and failed runs for the task.
The Task Runs tab provides information about the task run along with the links to its task and pod, and also the status and duration of the task run. Use the Options menu
 to delete a task run.
Note
to delete a task run.
NoteThe TaskRuns list page features a Manage columns button, which you can also use to add a Duration column.
Click the required task run to see the Task Run details page. The results for successful runs are displayed under the Task Run results pane at the bottom of the page.
NoteThe Details section of the Task Run details page displays a Log Snippet of the failed task run. Log Snippet provides a general error message and a snippet of the log. A link to the Logs section provides quick access to the details about the failed task run.
- Click the Parameters tab to see the parameters defined in the pipeline. You can also add or edit additional parameters, as required.
- Click the Resources tab to see the resources defined in the pipeline. You can also add or edit additional resources, as required.
2.1.5. Starting pipelines from Pipelines view
After you create a pipeline, you need to start it to execute the included tasks in the defined sequence. You can start a pipeline from the Pipelines view, the Pipeline Details page, or the Topology view.
Procedure
To start a pipeline using the Pipelines view:
-
In the Pipelines view of the Developer perspective, click the Options
 menu adjoining a pipeline, and select Start.
The Start Pipeline dialog box displays the Git Resources and the Image Resources based on the pipeline definition.
NoteFor pipelines created using the From Git option, the Start Pipeline dialog box also displays an
APP_NAMEfield in the Parameters section, and all the fields in the dialog box are prepopulated by the pipeline template.- If you have resources in your namespace, the Git Resources and the Image Resources fields are prepopulated with those resources. If required, use the drop-downs to select or create the required resources and customize the pipeline run instance.
Optional: Modify the Advanced Options to add the credentials that authenticate the specified private Git server or the image registry.
- Under Advanced Options, click Show Credentials Options and select Add Secret.
In the Create Source Secret section, specify the following:
- A unique Secret Name for the secret.
- In the Designated provider to be authenticated section, specify the provider to be authenticated in the Access to field, and the base Server URL.
Select the Authentication Type and provide the credentials:
For the Authentication Type
Image Registry Credentials, specify the Registry Server Address that you want to authenticate, and provide your credentials in the Username, Password, and Email fields.Select Add Credentials if you want to specify an additional Registry Server Address.
-
For the Authentication Type
Basic Authentication, specify the values for the UserName and Password or Token fields. For the Authentication Type
SSH Keys, specify the value of the SSH Private Key field.NoteFor basic authentication and SSH authentication, you can use annotations such as:
-
tekton.dev/git-0: https://github.com -
tekton.dev/git-1: https://gitlab.com.
-
- Select the check mark to add the secret.
You can add multiple secrets based upon the number of resources in your pipeline.
- Click Start to start the pipeline.
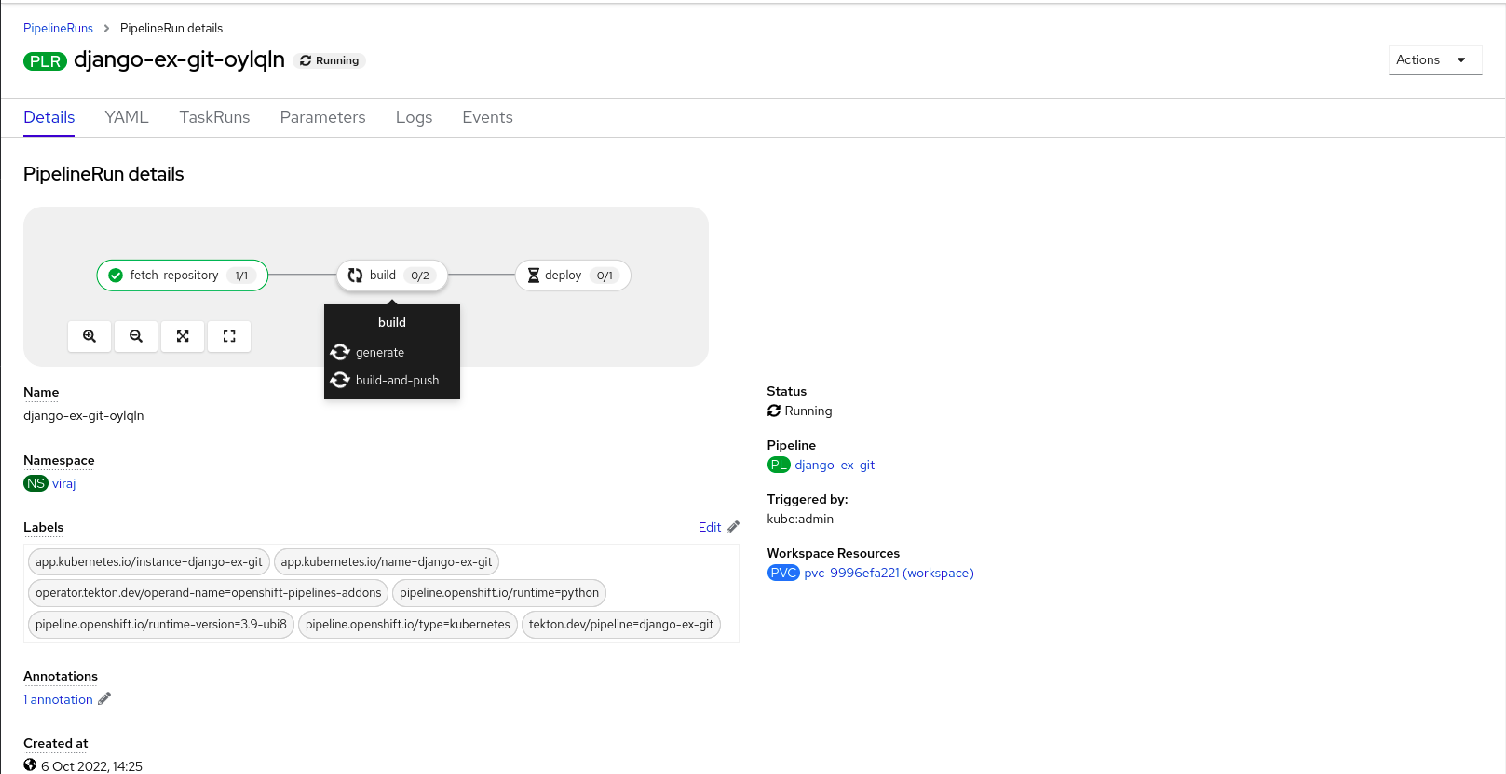
The PipelineRun details page displays the pipeline being executed. After the pipeline starts, the tasks and steps within each task are executed. You can:
- Use the zoom in, zoom out, fit to screen, and reset view features using the standard icons, which are in the lower left corner of the PipelineRun details page visualization.
- Change the zoom factor of the pipelinerun visualization using the mouse wheel. At specific zoom factors, the background color of the tasks changes to indicate the error or warning status.
- Hover over the tasks to see the details, such as the time taken to execute each step, task name, and task status.
- Hover over the tasks badge to see the total number of tasks and tasks completed.
- Click on a task to see the logs for each step in the task.
- Click the Logs tab to see the logs relating to the execution sequence of the tasks. You can also expand the pane and download the logs individually or in bulk, by using the relevant button.
Click the Events tab to see the stream of events generated by a pipeline run.
You can use the Task Runs, Logs, and Events tabs to assist in debugging a failed pipeline run or a failed task run.
Figure 2.4. Pipeline run details
2.1.6. Starting pipelines from Topology view
For pipelines created using the From Git option, you can use the Topology view to interact with pipelines after you start them:
To see the pipelines created using Pipeline builder in the Topology view, customize the pipeline labels to link the pipeline with the application workload.
Procedure
- Click Topology in the left navigation panel.
- Click the application to display Pipeline Runs in the side panel.
In Pipeline Runs, click Start Last Run to start a new pipeline run with the same parameters and resources as the previous one. This option is disabled if a pipeline run has not been initiated. You can also start a pipeline run when you create it.
Figure 2.5. Pipelines in Topology view
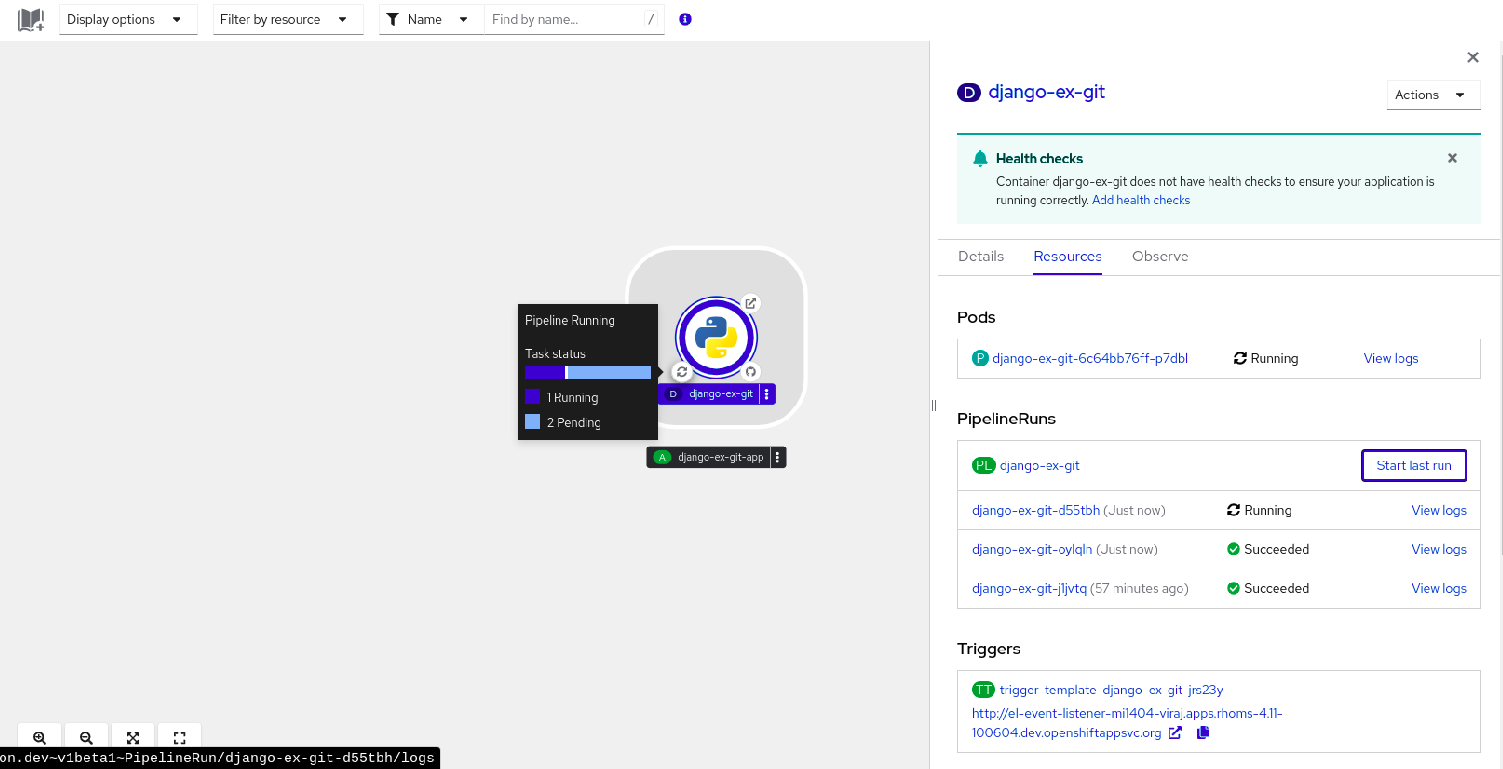
In the Topology page, hover to the left of the application to see the status of its pipeline run. After a pipeline is added, a bottom left icon indicates that there is an associated pipeline.
2.1.7. Interacting with pipelines from Topology view
The side panel of the application node in the Topology page displays the status of a pipeline run and you can interact with it.
- If a pipeline run does not start automatically, the side panel displays a message that the pipeline cannot be automatically started, hence it would need to be started manually.
- If a pipeline is created but the user has not started the pipeline, its status is not started. When the user clicks the Not started status icon, the start dialog box opens in the Topology view.
- If the pipeline has no build or build config, the Builds section is not visible. If there is a pipeline and build config, the Builds section is visible.
- The side panel displays a Log Snippet when a pipeline run fails on a specific task run. You can view the Log Snippet in the Pipeline Runs section, under the Resources tab. It provides a general error message and a snippet of the log. A link to the Logs section provides quick access to the details about the failed run.
2.1.8. Editing pipelines
You can edit the pipelines in your cluster using the Developer perspective of the web console:
Procedure
- In the Pipelines view of the Developer perspective, select the pipeline you want to edit to see the details of the pipeline. In the Pipeline Details page, click Actions and select Edit Pipeline.
On the Pipeline builder page, you can perform the following tasks:
- Add additional tasks, parameters, or resources to the pipeline.
- Click the task you want to modify to see the task details in the side panel and modify the required task details, such as the display name, parameters, and resources.
- Alternatively, to delete the task, click the task, and in the side panel, click Actions and select Remove Task.
- Click Save to save the modified pipeline.
2.1.9. Deleting pipelines
You can delete the pipelines in your cluster using the Developer perspective of the web console.
Procedure
-
In the Pipelines view of the Developer perspective, click the Options
 menu adjoining a Pipeline, and select Delete Pipeline.
- In the Delete Pipeline confirmation prompt, click Delete to confirm the deletion.
2.3. Creating pipeline templates in the Administrator perspective
As a cluster administrator, you can create pipeline templates that developers can reuse when they create a pipeline on the cluster.
Prerequisites
- You have access to an OpenShift Container Platform cluster with cluster administrator permissions, and have switched to the Administrator perspective.
- You have installed the OpenShift Pipelines Operator in your cluster.
Procedure
- Navigate to the Pipelines page to view existing pipeline templates.
-
Click the
 icon to go to the Import YAML page.
Add the YAML for your pipeline template. The template must include the following information:
apiVersion: tekton.dev/v1
kind: Pipeline
metadata:
# ...
  namespace: openshift
1 labels: pipeline.openshift.io/runtime: <runtime>2 pipeline.openshift.io/type: <pipeline-type>3 # ...- 1
- The template must be created in the
openshiftnamespace. - 2
- The template must contain the
pipeline.openshift.io/runtimelabel. The accepted runtime values for this label arenodejs,golang,dotnet,java,php,ruby,perl,python,nginx, andhttpd. - 3
- The template must contain the
pipeline.openshift.io/type:label. The accepted type values for this label areopenshift,knative, andkubernetes.
- Click Create. After the pipeline has been created, you are taken to the Pipeline details page, where you can view information about or edit your pipeline.
2.4. Pipeline execution statistics in the web console
You can view statistics related to execution of pipelines in the web console.
To view the statistic information, you must complete the following steps:
- Install Tekton Results. For more information about installing Tekton Results, see Using Tekton Results for OpenShift Pipelines observability in the Additional resources section.
- Enable the OpenShift Pipelines console plugin.
Statistic information is available for all pipelines together and for each individual pipeline.
The OpenShift Pipelines Pipelines console plugin is a Technology Preview feature only. Technology Preview features are not supported with Red Hat production service level agreements (SLAs) and might not be functionally complete. Red Hat does not recommend using them in production. These features provide early access to upcoming product features, enabling customers to test functionality and provide feedback during the development process.
For more information about the support scope of Red Hat Technology Preview features, see Technology Preview Features Support Scope.
2.4.1. Enabling the OpenShift Pipelines console plugin
To view the statistic information, you must first enable the OpenShift Pipelines console plugin.
Prerequisites
- You installed the Red Hat OpenShift Pipelines Operator in your cluster.
- You are logged on to the web console with cluster administrator permissions.
The OpenShift Pipelines console plugin requires OpenShift Container Platform version 4.15 or a later version.
Procedure
-
In the Administrator perspective of the web console, select Operators
Installed Operators. - Click Red Hat OpenShift Pipelines in the table of Operators.
- In the right pane on the screen, check the status label under Console plugin. The label is either Enabled or Disabled.
- If the label is Disabled, click this label. In the window that displays, select Enable and then click Save.
2.4.2. Viewing the statistics for all pipelines together
You can view consolidated statistic information related to all pipelines on the system.
Prerequisites
- You installed the Red Hat OpenShift Pipelines Operator in your cluster.
- You installed Tekton Results.
- You installed the OpenShift Pipelines web console plugin.
Procedure
In the Administrator perspective of the web console, select Pipelines
Overview. A statistics overview displays. This overview includes the following information: A graph reflecting the number and status of pipeline runs over a time period The total, average, and maximum durations of pipeline execution over the same period. ** The total number of pipeline runs over the same period.
A table of pipelines also displays. This table lists all pipelines that were run in the time period, showing their duration and success rate.
Optional: Change the settings of the statistics display as necessary:
- Project: The project or namespace to display statistics for.
- Time range: The time period to display statistics for.
- Refresh interval: How often Red Hat OpenShift Pipelines must update the data in the window while you are viewing it.
2.4.3. Viewing the statistics for a specific pipeline
You can view statistic information related to a particular pipeline.
Prerequisites
- You installed the Red Hat OpenShift Pipelines Operator in your cluster.
- You installed Tekton Results.
- You installed the OpenShift Pipelines web console plugin.
Procedure
-
In the Administrator perspective of the web console, select Pipelines
Pipelines. - Click a pipeline in the list of pipelines. The Pipeline details view displays.
Click the Metrics tab.
A statistics overview displays. This overview includes the following information: A graph reflecting the number and status of pipeline runs over a time period The total, average, and maximum durations of pipeline execution over the same period. ** The total number of pipeline runs over the same period.
Optional: Change the settings of the statistics display as necessary:
- Project: The project or namespace to display statistics for.
- Time range: The time period to display statistics for.
- Refresh interval: How often Red Hat OpenShift Pipelines must update the data in the window while you are viewing it.