Chapter 2. Developer metrics
2.1. Serverless developer metrics overview
Metrics enable developers to monitor how Knative services are performing. You can use the OpenShift Container Platform monitoring stack to record and view health checks and metrics for your Knative services.
You can view different metrics for OpenShift Serverless by navigating to Dashboards in the web console Developer perspective.
If Service Mesh is enabled with mTLS, metrics for Knative Serving are disabled by default because Service Mesh prevents Prometheus from scraping metrics.
For information about resolving this issue, see Enabling Knative Serving metrics when using Service Mesh with mTLS.
Scraping the metrics does not affect autoscaling of a Knative service, because scraping requests do not go through the activator. Consequently, no scraping takes place if no pods are running.
2.2. Knative service metrics exposed by default
| Metric name, unit, and type | Description | Metric tags |
|---|---|---|
|
Metric unit: dimensionless Metric type: counter |
The number of requests that are routed to | configuration_name="event-display", container_name="queue-proxy", namespace_name="apiserversource1", pod_name="event-display-00001-deployment-658fd4f9cf-qcnr5", response_code="200", response_code_class="2xx", revision_name="event-display-00001", service_name="event-display" |
|
Metric unit: milliseconds Metric type: histogram | The response time in milliseconds. | configuration_name="event-display", container_name="queue-proxy", namespace_name="apiserversource1", pod_name="event-display-00001-deployment-658fd4f9cf-qcnr5", response_code="200", response_code_class="2xx", revision_name="event-display-00001", service_name="event-display" |
|
Metric unit: dimensionless Metric type: gauge |
The current number of items in the serving and waiting queue, or not reported if unlimited concurrency. | configuration_name="event-display", container_name="queue-proxy", namespace_name="apiserversource1", pod_name="event-display-00001-deployment-658fd4f9cf-qcnr5", response_code="200", response_code_class="2xx", revision_name="event-display-00001", service_name="event-display" |
2.3. Knative service with custom application metrics
You can extend the set of metrics exported by a Knative service. The exact implementation depends on your application and the language used.
The following listing implements a sample Go application that exports the count of processed events custom metric.
package main

import (
  "fmt"
  "log"
  "net/http"
  "os"

  "github.com/prometheus/client_golang/prometheus"
  "github.com/prometheus/client_golang/prometheus/promauto"
  "github.com/prometheus/client_golang/prometheus/promhttp"
)

var (
  opsProcessed = promauto.NewCounter(prometheus.CounterOpts{
     Name: "myapp_processed_ops_total",
     Help: "The total number of processed events",
  })
)


func handler(w http.ResponseWriter, r *http.Request) {
  log.Print("helloworld: received a request")
  target := os.Getenv("TARGET")
  if target == "" {
     target = "World"
  }
  fmt.Fprintf(w, "Hello %s!\n", target)
  opsProcessed.Inc()
}

func main() {
  log.Print("helloworld: starting server...")

  port := os.Getenv("PORT")
  if port == "" {
     port = "8080"
  }

  http.HandleFunc("/", handler)

  // Separate server for metrics requests
  go func() {
     mux := http.NewServeMux()
     server := &http.Server{
        Addr: fmt.Sprintf(":%s", "9095"),
        Handler: mux,
     }
     mux.Handle("/metrics", promhttp.Handler())
     log.Printf("prometheus: listening on port %s", 9095)
     log.Fatal(server.ListenAndServe())
  }()

   // Use same port as normal requests for metrics
  //http.Handle("/metrics", promhttp.Handler())
  log.Printf("helloworld: listening on port %s", port)
  log.Fatal(http.ListenAndServe(fmt.Sprintf(":%s", port), nil))
}2.4. Configuration for scraping custom metrics
Custom metrics scraping is performed by an instance of Prometheus purposed for user workload monitoring. After you enable user workload monitoring and create the application, you need a configuration that defines how the monitoring stack will scrape the metrics.
The following sample configuration defines the ksvc for your application and configures the service monitor. The exact configuration depends on your application and how it exports the metrics.
apiVersion: serving.knative.dev/v1
kind: Service
metadata:
  name: helloworld-go
spec:
  template:
    metadata:
      labels:
        app: helloworld-go
      annotations:
    spec:
      containers:
      - image: docker.io/skonto/helloworld-go:metrics
        resources:
          requests:
            cpu: "200m"
        env:
        - name: TARGET
          value: "Go Sample v1"
---
apiVersion: monitoring.coreos.com/v1
kind: ServiceMonitor
metadata:
  labels:
  name: helloworld-go-sm
spec:
  endpoints:
  - port: queue-proxy-metrics
    scheme: http
  - port: app-metrics
    scheme: http
  namespaceSelector: {}
  selector:
    matchLabels:
       name:  helloworld-go-sm
---
apiVersion: v1
kind: Service
metadata:
  labels:
    name:  helloworld-go-sm
  name:  helloworld-go-sm
spec:
  ports:
  - name: queue-proxy-metrics
    port: 9091
    protocol: TCP
    targetPort: 9091
  - name: app-metrics
    port: 9095
    protocol: TCP
    targetPort: 9095
  selector:
    serving.knative.dev/service: helloworld-go
type: ClusterIP2.5. Examining metrics of a service
After you have configured the application to export the metrics and the monitoring stack to scrape them, you can examine the metrics in the web console.
Prerequisites
- You have logged in to the OpenShift Container Platform web console.
- You have installed the OpenShift Serverless Operator and Knative Serving.
Procedure
Optional: Run requests against your application that you will be able to see in the metrics:
$ hello_route=$(oc get ksvc helloworld-go -n ns1 -o jsonpath='{.status.url}') && \
    curl $hello_route
Example output
Hello Go Sample v1!-
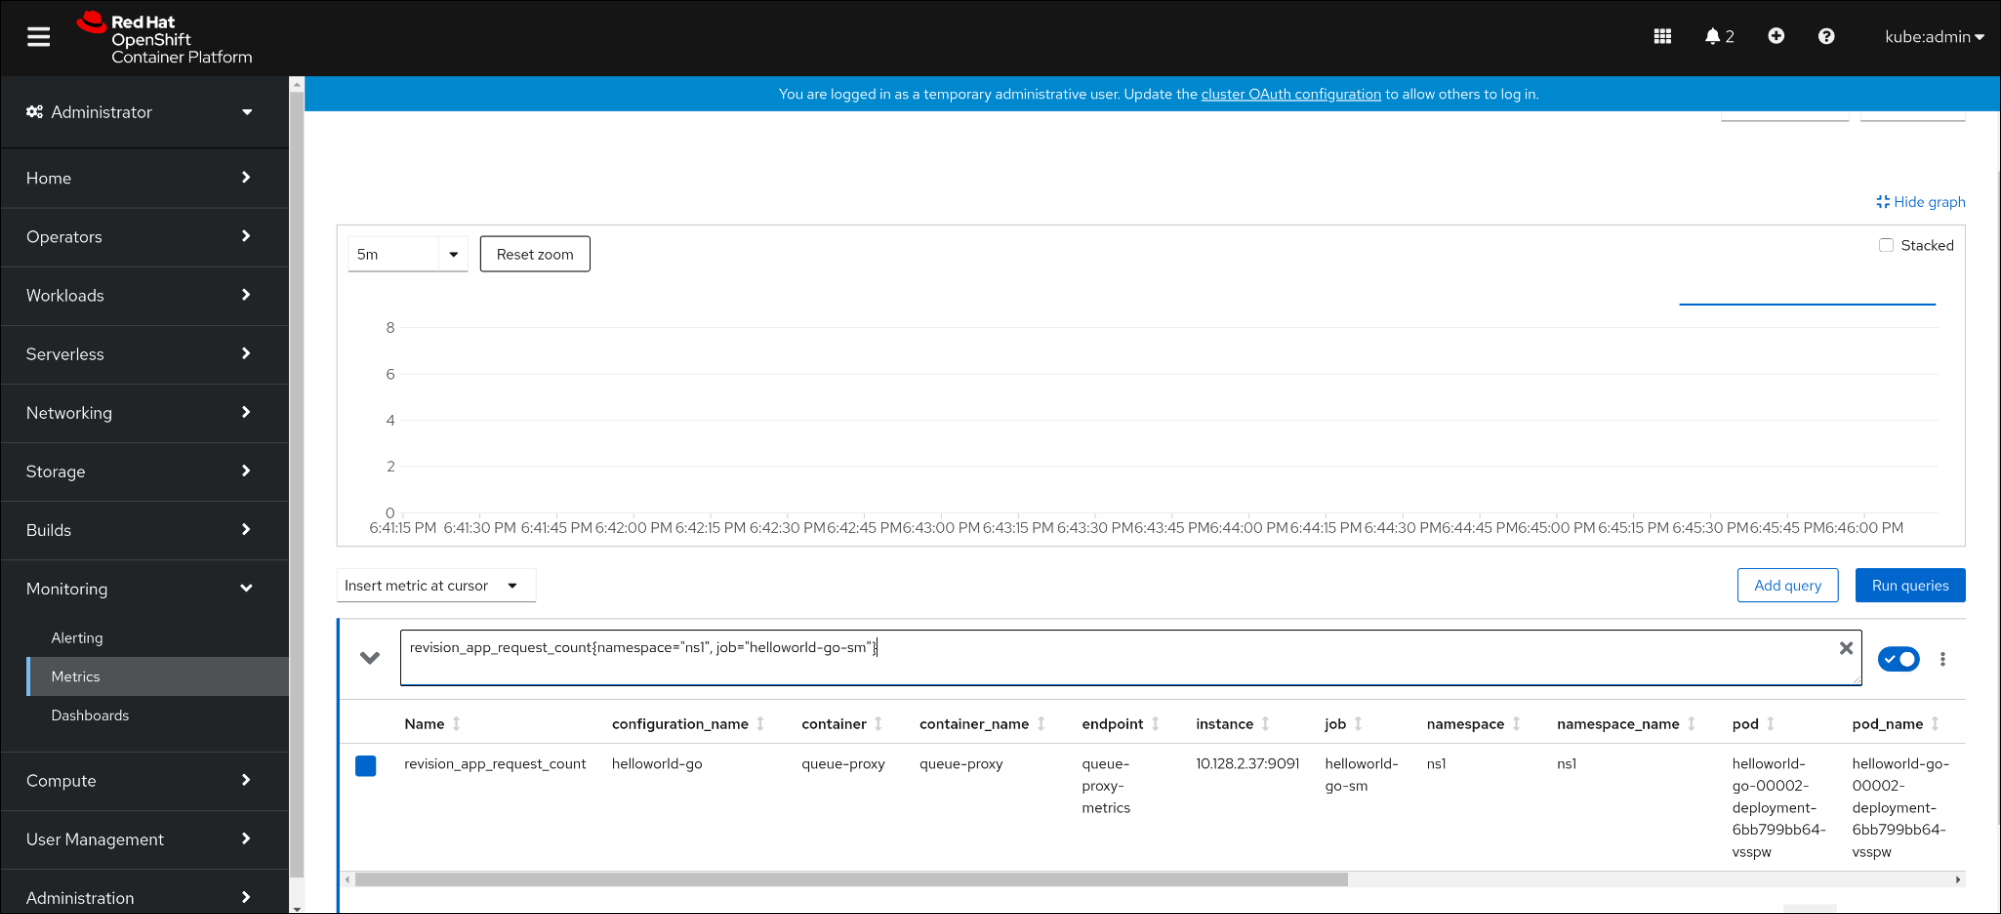
In the web console, navigate to the Observe
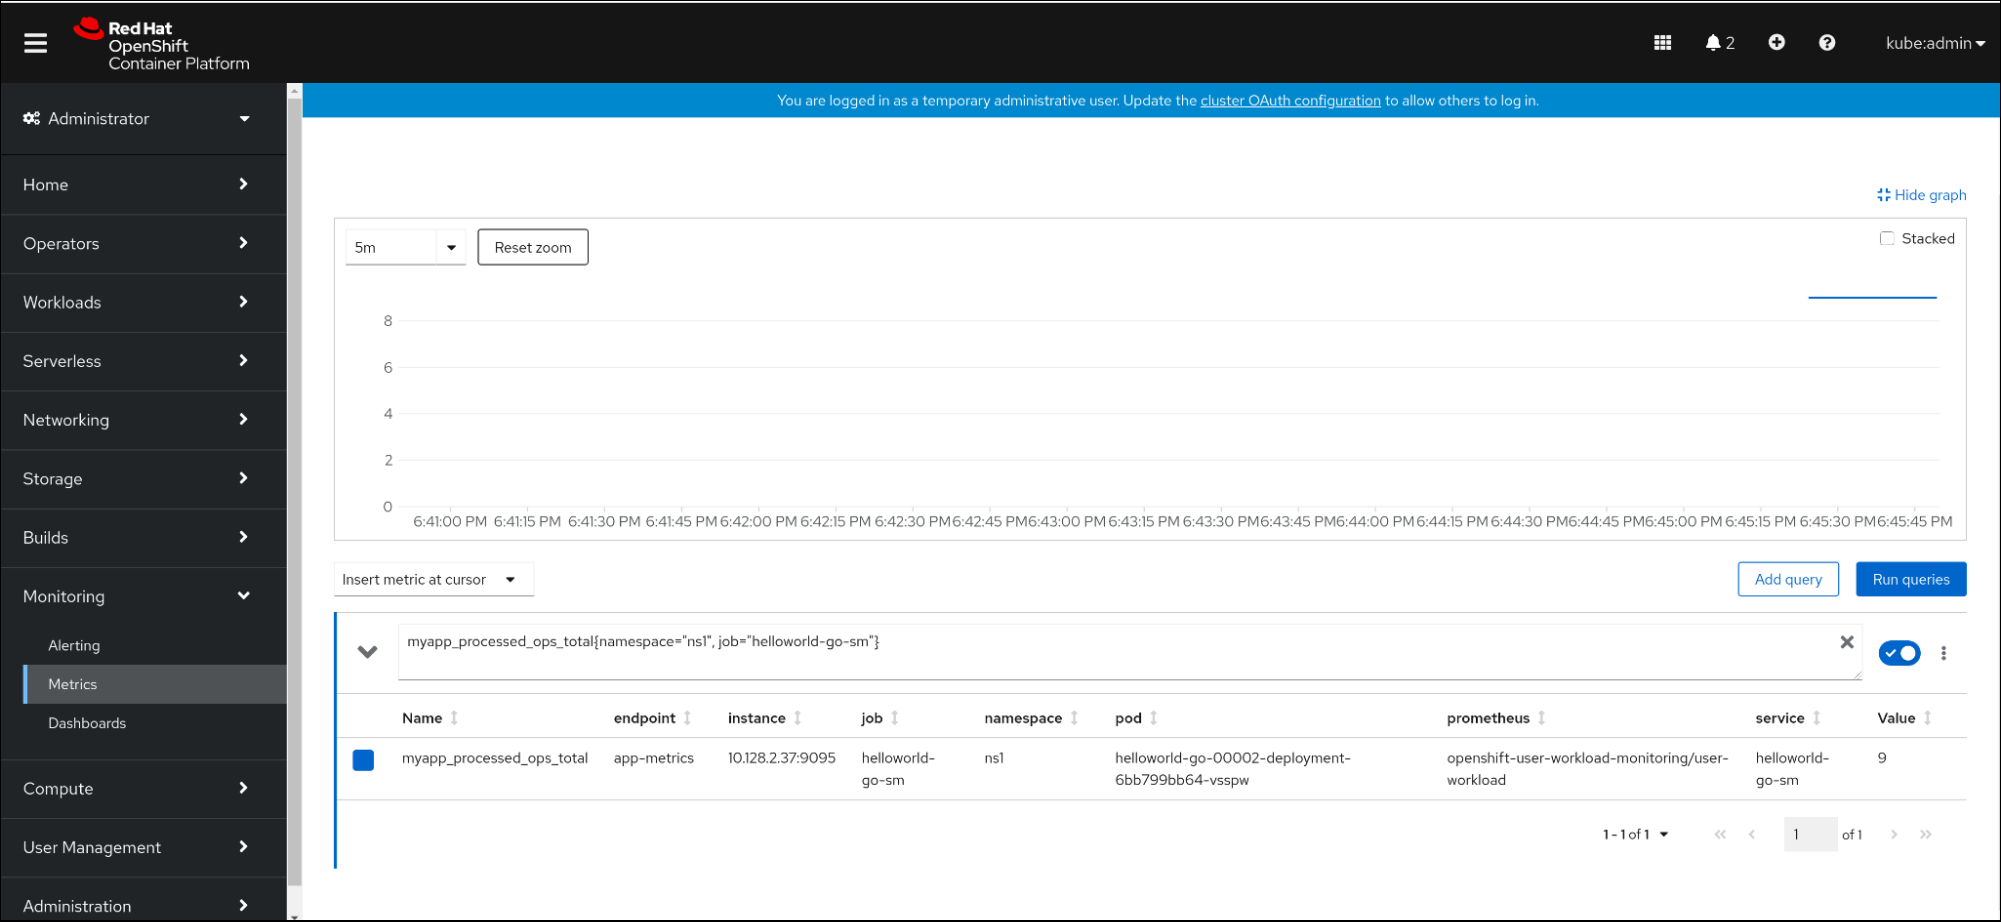
Metrics interface. In the input field, enter the query for the metric you want to observe, for example:
revision_app_request_count{namespace="ns1", job="helloworld-go-sm"}Another example:
myapp_processed_ops_total{namespace="ns1", job="helloworld-go-sm"}Observe the visualized metrics:
2.5.1. Queue proxy metrics
Each Knative service has a proxy container that proxies the connections to the application container. A number of metrics are reported for the queue proxy performance.
You can use the following metrics to measure if requests are queued at the proxy side and the actual delay in serving requests at the application side.
| Metric name | Description | Type | Tags | Unit |
|---|---|---|---|---|
|
|
The number of requests that are routed to | Counter |
| Integer (no units) |
|
| The response time of revision requests. | Histogram |
| Milliseconds |
|
|
The number of requests that are routed to the | Counter |
| Integer (no units) |
|
| The response time of revision app requests. | Histogram |
| Milliseconds |
|
|
The current number of items in the | Gauge |
| Integer (no units) |
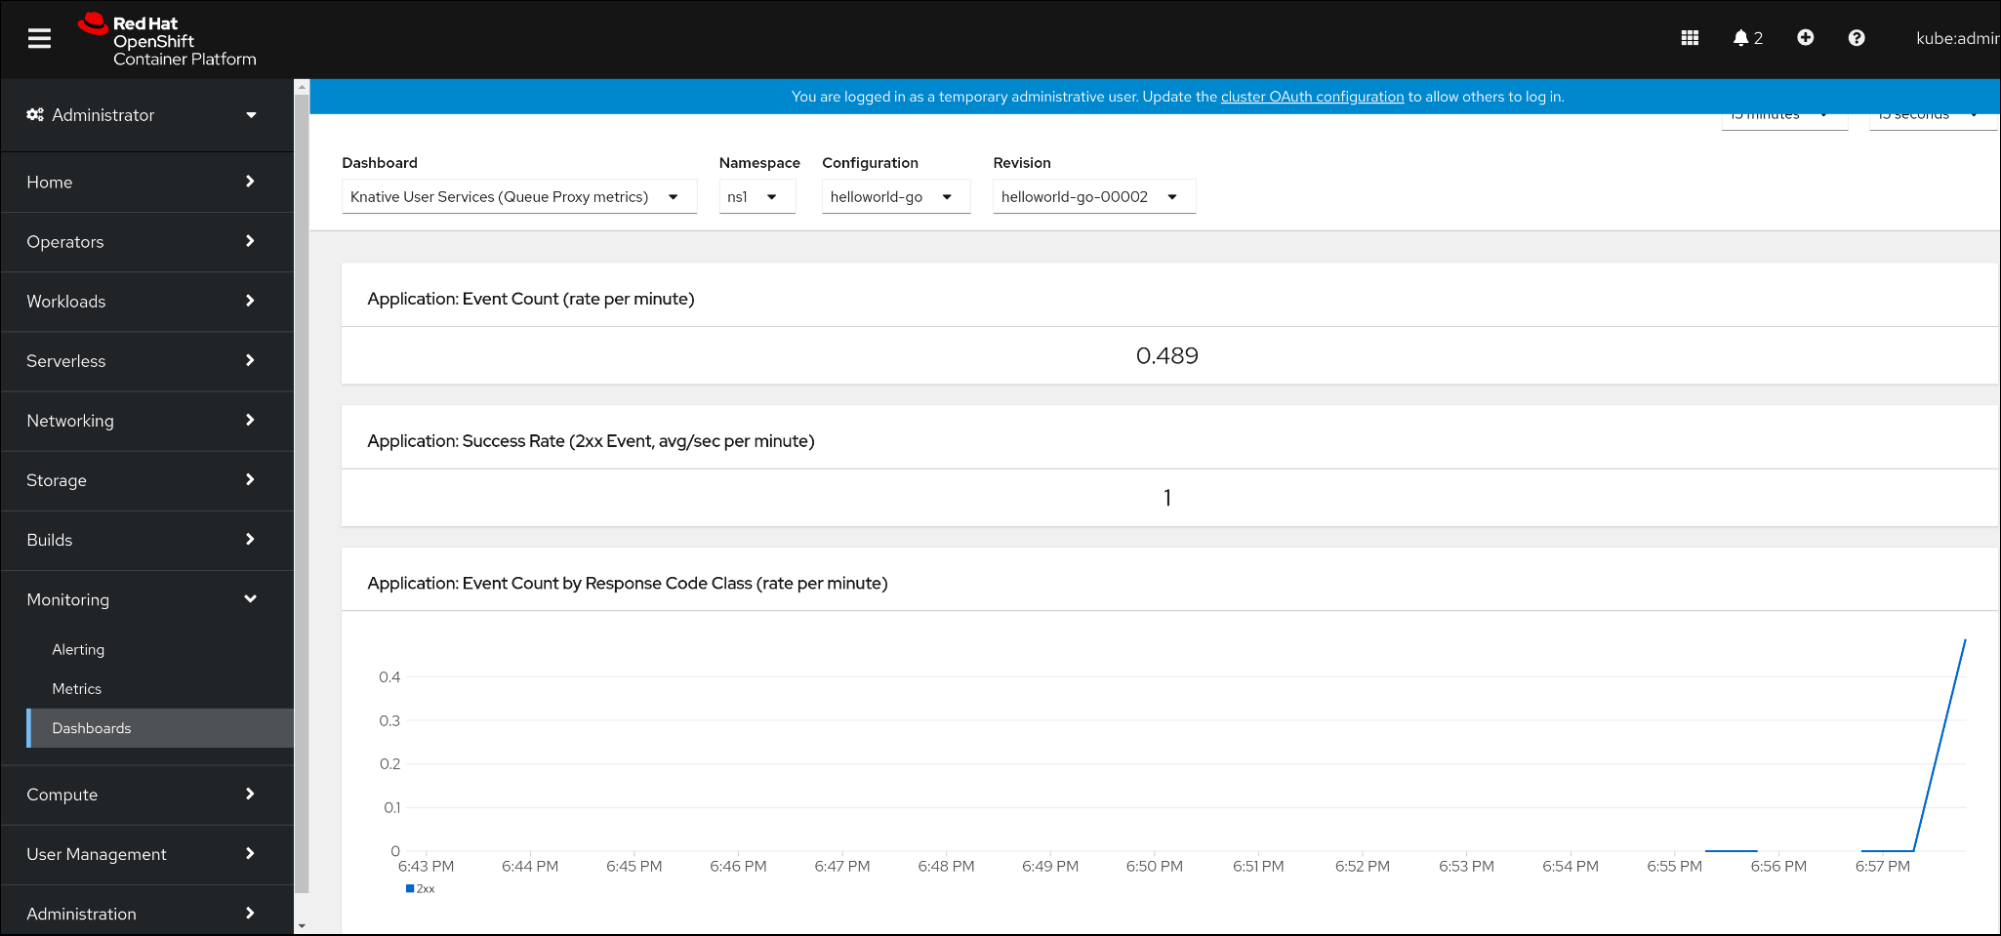
2.6. Dashboard for service metrics
You can examine the metrics using a dedicated dashboard that aggregates queue proxy metrics by namespace.
2.6.1. Examining metrics of a service in the dashboard
Prerequisites
- You have logged in to the OpenShift Container Platform web console.
- You have installed the OpenShift Serverless Operator and Knative Serving.
Procedure
-
In the web console, navigate to the Observe
Metrics interface. -
Select the
Knative User Services (Queue Proxy metrics)dashboard. - Select the Namespace, Configuration, and Revision that correspond to your application.
Observe the visualized metrics: