Chapter 1. Introduction to Service Telemetry Framework
Service Telemetry Framework (STF) provides automated collection of measurements and data from remote clients - Red Hat OpenStack Platform or third-party nodes - and transmission of that information to a centralized, receiving Red Hat OpenShift Container Platform (OCP) deployment for storage, retrieval, and monitoring. The data can be either of two types:
- Metric
- a numeric measurement of an application or system
- Event
- irregular and discrete occurrences that happen in a system
The collection components that are required on the clients are lightweight. The multicast message bus that is shared by all clients and the deployment provides fast and reliable data transport. Other modular components for receiving and storing data are deployed in containers on OCP.
STF provides access to monitoring functions such as alert generation, visualization through dashboards, and single source of truth telemetry analysis to support orchestration.
1.1. Service Telemetry Framework architecture
Service Telemetry Framework (STF) uses the components described in Table 1.1, “STF components”:
| Client | Component | Server (OCP) |
|---|---|---|
| yes | An AMQP 1.x compatible messaging bus to shuttle the metrics to STF for storage in Prometheus | yes |
| no | Smart Gateway to pick metrics and events from the AMQP 1.x bus and to deliver events to ElasticSearch or to provide metrics to Prometheus | yes |
| no | Prometheus as time-series data storage | yes |
| no | ElasticSearch as events data storage | yes |
| yes | collectd to collect infrastructure metrics and events | no |
| yes | Ceilometer to collect Red Hat OpenStack Platform metrics and events | no |
Figure 1.1. Service Telemetry Framework architecture overview
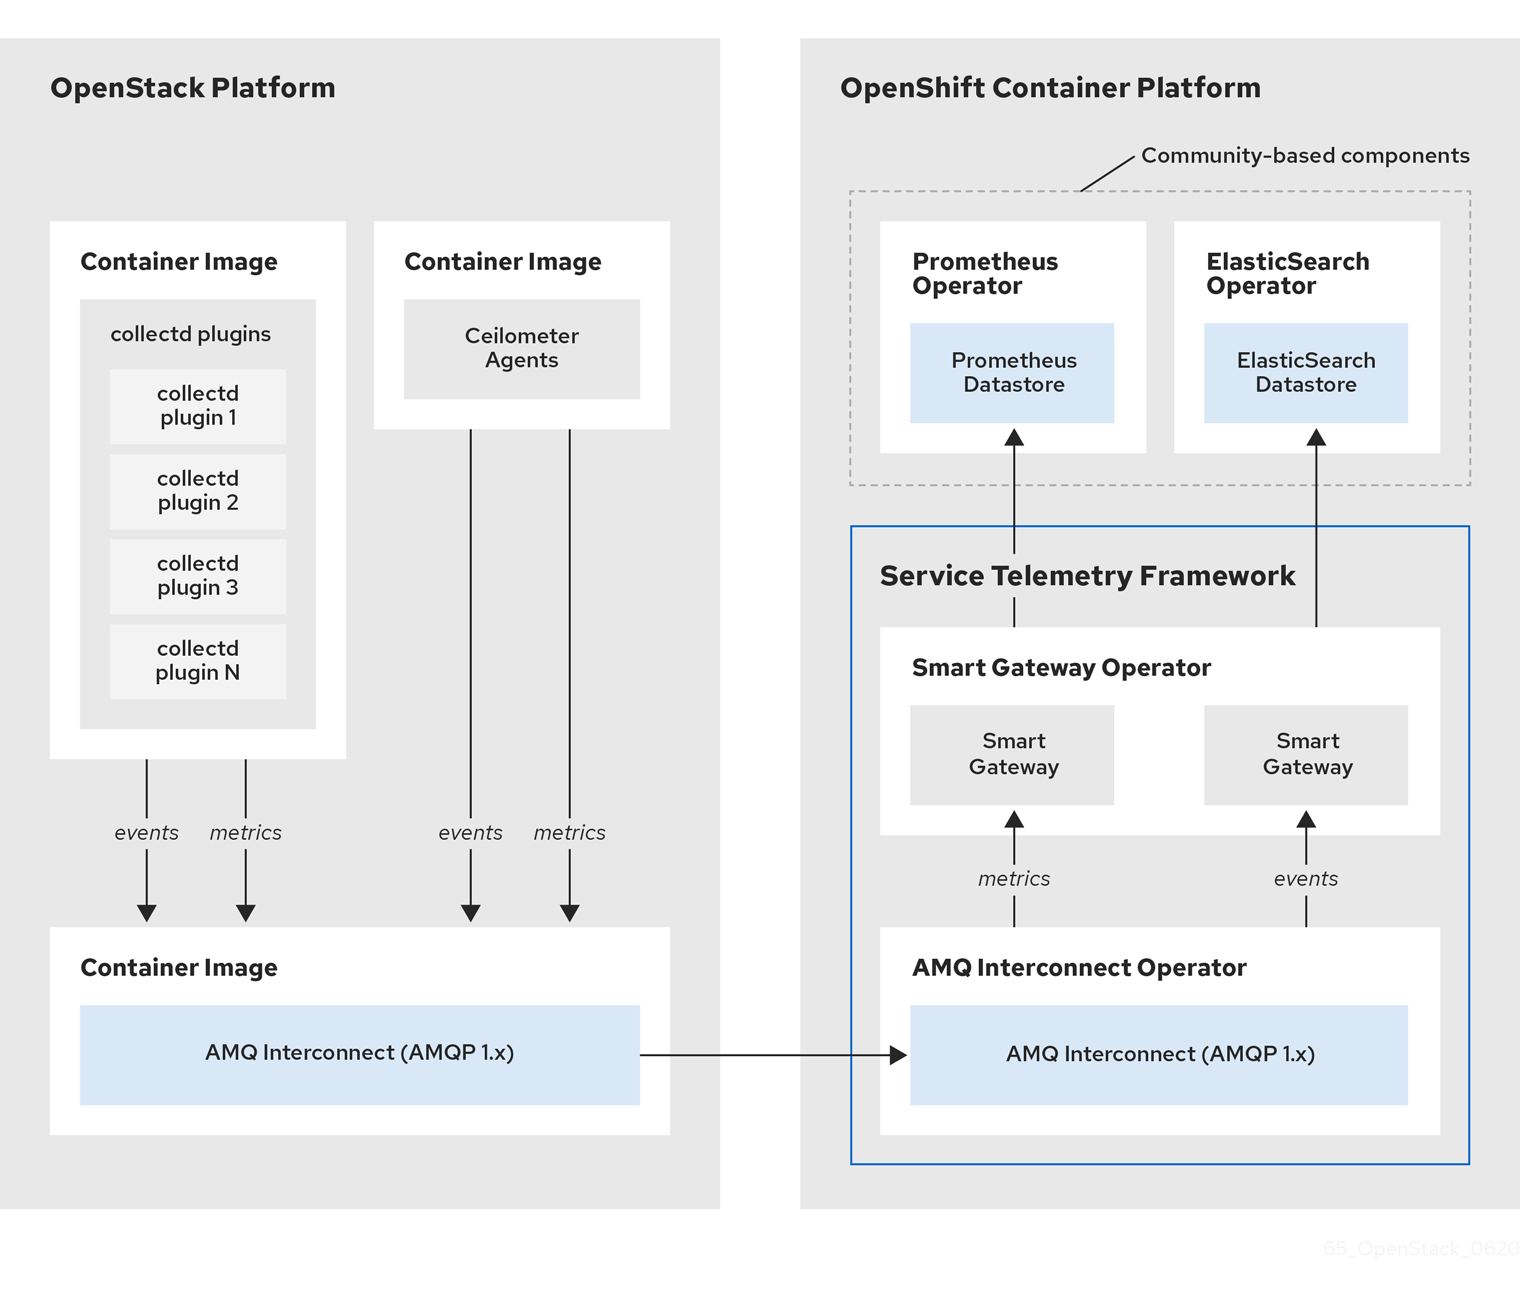
The Service Telemetry Framework data collection components, collectd and Ceilometer, and the transport components, AMQ Interconnect and Smart Gateway, are fully supported. The data storage components, Prometheus and ElasticSearch, including the Operator artifacts, and visualization component Grafana are community-supported, and are not officially supported.
For metrics, on the client side, collectd collects high-resolution metrics. collectd delivers the data to Prometheus by using the AMQP1 plugin, which places the data onto the message bus. On the server side, a Golang application called the Smart Gateway takes the data stream from the bus and exposes it as a local scrape endpoint for Prometheus.
If you plan to collect and store events, collectd or Ceilometer delivers event data to the server side by using the AMQP1 plugin, which places the data onto the message bus. Another Smart Gateway writes the data to the ElasticSearch datastore.
Server-side STF monitoring infrastructure consists of the following layers:
- Service Telemetry Framework 1.0 (STF)
- Red Hat OpenShift Container Platform (OCP)
- Infrastructure platform
Figure 1.2. Server-side STF monitoring infrastructure
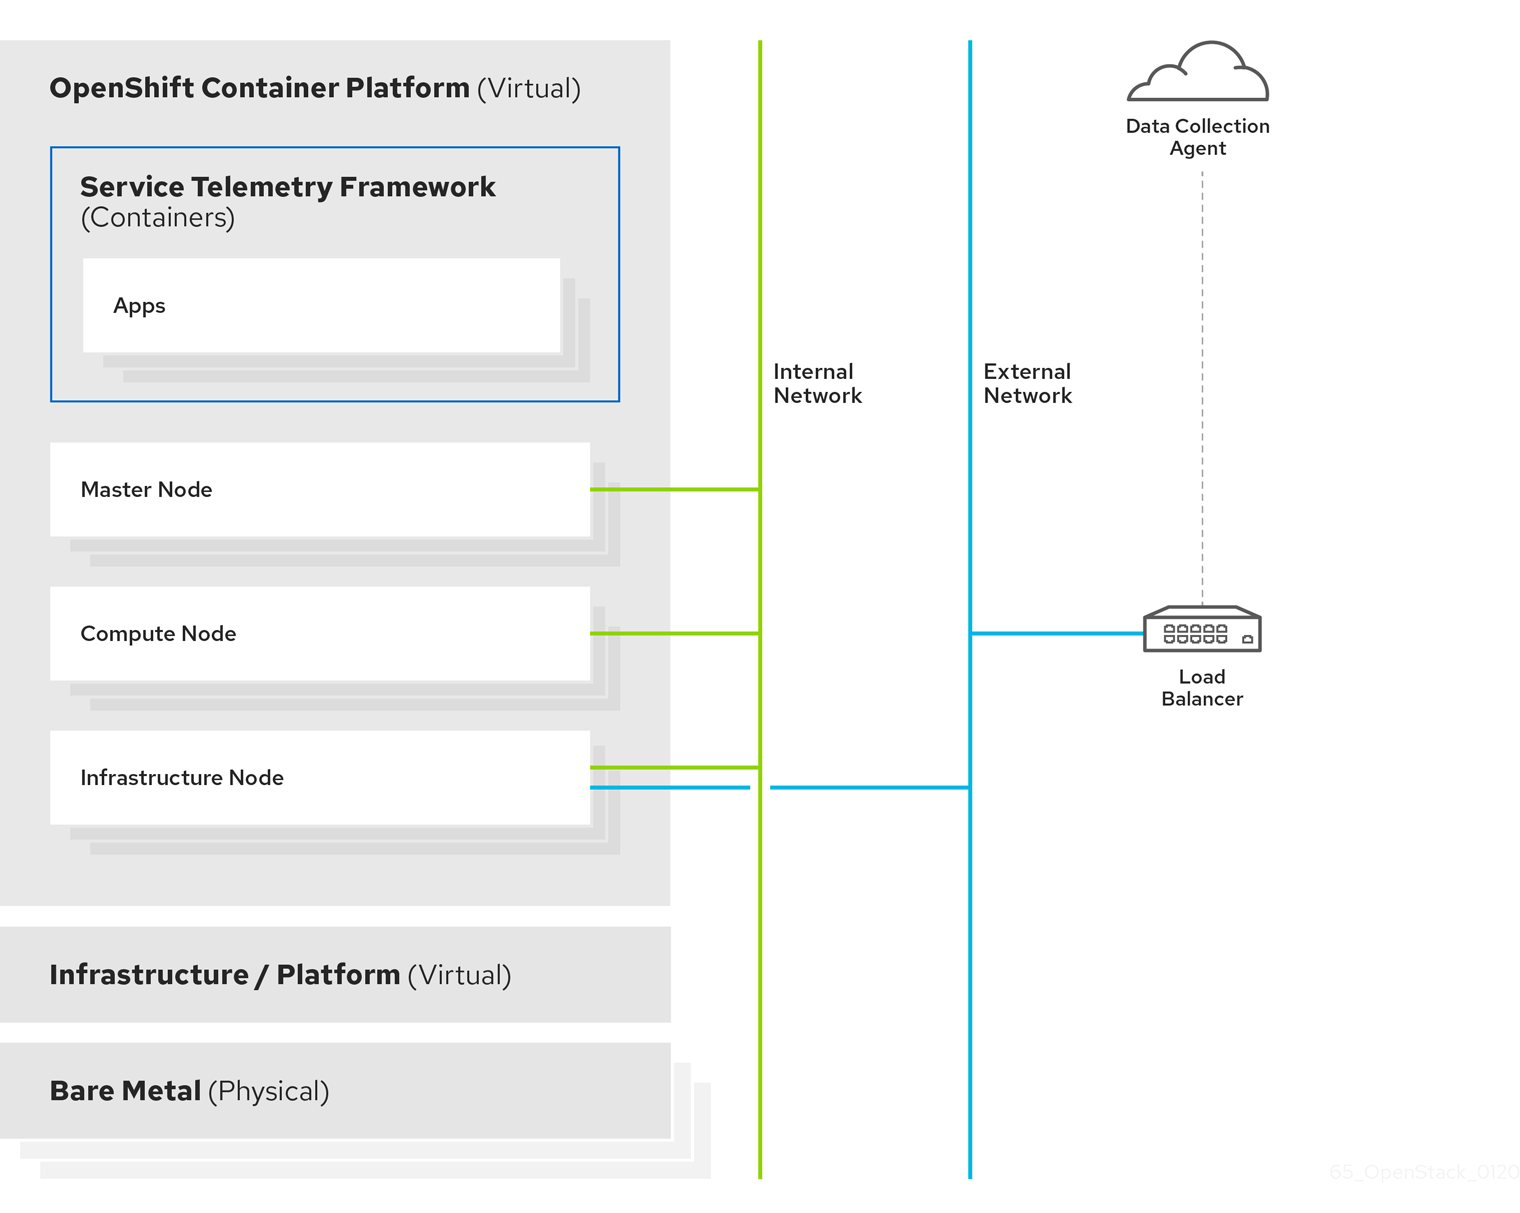
For more information about how to deploy Red Hat OpenShift Container Platform, see the OCP product documentation. You can install OCP on cloud platforms or on bare metal. For more information about STF performance and scaling, see https://access.redhat.com/articles/4907241.
Do not install OCP on the same infrastructure that you want to monitor.
1.2. Installation size
The size of your Red Hat OpenShift Container Platform installation depends on the following factors:
- The number of nodes you want to monitor.
- The number of metrics you want to collect.
- The resolution of metrics.
- The length of time that you want to store the data.
Installation of Service Telemetry Framework (STF) depends on the existing Red Hat OpenShift Container Platform environment. Ensure that you install monitoring for Red Hat OpenStack Platform on a platform separate from your Red Hat OpenStack Platform environment. You can install Red Hat OpenShift Container Platform (OCP) on baremetal or other supported cloud platforms. For more information about installing OCP, see OpenShift Container Platform 4.3 Documentation.
The size of your OCP environment depends on the infrastructure you select. For more information about minimum resources requirements when installing OCP on baremetal, see Minimum resource requirements in the Installing a cluster on bare metal guide. For installation requirements of the various public and private cloud platforms which you can install, see the corresponding installation documentation for your cloud platform of choice.