Chapter 1. Introduction to operational measurements
You can use the components of the Telemetry service in the Red Hat OpenStack Platform (RHOSP) environment to track physical and virtual resources, and collect metrics such as CPU usage and resource availability in your deployment with a data collection daemon that stores the aggregates on a Gnocchi back end.
You can use the availability and performance monitoring tools to measure and maintain your RHOSP environment. These tools perform the following functions:
- Availability monitoring
- Monitors all components in the RHOSP environment and determines if any components are currently experiencing outages or are not functional. You can also configure the system to alert you when problems are identified.
- Performance monitoring
- Collects system information periodically and provides a mechanism to store and monitor the values by using a data collecting daemon. This daemon stores the data it collects, for example operating system and log files. It also makes the data available over the network. You can use statistics gathered from the data to monitor systems, find performance bottlenecks, and predict future system load.
1.1. Telemetry architecture
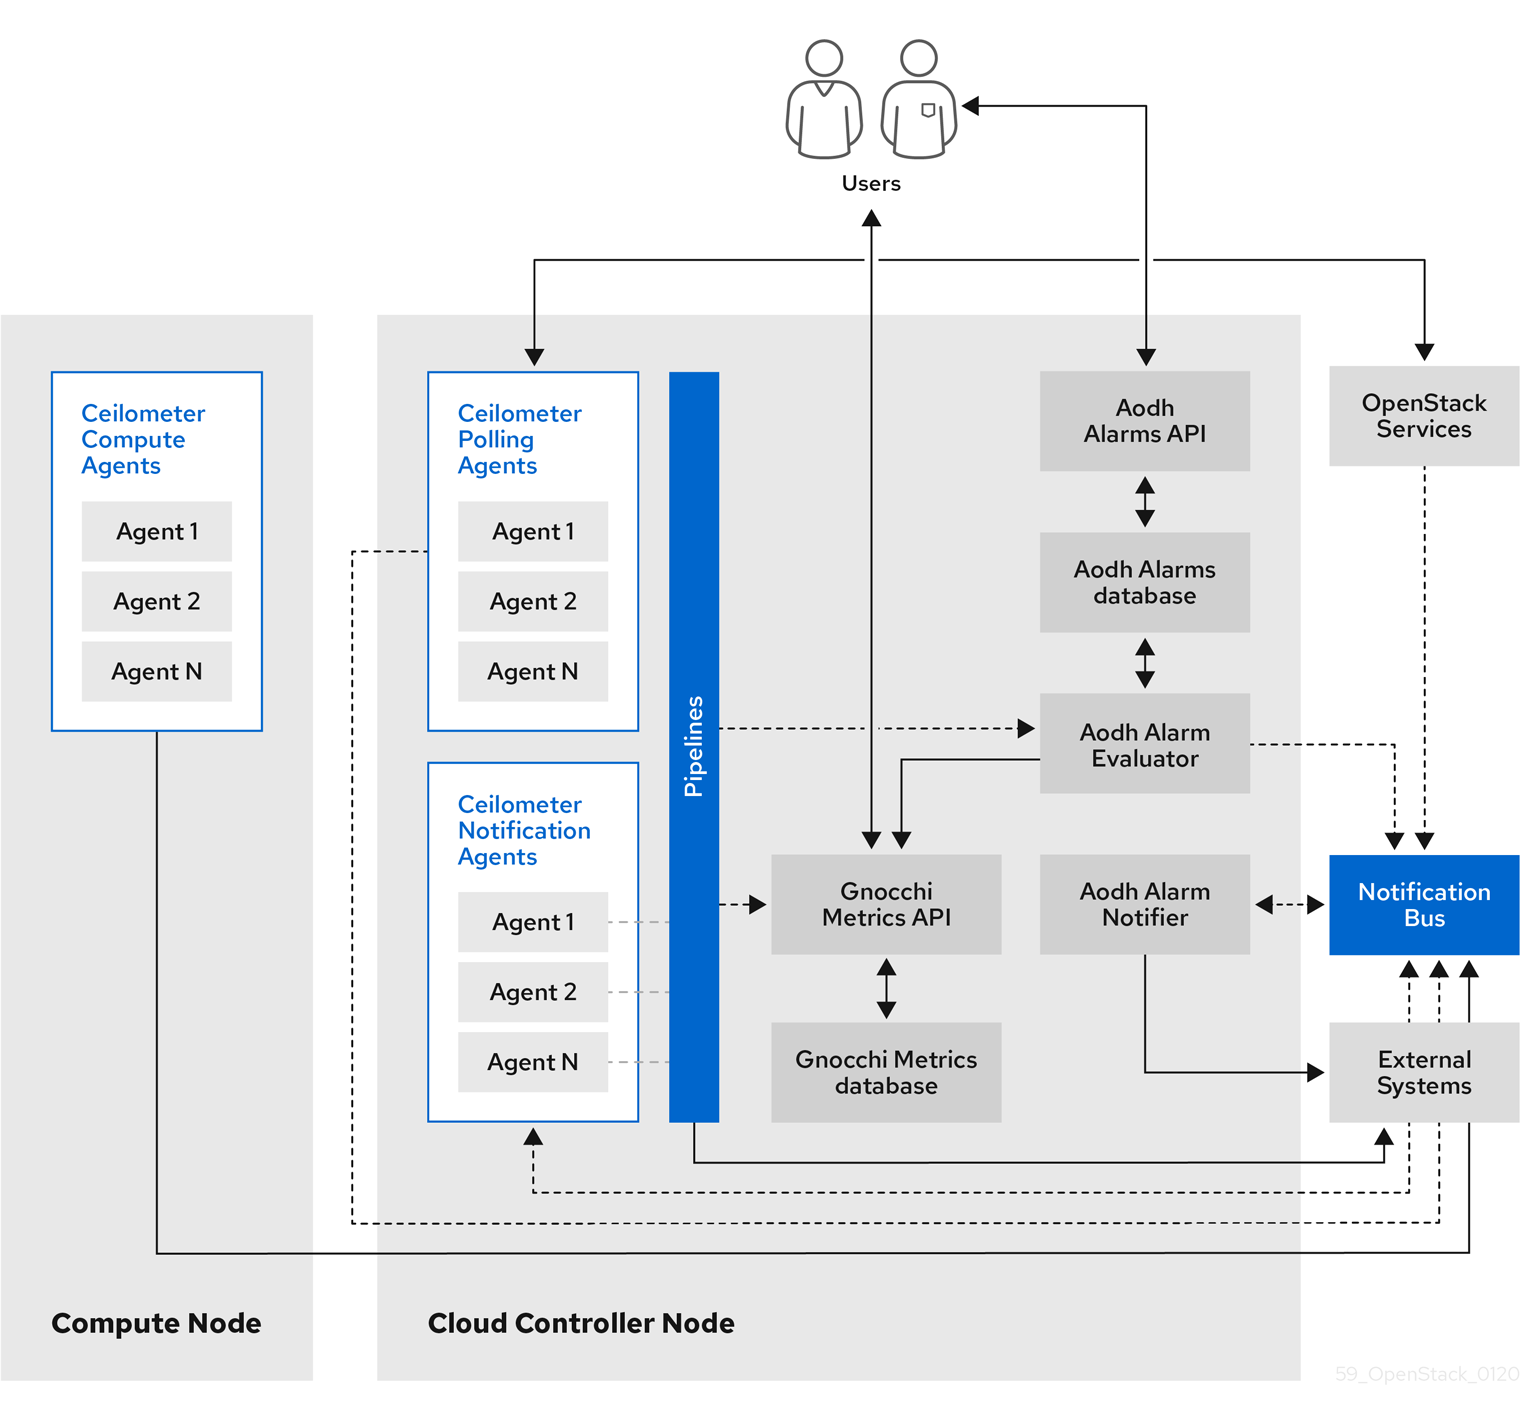
Red Hat OpenStack Platform (RHOSP) Telemetry provides user-level usage data for OpenStack-based clouds. You can use the data for customer billing, system monitoring, or alerts. You can configure Telemetry components to collect data from notifications sent by existing RHOSP components, such as Compute usage events, or by polling RHOSP infrastructure resources, such as libvirt. Telemetry publishes collected data to various targets including data stores and message queues.
Telemetry consists of the following components:
- Data collection: Telemetry uses Ceilometer to gather metric and event data. For more information, see Section 1.2.1, “Ceilometer”.
- Storage: Telemetry stores metric data in Gnocchi and event data in Panko. For more information, see Section 1.3, “Storage with Gnocchi”.
- Alarm service: Telemetry uses the Alarming service (Aodh) to trigger actions based on defined rules against metric or event data collected by Ceilometer.
After you collect the data, you can use a third-party tool to display and analyze metric data, and you can use the Alarming service to configure alarms for events.
Figure 1.1. Telemetry architecture
1.1.1. Support status of monitoring components
Use this table to view the support status of monitoring components in Red Hat OpenStack Platform (RHOSP).
| Component | Fully supported since | Deprecated in | Removed since | Note |
|---|---|---|---|---|
| Aodh | RHOSP 9 | RHOSP 15 | Supported for the autoscaling use case. | |
| Ceilometer | RHOSP 4 | Supported for collection of metrics and events for RHOSP in the autoscaling and Service Telemetry Framework (STF) use cases. | ||
| Collectd | RHOSP 11 | RHOSP 17.1 | Supported for collection of infrastructure metrics for STF. | |
| Gnocchi | RHOSP 9 | RHOSP 15 | Supported for storage of metrics for the autoscaling use case. | |
| Panko | RHOSP 11 | RHOSP 12, not installed by default since RHOSP 14 | RHOSP 17.0 | |
| QDR | RHOSP 13 | RHOSP 17.1 | Supported for transmission of metrics and events data from RHOSP to STF. |
1.2. Data collection in Red Hat OpenStack Platform
Red Hat OpenStack Platform (RHOSP) supports two types of data collection:
- Ceilometer for the OpenStack component-level monitoring. For more information, see Section 1.2.1, “Ceilometer”.
- collectd for infrastructure monitoring. For more information, see Section 1.2.2, “collectd”.
1.2.1. Ceilometer
Ceilometer is the default data collection component of the OpenStack Telemetry service that provides the ability to normalize and transform data across all of the current OpenStack core components. Ceilometer collects metering and event data relating to OpenStack services. Collected data is accessible to users based on the deployment configuration.
The Ceilometer service uses three agents to collect data from Red Hat OpenStack Platform (RHOSP) components:
-
A compute agent (ceilometer-agent-compute): Runs on each Compute node and polls for resource utilization statistics. This agent is the same as polling agent
ceilometer-pollingrunning with parameter--polling namespace-compute. -
A central agent (ceilometer-agent-central): Runs on a central management server to poll for resource utilization statistics for resources that are not tied to instances or Compute nodes. You can start multiple agents to scale services horizontally. This is the same as the polling agent
ceilometer-pollingthat operates with the parameter--polling namespace-central. - A notification agent (ceilometer-agent-notification): Runs on a central management server and consumes messages from the message queues to build event and metering data. Data publishes to defined targets. Gnocchi is the default target. These services use the RHOSP notification bus to communicate.
The Ceilometer agents use publishers to send data to the corresponding end points, for example Gnocchi. You can configure this information in the pipeline.yaml file.
Additional resources
- For more information about publishers, see Section 1.2.1.1, “Publishers”.
1.2.1.1. Publishers
The Telemetry service provides several transport methods to transfer the data collected to an external system. The consumers of this data are different, for example, monitoring systems, for which data loss is acceptable, and billing systems, which require reliable data transportation. Telemetry provides methods to fulfil the requirements of both system types. You can use the publisher component of the service to save the data into persistent storage through the message bus or to send it to one or more external consumers. One chain can contain multiple publishers.
The following publisher types are supported:
- Gnocchi (default): When the Gnocchi publisher is enabled, measurement and resource information is pushed to Gnocchi for time-series optimized storage. Ensure that you register Gnocchi in the Identity service as Ceilometer discovers the exact path through the Identity service.
- Panko: You can store event data from Ceilometer in panko, which provides an HTTP REST interface to query system events in Red Hat OpenStack Platform. Panko has been deprecated.
Configuring publisher parameters
You can configure the multi-publisher for each data point within the Telemetry service, allowing the same technical meter or event to be published multiple times to multiple destinations, each potentially using a different transport method.
Procedure
Create a YAML file to describe the possible publisher parameters and defaults, for example,
ceilometer-publisher.yaml. Insert the following parameters inparameter_defaults:parameter_defaults: ManagePipeline: true ManageEventPipeline: true EventPipelinePublishers: - gnocchi://?archive_policy=high PipelinePublishers: - gnocchi://?archive_policy=highDeploy the overcloud. Include the modified YAML files in the
openstack overcloud deploycommand. In the following example, replace<environment_files>with the other YAML files that you want to include in the deployment:$ openstack overcloud deploy --templates \ -e /home/custom/ceilometer-publisher.yaml -e <environment_files>
Additional resources
- For more information about parameters, see Telemetry parameters in the Overcloud Parameters guide and Heat parameters in the Advanced Overcloud Customization guide.
1.2.2. collectd
Performance monitoring collects system information periodically and provides a mechanism to store and monitor the values in a variety of ways using a data collecting agent. Red Hat supports the collectd daemon as a data collection agent. This daemon stores the data in a time-series database. One of the Red Hat supported databases is called Gnocchi. You can use this stored data to monitor systems, find performance bottlenecks, and predict future system load.
Additional resources
- For more information about Gnocchi, see Section 1.3, “Storage with Gnocchi”.
1.3. Storage with Gnocchi
Gnocchi is an open-source time-series database. It stores metrics at a very large scale and provides access to metrics and resources to operators and users. Gnocchi uses an archive policy to define which aggregations to compute and how many aggregates to retain; and an indexer driver to store the index of all resources, archive policies, and metrics.
1.3.1. Archive policies: Storing both short and long-term data in a time-series database
An archive policy defines which aggregations to compute and how many aggregates to retain. Gnocchi supports different aggregation methods, such as minimum, maximum, average, Nth percentile, and standard deviation. These aggregations are computed over a period of time called granularity and retained for a specific timespan.
The archive policy defines how the metrics are aggregated and for how long they are stored. Each archive policy is defined as the number of points over a timespan.
For example, if your archive policy defines a policy of 10 points with a granularity of 1 second, the time-series archive keeps up to 10 seconds, each representing an aggregation over 1 second. This means that the time series, at a maximum, retains 10 seconds of data between the more recent point and the older point.
The archive policy also defines which aggregate methods are used. The default is set to the parameter default_aggregation_methods whose values by default are set to mean, min, max. sum, std, count. So, depending on the use case, the archive policy and the granularity vary.
Additional resources
- For more information about archive policies, see Planning and managing archive policies.
1.3.2. Indexer driver
The indexer is responsible for storing the index of all resources, archive policies, and metrics along with their definitions, types, and properties. It is also responsible for linking resources with metrics. Red Hat OpenStack Platform director installs the indexer driver by default. You need a database to index all the resources and metrics that Gnocchi handles. The supported driver is MySQL.
1.3.3. Gnocchi Metric-as-a-Service terminology
This table contains definitions of the commonly used terms for the Metric-as-a-Service features.
| Term | Definition |
|---|---|
| Aggregation method | A function used to aggregate multiple measures into an aggregate. For example, the min aggregation method aggregates the values of different measures to the minimum value of all the measures in the time range. |
| Aggregate | A data point tuple generated from several measures according to the archive policy. An aggregate is composed of a timestamp and a value. |
| Archive policy | An aggregate storage policy attached to a metric. An archive policy determines how long aggregates are kept in a metric and how aggregates are aggregated (the aggregation method). |
| Granularity | The time between two aggregates in an aggregated time series of a metric. |
| Measure | An incoming data point tuple sent to the Time series database by the API. A measure is composed of a timestamp and a value. |
| Metric | An entity storing aggregates identified by an UUID. A metric can be attached to a resource using a name. How a metric stores its aggregates is defined by the archive policy to which the metric is associated. |
| Resource | An entity representing anything in your infrastructure that you associate a metric with. A resource is identified by a unique ID and can contain attributes. |
| Time series | A list of aggregates ordered by time. |
| Timespan | The time period for which a metric keeps its aggregates. It is used in the context of archive policy. |
1.4. Displaying metric data
You can use the following tools to display and analyze metric data:
- Grafana: An open source metric analytics and visualization suite. Grafana is most commonly used for visualizing time series data for infrastructure and application analytics.
- Red Hat CloudForms: An infrastructure management platform that IT departments use to control the self-service abilities of users to provision, manage, and ensure compliance across virtual machines and private clouds.
Additional resources
- For more information about Grafana, see Section 1.4.1, “Using and connecting Grafana to display data”.
- For more information about Red Hat Cloudforms, see the product documentation.
1.4.1. Using and connecting Grafana to display data
You can use third-party software, for example Grafana, to view a graphical representation of the metrics gathered and stored.
Grafana is an open source metric analytics, monitoring, and visualization suite. To install and configure Grafana, see the official Grafana documentation.