Este contenido no está disponible en el idioma seleccionado.
Chapter 27. Getting started with flamegraphs
As a system administrator, you can use flamegraphs to create visualizations of system performance data recorded with the perf tool. As a software developer, you can use flamegraphs to create visualizations of application performance data recorded with the perf tool.
Sampling stack traces is a common technique for profiling CPU performance with the perf tool. Unfortunately, the results of profiling stack traces with perf can be extremely verbose and labor-intensive to analyze. flamegraphs are visualizations created from data recorded with perf to make identifying hot code-paths faster and easier.
27.1. Installing flamegraphs
To begin using flamegraphs, install the required package.
Procedure
Install the
flamegraphspackage:dnf install js-d3-flame-graph
# dnf install js-d3-flame-graphCopy to Clipboard Copied! Toggle word wrap Toggle overflow
27.2. Creating flamegraphs over the entire system
This procedure describes how to visualize performance data recorded over an entire system using flamegraphs.
Prerequisites
-
flamegraphsare installed as described in installing flamegraphs. -
The
perftool is installed as described in installing perf.
Procedure
Record the data and create the visualization:
perf script flamegraph -a -F 99 sleep 60
# perf script flamegraph -a -F 99 sleep 60Copy to Clipboard Copied! Toggle word wrap Toggle overflow This command samples and records performance data over the entire system for 60 seconds, as stipulated by use of the
sleepcommand, and then constructs the visualization which will be stored in the current active directory asflamegraph.html. The command samples call-graph data by default and takes the same arguments as theperftool, in this particular case:-a- Stipulates to record data over the entire system.
-F- To set the sampling frequency per second.
Verification
For analysis, view the generated visualization:
xdg-open flamegraph.html
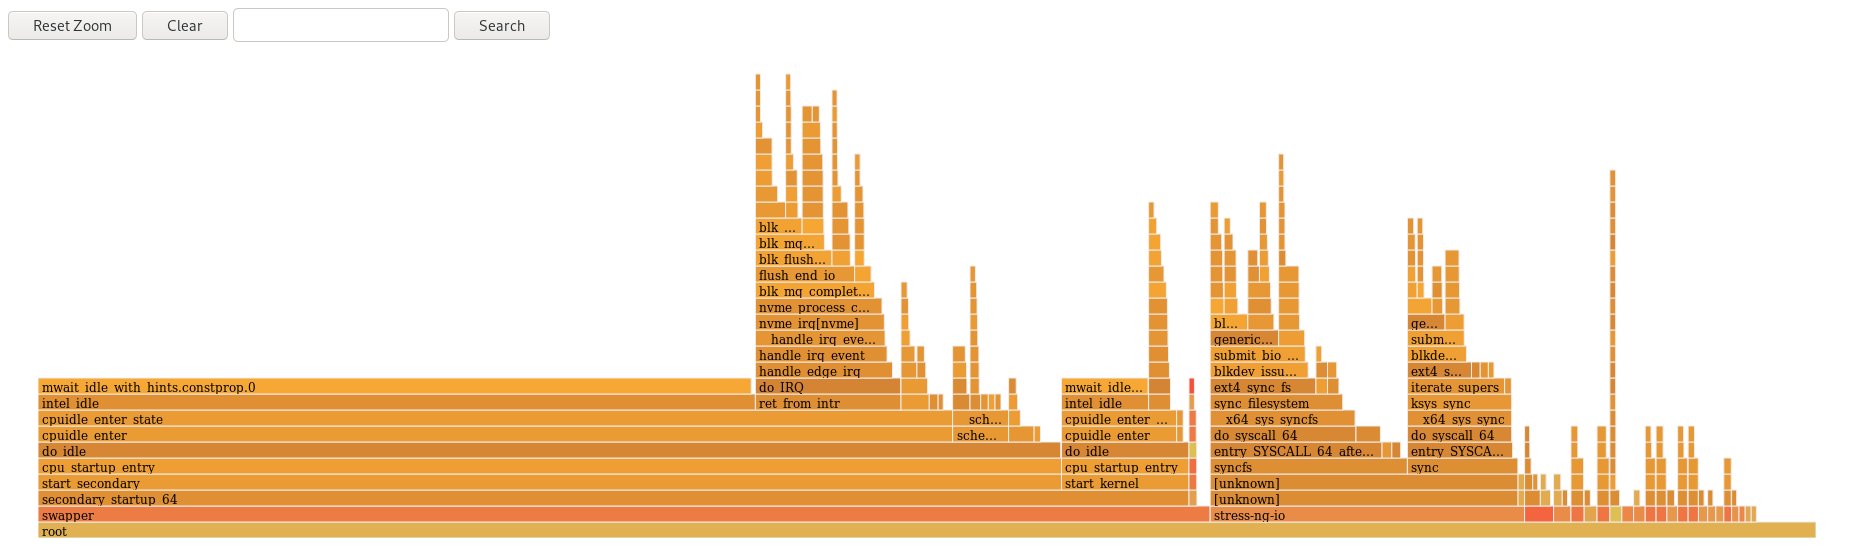
# xdg-open flamegraph.htmlCopy to Clipboard Copied! Toggle word wrap Toggle overflow This command opens the visualization in the default browser:
27.3. Creating flamegraphs over specific processes
You can use flamegraphs to visualize performance data recorded over specific running processes.
Prerequisites
-
flamegraphsare installed as described in installing flamegraphs. -
The
perftool is installed as described in installing perf.
Procedure
Record the data and create the visualization:
perf script flamegraph -a -F 99 -p ID1,ID2 sleep 60
# perf script flamegraph -a -F 99 -p ID1,ID2 sleep 60Copy to Clipboard Copied! Toggle word wrap Toggle overflow This command samples and records performance data of the processes with the process ID’s
ID1andID2for 60 seconds, as stipulated by use of thesleepcommand, and then constructs the visualization which will be stored in the current active directory asflamegraph.html. The command samples call-graph data by default and takes the same arguments as theperftool, in this particular case:-a- Stipulates to record data over the entire system.
-F- To set the sampling frequency per second.
-p- To stipulate specific process ID’s to sample and record data over.
Verification
For analysis, view the generated visualization:
xdg-open flamegraph.html
# xdg-open flamegraph.htmlCopy to Clipboard Copied! Toggle word wrap Toggle overflow This command opens the visualization in the default browser:
27.4. Interpreting flamegraphs
Each box in the flamegraph represents a different function in the stack. The y-axis shows the depth of the stack with the topmost box in each stack being the function that was actually on-CPU and everything below it being ancestry. The x-axis displays the population of the sampled call-graph data.
The children of a stack in a given row are displayed based on the number of samples taken of each respective function in descending order along the x-axis; the x-axis does not represent the passing of time. The wider an individual box is, the more frequent it was on-CPU or part of an on-CPU ancestry at the time the data was being sampled.
Procedure
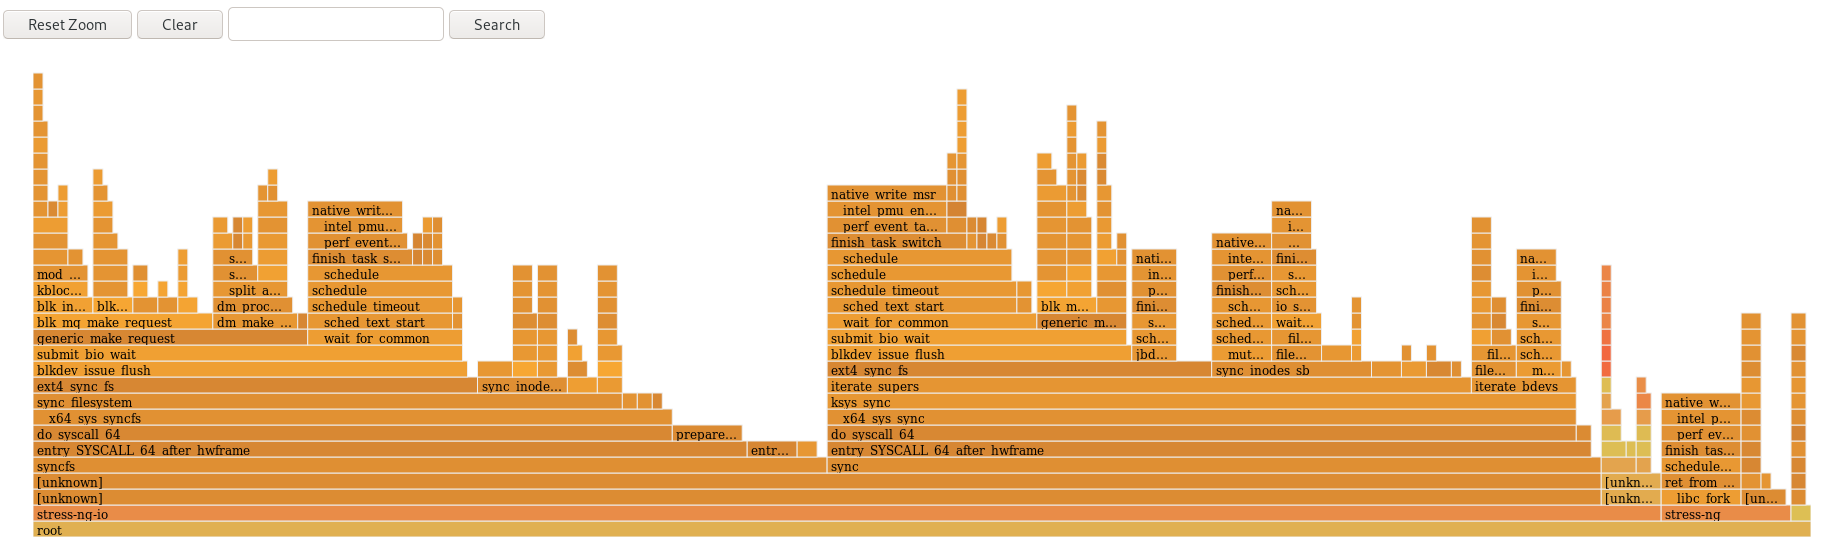
To reveal the names of functions which may have not been displayed previously and further investigate the data click on a box within the flamegraph to zoom into the stack at that given location:

- To return to the default view of the flamegraph, click .
Boxes representing user-space functions may be labeled as Unknown in flamegraphs because the binary of the function is stripped. The debuginfo package of the executable must be installed or, if the executable is a locally developed application, the application must be compiled with debugging information. Use the -g option in GCC, to display the function names or symbols in such a situation.