Este contenido no está disponible en el idioma seleccionado.
Chapter 7. Using Prometheus and Grafana to monitor the router network
Prometheus is container-native software built for storing historical data and for monitoring large, scalable systems such as AMQ Interconnect. It gathers data over an extended time, rather than just for the currently running session.
You use Prometheus and Alertmanager to monitor and store AMQ Interconnect data so that you can use a graphical tool, such as Grafana, to visualize and run queries on the data.
7.1. Setting up Prometheus and Grafana
Before you can view AMQ Interconnect dashboards, you must deploy and configure Prometheus, Alertmanager, and Grafana in the OpenShift project in which AMQ Interconnect is deployed. All of the required configuration files are provided in a GitHub repository.
Procedure
Clone the
qdr-monitoringGitHub repository.This repository contains the configuration files needed to set up Prometheus and Grafana to monitor AMQ Interconnect.
git clone https://github.com/interconnectedcloud/qdr-monitoring
$ git clone https://github.com/interconnectedcloud/qdr-monitoringCopy to Clipboard Copied! Toggle word wrap Toggle overflow Open the
deploy-monitoring.shscript and set theNAMESPACEvariable.Set
NAMESPACEto be the name of the project into which you have deployed AMQ Interconnect.Change the namespace to that of your project
#!/bin/bash

# Change the namespace to that of your project
NAMESPACE=myproject
...
Copy to Clipboard Copied! Toggle word wrap Toggle overflow Run the
deploy-monitoring.shscript.This script creates and configures the OpenShift resources needed to deploy Prometheus, Alertmanager, and Grafana in your OpenShift project. It also configures two dashboards that provide metrics for the router network.
./deploy-monitoring.sh
$ ./deploy-monitoring.shCopy to Clipboard Copied! Toggle word wrap Toggle overflow Create a Route for the prometheus, alertmanager, and grafana Services.
oc expose service prometheus
oc expose service alertmanager
oc expose service grafana
$ oc expose service prometheus

$ oc expose service alertmanager

$ oc expose service grafana
Copy to Clipboard Copied! Toggle word wrap Toggle overflow
Additional resources
- For more information about Prometheus, see the Prometheus documentation.
- For more information about Grafana, see the Grafana documentation.
7.2. Viewing AMQ Interconnect dashboards in Grafana
After setting up Prometheus and Grafana, you can visualize the AMQ Interconnect data on the following Grafana dashboards:
- Qpid Dispatch Router
Shows metrics for:
-
Deliveries ingress -
Deliveries egress -
Deliveries ingress route container -
Deliveries egress route container -
Deliveries redirected to fallback destination -
Dropped presettled deliveries -
Presettled deliveries -
Auto links -
Link routes -
Address count -
Connection count -
Link count
-
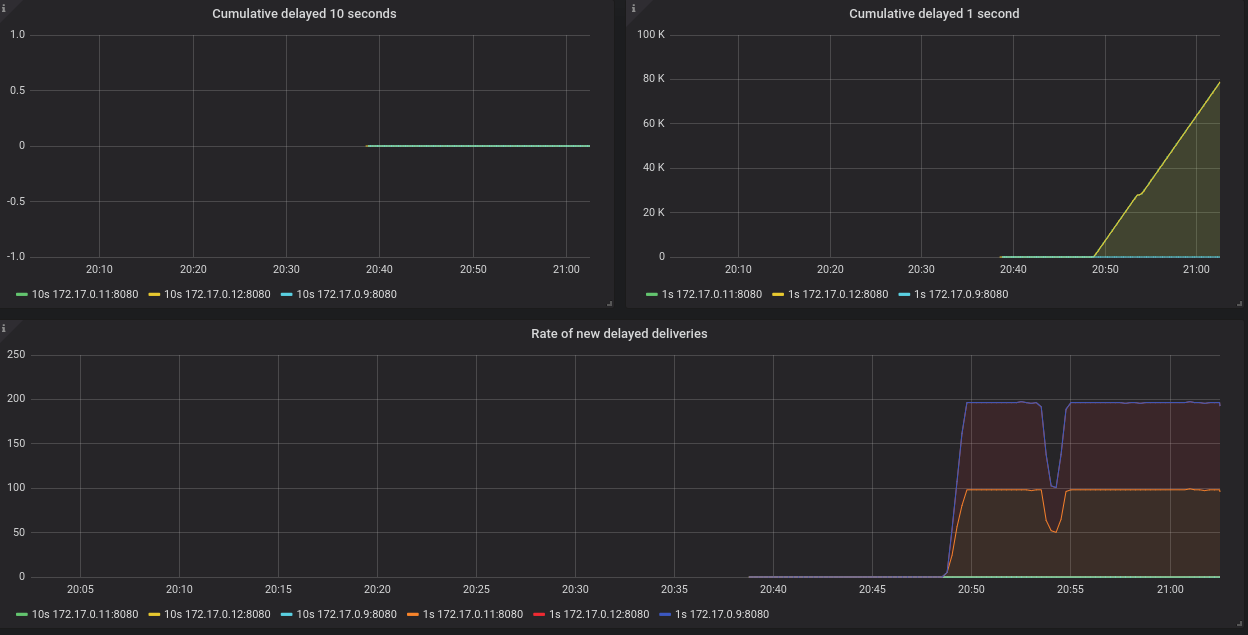
- Qpid Dispatch Router - Delayed Deliveries
Shows metrics for:
-
Cumulative delayed 10 seconds -
Cumulative delayed 1 second -
Rate of new delayed deliveries
-
Procedure
In the OpenShift web console, switch to
, and click the URL for the grafanaRoute.The Grafana Log In page appears.
Enter your user name and password, and then click .
The default Grafana user name and password are both
admin. After logging in for the first time, you can change the password.On the top header, click the dashboard drop-down menu, and then select the
Qpid Dispatch RouterorQpid Dispatch Router - Delayed Deliveriesdashboard.Figure 7.1. Delayed Deliveries dashboard