Este contenido no está disponible en el idioma seleccionado.
Chapter 4. Integrated applications
Cryostat integrates with specific applications that can enhance how you analyze data from your JFR recording.
4.1. Viewing a JFR recording on Grafana
Cryostat 2.4 integrates with the Grafana application, so you can plot JFR recording data in Grafana. You can view plot data in time interval sections to precisely analyze the performance of your target JVM application.
Prerequisites
- Entered your authentication details for your Cryostat instance.
- Created a JFR recording. See Creating a JDK Flight Recorder (JFR) recording (Creating a JFR recording with Cryostat).
Procedure
- Go to the Recordings menu or the Archives menu on your Cryostat instance.
- Depending on your needs, click either the Active Recordings tab or the Archived Recordings tab.
Locate your JFR recording and then select the overflow menu.
Figure 4.1. Overflow menu items available for an example JFR recording
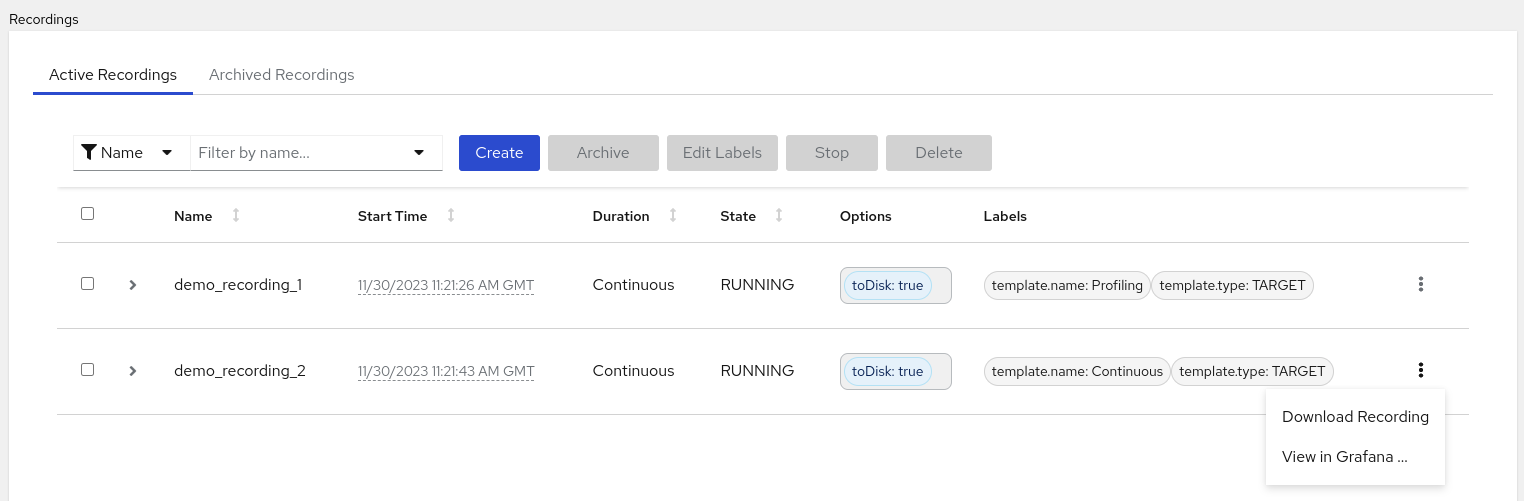
- From the overflow menu, click the View in Grafana option. The Grafana application opens in a new web browser window.
- Click the sign-in icon on the Grafana dashboard.
Determine your credentials by issuing the following commands in your terminal.
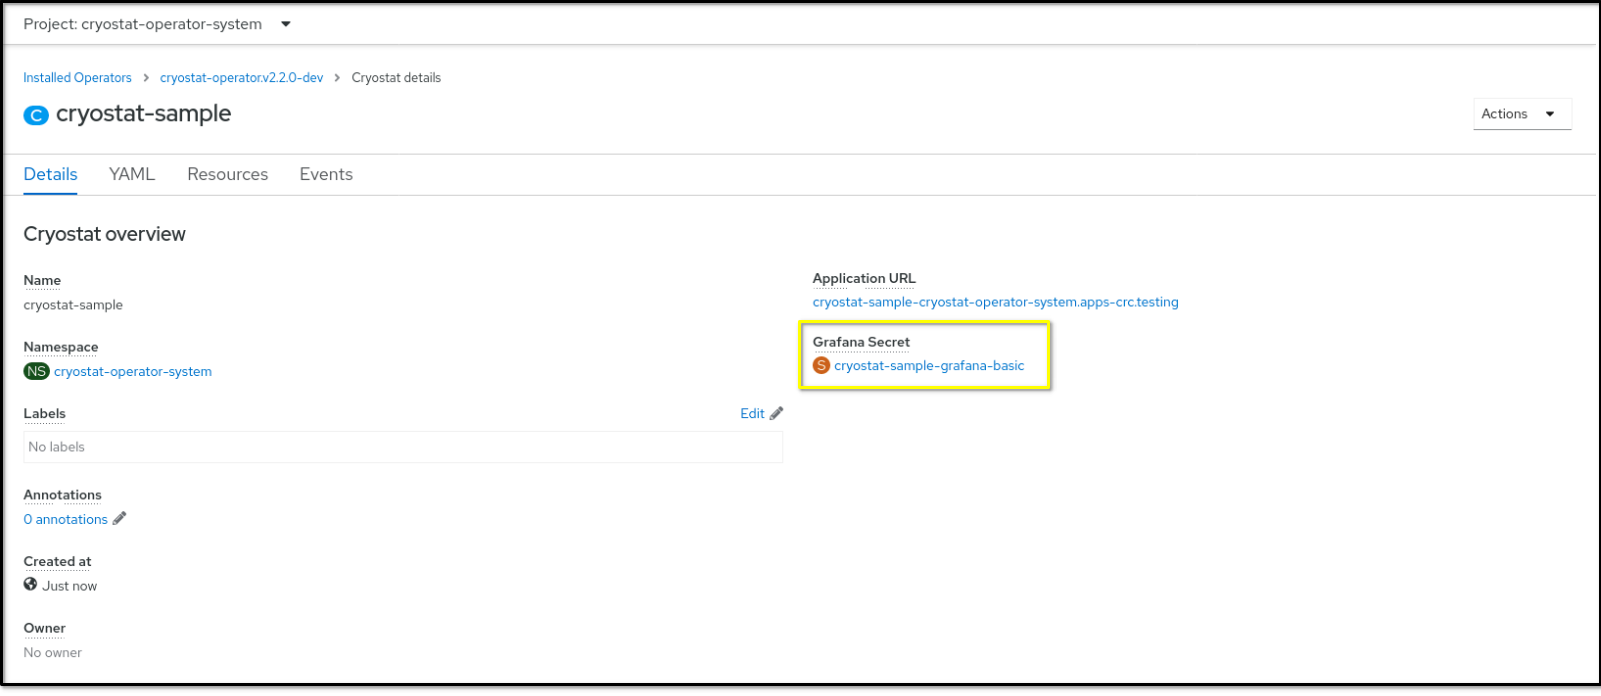
<cryostat_name>=$(kubectl get cryostat -o jsonpath='{$.items[0].metadata.name}')

oc get secret $<cryostat_name>-grafana-basic -o jsonpath='{$.data.GF_SECURITY_ADMIN_USER}' | base64 -d

oc get secret $<cryostat_name>-grafana-basic -o jsonpath='{$.data.GF_SECURITY_ADMIN_PASSWORD}' | base64 -d
You can also locate your credentials from the Grafana Secret custom resource (CR) on the Cryostat details page on Red Hat OpenShift.
Figure 4.2. The Grafana Secret CR on the Cryostat details page on OpenShift
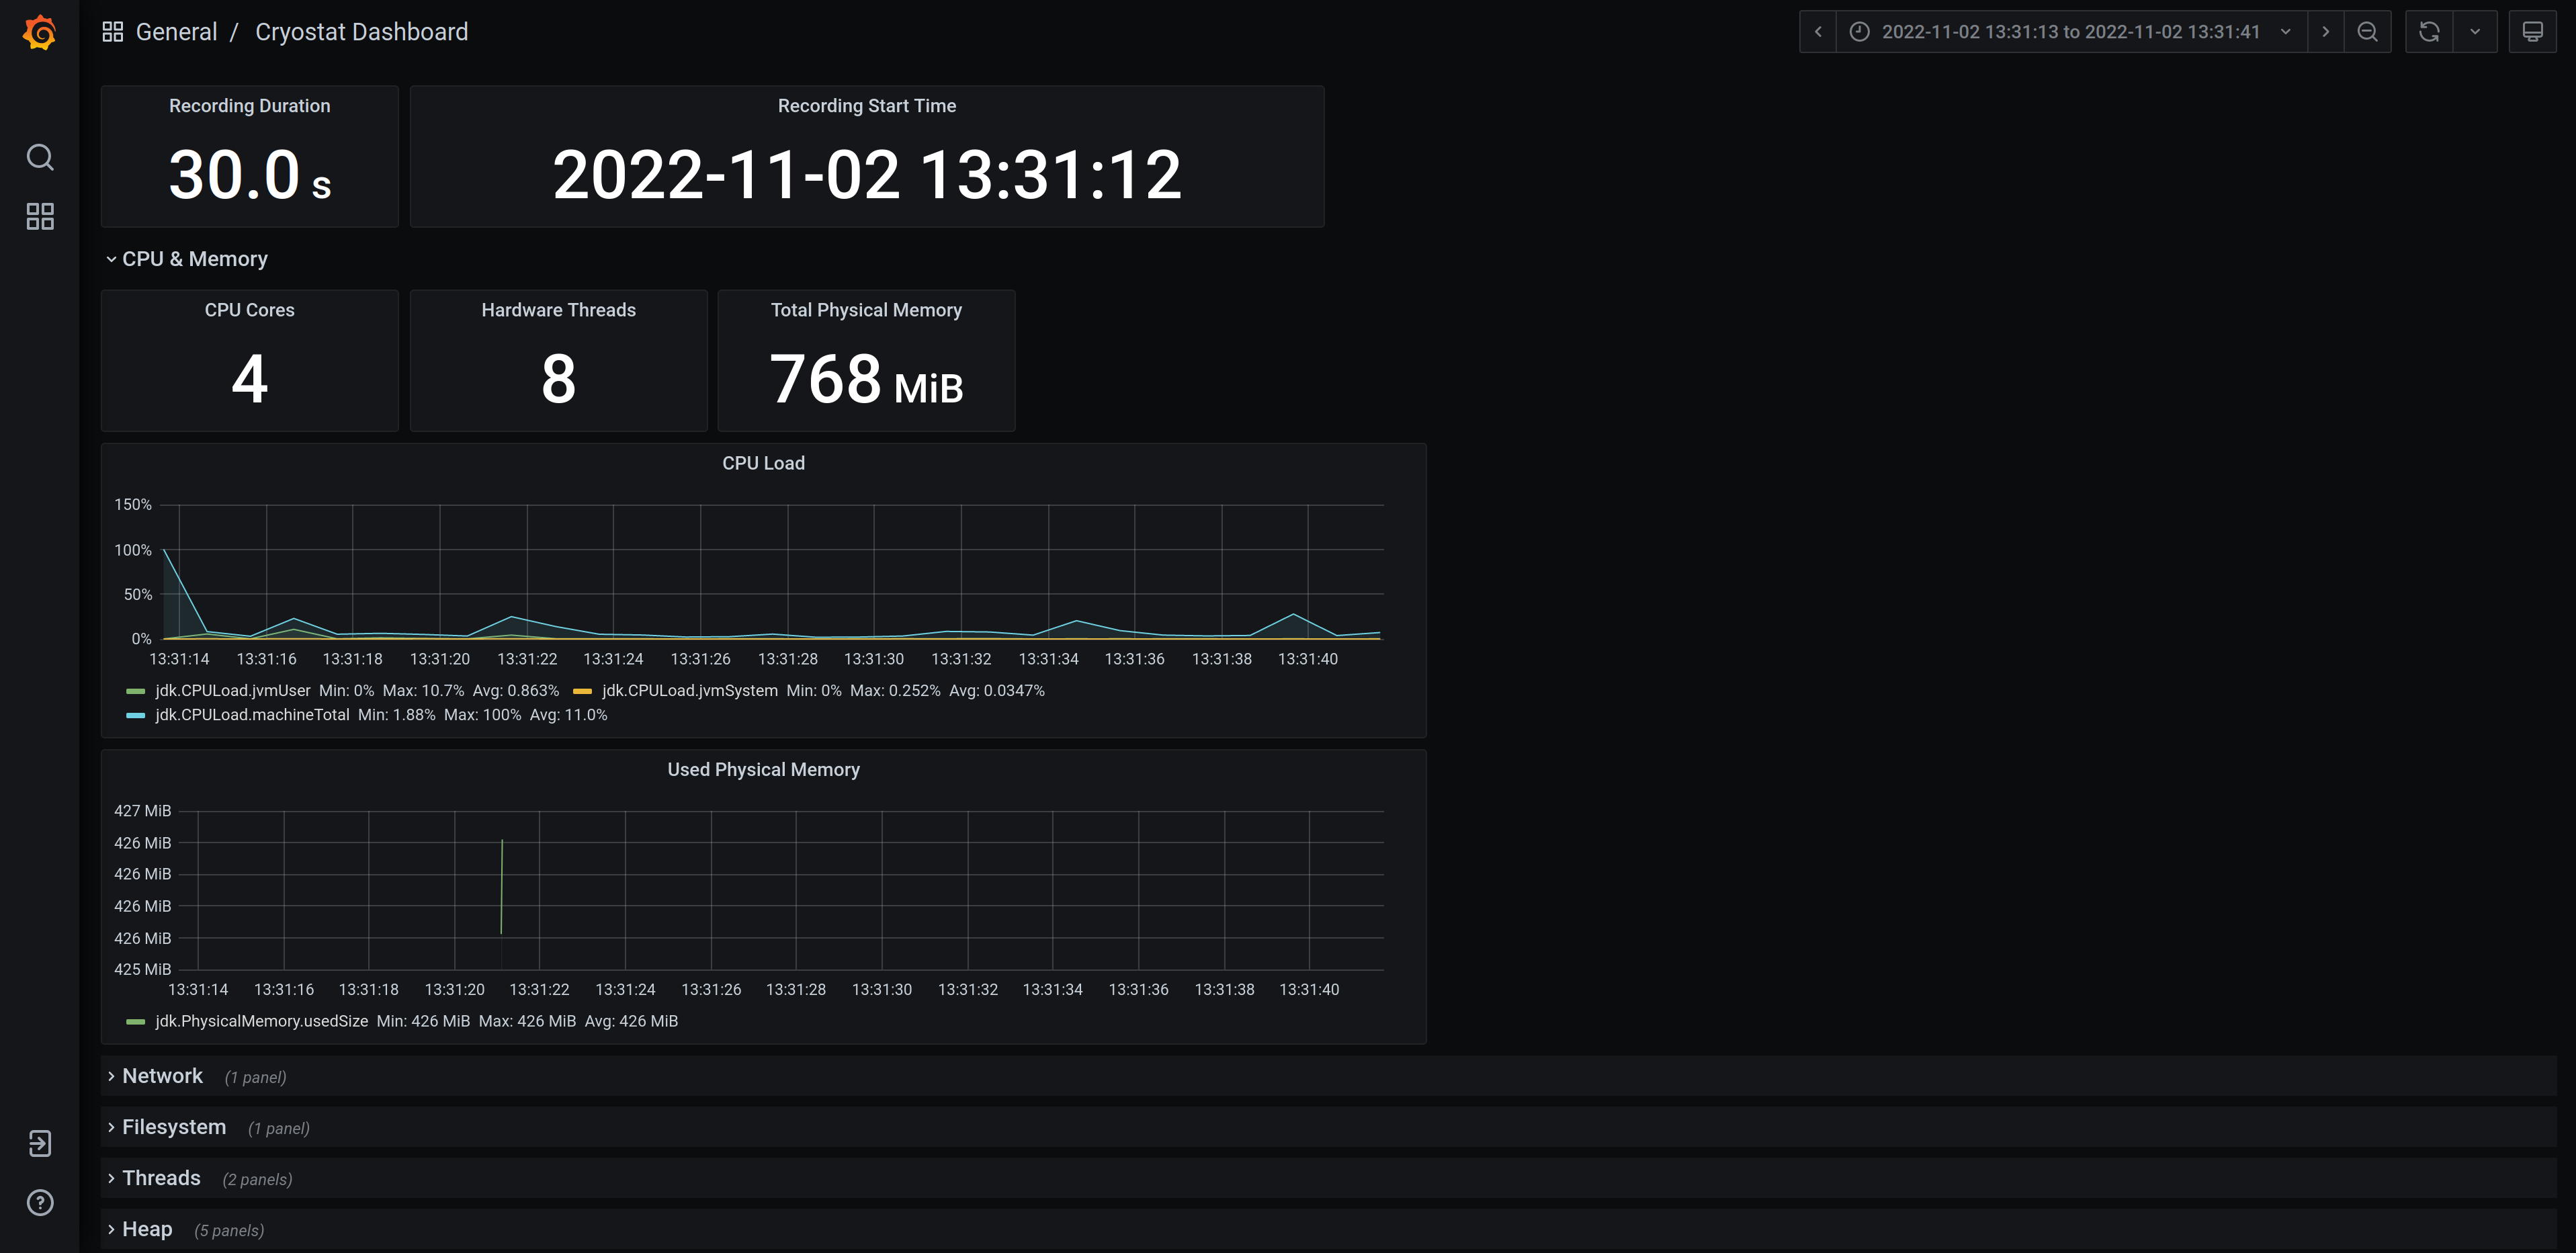
- Enter your credentials in the Grafana web console login page. A dashboard window opens and shows your JFR recording’s data in various time-series plots.
Optional: Interact with any plot by selecting a time-series segment on the plot. Grafana expands the on-screen data to show only the data for that time interval.
Figure 4.3. Example of a Grafana dashboard with plotted graphs
Revised on 2023-12-12 17:53:25 UTC