Este contenido no está disponible en el idioma seleccionado.
Chapter 4. Tracing CodeReady Workspaces
Tracing helps gather timing data to troubleshoot latency problems in microservice architectures and helps to understand a complete transaction or workflow as it propagates through a distributed system. Every transaction may reflect performance anomalies in an early phase when new services are being introduced by independent teams.
Tracing the CodeReady Workspaces application may help analyse the execution of various operations, such as workspace creations, workspace startup, breaking down the duration of sub-operations executions, helping finding bottlenecks and improve the overall state of the platform.
Tracers live in applications. They record timing and metadata about operations that take place. They often instrument libraries, so that their use is transparent to users. For example, an instrumented web server records when it received a request and when it sent a response. The trace data collected is called a span. A span has a context that contains information such as trace and span identifiers and other kinds of data that can be propagated down the line.
4.1. Tracing API
CodeReady Workspaces utilizes Opentracing API - a vendor-neutral framework for instrumentation. This means that if a developer wants to try a different tracing backend, then instead of repeating the whole instrumentation process for the new distributed tracing system, the developer can simply change the configuration of the tracer backend.
4.2. Tracing backend
By default, CodeReady Workspaces uses Jaeger as the tracing backend. Jaeger was inspired by Dapper and OpenZipkin, and it is a distributed tracing system released as open source by Uber Technologies. Jaeger extends a more complex architecture for a larger scale of requests and performance.
4.3. Enabling CodeReady Workspaces metrics collections
Prerequisites
- Installed Jaeger v1.12.0 or above. See instructions at Get up and running with Jaeger in your local environment.
Procedure
Enable the following environment variables for CodeReady Workspaces deployment:
# Activating {prod-short} tracing modules
CHE_TRACING_ENABLED=true

# Following variables are the basic Jaeger client library configuration.
JAEGER_ENDPOINT="http://jaeger-collector:14268/api/traces"

# Service name
JAEGER_SERVICE_NAME="che-server"

# URL to remote sampler
JAEGER_SAMPLER_MANAGER_HOST_PORT="jaeger:5778"

# Type and param of sampler (constant sampler for all traces)
JAEGER_SAMPLER_TYPE="const"
JAEGER_SAMPLER_PARAM="1"

# Maximum queue size of reporter
JAEGER_REPORTER_MAX_QUEUE_SIZE="10000"
Additional resources
- List of all Jaeger client environment variables
4.4. Viewing CodeReady Workspaces traces in Jaeger UI
This section demonstrates how to utilize the Jaeger UI to overview traces of CodeReady Workspaces operations.
Procedure
In this example, the CodeReady Workspaces instance has been running for some time and one workspace start has occured.
To inspect the trace of the workspace start:
In the Search panel on the left, filter spans by the operation name (span name), tags, or time and duration.
Figure 4.1. Using Jaeger UI to trace CodeReady Workspaces
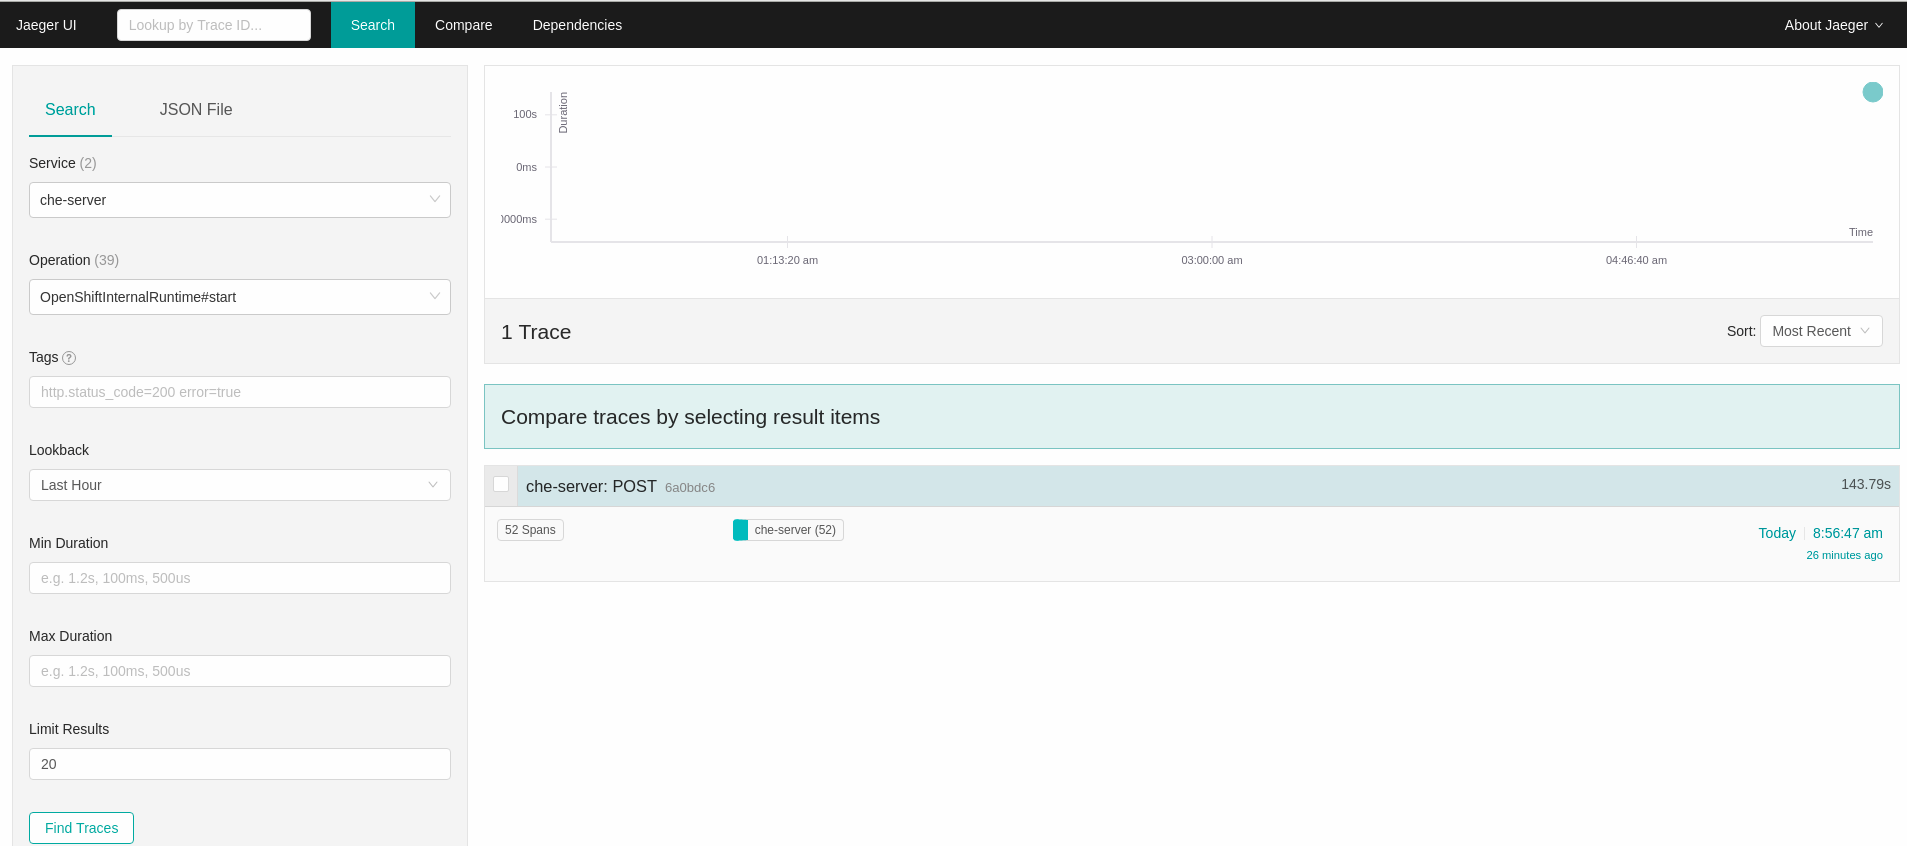
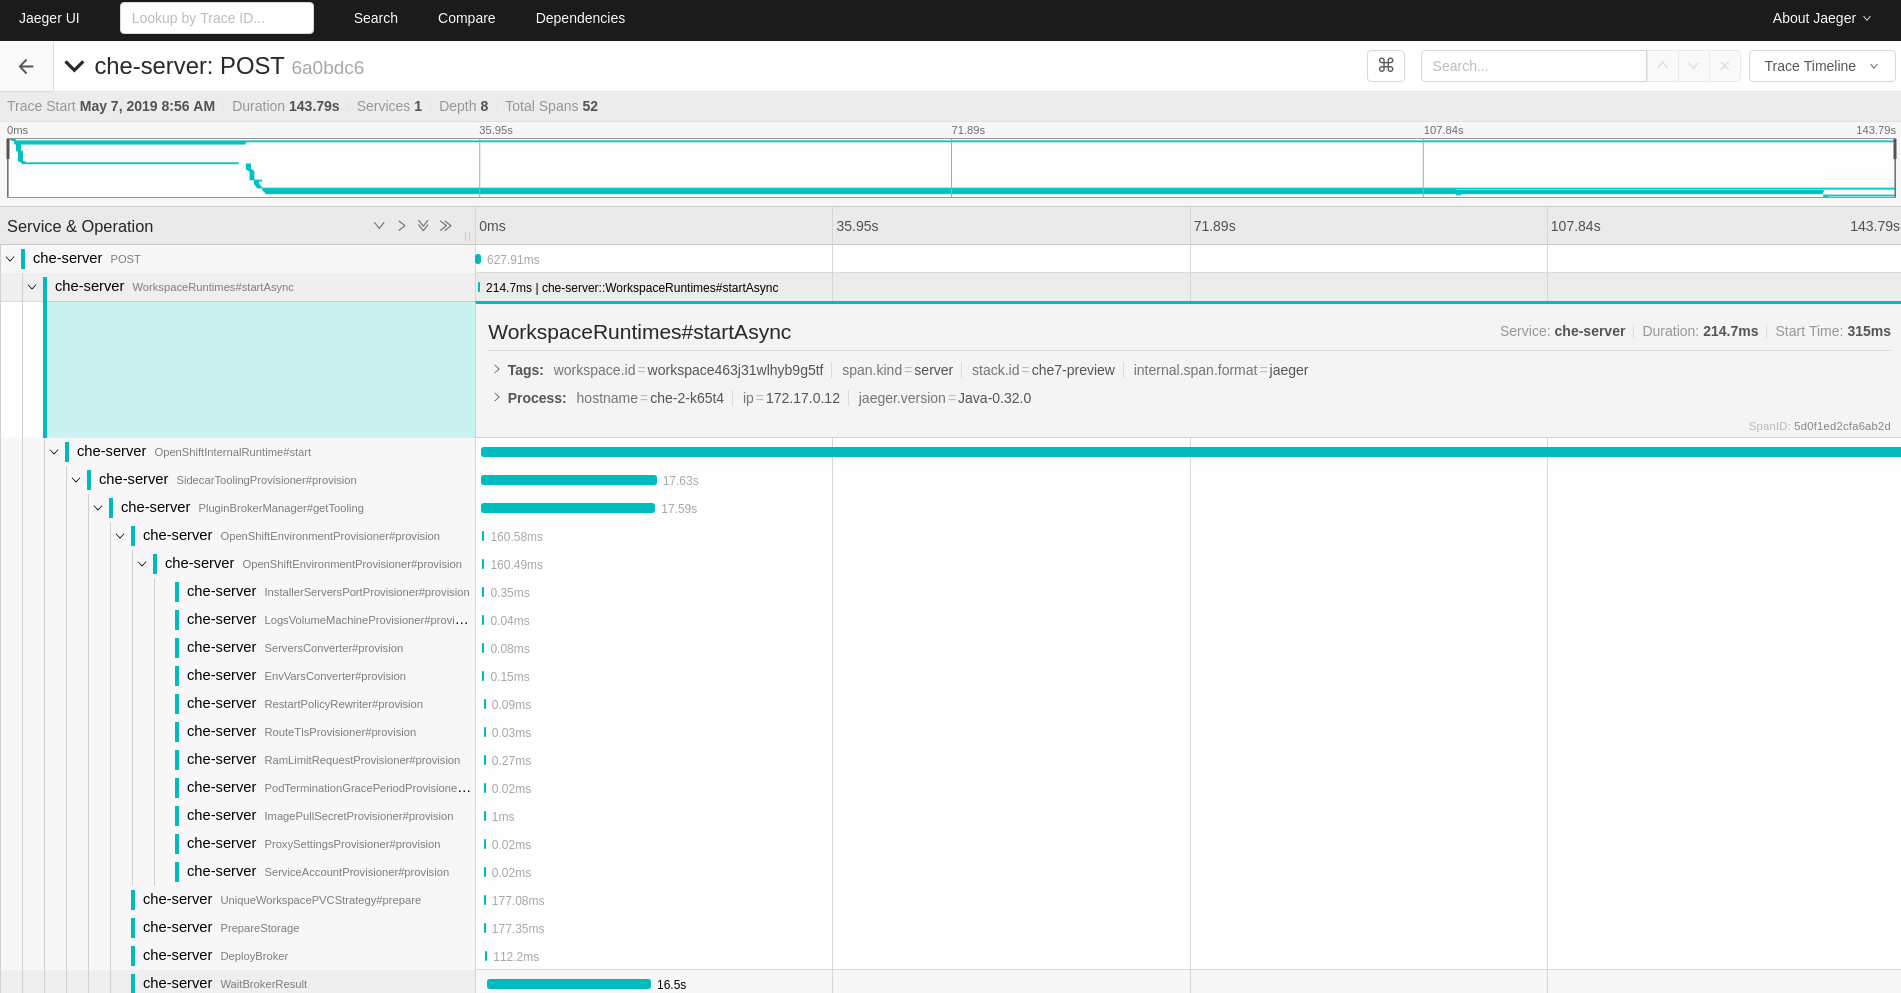
Select the trace to expand it and show the tree of nested spans, as well as additional information about the highlighted span, such as tags or durations.
Figure 4.2. Expanded tracing tree
4.5. CodeReady Workspaces tracing codebase overview and extension guide
The core of the tracing implementation for CodeReady Workspaces is in the che-core-tracing-core and che-core-tracing-web modules.
All HTTP requests to the tracing API have their own trace. This is done by TracingFilter from the OpenTracing library, which is bound for the whole server application. Adding a @Traced annotation to methods causes the TracingInterceptor to add tracing spans for them.
4.5.1. Tagging
Spans may contain standard tags, such as operation name, span origin, error, as well as others that may help users with querying and filtering spans. Workspace-related operations (such as starting or stopping workspaces) have additional tags, including userId, workspaceId, and stackId. Spans created by TracingFilter also have an HTTP status code tag.
Declaring tags in a traced method is done statically by setting fields from the TracingTags class:
TracingTags.WORKSPACE_ID.set(workspace.getId());
TracingTags is a class where all commonly used tags are declared, as respective AnnotationAware tag implementations.
Additional resources
For more information about how to use Jaeger UI, visit Jaeger documentation: Jaeger Getting Started Guide.